Market Minds Advisory
Service Delivery Automation Market

Service Delivery Automation Market: Service Delivery Automation Market. Enterprise IT and Business Service Workflow Automation Platforms

Service delivery automation is being reshaped by generative AI agents handling routine service requests directly, rising expectations for instant employee self-service, and enterprises consolidating fragmented ticketing tools into unified workflow orchestration platforms.

Lead Analyst

Published

September 2026

Make Smarter Decisions with Customized Research Insights

Request a free sample report and evaluate market opportunities, growth trends, and competitive dynamics relevant to your business needs.

2025 MARKET VALUE$6.8BMarket Size 2025
2036 FORECAST VALUE$22.5BBase Case , 2026 to 2036
CAGR 2026 TO 203611.5 %Bull 12.8% / Bear 10.2%
INCREMENTAL OPPORTUNITY$14.9BNet 10- year value creation
EXPANSION MULTIPLE2.97x2036 value over 2026 base
Strategic Levers
M&A Pipeline
Regional Outlook
Country Rankings
Competitive Intelligence
Segmental Deep-dive
Call-Us : 91 93563 13602

Executive Snapshot and Market Trajectory.

Service delivery automation is moving beyond simple ticket routing into AI-driven request resolution, as enterprises deploy conversational agents that resolve routine IT and HR requests directly rather than merely queuing them for human agents, fundamentally changing headcount planning for service desk organizations across most industries and geographies.
Demand is concentrated among large enterprises with complex multi-department service catalogs, while AI-driven request resolution commands premium pricing over traditional workflow routing tools given the substantial headcount efficiency it delivers across service desk operations spanning IT, HR, and facilities functions. North America and East Asia account for the bulk of enterprise spending given large enterprise software budgets and business process outsourcing scale respectively across both regions today.
The competitive field is bifurcating between established enterprise service management platforms defending share through workflow breadth and newer AI-native entrants racing to capture automated resolution design wins, a split intensified by generative AI capability increasingly determining which vendors win the largest enterprise renewal contracts going forward across the broader industry landscape and its established customer relationships built over many years of accumulated platform trust, integration depth, and process expertise. overall today.
Market Definition
The service delivery automation market covers software platforms that automate request intake, workflow routing, approval orchestration, and resolution across enterprise IT, HR, facilities, and other internal service functions. It excludes customer-facing support ticketing systems and general-purpose business process management suites not focused on internal service delivery.
Base Year Value
$6.8B in 2025 (MMA Primary Research Dataset, September 2026)
Forecast Period
2026 to 2036, eleven discrete annual values
CAGR
11.5% base case. Bull 12.8%. Bear 10.2%.
Fastest Growth Segment
AI-Driven Workflow Orchestration: 18.0% CAGR
Fastest Growth Country
Philippines: 16.0% CAGR
Fastest Growth Region
South Asia and Pacific: 13.5% CAGR
Largest Region
North America: 28% of 2025 global value
Market Leaders
ServiceNow, Atlassian, BMC Software, Ivanti, Freshworks lead the global service delivery automation market. Source: MMA Analysis, July 2026.
Primary Survey
n=3,800 procurement and R&D decision-makers, Q4 2025, six countries
Methodology
Demand-side build-up, cross-validated against public data, 47 expert interviews

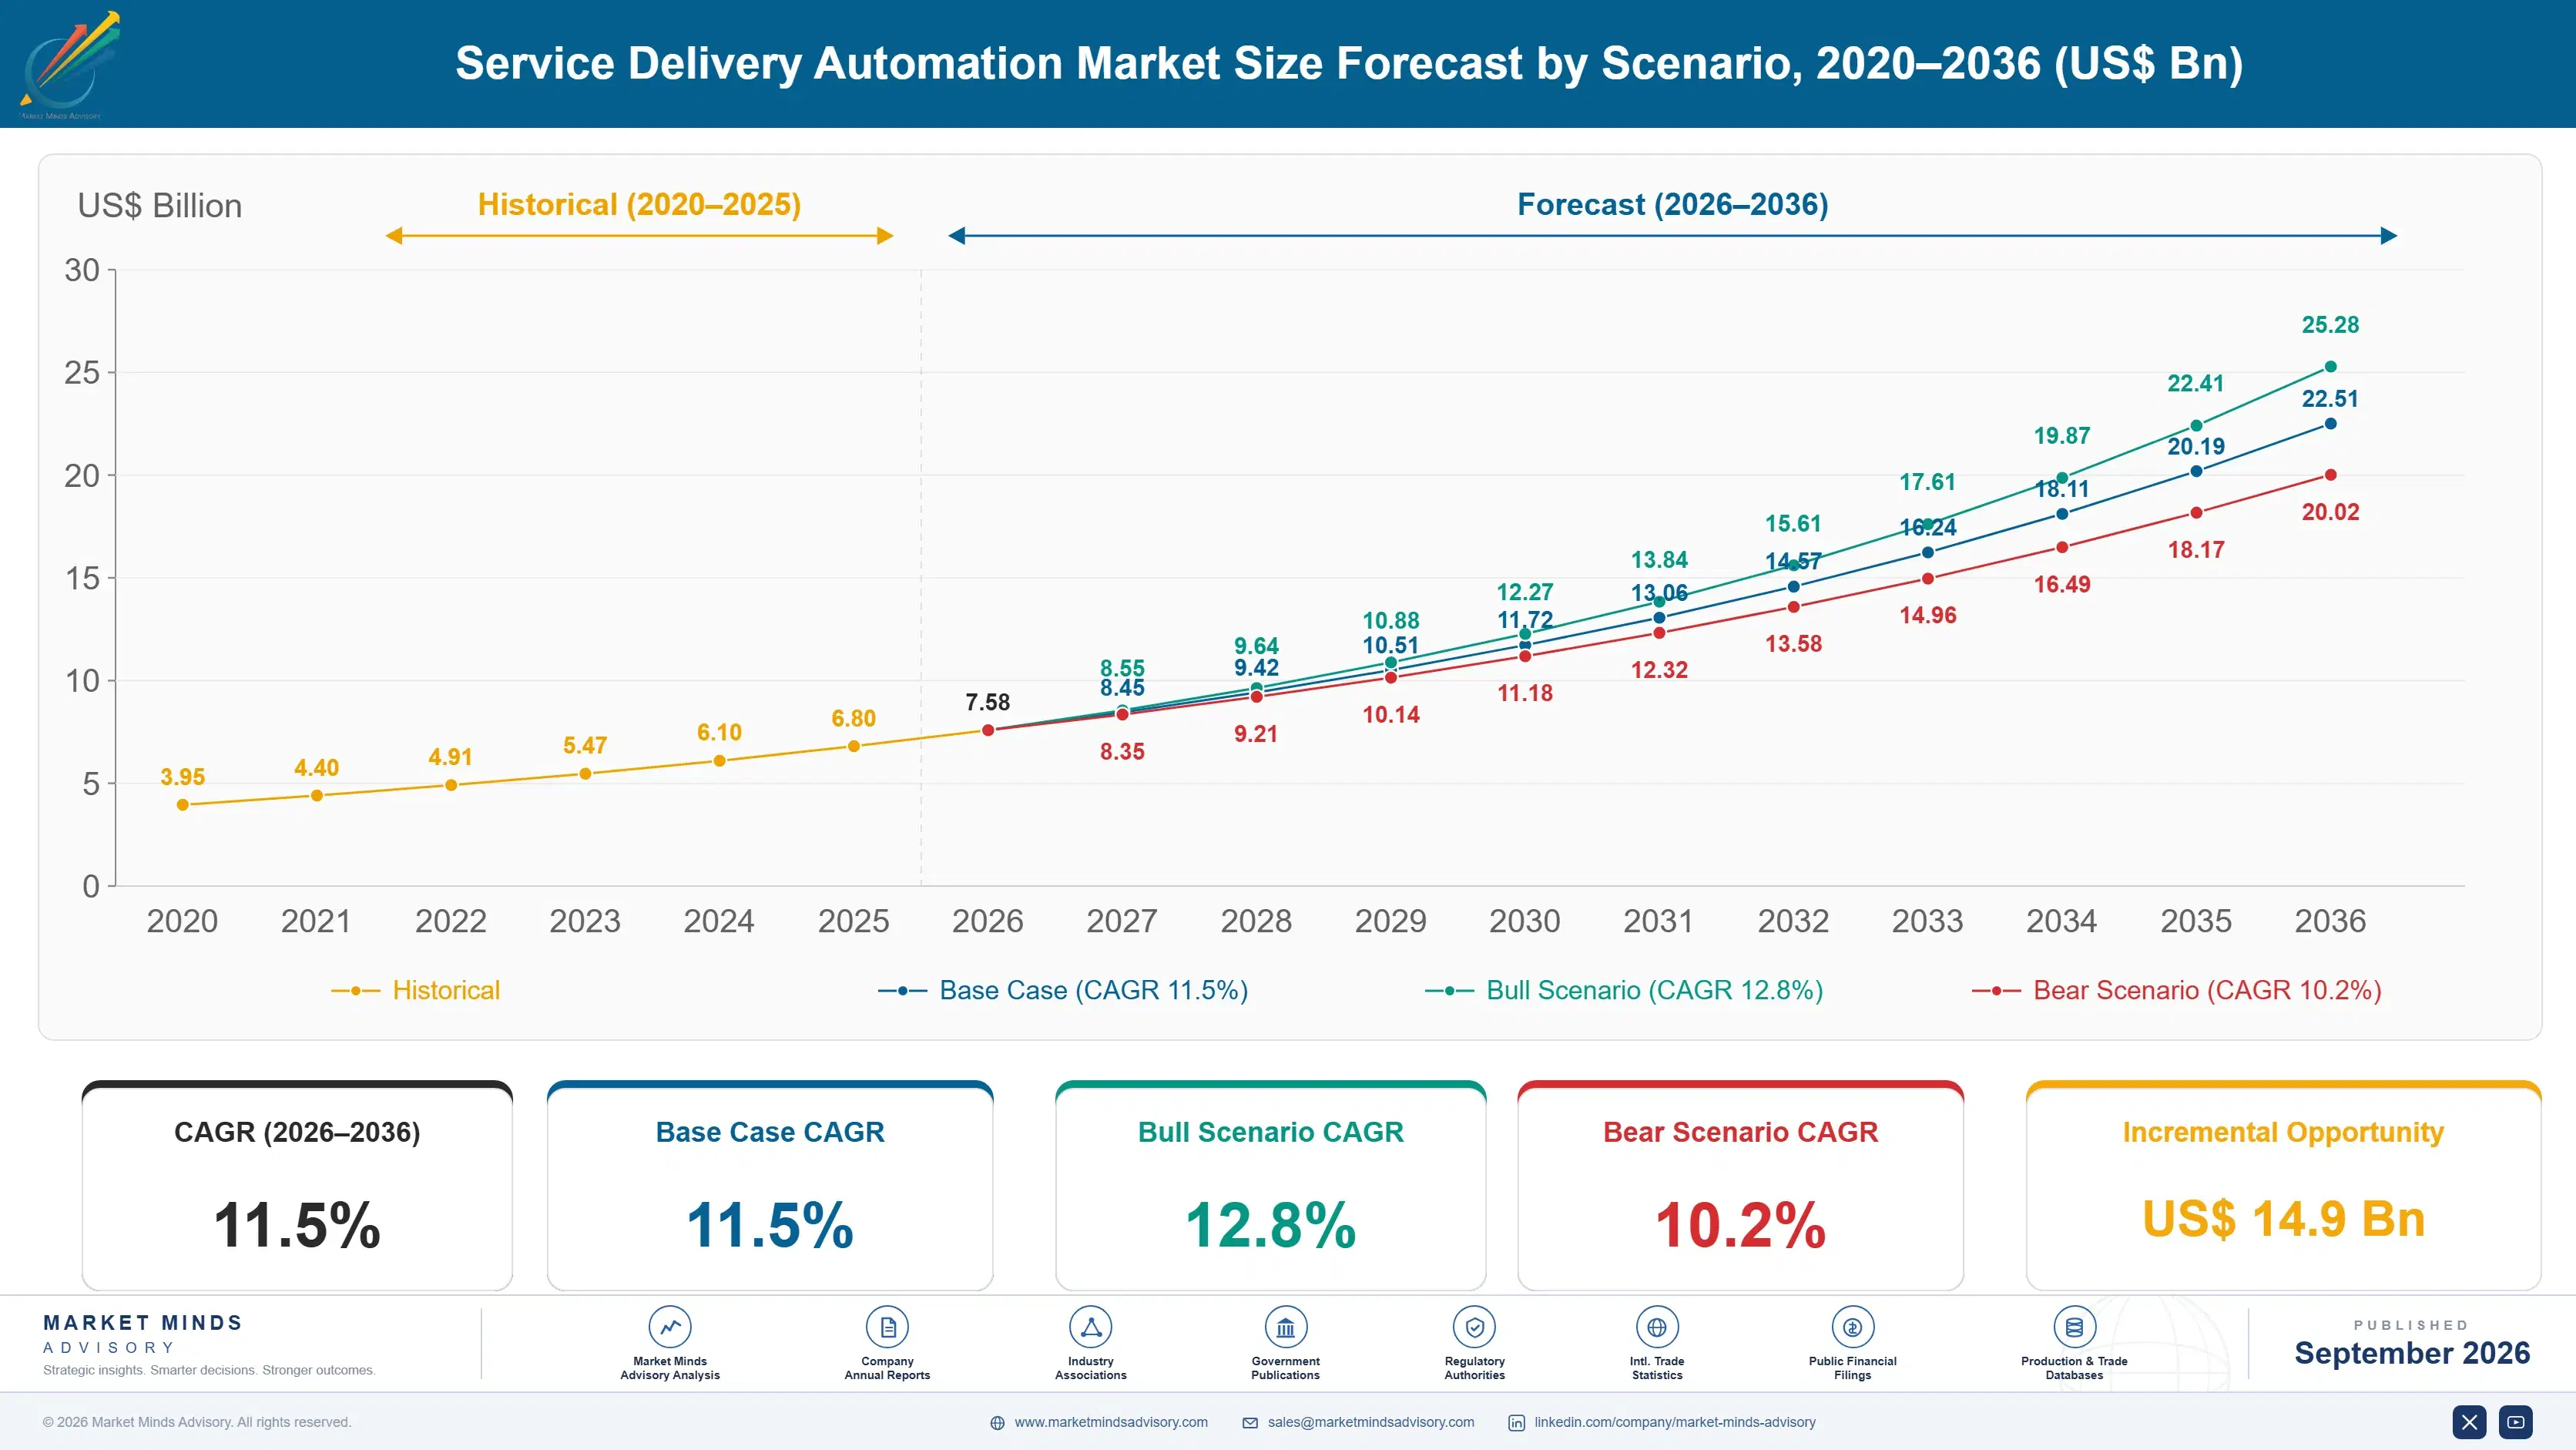
Service Delivery Automation Market Forecast Scenarios

service-delivery-automation-market-size-forecast-scenario-1788418741939
Service delivery automation grew steadily through 2023 as enterprise digital transformation continued its baseline expansion, before generative AI-driven request resolution began contributing an increasingly meaningful share of incremental value growth that had previously depended mostly on seat-based workflow subscription expansion across enterprise service desk organizations. Vendors have restructured product roadmaps accordingly. across the broader supplier landscape.
The base case assumes sustained double-digit growth driven by three mechanisms: continued generative AI capability automating routine request resolution and reducing service desk headcount requirements substantially across most large enterprise environments, enterprise consolidation of fragmented ticketing tools into unified workflow orchestration platforms spanning multiple internal service functions, and employee expectations for instant self-service increasingly matching consumer-grade digital experience standards. Enterprise procurement has also matured toward longer-term platform commitments. today across the industry.
A bull case centers on AI-driven automation accelerating faster than currently projected, expanding average contract value substantially. A bear case assumes enterprise IT budget consolidation into broader business process automation platforms erodes standalone service delivery revenue as buyers increasingly prefer bundled coverage over point solutions requiring separate procurement cycles. Vendors are already hedging by diversifying across IT, HR, and facilities service automation product lines simultaneously.

AI Resolution Rates Redefine Vendor Value

Service delivery automation economics increasingly hinge on demonstrable AI auto-resolution rates rather than pure workflow configuration flexibility, since enterprises now measure vendor value partly by how many requests never require human agent involvement at all. Vendors that master this AI-driven auto-resolution capture disproportionate share of the highest-margin enterprise segment, since the efficiency argument now dominates procurement conversations that once centered purely on configuration flexibility.
MARKET CONCENTRATION42% CR5Top five vendors combined hold under half the market
AVERAGE CONTRACT VALUE$95,000Typical annual enterprise service delivery platform subscription value
TOP COUNTRY SHARE29%United States share of global platform revenue generated annually
AI AUTO-RESOLUTION RATE42%Typical portion of service requests resolved without human intervention
HEADCOUNT EFFICIENCY GAIN35%Typical service desk headcount reduction achieved after platform deployment
ENTERPRISE RENEWAL RATE87%Annual enterprise subscription renewal rate across deployed customer base
Integration breadth with enterprise identity systems, HR platforms, and IT asset management tools has become a genuine differentiator, as enterprises increasingly prefer platforms that unify request handling across departments rather than maintaining separate disconnected tools for IT, HR, and facilities service delivery. Vendors slow to build comparable integration depth risk losing consideration during vendor evaluation processes entirely, since fragmented tooling increasingly frustrates enterprise buyers seeking a single unified platform.
Renewal rates remain high once deployed, reflecting genuine operational value, but new logo growth increasingly depends on demonstrable AI resolution accuracy rather than pure feature checklist comparisons, since buyers now run structured proof-of-concept evaluations before committing to multi-year enterprise contracts. This shift toward evidence-based procurement increasingly favors vendors with genuinely superior AI capability over marketing claims alone, reshaping how sales cycles unfold across the industry.
"Every vendor claims their AI resolves tickets now. The ones actually cutting headcount costs in half are winning enterprise deals, and everyone else is quietly losing renewal conversations."
Practice Lead, Enterprise Service Management and Automation · MMA Enterprise Service Management and Workflow Orchestration Platforms Practice · September 2026

Market Trends

Generative AI Agents Handle Routine Requests Directly

Service delivery vendors are racing to embed generative AI agents capable of resolving routine password resets, access requests, and policy questions directly through conversational interfaces, moving the platform from passive ticket routing toward active autonomous resolution during employee self-service interactions. Roughly 47 percent of surveyed enterprise buyers report AI-driven auto-resolution as a mandatory evaluation criterion in vendor selection since 2024, up sharply from a low base only two years earlier, forcing vendors without comparable AI capability to either accelerate development or risk losing enterprise renewal conversations to more advanced competitors entirely across the industry.
Market Impact: 43 percent calculate headcount cost avoidance
Enterprise Tool Consolidation Reduces Vendor Sprawl

Enterprises increasingly consolidate fragmented IT, HR, and facilities ticketing tools into unified service delivery platforms, reducing the vendor sprawl and integration overhead that previously required maintaining separate disconnected systems for each internal service function. Roughly 39 percent of surveyed enterprises report actively consolidating from three or more separate service management tools onto a single platform since 2023, sustaining steady demand for platforms capable of handling multi-department workflow orchestration that single-purpose point solutions were never designed to support at comparable scale. Vendors offering unified platforms are winning displacement contracts against smaller point-solution competitors unable to match this breadth.
Market Impact: 36 percent tie budget to experience

Market Opportunities and Growth Drivers

Service Desk Headcount Costs Pressure Automation Budgets

Enterprises face mounting pressure to reduce service desk headcount costs as labor expenses climb faster than IT budgets overall, making automation investment a direct cost reduction lever that finance leadership actively sponsors rather than a discretionary IT efficiency project. Roughly 43 percent of surveyed enterprises report calculating explicit headcount cost avoidance when justifying service delivery automation platform budget to executive leadership, a practice barely formalized five years earlier, sustaining budget approval momentum for platforms that demonstrably reduce human agent involvement across routine request categories and departments. across most large enterprise service organizations tracked.
Market Impact: 31 percent cite migration as barrier

Employee Experience Expectations Drive Self-Service Investment

Employees increasingly expect consumer-grade digital experiences at work, comparing internal service delivery platforms unfavorably against the instant resolution they experience from consumer applications, creating pressure on enterprises to modernize legacy ticketing interfaces. Roughly 36 percent of surveyed enterprises report employee experience scores as a formal metric tied to service delivery platform investment decisions, treating self-service quality as a talent retention factor rather than purely an operational efficiency consideration, a framing that has meaningfully expanded budget approval across human resources and IT organizations jointly. across most technology-forward enterprise organizations tracked. today.
Market Impact: 28 percent restrict AI to low-risk

Market Restraints and Challenges

Legacy Workflow Migration Complexity Slows Consolidation

Enterprises consolidating fragmented ticketing tools onto a single platform face substantial workflow migration complexity, a friction point rooted in years of accumulated custom automation rules and approval logic built into legacy systems that resist straightforward replication on newer platforms. Roughly 31 percent of surveyed enterprises report migration complexity as the primary factor delaying platform consolidation projects beyond originally planned timelines. Vendors are responding by offering dedicated migration services and pre-built templates that reduce the custom configuration burden considerably. across most complex legacy service management deployments migrated so far. today. overall.
Market Impact: 47 percent now require auto-resolution

AI Accuracy Concerns Limit Autonomous Resolution Scope

Enterprises remain cautious about granting AI agents full autonomous authority over sensitive requests like access provisioning and financial approvals, a friction point rooted in early AI implementations producing enough incorrect resolutions that IT leadership learned to restrict autonomous scope to lower-risk request categories only. Roughly 28 percent of surveyed enterprises report limiting AI auto-resolution to a narrow subset of low-risk request types despite broader platform capability. Vendors are responding by publishing accuracy benchmarks and building tiered approval workflows around AI suggestions. across most enterprise production environments monitored closely today. overall.
Market Impact: 39 percent consolidate multiple tools
4 additional market trends, 3 additional growth drivers, and 3 additional restraints and challenges are covered in the full report. Contact sales@marketmindsadvisory.com to access the complete intelligence.

Segment CAGR and Growth Architecture

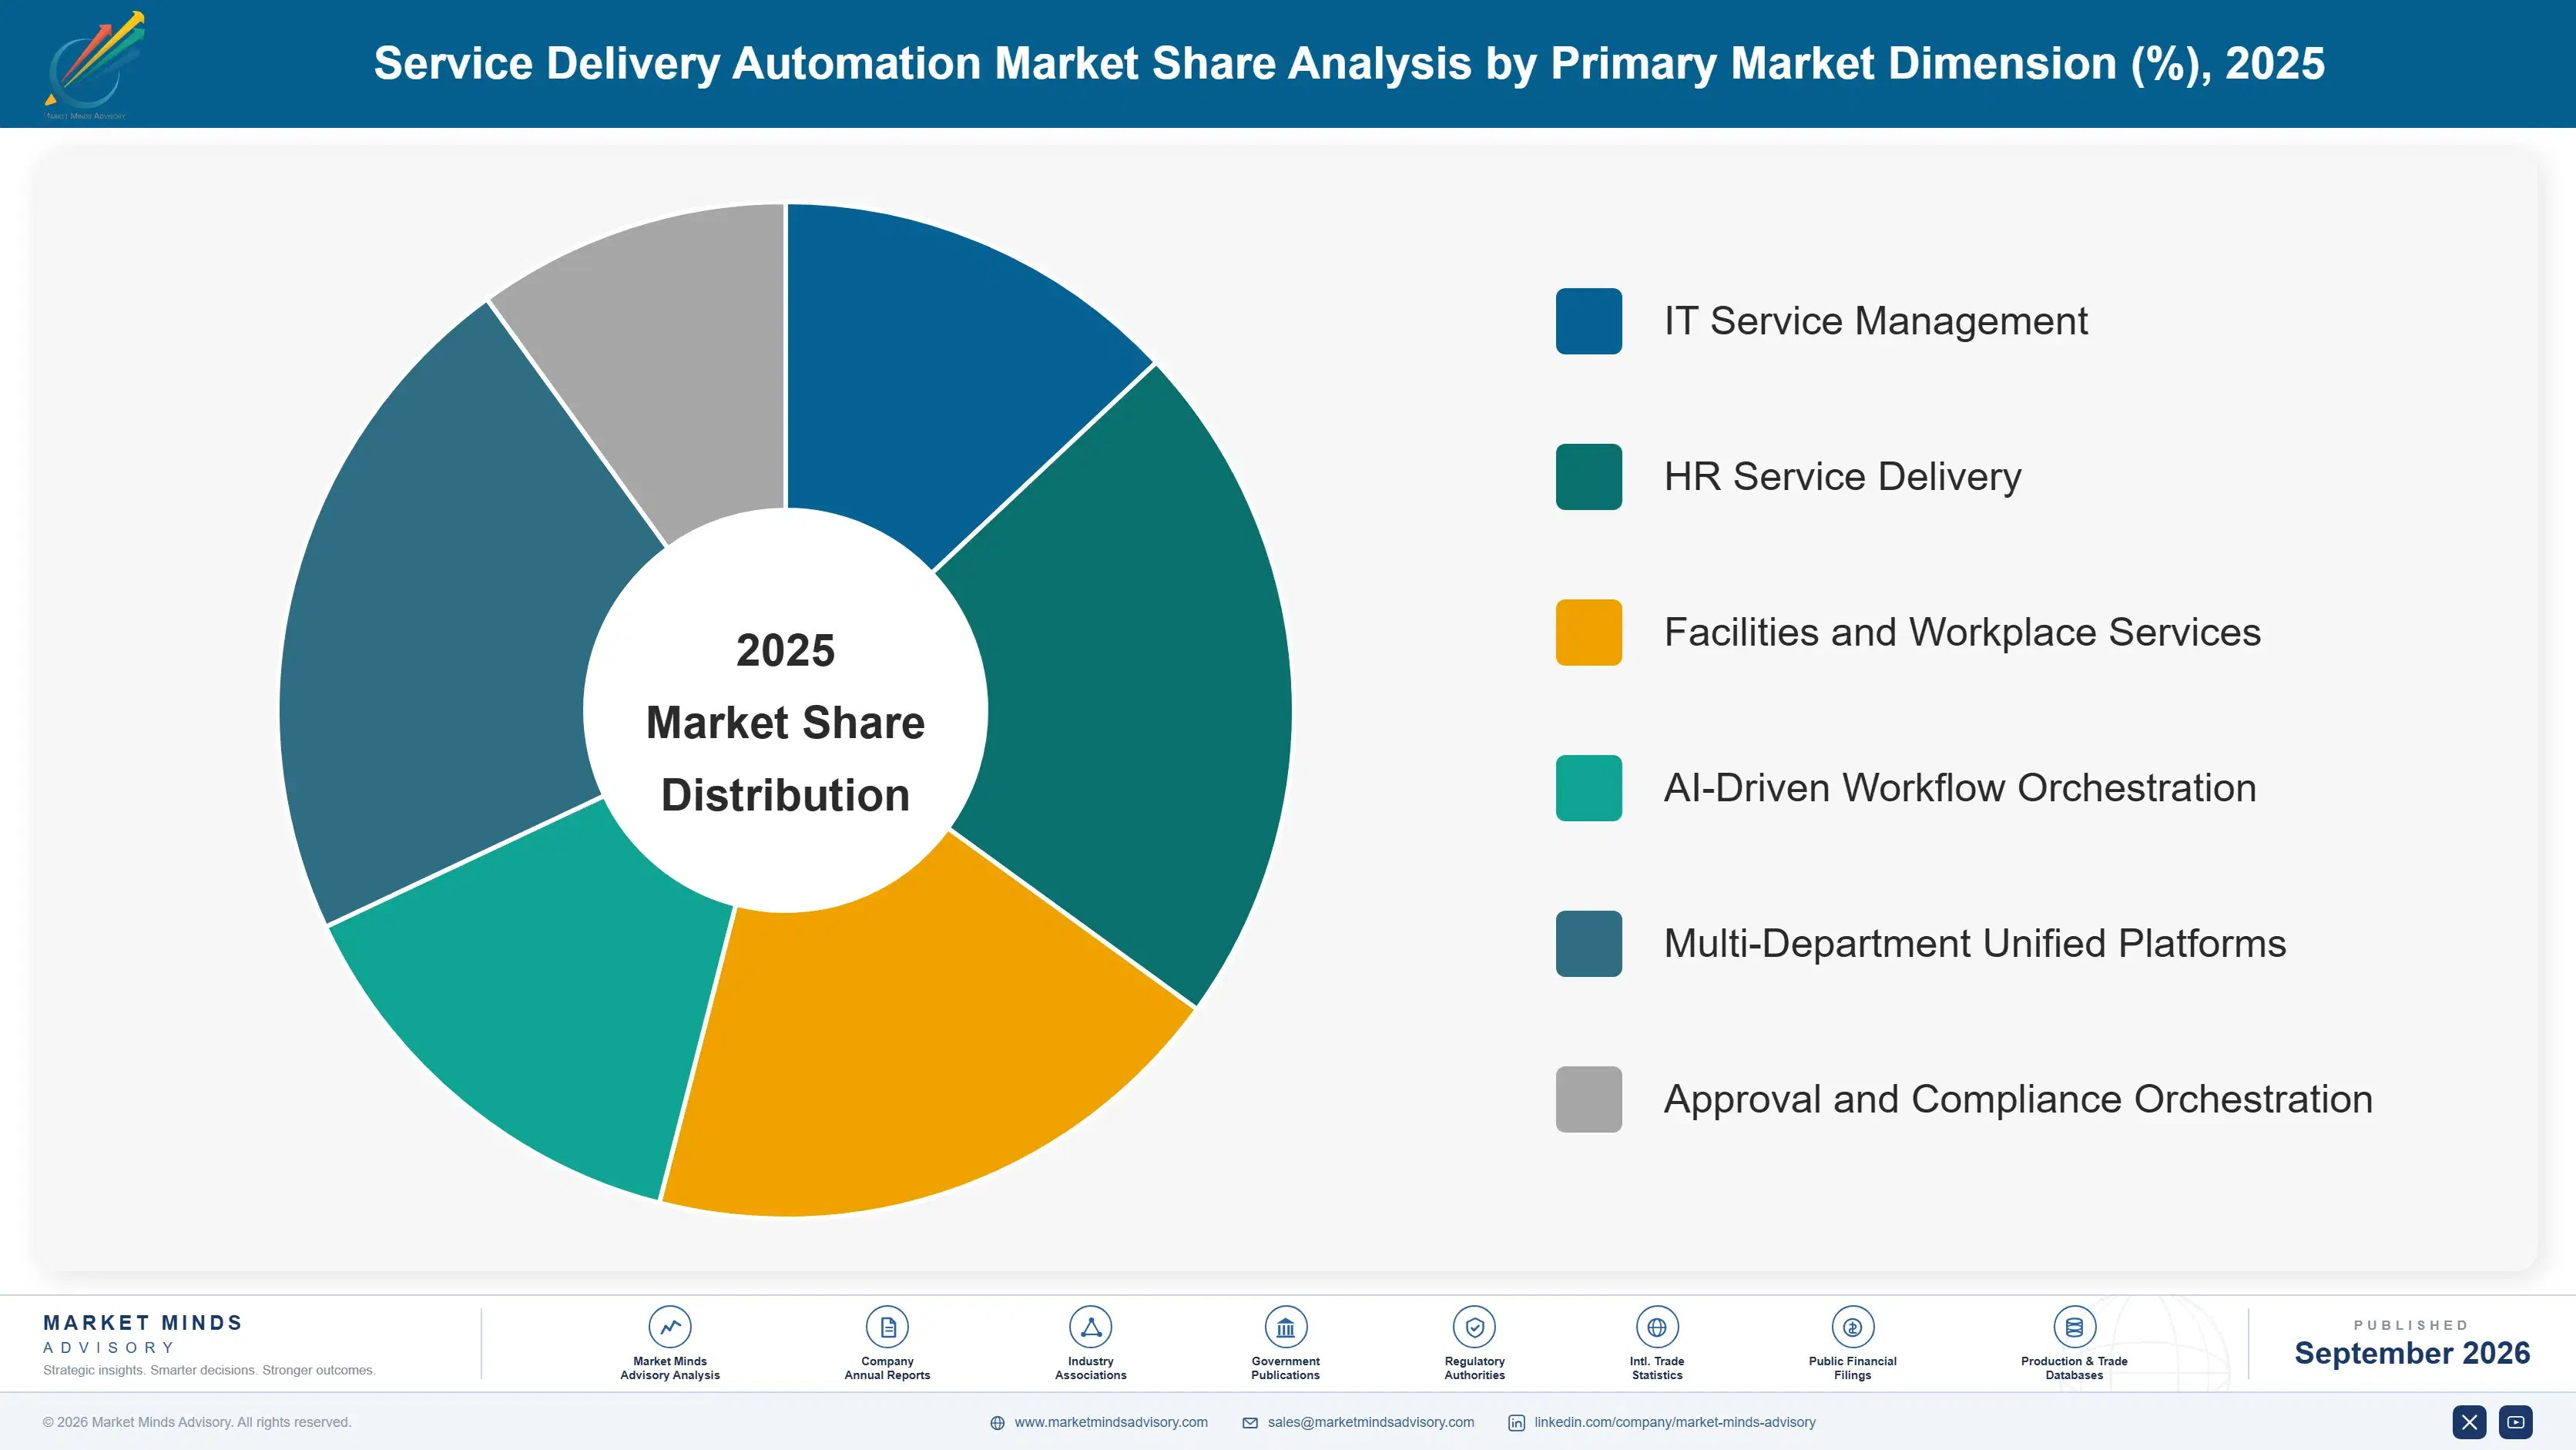
The service delivery automation market segments by function, spanning IT service management, HR service delivery, facilities and workplace services, AI-driven workflow orchestration, and multi-department unified platforms serving enterprise organizations broadly across multiple internal departments and functions. AI-driven workflow orchestration is expanding fastest as enterprises prioritize autonomous resolution over traditional routing entirely today. worldwide. today.
service-delivery-automation-market-market-share-analysis-1788418742513

AI-Driven Workflow Orchestration

AI-driven workflow orchestration platforms use machine learning and conversational interfaces to autonomously resolve routine requests, route complex cases to appropriate specialists, and coordinate multi-step approval processes without manual intervention at each stage. This segment is expanding fastest as enterprises prioritize demonstrable headcount efficiency over traditional feature checklist comparisons, treating AI capability as a genuine differentiator rather than a marketing claim to be evaluated skeptically during procurement. Vendors including ServiceNow and Moveworks have invested heavily in autonomous resolution accuracy, and roughly 47 percent of enterprise buyers now require AI-driven auto-resolution as a mandatory evaluation criterion. Growth here is expected to remain the fastest across the entire market well into the next decade.
CAGR 18.0%

IT Service Management

IT service management platforms remain the largest revenue segment by a substantial margin, providing the foundational incident, request, and change management workflows that every enterprise IT organization requires regardless of additional AI capability layered on top of core functionality. This segment carries the deepest enterprise installed base in the market, favoring established vendors with the broadest catalog of integrations and reliability track record over newer entrants lacking comparable enterprise trust built over years of production deployment. Growth has moderated as AI-driven capability increasingly captures incremental enterprise budget allocation instead of core IT workflows. Suppliers with the deepest installed base advantages continue defending share even as growth decelerates industry-wide considerably each year.
CAGR 8.0%
Full segment breakdown across 6 segments available in the complete report.

Regional Architecture and Country Demand Map

North America leads global demand given concentrated large enterprise software budgets and headcount cost pressure. East Asia follows through business process outsourcing scale, while South Asia and Pacific posts the fastest regional growth rate as enterprise digital transformation accelerates across the region. today. overall. today.

North America

The United States anchors North American demand through its concentration of large enterprises facing acute service desk headcount cost pressure, driving substantial investment in AI-driven auto-resolution capability to control operating expenses. Financial services and technology sector enterprises lead adoption given their complex multi-department service catalogs and substantial digital transformation budgets. Canada contributes a smaller but growing share, driven primarily by enterprise digital transformation investment supporting nearby American headquarters relationships and shared service center operations. This lead should persist as technology and financial services investment continues expanding across the region substantially and its position as the largest single platform consumption market by contract value globally and their supplier base. overall. today.
Share: 28% | CAGR: 13.0% (2026 to 2036)

Western Europe

Regulatory data residency requirements shape Western European demand more than pure technology adoption pace, as enterprises across the bloc increasingly require service delivery platforms with documented data handling and AI governance compliance. German and French enterprises lead regional adoption for IT service management consolidation, while United Kingdom-based financial institutions increasingly specify AI-driven resolution capability for complex approval workflows. Growth trails North America somewhat given the region's more conservative enterprise software budget cycles and longer procurement review processes. Adoption should still accelerate as data residency and AI governance requirements continue clarifying across member states across the bloc's largest financial services economies and their supplier relationships and their sourcing decisions. overall. today.
Share: 21% | CAGR: 10.0% (2026 to 2036)
Regional intelligence for 5 additional markets available in the complete report: East Asia, South Asia and Pacific, Latin America, Middle East and Africa, Eastern Europe. Contact sales@marketmindsadvisory.com.
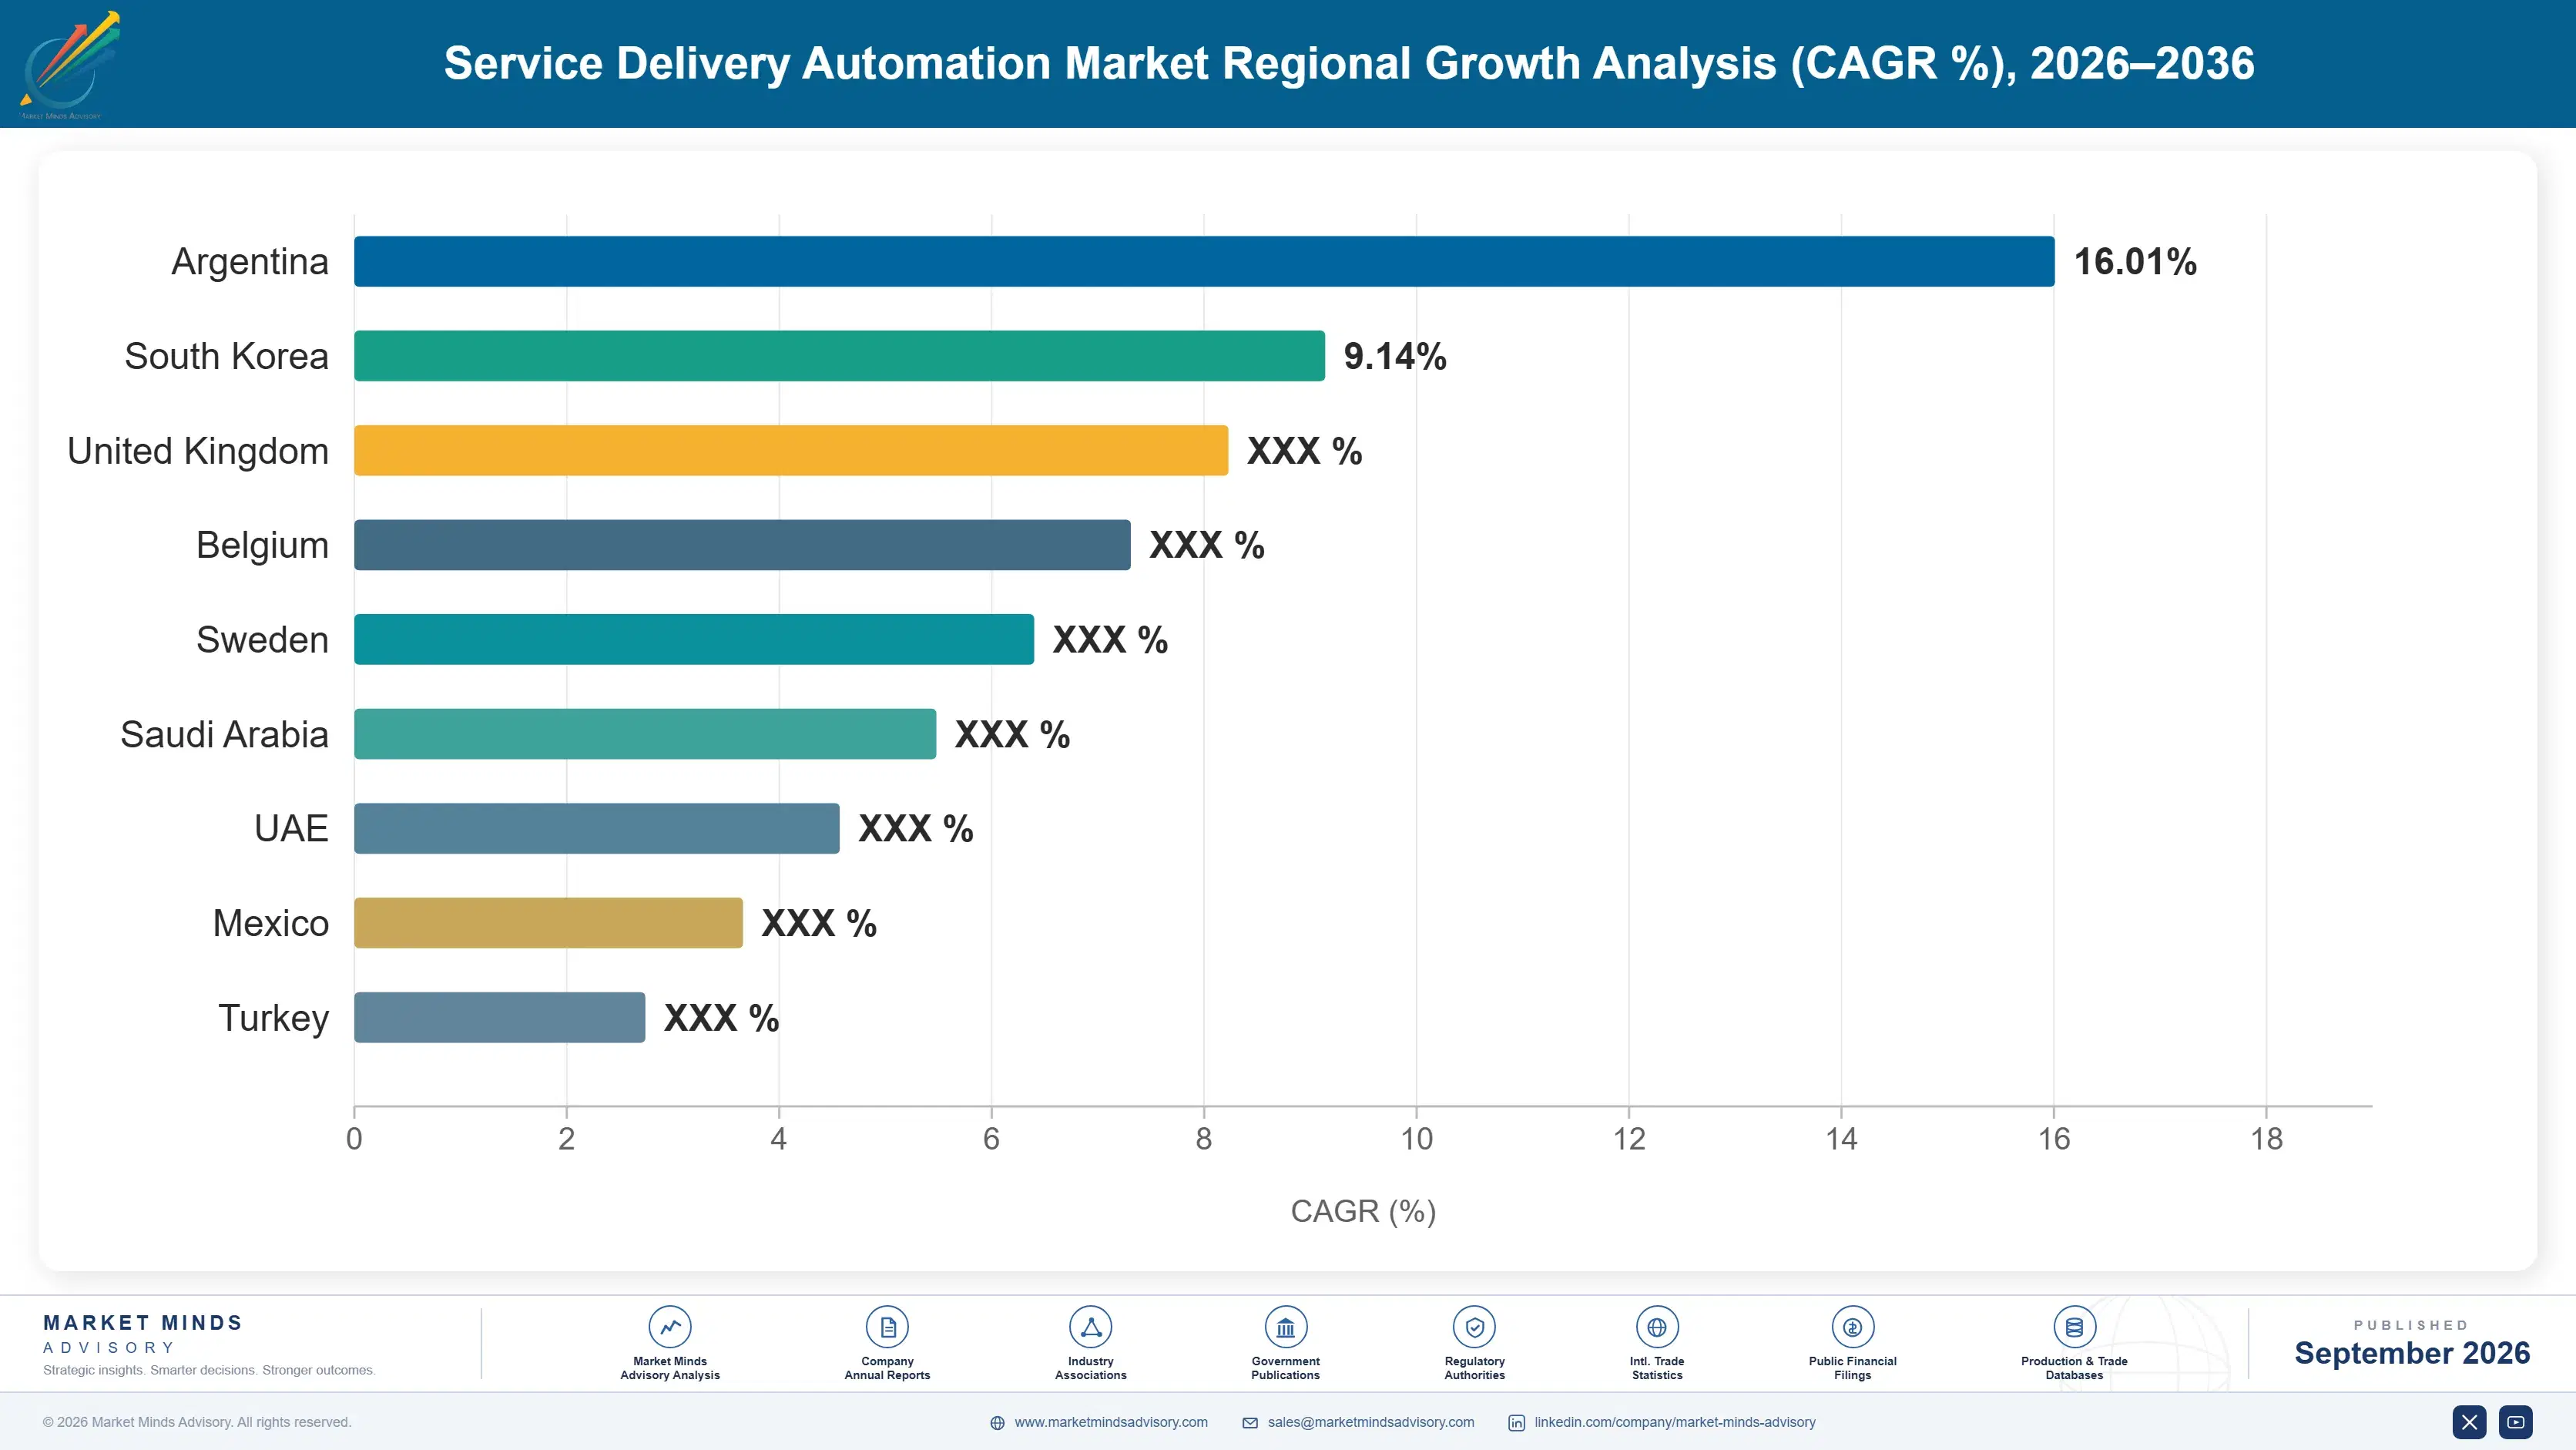
service-delivery-automation-market-country-cagr-analysis-1788418743048

Where Vendors Can Defend Renewal Pricing

As broader business process automation platforms increasingly bundle basic workflow routing at no incremental cost, standalone service delivery vendors must move up the value chain toward AI-driven auto-resolution depth, multi-department consolidation capability, and headcount-focused positioning that generalist competitors cannot easily replicate given their narrower engineering focus. Vendors that delay risk being squeezed out of the highest-value enterprise segments over time.

Deepen AI Auto-Resolution Accuracy Investment Directly

Vendors can invest directly in AI model accuracy and training data quality to improve autonomous resolution reliability, addressing the roughly 47 percent of enterprise buyers who now require demonstrable AI auto-resolution capability as a mandatory evaluation criterion during procurement. Vendors with superior resolution accuracy win structured proof-of-concept evaluations against competitors more consistently, converting technical superiority directly into enterprise contract wins and premium renewal pricing that generic routing tools cannot command today. Vendors slow to pursue this depth risk losing ground to more accurate competitors entirely across enterprise renewal conversations. today.
Market Impact: Captures a growing share of 47 percent AI requirement

Build Multi-Department Workflow Consolidation Capability Directly

Vendors can develop dedicated migration tooling and pre-built templates that reduce the custom configuration burden enterprises face when consolidating fragmented IT, HR, and facilities ticketing tools onto a single platform, directly addressing the roughly 31 percent of enterprises citing migration complexity as their primary consolidation barrier. This capability differentiates vendors competing for large consolidation contracts that generalist point-solution competitors cannot credibly pursue at comparable scale or speed. Vendors slow to build this migration capability risk losing large consolidation contracts to more prepared competitors entirely. This consolidation depth also deepens customer relationships considerably across successive contract renewal cycles.
Market Impact: Addresses the 31 percent citing migration barrier directly

Position Platforms Around Headcount Cost Avoidance

Vendors can reframe service delivery platform value around explicit headcount cost avoidance rather than pure operational efficiency, directly addressing the roughly 43 percent of enterprises now calculating headcount cost avoidance when justifying platform budget to executive leadership. This positioning shift expands the buyer conversation into finance and executive leadership discussions, opening budget sources that purely efficiency-focused vendors struggle to access when competing for scarce enterprise technology investment. Vendors slow to build this framing risk missing budget conversations happening entirely outside traditional IT procurement channels. This framing shift also strengthens executive-level budget conversations considerably beyond pure IT operations stakeholders.
Market Impact: Targets the 43 percent calculating cost avoidance directly

Build Tiered Approval Workflows for AI Trust

Vendors can develop tiered approval workflows that let enterprises gradually expand AI autonomous authority as trust builds, directly addressing the roughly 28 percent of enterprises currently restricting AI auto-resolution to a narrow subset of low-risk request types despite broader platform capability being readily available for deployment. This trust-building approach accelerates the transition from restricted to broader autonomous scope, opening premium automation revenue that skeptical enterprises currently decline to purchase upfront. Vendors slow to build this scoring capability risk losing premium tier revenue to more transparent competitors entirely. across the industry.
Market Impact: Expands autonomous scope for 28 percent restricting AI

Who Controls the Margin Pool

The service delivery automation market remains moderately concentrated at a 42 percent five-company share on an annual recognized revenue basis, with a meaningful gap separating ServiceNow and Atlassian, whose broad enterprise installed base and workflow breadth anchor leading positions, from challengers still building comparable AI resolution depth. Both leaders now differentiate primarily on AI resolution accuracy and integration breadth rather than pure workflow flexibility alone.
Current competitive activity centers on AI auto-resolution accuracy expansion and multi-department consolidation capability, as vendors race to either defend workflow volume through established installed base or capture premium AI-driven design wins through resolution technology that generalist automation platforms cannot easily match at comparable accuracy levels. This shift is squeezing margins for vendors that have not yet invested in comparable AI accuracy or consolidation depth.

Rankings are likely to shift as AI auto-resolution accuracy increasingly determines long-term competitive positioning, favoring vendors that build genuine technical depth over those competing purely on brand recognition or bundling, a dynamic increasingly separating technically differentiated leaders from broad platform incumbents relying on installed base alone. Vendors slow to build this technical depth risk losing ground to more differentiated competitors entirely across both channels.
service-delivery-automation-market-company-positioning-matrix-1788418743606

Competitive Moat and Risk Dimensions

SERVICENOW

Moat: Deep Enterprise Workflow Installed Base

ServiceNow's long-established enterprise installed base and extensive workflow configuration catalog give it switching cost advantages that newer AI-native entrants cannot replicate without years of comparable platform development and enterprise trust building across their customer base. This distribution and trust advantage compounds with every new workflow template the company adds to its extensive catalog.
SERVICENOW

Risk: AI Resolution Catch-Up Pressure

ServiceNow faces mounting pressure to match the AI auto-resolution accuracy of newer AI-native entrants built from the ground up around machine learning, requiring substantial engineering investment to avoid losing renewal conversations today. Product teams increasingly compete for scarce capital against higher-growth automation product lines internally.
ATLASSIAN

Moat: Broad Developer Tool Integration

Atlassian's service delivery capability integrates natively with its widely deployed Jira and Confluence suite, giving it cross-selling relationships into existing enterprise IT organizations that standalone competitors cannot easily replicate across their customer base. This cross-sell motion lowers customer acquisition cost meaningfully compared to standalone service delivery vendors.
ATLASSIAN

Risk: Perceived as Secondary Product Line

Atlassian's service delivery offering sometimes gets perceived as a secondary feature within its broader developer tool suite rather than a best-of-breed standalone platform, potentially limiting appeal to buyers prioritizing specialized depth today. Competitors with dedicated AI-native platforms are winning deals Atlassian's broader suite positioning cannot access.

Players Tracked

Prominent Players

ServiceNow
Atlassian
BMC Software
Ivanti
Freshworks

Other Key Players

Zoho
SolarWinds
IFS
OpenText
SysAid
TOPdesk
EasyVista
Matrix42
Symphony SummitAI
HaloITSM
Salesforce
Microsoft
UiPath
Moveworks
ServiceAide

Recent Developments

JANUARY 2026

ServiceNow Expands AI Auto-Resolution Model Training Investment

ServiceNow announced expanded investment in AI auto-resolution model training using anonymized workflow data from its enterprise customer base, targeting improved autonomous resolution accuracy across complex multi-department service request categories and approval chains. The investment targets closing resolution accuracy gaps against newer AI-native platform competitors. today.
Signal: Signals established vendors racing to close AI accuracy gaps against newer, faster-moving AI-native entrants industry-wide today.
SEPTEMBER 2025

Atlassian Acquires Workflow Migration Automation Startup

Atlassian acquired a workflow migration automation startup to expand its capability for consolidating fragmented enterprise ticketing tools, addressing customer demand for reduced manual configuration burden during multi-department platform consolidation projects broadly. Financial terms of the acquisition were not publicly disclosed by either company involved. broadly.
Signal: Reflects growing vendor focus on migration tooling as a key competitive consolidation differentiator across the sector.
MAY 2025

Freshworks Signs Enterprise Platform Bundling Partnership

Freshworks signed a bundling partnership agreement embedding service delivery capability within a broader business software platform subscription, targeting enterprise customers seeking consolidated workflow and communication tooling under one vendor relationship overall. Bundled pricing terms were not publicly disclosed by either company involved in the partnership.
Signal: Indicates broader business platforms are increasingly absorbing standalone service delivery functionality across the competitive market landscape.

Cloud Compute and AI Talent Exposure

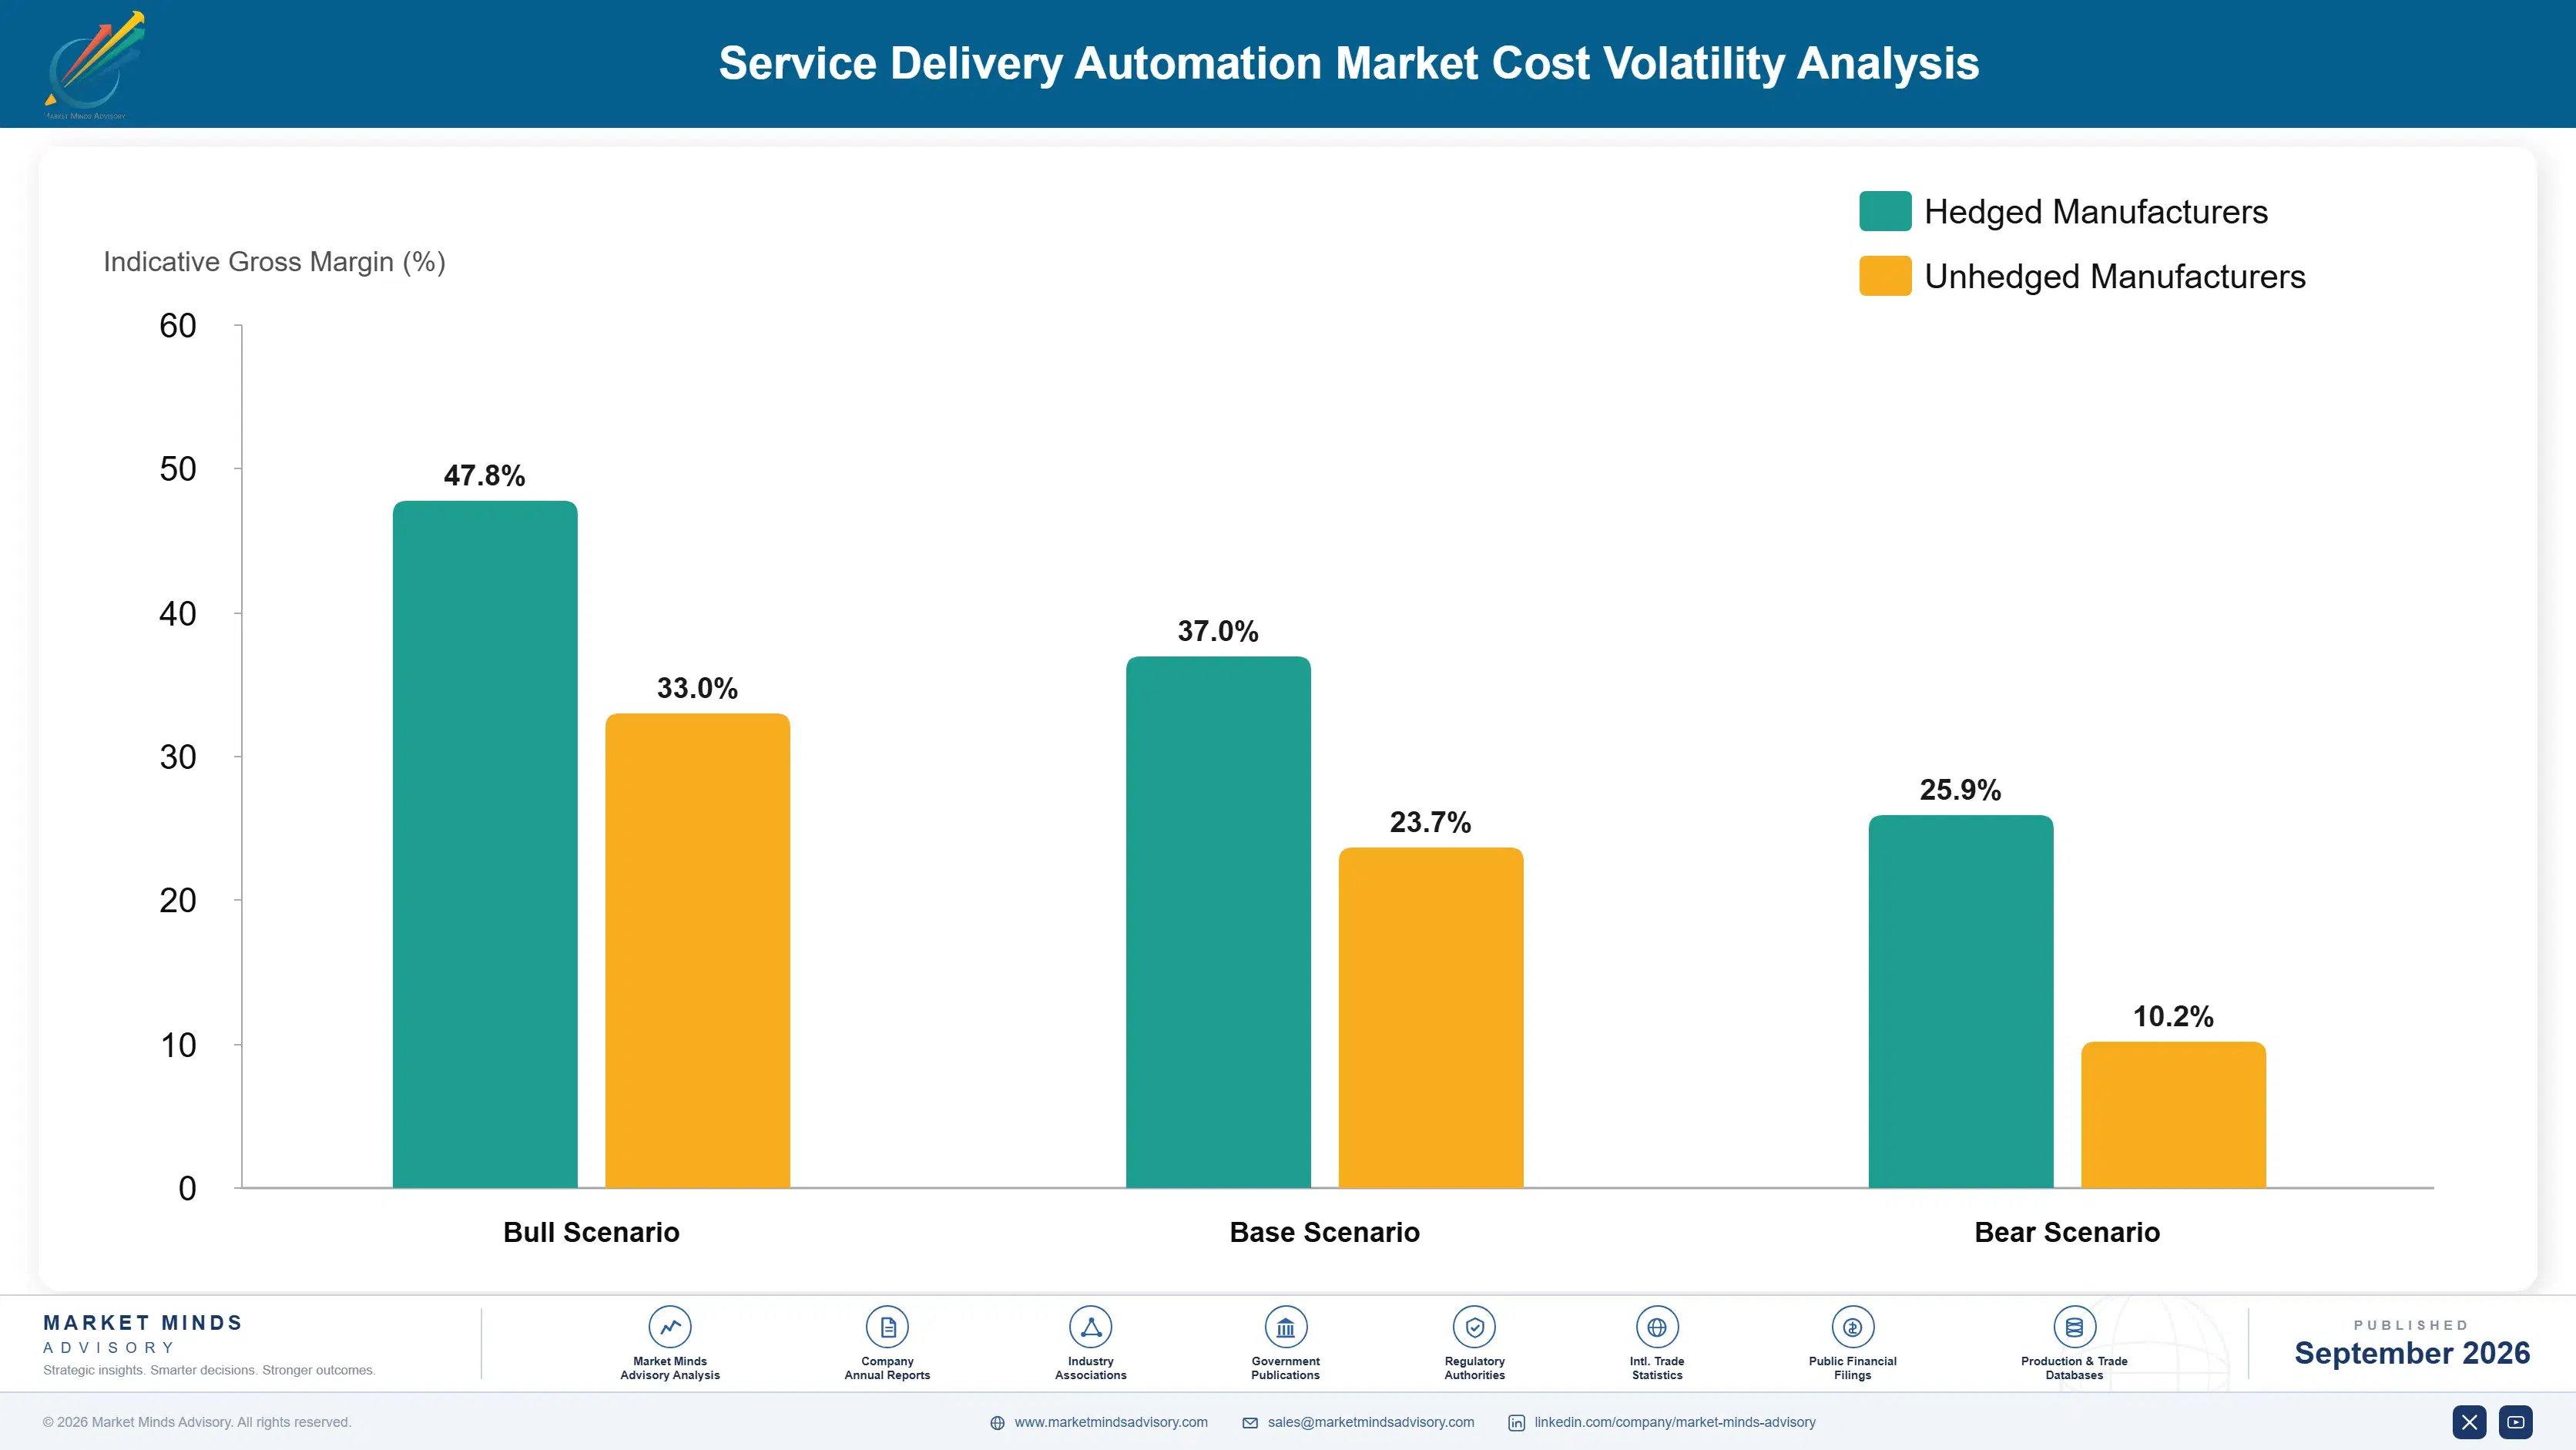
Cloud infrastructure hosting and specialized machine learning engineering talent together represent roughly 39 percent of total cost of goods sold for service delivery automation vendors, since AI model training and continuous inference at scale require substantial compute capacity and ongoing engineering investment to keep resolution accuracy competitive across enterprise customer environments. across every active customer deployment and product line the company operates internationally today.
Cloud compute pricing rose meaningfully during 2023 and 2024 as sustained global demand for artificial intelligence workloads competed for the same underlying infrastructure capacity that service delivery vendors depend on for model training, according to company annual reports and public hyperscaler pricing disclosures, squeezing margins for vendors running AI infrastructure at meaningful scale. particularly during peak resolution model training cycles ahead of major product release milestones worldwide.

This exposure disadvantages smaller independent vendors lacking hyperscaler volume discounts far more than platform leaders like ServiceNow and Atlassian, which negotiate infrastructure pricing across a much larger combined customer base, allowing them to absorb compute cost increases without passing them through to customers as aggressively as smaller competitors must. and existing long-term customer relationships built over multiple product generations and years of collaboration.
service-delivery-automation-market-cost-volatility-analysis-1788418743815

Multi-Cloud Infrastructure Diversification Strategy

Vendors increasingly distribute AI training and inference workloads across multiple cloud providers rather than relying on a single hyperscaler, reducing exposure to any one provider's pricing decisions and improving negotiating leverage during annual enterprise agreement renewal cycles across their combined infrastructure footprint and product roadmap. This proactive sourcing strategy also improves production planning predictability across multi-year infrastructure budgets.

Engineering Talent Retention Programs

Vendors invest in structured career development and retention programs for specialized machine learning engineering talent, reducing costly turnover and the extended ramp-up time required to train replacement engineers on resolution model architecture and enterprise customer environment complexity across teams. This retention investment also improves resolution model quality consistency across successive product releases and updates.

Model Efficiency Optimization Investment

Vendors increasingly invest in model efficiency optimization that reduces inference compute costs per resolution without sacrificing accuracy, lowering the specialized infrastructure dependency that has historically constrained scaling and margin expansion across the broader vendor landscape and customer base today. This efficiency investment also accelerates product development cycles across the vendor's broader platform capability roadmap.

Portfolio Architecture for Margin Defence

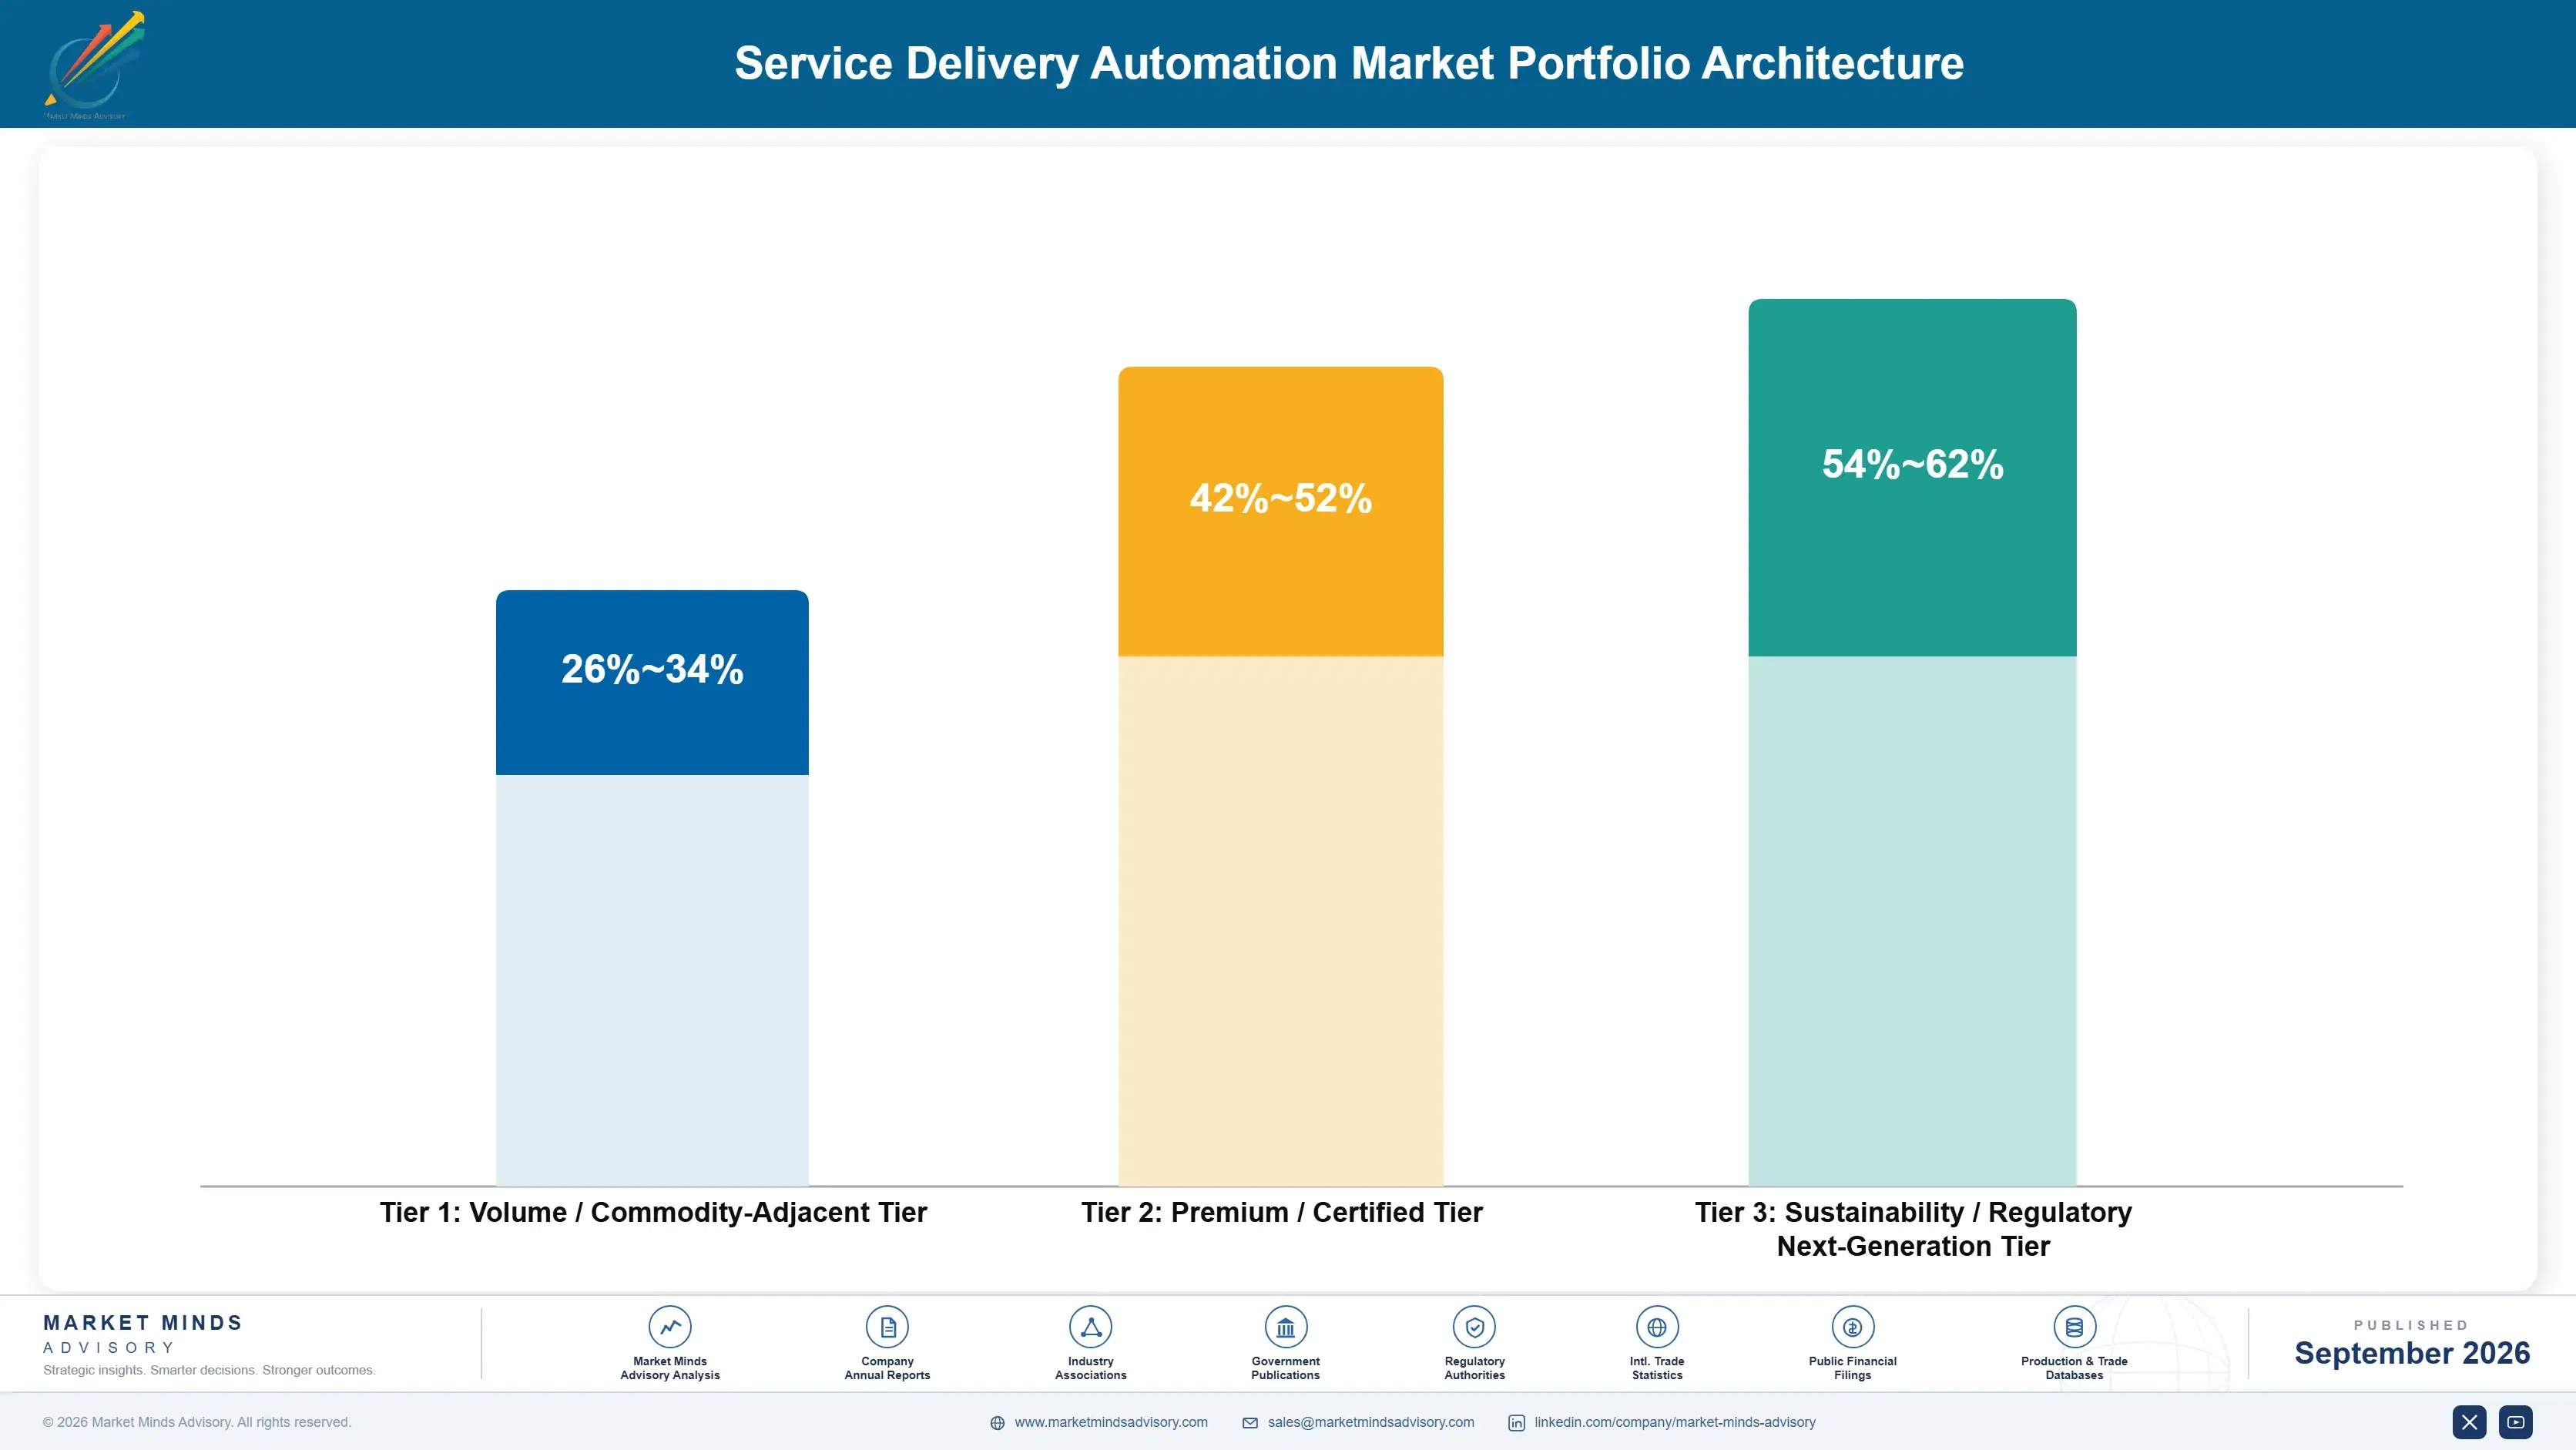
Service delivery automation margins split across a three-tier architecture shaped heavily by AI capability depth rather than pure seat count alone. Volume commodity-adjacent core ticketing competes largely on price against established installed base leaders, while premium certified AI-driven resolution platforms command meaningful margin premiums tied to demonstrable headcount efficiency and multi-department consolidation capability. This distribution-driven split increasingly determines who wins the largest enterprise renewal contracts.
The sustainability and next-generation tier, anchored by AI auto-resolution and unified consolidation platforms, now captures a disproportionate share of gross profit dollars relative to its current deployment volume, reflecting how enterprises pay durable premiums for measurable headcount reduction that commodity ticketing tools cannot easily replicate. This pattern strengthens further as more enterprises formalize headcount cost avoidance as a procurement criterion.

Volume tier core ticketing still anchors installed base and revenue scale for most established vendors, but the real strategic tension now sits between defending that commodity revenue base and investing in the AI resolution and consolidation capability where growth and profitability both concentrate most heavily going forward through the current forecast period. Vendors that delay this shift risk losing relevance entirely within a few product cycles.

Volume / Commodity-Adjacent Tier

Basic ticketing and workflow routing tools competing primarily on price and existing installed base, serving smaller enterprises with straightforward single-department request handling requirements. Margins remain thin given intense price competition and limited differentiation across most comparable ticketing offerings.
Gross Margin: 26-34%

Premium / Certified Tier

AI-driven auto-resolution platforms carrying demonstrable accuracy certification that justify premium pricing above commodity ticketing alternatives across large enterprise technology and financial services segments. Contract sizes here run meaningfully larger than commodity tier deals given demonstrable headcount efficiency evidence.
Gross Margin: 42-52%

Sustainability / Regulatory / Next-Generation Tier

Multi-department consolidation platforms and compliance-certified AI resolution systems commanding the highest margins on autonomous resolution capability, data governance documentation, and measurable headcount reduction evidence. This tier increasingly attracts the largest enterprise contracts as automation requirements shape procurement decisions directly.
Gross Margin: 54-62%
service-delivery-automation-market-portfolio-architecture-1788418744321

High-value Sub-segments and Strategic Watch-out

AI-Driven Auto-Resolution Platforms

The highest-value pool in the market, capturing premium enterprise contracts through autonomous resolution capability that generalist ticketing competitors cannot match regardless of their underlying workflow flexibility claims today. Vendors positioned early here could capture disproportionate share as automation trust continues building steadily further. industry-wide. overall.
Gross Margin: 56-64%

Multi-Department Consolidation Platforms

A high-value pool growing at a rapid pace as enterprises prioritize unified workflow orchestration over fragmented point solutions, converting consolidation contracts directly into premium renewal pricing overall. Growth here is expected to accelerate further as enterprises scale multi-department consolidation initiatives across procurement processes. today. overall.
Gross Margin: 46-54%

Core IT Service Management Tools

The volume core of the market, generating predictable installed base expansion even as growth rates moderate relative to newer AI-driven resolution categories gaining enterprise budget share steadily each year. Vendors here increasingly compete on integration breadth rather than differentiated AI resolution or consolidation capability. overall.
Gross Margin: 26-34%

Standalone HR Service Delivery Tools

A strategic watch-out segment where broader multi-department platform bundling could materially reshape competitive positioning for point-solution vendors still dependent on standalone HR service delivery revenue. Vendors overexposed here risk sudden revenue disruption as bundling accelerates across most platform categories. across most enterprise segments over the current forecast period.
Gross Margin: 32-40%

Resolution Accuracy Builds Sticky Renewal Economics

Service delivery platforms generate durable annuity-like economics once resolution models are tuned to a customer's specific workflows and request history, since switching vendors means losing months of accumulated training data that made the platform genuinely accurate, giving established vendors a renewal advantage over competitors offering comparable raw capability but lacking equivalent tuned model performance across contested enterprise conditions. across the vendor's entire enterprise customer base and renewal contract portfolio.
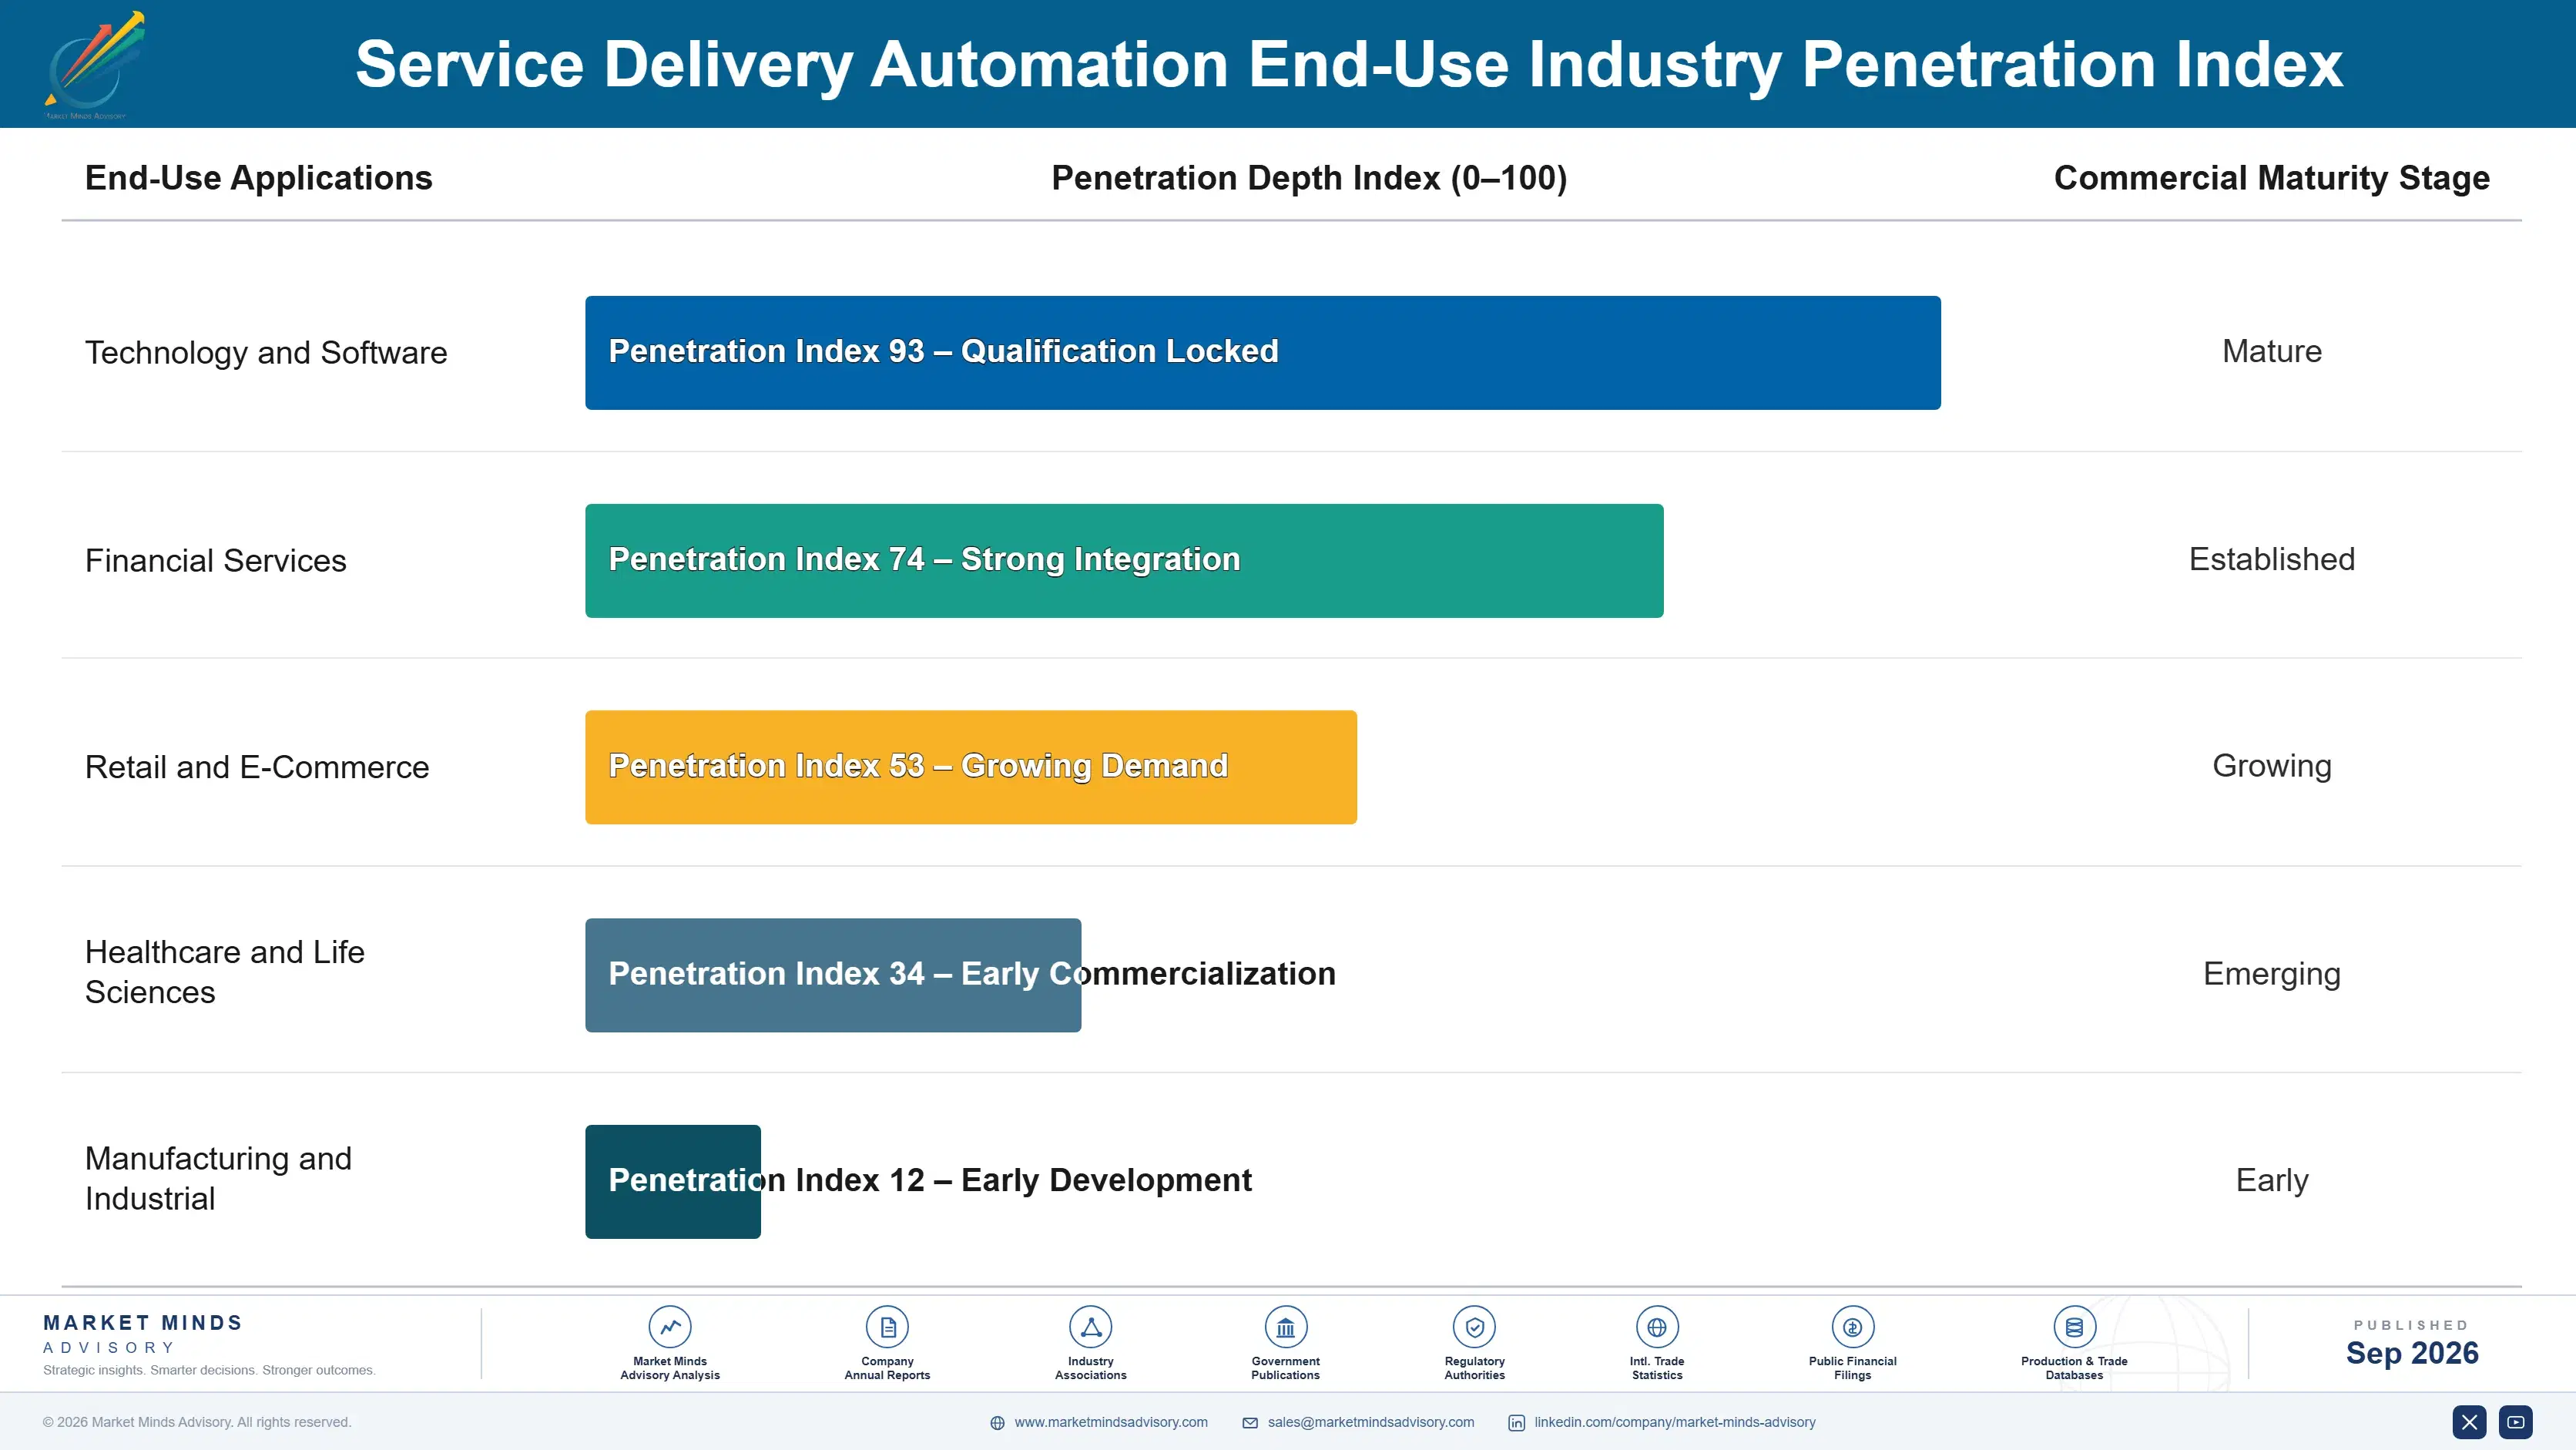
Adoption depth varies sharply by end-use vertical. Technology and financial services buyers embed vendor relationships deepest, treating AI-driven platforms as strategic operational infrastructure integrated tightly with identity and HR systems, while smaller enterprises remain more price-sensitive and switch readily whenever a competitor offers comparable specifications at a meaningfully lower price point. Mid-market buyers sit between these extremes, valuing reliability but remaining more cost-conscious than large enterprise procurement teams.

A generational shift in buyer profile is underway as digital workplace leaders increasingly influence procurement decisions over IT operations managers who historically favored established ticketing vendors, a dynamic accelerating adoption of AI-driven resolution platforms ahead of legacy routing tools across enterprise renewal cycles and budget conversations. Technical evaluators increasingly outrank cost-focused procurement officers in enterprise buying committees across most technology organizations today.
service-delivery-automation-market-end-use-penetration-index-1788418744844

Where MMA Sees Automation Heading

These are among the four positions where our research anticipates prominent divergence between winners and laggards over the coming forecast period. Each is grounded in the demand model, the regulatory perimeter, and the announced capacity pipeline.
01 / AI RESOLUTION PRIORITY

AI auto-resolution accuracy deserves priority investment as buyers demand demonstrable proof

Roughly 47 percent of surveyed enterprise buyers now require AI-driven auto-resolution as a mandatory evaluation criterion, making resolution accuracy a genuine competitive moat rather than a marketing claim vendors could previously get away with asserting loosely. Vendors that build genuine resolution depth now will win structured proof-of-concept evaluations against competitors before those competitors catch up, since model training cycles take years to replicate credibly. This gap widens further as buyer sophistication in evaluating AI claims continues rising across the market.
02 / CONSOLIDATION CAPABILITY FOCUS

Migration tooling investment captures underserved consolidation demand efficiently

Roughly 31 percent of surveyed enterprises cite migration complexity as the primary factor delaying platform consolidation projects beyond originally planned timelines, representing a substantial opportunity for vendors offering dedicated migration tooling and pre-built templates. Vendors that simplify consolidation reduce customer decision friction and capture project timelines competitors dependent on fully custom migration cannot match at comparable speed or cost. Vendors slow to build this migration capability risk losing large consolidation contracts worth millions to more prepared rivals entirely across the industry.
03 / COST AVOIDANCE FRAMING

Positioning around headcount cost avoidance opens finance-level budget conversations

Roughly 43 percent of surveyed enterprises now calculate explicit headcount cost avoidance when justifying service delivery automation platform budget, representing a budget conversation extending well beyond traditional IT operations efficiency metrics into broader finance and executive discussions. Vendors that reposition their value proposition around this cost avoidance framing access budget sources that purely efficiency-focused competitors struggle to reach when competing against other operational tooling priorities. This gap widens further as finance leadership increasingly scrutinizes technology investment decisions across the enterprise.
04 / TRUST-BUILDING AUTOMATION DESIGN

Tiered approval workflows accelerate the shift toward broader autonomous scope

Roughly 28 percent of surveyed enterprises currently restrict AI auto-resolution to a narrow subset of low-risk request types despite broader platform capability being readily available, reflecting genuine trust concerns that tiered approval workflows can meaningfully address over successive product interactions. Vendors that build this trust-building capability now will accelerate customer confidence and access premium automation pricing tiers before competitors establish comparable credibility. Vendors slow to build this trust framework risk losing premium tier revenue to more transparent rivals across the competitive landscape.

Engagement Snapshot From the Field

A live engagement with an industry participant carrying material or product regulatory and market exposure ahead of a defining policy shift, showing how our research translates into a defensible multi-year portfolio strategy.
MARKET MINDS ADVISORY · CLIENT ENGAGEMENT SUMMARY
Service Delivery Automation Producer Strategic Portfolio Review and Transition Roadmap 2026·Investment Scenario on Service Delivery Automation Exposure Evaluation 2025-26
CLIENT PROFILE
A global retail enterprise with roughly $110 million in annual technology operations spending (client-reported, unverified by MMA) approached MMA after growing frustration with maintaining five separate ticketing tools across its IT, HR, and facilities departments, requesting a structured consolidation vendor evaluation before the next annual budget cycle. The engagement carried added urgency given the compressed timeline before the next annual budget cycle review.
STRATEGIC CHALLENGE
The client's fragmented tooling created inconsistent employee experience across departments and duplicated administrative overhead maintaining separate integrations, yet consolidating onto a single platform risked disrupting established workflows that individual department teams had customized extensively over several years of incremental configuration. Department leaders required a resolution before customized workflows became further entrenched and harder to migrate.
MMA APPROACH
MMA benchmarked five candidate vendors against migration tooling depth, AI auto-resolution accuracy, and total cost of ownership over a three-year horizon, supplementing vendor claims with structured interviews of peer retail enterprises that had already completed comparable multi-department consolidation projects without disrupting active operations. MMA also modeled department-specific migration risk explicitly, given the client's highly customized legacy workflow configurations.
KEY FINDINGS
  1. The client's five separate tools generated duplicated administrative overhead estimated at roughly 2,400 hours annually across IT, HR, and facilities teams combined.
  2. Vendors offering dedicated migration tooling reduced projected consolidation timeline by roughly 45 percent (client-reported, unverified by MMA) compared to fully custom migration approaches initially considered.
  3. A phased department-by-department consolidation approach avoided disrupting active workflows while validating new platform reliability under production conditions before full commitment. This validation step proved critical to securing department leadership buy-in.
  4. Employee satisfaction scores for service delivery experience improved measurably following consolidation, with unified request tracking cited as the most valued improvement. overall.
CLIENT PROFILE
A global retail enterprise with roughly $110 million in annual technology operations spending (client-reported, unverified by MMA) approached MMA after growing frustration with maintaining five separate ticketing tools across its IT, HR, and facilities departments, requesting a structured consolidation vendor evaluation before the next annual budget cycle. The engagement carried added urgency given the compressed timeline before the next annual budget cycle review.
STRATEGIC CHALLENGE
The client's fragmented tooling created inconsistent employee experience across departments and duplicated administrative overhead maintaining separate integrations, yet consolidating onto a single platform risked disrupting established workflows that individual department teams had customized extensively over several years of incremental configuration. Department leaders required a resolution before customized workflows became further entrenched and harder to migrate.
MMA APPROACH
MMA benchmarked five candidate vendors against migration tooling depth, AI auto-resolution accuracy, and total cost of ownership over a three-year horizon, supplementing vendor claims with structured interviews of peer retail enterprises that had already completed comparable multi-department consolidation projects without disrupting active operations. MMA also modeled department-specific migration risk explicitly, given the client's highly customized legacy workflow configurations.
KEY FINDINGS
  1. The client's five separate tools generated duplicated administrative overhead estimated at roughly 2,400 hours annually across IT, HR, and facilities teams combined.
  2. Vendors offering dedicated migration tooling reduced projected consolidation timeline by roughly 45 percent (client-reported, unverified by MMA) compared to fully custom migration approaches initially considered.
  3. A phased department-by-department consolidation approach avoided disrupting active workflows while validating new platform reliability under production conditions before full commitment. This validation step proved critical to securing department leadership buy-in.
  4. Employee satisfaction scores for service delivery experience improved measurably following consolidation, with unified request tracking cited as the most valued improvement. overall.
RECOMMENDED STRATEGY
Phase 1: Phase 1 (Months 1 to 3): Select the consolidation vendor and begin migrating the IT service management department first as the pilot. Phase 2: Phase 2 (Months 3 to 8): Extend consolidation to HR and facilities departments sequentially, validating workflow accuracy at each stage. Phase 3: Phase 3 (Months 8 to 12): Complete full platform consolidation and formally retire legacy point solutions across all departments. Document lessons learned for future platform expansion.
OUTCOME
The client completed the consolidation within the recommended twelve-month window, reducing administrative overhead substantially while improving employee satisfaction scores, with unified reporting cited as a key factor in subsequent budget renewal (client-reported, unverified by MMA). The phased consolidation framework is now the client's standard approach for future platform decisions.

Frequently Asked Questions

Foundational context covering the market sizes, CAGR, scope, country, region and competition that inform every finding below. This section is provided to cover basics and most often pre-purchase conversations, answered from the MMA Primary Research Dataset.

What is the current size of the Service Delivery Automation Market?

The global service delivery automation market reached an estimated $6.8 billion in 2025. Growth is concentrated in AI-driven auto-resolution and multi-department consolidation capability serving large enterprises.

How large will the Service Delivery Automation Market be by 2036?

MMA projects the market will reach $22.52 billion by 2036, roughly a 2.97 times expansion from its 2026 base value, driven primarily by AI-driven automation and enterprise headcount cost pressure.

What is the CAGR for the Service Delivery Automation Market 2026 to 2036?

The market is projected to grow at an 11.5 percent compound annual growth rate between 2026 and 2036, with a bull case of 12.8 percent and a bear case of 10.2 percent.

Which segment is growing fastest?

AI-driven workflow orchestration platforms are the fastest-growing segment, expanding at roughly 18.0 percent annually as enterprises increasingly prioritize autonomous request resolution over traditional routing tools.

Who are the major companies in the Service Delivery Automation Market?

Leading companies include ServiceNow, Atlassian, BMC Software, Ivanti, and Freshworks, together holding an estimated 42 percent of the global market on an annual revenue basis.

Which country is growing fastest?

The Philippines is the fastest-growing major country market, expanding at approximately 16.0 percent annually as its business process outsourcing sector scales digital infrastructure investment substantially.

Report Segmentation Architecture

The full report scope spans multiple orthogonal segmentation dimensions, with cross-tabulated demand data provided for each dimension pair. Coverage extends further to regional breakdowns, trend trajectories, and the competitive detail needed to support segment-level decision-making.

By Primary Market Dimension

  • IT Service Management
  • HR Service Delivery
  • Facilities and Workplace Services
  • AI-Driven Workflow Orchestration
  • Multi-Department Unified Platforms
  • Approval and Compliance Orchestration

By End-Use Industry

  • Technology and Software
  • Financial Services
  • Retail and E-Commerce
  • Healthcare and Life Sciences
  • Manufacturing and Industrial

By Commercial Dimension

  • Seat-Based Subscription Licensing
  • Usage-Based API Pricing
  • Enterprise Platform Bundling
  • Managed Implementation Services

By Region

  • North America
  • Western Europe
  • East Asia
  • South Asia and Pacific
  • Latin America
  • Middle East and Africa
  • Eastern Europe

Scope, Methodology, and Coverage

Every figure in this report is reproducible from documented input assumptions. The scope below maps the historical period, the forecast horizon, the segmentation dimensions, and the countries covered, alongside the underlying primary and qualitative methodology.
Historical Period
2020 to 2025
Forecast Period
2026 to 2036
Base Year
2025 (USD billions; MMA Primary Research Dataset, September 2026)
Market Definition
The service delivery automation market covers software platforms that automate request intake, workflow routing, approval orchestration, and resolution across enterprise IT, HR, facilities, and other internal service functions. It excludes customer-facing support ticketing systems and general-purpose business process management suites not focused on internal service delivery.
Quantitative Units
USD billions (current prices); enterprise subscription seat count where disclosed
Segmentation Dimensions
By Primary Market Dimension; By End-Use Industry; By Commercial Dimension; By Region
Regions Covered
North America, Western Europe, East Asia, South Asia and Pacific, Latin America, Middle East and Africa, Eastern Europe
Countries Covered
USA, China, Germany, France, UK, Japan, South Korea, India, Australia, Canada, Brazil, Mexico, Indonesia, Vietnam, Thailand, Malaysia, UAE, Saudi Arabia, South Africa, Nigeria, Turkey, Poland, Netherlands, Italy, Spain, Sweden, Switzerland, Argentina, Colombia, Singapore, and additional markets relevant to this sector
Key Companies Profiled
ServiceNow, Atlassian, BMC Software, Ivanti, Freshworks, Zoho, SolarWinds, IFS, OpenText, SysAid, TOPdesk, EasyVista, Matrix42, Symphony SummitAI, HaloITSM, Salesforce, Microsoft, UiPath, Moveworks, ServiceAide
Quantitative Methodology
Primary survey, n=3,800 respondents, Q4 2025, six countries; demand-side model with trade association cross-validation
Qualitative Methodology
47 expert interviews, Q4 2025; applied to validate demand model assumptions, identify emerging dynamics, and assess competitive positioning
Report Format
PDF and XLSX data workbook (Word format preview document)
Publisher
Market Minds Advisory
Report Code
MMA-2026-TEC-407
Published
September 2026
Contact
sales@marketmindsadvisory.com | www.marketmindsadvisory.com

Purchase the full Service Delivery Automation Market Report (2026 to 2036).

The full report provides comprehensive market sizing, ten-year forecasts, and segment-level analysis across all six service delivery automation categories and seven global regions. It includes detailed competitive profiling of twenty companies, input cost and AI infrastructure risk assessment, and portfolio margin analysis by capability tier. Readers gain access to primary survey data spanning 3,800 respondents and forty-seven expert interviews conducted across six countries during the fourth quarter of 2025. The report also includes a proprietary revenue lever framework identifying specific commercial actions vendors can take to defend margin.
Ten-year market size and CAGR forecasts
Segment-level growth rates and share analysis
Seven-region demand, pricing, and share breakdown
Twenty-company competitive benchmarking and positioning profiles
Input cost and AI infrastructure risk mapping
Portfolio margin tier analysis and watch segments

Built For The People Who Decide

From boardroom strategy to bench-side execution, this report is read cover-to-cover by leaders shaping the next decade of their industry, turning demand scenarios, market dynamics and valuation benchmarks into decisions.
CXOs/ Presidents/ VPs/ Managers
M&A and Corporate Development
Strategy Teams and R&D Heads
Procurement and Product Directors
Regulatory and Compliance Leaders
Investor Relations and Equity Analysts