

Market Minds Advisory
Server Less Computing Market

Server Less Computing Market: Serverless Computing Market: Utilisation Economics, State Problems and Binding Depth, 2026 to 2036

Serverless is a billing model rather than a technology, cheap below a utilisation threshold and expensive above it, which is why workloads keep arriving and a steady share of them keep leaving again.

Lead Analyst

Published

September 2026

Make Smarter Decisions with Customized Research Insights

Request a free sample report and evaluate market opportunities, growth trends, and competitive dynamics relevant to your business needs.

2025 MARKET VALUE$18.0BMarket Size 2025
2036 FORECAST VALUE$90.3BBase Case , 2026 to 2036
CAGR 2026 TO 203615.8 %Bull 17.0% / Bear 14.6%
INCREMENTAL OPPORTUNITY$69.5BNet 10- year value creation
EXPANSION MULTIPLE4.33x2036 value over 2026 base
Strategic Levers
M&A Pipeline
Regional Outlook
Country Rankings
Competitive Intelligence
Segmental Deep-dive
Call-Us : 91 93563 13602

Executive Snapshot and Market Trajectory.

The honest description of serverless is a pricing decision with operational consequences. The same compute billed per request rather than per hour is recorded as a different market, which makes most sizing of this category considerably softer than it appears. The invoice defines the category here. Nobody built anything new.
The economics are well understood and rarely stated plainly. Serverless costs less below roughly 34% utilisation and more above it, so workloads arrive when they are small and spiky and around 27% of them move to provisioned capacity once they become steady. Growth comes from an enormous number of small workloads rather than from displacing large ones, which is a different business entirely. Net retention on individual workloads is consequently poor.
Five providers hold 82% of measured service revenue, and the interesting difficulty is no longer cold start, which modern runtimes have reduced to about 12 milliseconds. It is state: only around 18% of applications genuinely need none, which pushed the hard problems into serverless databases and durable execution. Those grow at 23.7%, half again the market rate of 15.8%. Engineering attention moved wholesale from compute to data.
Market Definition
The serverless computing market covers cloud services billed on actual consumption rather than provisioned capacity, where the provider manages scaling, availability and infrastructure entirely, spanning function as a service, serverless container platforms, serverless databases and data services, edge function runtimes, serverless application integration, and durable stateful execution services. Sizing is measured at provider service revenue. Provisioned virtual machines, reserved capacity, managed Kubernetes with provisioned nodes, storage billed by volume and software licensed independently are excluded.
Base Year Value
$18.0B in 2025 (MMA Primary Research Dataset, September 2026)
Forecast Period
2026 to 2036, eleven discrete annual values
CAGR
15.8% base case. Bull 17.0%. Bear 14.6%.
Fastest Growth Segment
Serverless Databases and Data Services: 23.7% CAGR
Fastest Growth Country
India: 21.8% CAGR
Fastest Growth Region
South Asia and Pacific: 18.0% CAGR
Largest Region
North America: 42% of 2025 global value
Market Leaders
Amazon Web Services, Microsoft, Google Cloud, Cloudflare, Alibaba Cloud. Source: MMA Analysis based on company disclosures and measured serverless service revenue.
Primary Survey
n=3,800 procurement and R&D decision-makers, Q4 2025, six countries
Methodology
Demand-side build-up, cross-validated against public data, 47 expert interviews

Server Less Computing Market Forecast Scenarios

server-less-computing-market-size-forecast-scenario-1788417833764
Between 2020 and 2025 the market compounded at 14.6%, and adoption ran ahead of the narrative in one direction and behind it in another. Function services grew rapidly among small workloads and event handlers while enterprise migration of substantial applications happened far less than the marketing suggested. What genuinely accelerated late in the period was serverless data services, because state was the obstacle everybody had been avoiding.
The 15.8% base case rests on three commercial mechanisms. The number of small, event-driven and spiky workloads keeps growing faster than the number of large steady ones, and those are precisely the workloads serverless pricing suits. Serverless databases and durable execution have removed the state obstacle that kept real applications away. And managed service bindings make migration away progressively harder as an application matures, which improves retention on the workloads that stay.
The bull case is durable execution making long-running stateful applications genuinely practical on consumption billing, which would open workloads that have never been candidates. The bear case is provisioned capacity pricing falling far enough that the utilisation crossover moves down, since a lower crossover point sends more workloads back to provisioned capacity earlier in their lives than they leave today.

A Pricing Model That Became A Category

Serverless is billing, not architecture, and the distinction matters commercially because the same compute appears in different market categories depending only on how the invoice is calculated. A provider moving a managed service to per-request pricing creates serverless revenue without building anything new. That makes most published sizing of this category considerably softer than it looks, and comparisons between providers less meaningful than they appear.
TOP FIVE CONCENTRATION82%Share of measured service revenue held by leading providers
UTILISATION CROSSOVER34%Utilisation above which provisioned capacity costs less than consumption billing
WORKLOAD REPATRIATION RATE27%Portion of serverless workloads later moved to provisioned capacity
COLD START LATENCY12 msStartup delay on modern isolate-based function runtimes today
STATELESS APPLICATION SHARE18%Portion of applications that genuinely require no persistent state
MANAGED BINDING COUNT9 servicesProvider services a typical production function couples to
The economics have a crossover that engineering teams learn quickly and vendors rarely mention. Below roughly 34% utilisation, paying per request is cheaper than holding capacity; above it, provisioned capacity wins and the gap widens fast. Around 27% of serverless workloads therefore move to provisioned capacity once they become steady and substantial, which is not failure but the model working exactly as its own arithmetic predicts.
The technical objection changed shape rather than disappearing. Cold start dominated discussion for a decade and modern runtimes have reduced it to around 12 milliseconds, which nobody notices. What replaced it is state, since only about 18% of applications genuinely need none and everything else must keep data somewhere between invocations. That pushed the difficulty into serverless databases and durable execution, which is where the interesting engineering now happens.
"The industry spent ten years arguing about cold starts and solved a problem that had almost stopped mattering. The actual question was always where the state lives, and the providers that answered that well are the ones holding workloads today."
Director, Cloud Platforms and Application Infrastructure Practice · MMA Technology and Cloud Infrastructure Practice · September 2026

Market Trends

State Replaces Cold Start As The Real Obstacle

Cold start latency dominated a decade of argument and modern isolate-based runtimes have reduced it to roughly 12 milliseconds, at which point nobody notices and nobody complains. The problem that actually blocked adoption was always state, since functions are stateless by design and only around 18% of applications genuinely need no persistent data between invocations. Serverless databases and durable execution services answer that directly, which is why they grow at 23.7% against a market at 15.8%. The engineering attention in this field has moved wholesale from compute to data. Nobody complains about startup time now.
Market Impact: Sits below 34% utilisation

Workloads Leave When They Become Steady

Consumption billing costs less below roughly 34% utilisation and more above it, and the crossover is arithmetic rather than opinion. Teams therefore build on serverless because it removes operational work, and around 27% of those workloads move to provisioned capacity once traffic becomes predictable and substantial enough that the bill becomes visible. Providers describe this as customers outgrowing a tier and it is really the pricing model behaving as designed. Net retention on individual workloads is consequently poor, and growth depends on workload creation rather than workload expansion. Growth depends on workload creation rather than expansion.
Market Impact: Grows at 21.8% annually

Market Opportunities and Growth Drivers

Small Spiky Workloads Multiply Faster Than Large Ones

Event handlers, scheduled tasks, webhooks, glue code between systems and internal tools all proliferate as organisations build more small software, and every one of them sits far below the 34% utilisation crossover where consumption billing is genuinely cheaper. That population grows much faster than the number of large steady applications does. Growth in this market therefore comes from workload creation rather than from migrating anything substantial, which is a healthier engine than the migration story implied and a completely different one. That is a healthier engine than the migration story implied and a completely different one.
Market Impact: Sends 27% of workloads back

Indian Developer Population Builds On Consumption Billing

India has the largest population of developers building new applications outside the United States, and new applications built by small teams default to consumption billing because it removes capacity planning nobody wants to do. Growth of 21.8% makes India the fastest growing country in this market. Startup and services company workloads dominate, which are exactly the small spiky pattern serverless suits. Enterprise migration lags as it does everywhere, but the volume of newly created workloads more than compensates for it. Newly created workload volume more than compensates for enterprise migration lagging as it does everywhere.
Market Impact: Spans 9 coupled services

Market Restraints and Challenges

The Utilisation Crossover Caps Workload Lifetime

Consumption billing is cheaper below roughly 34% utilisation and progressively more expensive above it, so any workload that succeeds eventually costs more on serverless than on provisioned capacity. The root cause is that a provider holding idle capacity for bursts must charge a premium for it, which is entirely rational and entirely unavoidable. Commercial impact is around 27% of workloads leaving, and poor net retention on those that stay. Mitigation runs through tiered pricing at higher volumes, through hybrid arrangements combining provisioned concurrency with burst, and through binding depth that makes leaving expensive in engineering terms.
Market Impact: Reduces cold start to 12 milliseconds

Debugging Distributed Functions Remains Genuinely Hard

An application decomposed into many short-lived functions coupled through events is far harder to reason about than a single process, and a failure that spans several invocations is difficult to reproduce at all. The root cause is that the execution model removes the process boundary developers used to understand behaviour. Commercial impact is teams reverting to conventional architectures after painful incidents rather than after any cost analysis. Participants mitigate with distributed tracing built into the platform, with local emulation environments, and with durable execution frameworks that restore a readable sequence to distributed work.
Market Impact: Returns 27% of workloads later
4 additional market trends, 3 additional growth drivers, and 2 additional restraints and challenges are covered in the full report. Contact sales@marketmindsadvisory.com to access the complete intelligence.

Segment CAGR and Growth Architecture

Segmentation follows the service type consumed, which determines what problem is being solved and how deeply an application becomes coupled to a provider. Functions, serverless containers, data services, edge runtimes, integration and durable execution address genuinely different obstacles, and the fastest growth now sits in the ones that address state rather than compute. Coupling depth varies sharply too.
server-less-computing-market-market-share-analysis-1788417834490

Serverless Databases and Data Services

Only around 18% of applications genuinely need no persistent state, which meant that stateless functions on their own could never carry serious workloads however fast they started. Databases billed by request and capable of scaling to zero remove the one piece that always had to be provisioned, and they close the gap that kept real applications on conventional infrastructure. Growth at 23.7% is half again the market rate of 15.8%. The engineering is considerably harder than stateless compute, since connection handling, consistency and cold storage retrieval all behave badly under bursty consumption patterns and have to be solved properly. Connection handling and consistency behave badly under bursty load. Solving that properly is the whole product.
CAGR 23.7%

Edge Function Runtimes

Executing code at network edge locations rather than in a distant region removes latency for request handling, authentication, personalisation and routing that regional functions cannot match at any price. Isolate-based runtimes make it practical, starting in around 12 milliseconds and using very little memory per instance, which is what allows thousands of tenants on one machine. Growth at 21.4% reflects content delivery and compute converging. The runtime environment is narrower than a regional function offers, and developers routinely discover that limitation only after committing substantial work to building there. Network presence across a very large number of locations is the genuine asset here rather than the compute itself. The trade is real either way.
CAGR 21.4%
Full segment breakdown across 6 segments available in the complete report.

Regional Architecture and Country Demand Map

Demand follows cloud consumption and new application creation rather than population or economic size, and it records against provider billing rather than developer location. North America dominates on both enterprise spend and provider domicile. Developer location and billing location are frequently different places entirely. Consumption records against the payer.

North America

The largest enterprise cloud spend anywhere sits here alongside the providers themselves, which puts the region at 42%, far above the 32% ceiling of the standard band, and the concentration reflects both consumption and billing domicile rather than any measurement choice. Adoption is deepest and so is repatriation, since teams here have run serverless long enough to have encountered the utilisation crossover repeatedly. Financial services and retail carry the largest event-driven workloads. Cost governance attention is also highest here, which accelerates the movement of steady workloads to provisioned capacity. Cost governance attention is also highest here, which accelerates the movement of steady workloads toward provisioned capacity earlier than elsewhere. Repatriation is deepest here too.
Share: 42% | CAGR: 15.0% (2026 to 2036)

Western Europe

Data residency requirements shape architecture more heavily here than anywhere, which favours providers with regional presence and complicates edge execution where the location of processing matters legally rather than only technically. Enterprise adoption is cautious and concentrated in event-driven integration rather than in core application migration. Regulatory reporting obligations create steady demand for durable execution. Growth of 14.2% is the slowest of any region and reflects deliberate adoption pace rather than any lack of technical capability among the teams involved. Regulatory reporting obligations create steady demand for durable execution, which is a distinctive regional pattern that other markets do not show at all. Enterprise adoption remains cautious and concentrated in event-driven integration rather than in any core application migration.
Share: 20% | CAGR: 14.2% (2026 to 2036)
Regional intelligence for 5 additional markets available in the complete report: East Asia, South Asia and Pacific, Latin America, Middle East and Africa, Eastern Europe. Contact sales@marketmindsadvisory.com.
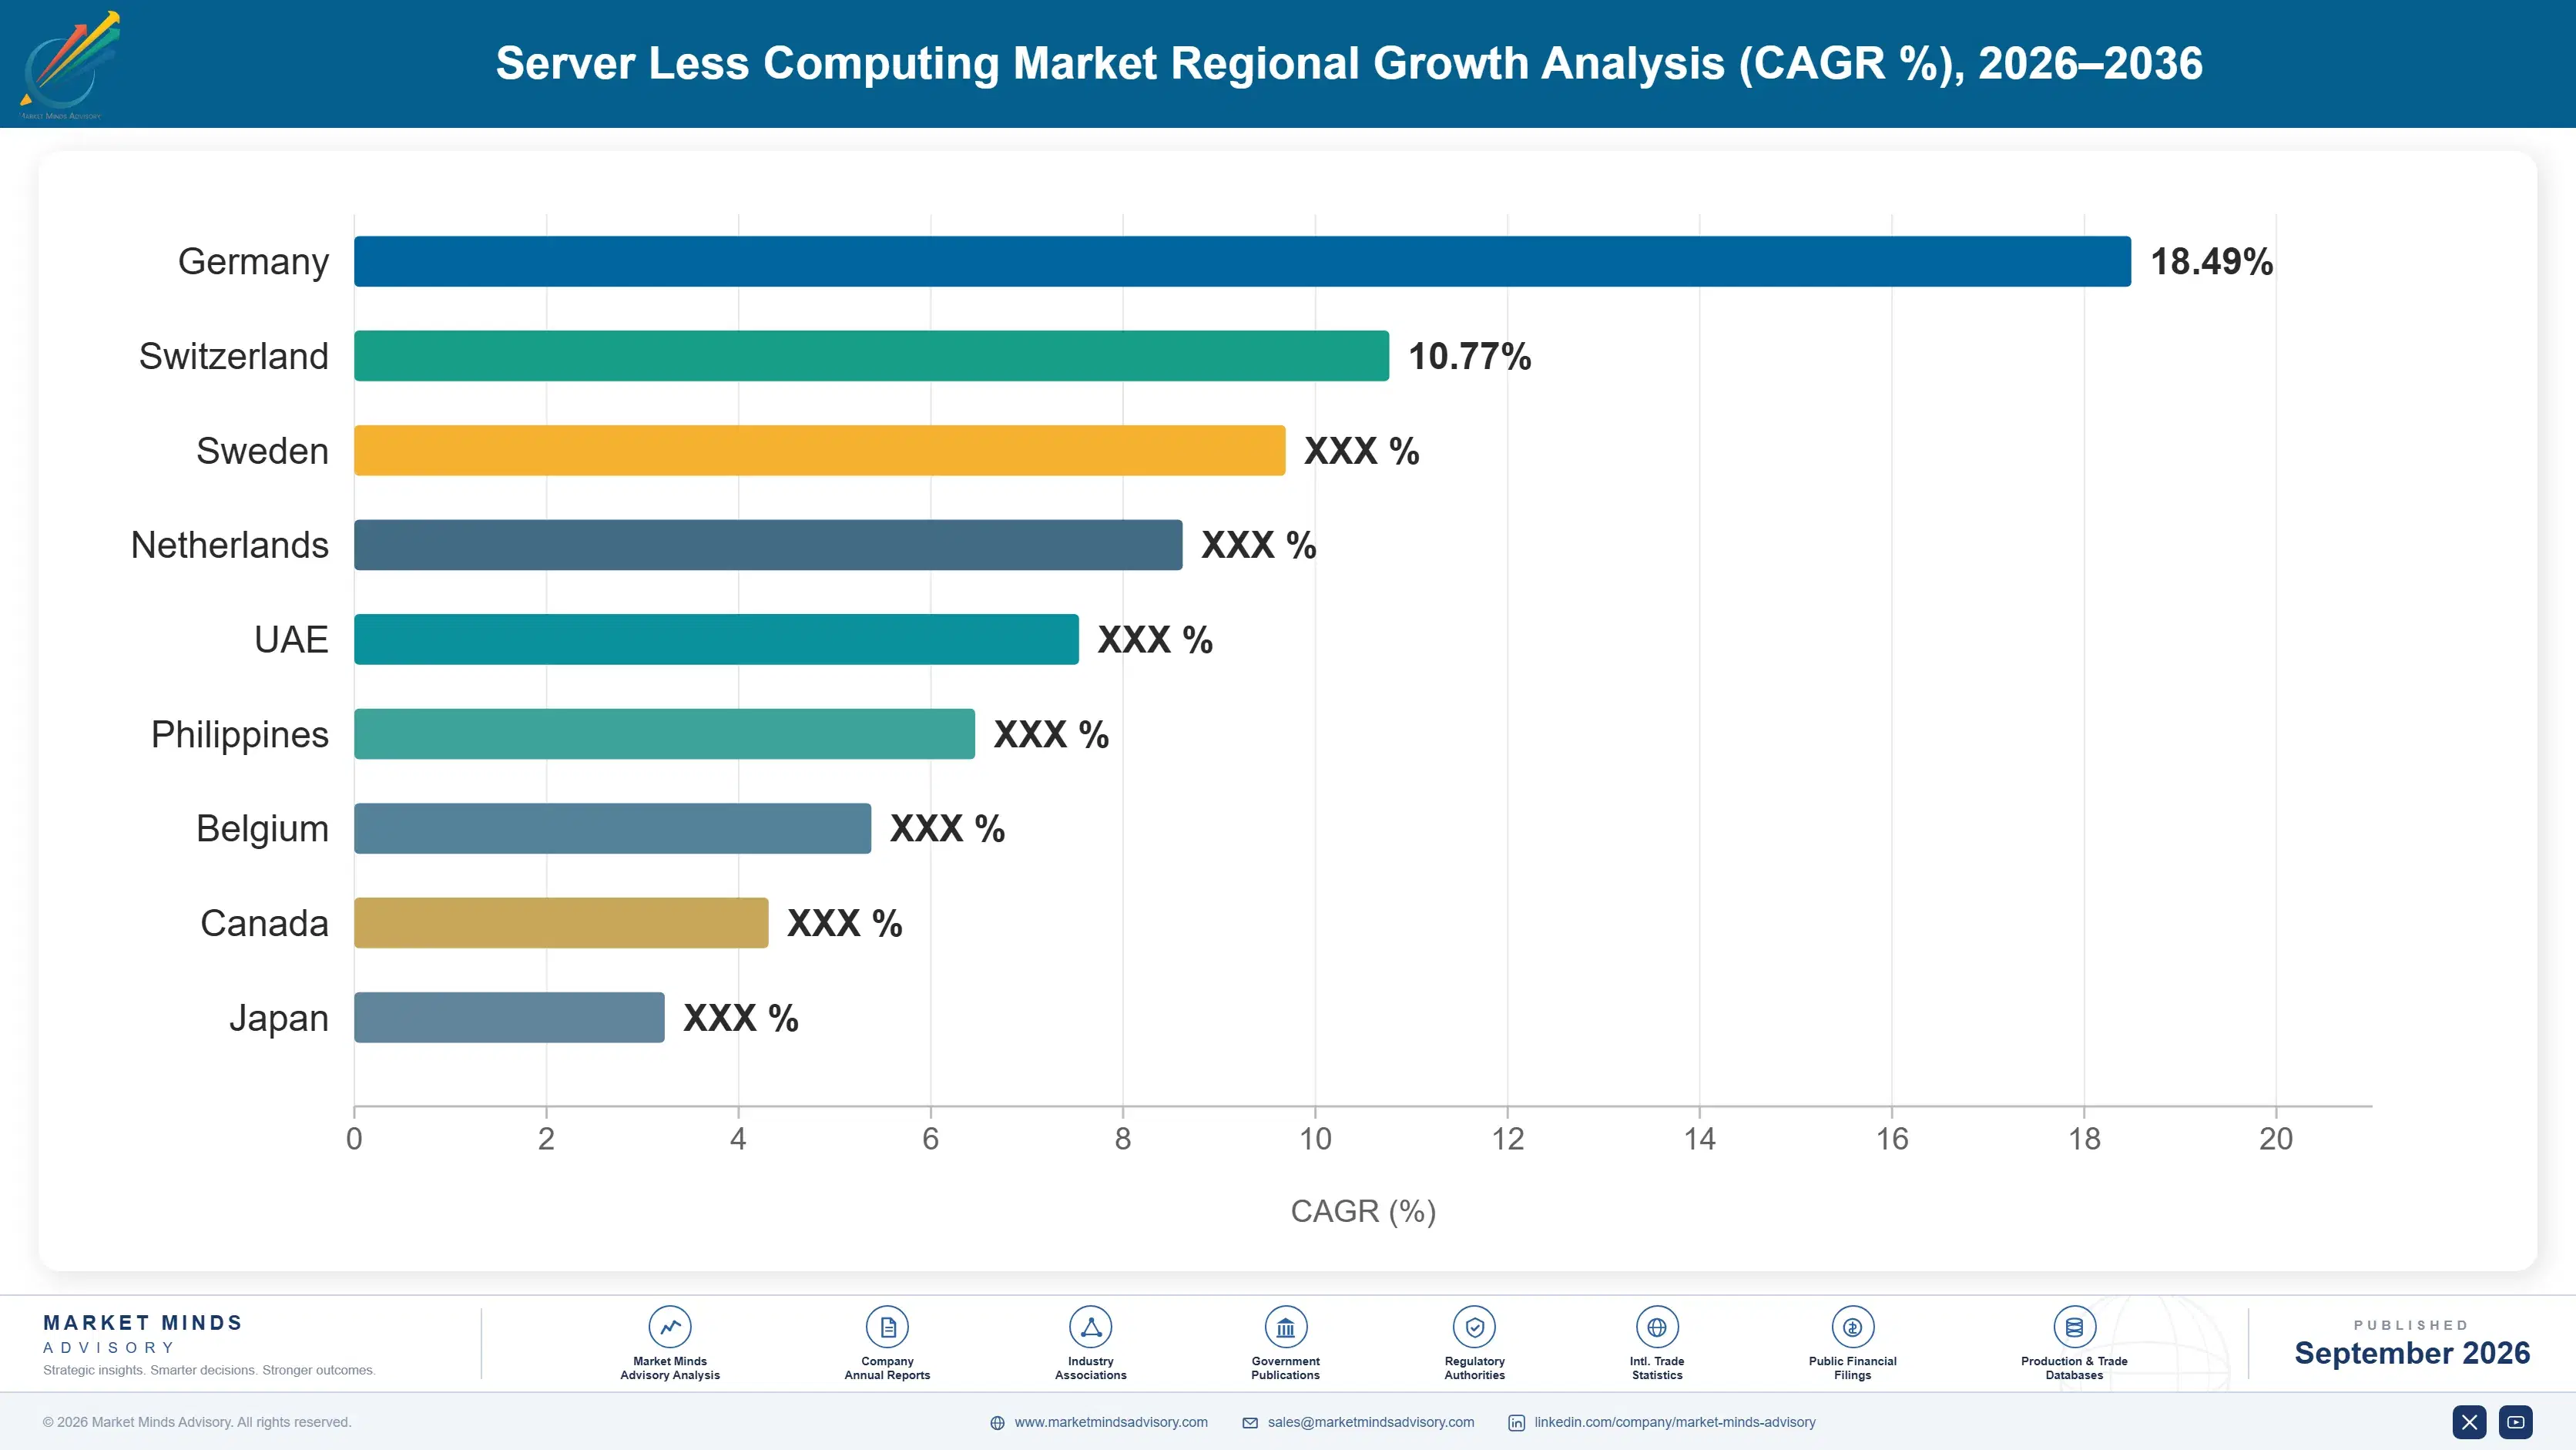
server-less-computing-market-country-cagr-analysis-1788417835246

Where Serverless Revenue Actually Holds

Four positions carry margin in a market whose own pricing model sends successful workloads away. Each involves either solving the state problem properly or making departure expensive in engineering terms, and providers understand both far better than their customers generally do. Providers understand both far better than their own customers generally do, which is itself the commercial fact worth noticing.

Solve State Rather Than Optimising Compute

Only around 18% of applications need no persistent state, which means stateless functions alone could never carry serious workloads regardless of how fast they started. Databases billed per request and able to scale to zero remove the one component that always had to be provisioned, and that segment grows at 23.7% against a market at 15.8%. The engineering is genuinely harder than compute, involving connection handling, consistency and retrieval from cold storage under bursty load. Providers still competing on cold start are optimising something nobody measures. Providers competing on cold start are optimising something nobody measures.
Market Impact: Serves the 82% of applications that need state

Price Above The Utilisation Crossover Deliberately

Consumption billing loses to provisioned capacity above roughly 34% utilisation, and around 27% of workloads leave once they cross it, which is the pricing model working exactly as designed. Tiered rates at higher volume, committed use arrangements and hybrid provisioned concurrency all keep those workloads rather than watching them go. It reduces the margin on the largest consumers and retains revenue that otherwise disappears entirely. Providers treating repatriation as customers outgrowing a tier are describing a choice they made themselves. It reduces margin on the largest consumers and retains revenue that otherwise disappears entirely.
Market Impact: Retains the 27% of workloads that currently depart

Deepen Bindings Rather Than Advertising Portability

A production function couples to around 9 provider services for events, identity, queuing, storage and observability, and rewriting those takes months while rewriting the function takes an afternoon. That asymmetry is what makes serverless commercially attractive to a provider and it is rarely stated. Providers adding integration depth increase retention far more effectively than any pricing action does. Buyers evaluating portability by language support are examining precisely the part that never mattered. Buyers evaluating portability on language support examine the part that never mattered. Providers understand this asymmetry perfectly well and say very little about it publicly.
Market Impact: Deepens coupling across all 9 of the managed services

Build Durable Execution For Long Workflows

Business processes running for hours, days or months have never fitted a function model bounded by execution timeouts, and durable execution frameworks that persist progress across restarts remove that limitation entirely. That opens order processing, onboarding, claims handling and approval workflows which have never been serverless candidates at all. It also restores a readable sequence to distributed work, which addresses the debugging difficulty that sends teams back to conventional architectures after incidents. It restores a readable sequence across the 9 coupled services that distributed debugging otherwise obscures entirely. No hyperscale provider owns this layer outright yet.
Market Impact: Spans workflows across all 9 of the coupled services

Who Controls the Margin Pool

Measured on service revenue, the basis used throughout this section, the top five hold 82%. That is extraordinary concentration and it follows from the capital required to hold idle capacity for burst across many regions, which no smaller provider can fund. The gap between leaders and everyone else is managed service breadth and regional coverage rather than any difference in the function runtimes themselves, which are broadly comparable.
Competition runs on managed service breadth, data service capability and increasingly on edge presence rather than on function performance, which every provider delivers adequately. Hyperscale providers compete on the depth of surrounding services that make functions useful. Edge-first providers compete on latency and on runtimes that start in milliseconds. Specialist database companies compete on the state problem the hyperscalers answered later and less elegantly.

Pressure builds from two directions. Specialist serverless database companies are taking the fastest growing segment from providers whose data services were built for provisioned use and adapted afterwards. And durable execution is emerging as a distinct layer that no hyperscaler owns outright. Rankings shift where providers solved state properly and built durable execution rather than continuing to improve compute nobody was complaining about.
server-less-computing-market-company-positioning-matrix-1788417835998

Competitive Moat and Risk Dimensions

AMAZON WEB SERVICES

Moat: Managed service breadth and bindings

The widest range of managed services means a function has more useful things to connect to than anywhere else, and the roughly nine bindings a production function acquires are what make migration away genuinely expensive. Earliest arrival in this category built operational maturity competitors are still working toward. Regional coverage supports the idle capacity burst handling requires.
AMAZON WEB SERVICES

Risk: Data services built for provisioning

Serverless data offerings were adapted from services designed for provisioned use rather than built for consumption billing, and specialists building from scratch handle connection behaviour and scaling to zero more elegantly. That matters because data services are the fastest growing segment. Repatriation of large workloads to provisioned capacity within the same provider disguises revenue that is genuinely leaving this category.
CLOUDFLARE

Moat: Edge runtime and startup performance

Isolate-based runtimes starting in roughly twelve milliseconds with very small memory footprints allow enormous tenant density at network edge locations, which regional function architectures cannot match on latency at any price. Network presence across a very large number of locations is the asset rather than the compute itself. Storage and database services were built for that model rather than adapted.
CLOUDFLARE

Risk: Narrow runtime and service depth

Edge runtimes support a narrower environment than regional functions, and developers discover the limits after committing work rather than before, which produces frustration and occasional retreat. Managed service breadth is far smaller than hyperscale providers offer, so the binding depth that retains workloads is shallower. Enterprise procurement still treats the company as a network vendor rather than a compute platform.

Players Tracked

Prominent Players

Amazon Web Services
Microsoft
Google Cloud
Cloudflare
Alibaba Cloud

Other Key Players

IBM
Oracle
Tencent Cloud
Huawei Cloud
Vercel
Netlify
Fastly
Akamai
DigitalOcean
Supabase
Neon
PlanetScale
Temporal Technologies
Fermyon
Deno

Recent Developments

MAY 2025

Provider extends snapshot restore across additional function runtimes

A cloud provider extended snapshot-based initialisation to further language runtimes, reducing startup latency substantially, a product decision rather than any corporate transaction. Cold start had already ceased to be the principal objection raised by architects evaluating the model for production workloads. State remained the harder question.
Signal: Solving cold start thoroughly matters less than nobody expected, because state was always the real obstacle.
OCTOBER 2024

Durable execution platform completes substantial financing round

A durable execution platform company completed a substantial equity financing round, an investment rather than any acquisition or partnership. Long-running business workflows that function timeouts had always excluded were cited as the addressable problem rather than any improvement to compute performance itself. Execution timeouts were the specific barrier.
Signal: Investors are funding the state and workflow layer rather than anything to do with faster compute.
MARCH 2025

Provider introduces per-request pricing for managed database service

A cloud provider introduced consumption-based pricing for an existing managed database, a pricing decision rather than any new product. The underlying service was largely unchanged, and the revenue moved into serverless reporting categories purely because the invoice was calculated differently afterwards. Nothing underneath actually changed.
Signal: Serverless revenue can be created by changing an invoice, which is why category sizing is so soft.

Idle Capacity, Power And Engineering

Compute infrastructure accounts for roughly 41% of provider cost of service, idle capacity held for burst around 18%, power and cooling near 14%, and networking, engineering and operations the balance. The idle capacity line is what distinguishes this from provisioned hosting: a provider promising instant scaling must hold headroom that earns nothing, and IEA data centre energy reporting documents the power that idle footprint consumes regardless.
Server and accelerator pricing rose sharply through the period as artificial intelligence demand competed for the same manufacturing capacity, with SEMI industry reporting documenting the constraints involved. Data centre electricity costs rose in several major markets simultaneously. Providers absorbed both while competing on per-request pricing that customers compare closely, and margin compression appeared in segment disclosures across the period. Margin compression appeared in segment disclosures.

The disadvantage mechanism is scale rather than efficiency. Idle headroom as a proportion of total capacity falls as a provider grows, because a larger and more diverse workload mix smooths burst demand statistically, so a small provider carries proportionally far more unearning capacity. That is the mathematical reason this market concentrates at 82% and why smaller providers compete on niches rather than on general serverless compute at all.
server-less-computing-market-cost-volatility-analysis-1788417836271

Workload mix diversity smoothing burst demand

Serving many unrelated workloads with uncorrelated traffic patterns reduces the headroom needed for any given service level, since bursts rarely coincide across genuinely independent customers. That advantage compounds with scale and cannot be replicated by a smaller provider through any operational improvement whatsoever. It compounds with scale and explains why this market concentrates so heavily at the top.

Isolate-based runtimes raising tenant density

Lightweight isolate runtimes place far more tenants on a machine than container-based approaches allow, which cuts the infrastructure cost of holding capacity for burst substantially. The runtime environment is narrower and some workloads simply cannot run in it, which is the trade being made whether the provider says so or not. Some workloads cannot run there.

Committed use pricing against reserved infrastructure

Offering discounted rates for committed consumption lets a provider match its own reserved infrastructure commitments against predictable customer demand, reducing the headroom carried for that portion. It also retains workloads approaching the utilisation crossover that would otherwise leave for provisioned capacity entirely. It also retains workloads approaching the crossover that would otherwise leave for provisioned capacity.

Portfolio Architecture for Margin Defence

Margin separates by whether a workload stays. Small event-driven functions carry good gross margin and generate little revenue individually, and they persist indefinitely because they never approach the utilisation crossover. Large workloads generate substantial revenue at thinner margin and around 27% of them leave for provisioned capacity, which means the revenue looks attractive right up to the point where it disappears from the category entirely.
The volume against premium tension runs through binding depth rather than product mix. Functions alone are close to commodity and every provider offers adequate ones, while the surrounding managed services are what make them useful and what make leaving expensive. A provider competing on function pricing is competing on the part with no defensibility. The providers doing best treat compute as an entry point and the bindings around it as the product.

High-value pools sit where the state problem is being solved: serverless databases, durable execution and edge data services. Each addresses what actually blocked adoption rather than what was discussed for a decade, and each creates coupling that compute alone never produced. These pools are growing fastest, carry better retention and are contested by specialists rather than only by the hyperscale providers.

Volume / Commodity-Adjacent

Function execution and basic serverless container capacity, where every provider offers adequate performance and pricing is compared directly. Margin depends on infrastructure scale and headroom efficiency rather than on anything customers can distinguish.
Gross Margin: 42 to 54%

Premium / Certified

Serverless integration, messaging and application services that give functions something useful to connect to. The 12 point range reflects how much of the surrounding managed service portfolio a provider actually holds rather than resells.
Gross Margin: 56 to 68%

Sustainability / Regulatory / Next-Generation

Serverless databases, durable execution and edge data services addressing state directly. The 14 point range reflects how completely solving the state problem changes both retention and pricing power against compute alone.
Gross Margin: 64 to 78%
server-less-computing-market-portfolio-architecture-1788417836987

High-value Sub-segments and Strategic Watch-out

Serverless Data Services

Addresses what actually blocked adoption for a decade, since only around 18% of applications need no persistent state at all. Specialists building for consumption billing from scratch handle it more elegantly than adapted services do. Retention here is far better than on compute alone, because the coupling is genuine.
Gross Margin: 66 to 78%

Durable Execution Layers

Opens long-running workflows that execution timeouts had always excluded entirely, and restores a readable sequence to distributed work. No hyperscale provider owns this layer outright, which is unusual in cloud infrastructure. Order processing, onboarding and approvals all become candidates for the first time. Nobody owns this layer.
Gross Margin: 62 to 74%

Managed Service Bindings

The roughly nine services a production function couples to are what make migration expensive and retention possible. Providers competing on function pricing instead are competing on the one part with no defensibility at all. Integration depth improves retention more effectively than any pricing action available.
Gross Margin: 56 to 68%

Basic Function Execution

Adequate from every provider and compared directly on price, with margin resting on infrastructure scale rather than on capability. Necessary as an entry point rather than attractive as a business in its own right. Every provider offers it and buyers compare the price directly. Scale decides the margin.
Gross Margin: 42 to 54%

How Workloads Arrive And Leave

Annuity economics here are unusual because individual workloads have a natural lifetime rather than an indefinite one. A small function persists for years and generates very little. A successful application generates a great deal and then crosses the utilisation threshold and departs, taking around 27% of workloads with it over time. Growth therefore depends on creating new workloads faster than successful ones leave, which is a treadmill rather than an accumulation.
Adoption depth varies sharply by team type. Small teams and startups adopt wholesale because capacity planning is work they cannot afford to do, and they couple deeply without noticing. Enterprise platform teams adopt selectively for event handling and integration while keeping core applications on provisioned capacity deliberately. Regulated organisations adopt where data residency permits and avoid edge execution where the processing location matters legally.

The buyer profile has moved from developer to platform team and then partly to finance. Individual developers adopted serverless because it removed operational work they disliked, platform teams then standardised or restricted it, and finance functions now examine consumption bills closely enough to trigger the repatriation decisions that define this market's retention. All three still influence adoption and they want genuinely different things.
server-less-computing-market-end-use-penetration-index-1788417837581

Where Providers Should Compete

These are among the four positions where our research anticipates prominent divergence between winners and laggards over the coming forecast period. Each is grounded in the demand model, the regulatory perimeter, and the announced capacity pipeline.
01 / STATE PROBLEM OWNERSHIP

Compete on data services, not on function speed

Only around 18% of applications genuinely need no persistent state, which meant that stateless functions on their own were never going to carry serious workloads however quickly they happened to start up. Databases billed per request and able to scale to zero remove the one component that always had to be provisioned, and that segment grows at 23.7% against a market at 15.8%. Providers still competing on cold start are carefully optimising something that no customer anywhere measures any more.
02 / CROSSOVER PRICING RESPONSE

Keep workloads that outgrow consumption billing

Consumption billing loses out to provisioned capacity above roughly 34% utilisation, and around 27% of workloads depart once they cross that point, which is simply the pricing model behaving exactly as its own arithmetic dictates it should. Tiered rates at higher volume, committed use arrangements and hybrid provisioned concurrency together all retain revenue that would otherwise disappear from this category entirely. Providers who describe this as customers simply outgrowing a tier are describing a choice that they made entirely themselves.
03 / BINDING DEPTH INVESTMENT

Sell the surrounding services, not the runtime

A single production function typically couples to around nine separate provider services for events, identity, queuing, storage, secrets and observability, and rewriting those bindings takes months while rewriting the function itself takes barely an afternoon of work. That asymmetry is precisely what makes this category so commercially attractive to a provider, and it is very rarely stated aloud to anybody. Providers that add genuine integration depth improve their retention far more effectively than any pricing action available to them ever will.
04 / DURABLE EXECUTION POSITIONING

Own the workflow layer nobody has claimed yet

Business processes running for hours, days or even months on end never fitted a function model bounded by execution timeouts, and durable execution frameworks that persist their progress across restarts remove that limitation completely. That opens order processing, onboarding, claims handling and approval workflows which have never once been serious candidates for consumption billing at all. It also restores a readable sequence to distributed work, which also addresses the debugging difficulty that otherwise sends teams straight back to conventional architectures.

Engagement Snapshot From the Field

A live engagement with an industry participant carrying material or product regulatory and market exposure ahead of a defining policy shift, showing how our research translates into a defensible multi-year portfolio strategy.
MARKET MINDS ADVISORY · CLIENT ENGAGEMENT SUMMARY
Server Less Computing Producer Strategic Portfolio Review and Transition Roadmap 2026·Investment Scenario on Server Less Computing Exposure Evaluation 2025-26
CLIENT PROFILE
A European business software company serving enterprise customers across fourteen separate markets, with annual group revenue reported at approximately USD 620 million (client-reported, unverified by MMA). The engineering organisation had adopted serverless very broadly across all new development, and infrastructure cost per customer had risen for six consecutive quarters without anyone establishing why that was.
STRATEGIC CHALLENGE
Finance had begun questioning cloud spend while engineering insisted serverless was cheaper, and both positions were supported by figures neither side could reconcile with the other. A proposal to move substantial workloads back to provisioned capacity was contested on the grounds that it would reintroduce operational work the company had deliberately eliminated.
MMA APPROACH
MMA measured utilisation across every serverless workload against the crossover where provisioned capacity becomes cheaper, quantified the engineering cost of migration including the managed service bindings each workload had acquired, and assessed which workloads would cross the threshold within the following two years rather than only which already had. Binding counts were measured directly.
KEY FINDINGS
  1. Around a third of workloads by spend sat above 34% utilisation and were demonstrably more expensive on consumption billing than they would have been on provisioned capacity.
  2. Those workloads had each acquired roughly nine managed service bindings, so migration cost far more in engineering time than the annual saving would recover within any sensible period.
  3. Both engineering and finance were correct simultaneously, since serverless was cheaper for the majority of workloads by count and more expensive for the minority carrying most of the spend.
  4. Newly built workloads were crossing the utilisation threshold within eighteen months on average, which meant the problem would recur regardless of any one-off migration decision taken now.
CLIENT PROFILE
A European business software company serving enterprise customers across fourteen separate markets, with annual group revenue reported at approximately USD 620 million (client-reported, unverified by MMA). The engineering organisation had adopted serverless very broadly across all new development, and infrastructure cost per customer had risen for six consecutive quarters without anyone establishing why that was.
STRATEGIC CHALLENGE
Finance had begun questioning cloud spend while engineering insisted serverless was cheaper, and both positions were supported by figures neither side could reconcile with the other. A proposal to move substantial workloads back to provisioned capacity was contested on the grounds that it would reintroduce operational work the company had deliberately eliminated.
MMA APPROACH
MMA measured utilisation across every serverless workload against the crossover where provisioned capacity becomes cheaper, quantified the engineering cost of migration including the managed service bindings each workload had acquired, and assessed which workloads would cross the threshold within the following two years rather than only which already had. Binding counts were measured directly.
KEY FINDINGS
  1. Around a third of workloads by spend sat above 34% utilisation and were demonstrably more expensive on consumption billing than they would have been on provisioned capacity.
  2. Those workloads had each acquired roughly nine managed service bindings, so migration cost far more in engineering time than the annual saving would recover within any sensible period.
  3. Both engineering and finance were correct simultaneously, since serverless was cheaper for the majority of workloads by count and more expensive for the minority carrying most of the spend.
  4. Newly built workloads were crossing the utilisation threshold within eighteen months on average, which meant the problem would recur regardless of any one-off migration decision taken now.
RECOMMENDED STRATEGY
Phase 1: Phase one: negotiate committed use pricing covering the high utilisation workloads rather than migrating them and rebuilding their service bindings. Phase 2: Phase two: introduce a utilisation review at design time so new workloads expected to become steady are built on provisioned capacity from the outset. Phase 3: Phase three: keep event-driven and spiky workloads on consumption billing permanently, since they never approach the crossover point at all.
OUTCOME
Within eight months the client had secured committed use terms, introduced a design-time utilisation review, and reported infrastructure cost per customer down 19% without migrating a single existing workload (client-reported, unverified by MMA). Engineering and finance now use the same utilisation measure in every architecture review.

Frequently Asked Questions

Foundational context covering the market sizes, CAGR, scope, country, region and competition that inform every finding below. This section is provided to cover basics and most often pre-purchase conversations, answered from the MMA Primary Research Dataset.

What is the current size of the Server Less Computing Market?

The market was valued at USD 18.0 billion in 2025 and reaches USD 20.84 billion in 2026. Serverless is a billing model, which makes category sizing softer than it appears.

How large will the Server Less Computing Market be by 2036?

MMA forecasts USD 90.34 billion by 2036, an increase of USD 69.50 billion over the 2026 base. That represents an expansion multiple of 4.33 times.

What is the CAGR for the Server Less Computing Market 2026 to 2036?

The base case CAGR is 15.8%, with a bull case of 17.0% and a bear case of 14.6%. The historical rate between 2020 and 2025 was 14.6%.

Which segment is growing fastest?

Serverless databases and data services grow at 23.7%, half again the market rate of 15.8%. State rather than compute was always the obstacle blocking real adoption.

Who are the major companies in the Server Less Computing Market?

Amazon Web Services, Microsoft, Google Cloud, Cloudflare and Alibaba Cloud lead on measured service revenue. Together they account for roughly 82% of a highly concentrated market.

Which country is growing fastest?

India grows fastest at 21.8%, on the largest developer population outside the United States building new applications that default to consumption billing rather than provisioning.

Report Segmentation Architecture

The full report scope spans multiple orthogonal segmentation dimensions, with cross-tabulated demand data provided for each dimension pair. Coverage extends further to regional breakdowns, trend trajectories, and the competitive detail needed to support segment-level decision-making.

By Service Type

  • Function as a Service
  • Serverless Container Platforms
  • Serverless Databases and Data Services
  • Edge Function Runtimes
  • Serverless Application Integration
  • Durable and Stateful Execution Services

By End-Use Industry

  • Software and Internet Companies
  • Banking and Financial Services
  • Retail and Consumer
  • Media and Entertainment
  • Healthcare and Life Sciences
  • Public Sector and Government

By Workload Pattern and Buying Function

  • Event-Driven and Spiky Workloads
  • Scheduled and Batch Processing
  • Request Handling at Edge
  • Developer Self-Service Adoption
  • Platform Team Standardisation
  • Committed Use Procurement

By Region

  • North America
  • Western Europe
  • East Asia
  • South Asia and Pacific
  • Latin America
  • Middle East and Africa
  • Eastern Europe

Scope, Methodology, and Coverage

Every figure in this report is reproducible from documented input assumptions. The scope below maps the historical period, the forecast horizon, the segmentation dimensions, and the countries covered, alongside the underlying primary and qualitative methodology.
Historical Period
2020 to 2025
Forecast Period
2026 to 2036
Base Year
2025 (USD billions; MMA Primary Research Dataset, September 2026)
Market Definition
The serverless computing market covers cloud services billed on actual consumption rather than provisioned capacity, where the provider manages scaling, availability and infrastructure entirely, spanning function as a service, serverless container platforms, serverless databases and data services, edge function runtimes, serverless application integration, and durable stateful execution services. Sizing is measured at provider service revenue. Provisioned virtual machines, reserved capacity, managed Kubernetes with provisioned nodes, storage billed by volume and software licensed independently are excluded.
Quantitative Units
USD billions at provider service revenue, with supporting workload counts and utilisation distributions by region
Segmentation Dimensions
Service type, end-use industry, workload pattern and buying function, region
Regions Covered
North America, Western Europe, East Asia, South Asia and Pacific, Latin America, Middle East and Africa, Eastern Europe
Countries Covered
United States, Canada, Mexico, Brazil, United Kingdom, Germany, France, Netherlands, Ireland, Poland, China, Japan, South Korea, India, Singapore, Australia, United Arab Emirates, South Africa
Key Companies Profiled
Amazon Web Services, Microsoft, Google Cloud, Cloudflare, Alibaba Cloud, IBM, Oracle, Tencent Cloud, Huawei Cloud, Vercel, Netlify, Fastly, Akamai, DigitalOcean, Supabase, Neon, PlanetScale, Temporal Technologies, Fermyon, Deno
Quantitative Methodology
Primary survey, n=3,800 respondents, Q4 2025, six countries; demand-side model with trade association cross-validation
Qualitative Methodology
47 expert interviews, Q4 2025; applied to validate demand model assumptions, identify emerging dynamics, and assess competitive positioning
Report Format
PDF and XLSX data workbook (Word format preview document)
Publisher
Market Minds Advisory
Report Code
MMA-2026-TEC-731
Published
September 2026
Contact
sales@marketmindsadvisory.com | www.marketmindsadvisory.com

Purchase the full Server Less Computing Market Report (2026 to 2036).

The full report treats serverless as a billing model with operational consequences rather than as a technology category, which is the framing that explains why sizing varies so widely between published estimates. It covers six service types with individual growth rates, seven regions built from cloud consumption and application creation, and the utilisation crossover that sends successful workloads back to provisioned capacity. Competitive analysis covers twenty providers on a consistent service revenue basis, with managed service binding depth and data service capability treated as the decisive variables. Input cost modelling breaks out infrastructure, idle headroom and power exposure by provider scale.
Six service types with individual growth rates
Utilisation crossover modelled against workload lifetime
Repatriation rates measured by workload category
Managed service binding depth compared across providers
Twenty providers on consistent service revenue basis
Infrastructure, idle headroom and power cost exposure

Built For The People Who Decide

From boardroom strategy to bench-side execution, this report is read cover-to-cover by leaders shaping the next decade of their industry, turning demand scenarios, market dynamics and valuation benchmarks into decisions.
CXOs/ Presidents/ VPs/ Managers
M&A and Corporate Development
Strategy Teams and R&D Heads
Procurement and Product Directors
Regulatory and Compliance Leaders
Investor Relations and Equity Analysts