Market Minds Advisory
Sensors Market

Sensors Market: Sensors Market: Design-In Economics, Modality Divergence and Why Component Revenue Follows Somebody Else's Production Plan

Sensor revenue is a derivative of vehicle and handset production plans the suppliers do not influence, and price erosion near six percent a year removes the reward for winning on sensing performance alone.

Lead Analyst

Published

September 2026

Make Smarter Decisions with Customized Research Insights

Request a free sample report and evaluate market opportunities, growth trends, and competitive dynamics relevant to your business needs.

2025 MARKET VALUE$245.0BMarket Size 2025
2036 FORECAST VALUE$548.4BBase Case , 2026 to 2036
CAGR 2026 TO 20367.6 %Bull 8.8% / Bear 6.4%
INCREMENTAL OPPORTUNITY$284.8BNet 10- year value creation
EXPANSION MULTIPLE2.08x2036 value over 2026 base
Strategic Levers
M&A Pipeline
Regional Outlook
Country Rankings
Competitive Intelligence
Segmental Deep-dive
Call-Us : 91 93563 13602

Executive Snapshot and Market Trajectory.

Calling this one market is a convenience of report titles rather than a description of anything. Image sensors, pressure transducers and gas detectors share a definition and almost nothing commercially, and each behaves like a separate component business. Treating them as one business is where strategy goes wrong.
What they do share is a dependency. Roughly 61% of volume is set by vehicle and handset production plans that no sensor supplier influences, and mature components lose about 6% of price a year regardless of how well they perform. Growth is escaping into chemical, gas and biosensors at 11.4%, half again the market rate of 7.6%. East Asia takes 41% of the total, because that is simply where the devices get built.
Concentration is low at roughly 26% across the top five on measured component revenue, and that number is misleading in an interesting way. Within any single modality the field is tight, often three or four credible suppliers. Across modalities almost nobody competes with almost anybody, which is why the aggregate looks fragmented when it is not. Strategy built on the aggregate figure is usually wrong. Each contest is tight.
Market Definition
This market covers discrete sensing devices and sensor modules sold as components or subassemblies, spanning image and optical, pressure and force, inertial and motion, chemical, gas and biological, temperature and thermal, and position, proximity and level sensing. Revenue is measured as component shipment value at supplier level. Complete measurement instruments, laboratory analysers, standalone test equipment, sensor fusion software, calibration services and finished devices incorporating sensors are excluded.
Base Year Value
$245.0B in 2025 (MMA Primary Research Dataset, September 2026)
Forecast Period
2026 to 2036, eleven discrete annual values
CAGR
7.6% base case. Bull 8.8%. Bear 6.4%.
Fastest Growth Segment
Chemical, Gas and Biosensors: 11.4% CAGR
Fastest Growth Country
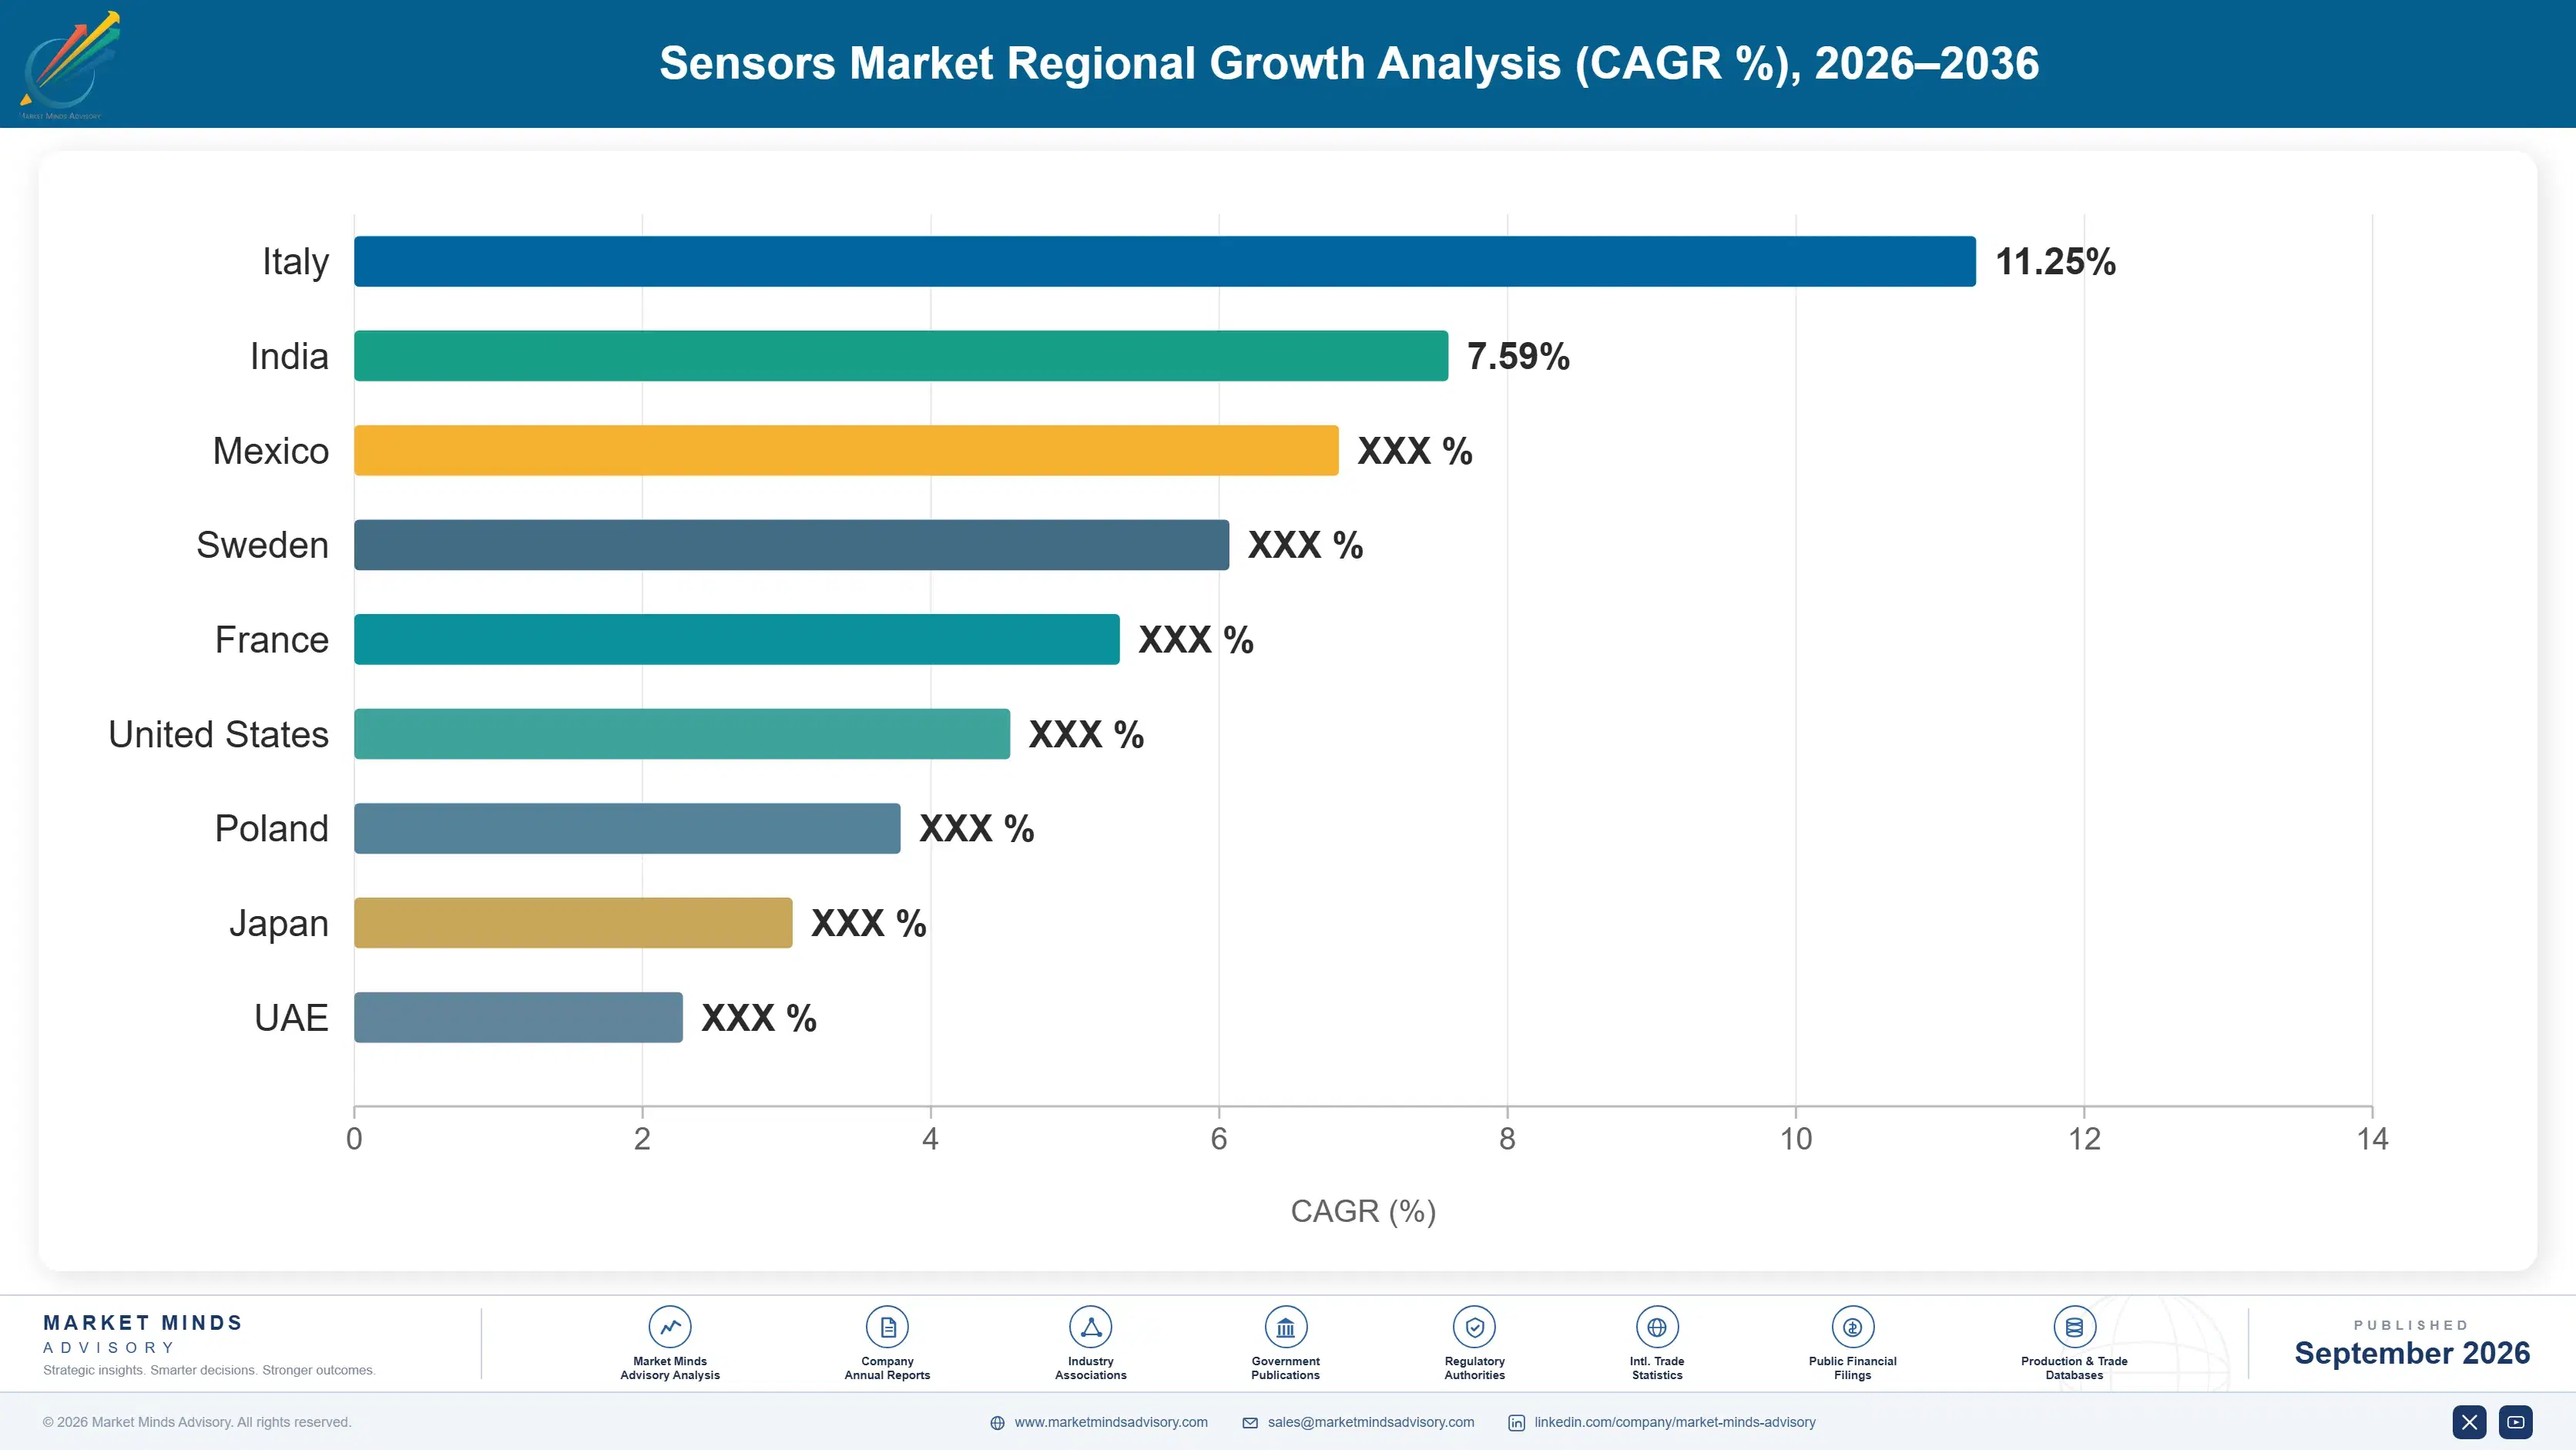
India: 12.4% CAGR
Fastest Growth Region
South Asia and Pacific: 9.8% CAGR
Largest Region
East Asia: 41% of 2025 global value
Market Leaders
Sony, Robert Bosch, TE Connectivity, STMicroelectronics and Honeywell International lead on measured sensor component shipment revenue. Source: MMA Primary Research Dataset, July 2026.
Primary Survey
n=3,800 procurement and R&D decision-makers, Q4 2025, six countries
Methodology
Demand-side build-up, cross-validated against public data, 47 expert interviews

Sensors Market Forecast Scenarios

sensors-market-size-forecast-scenario-1788419679227
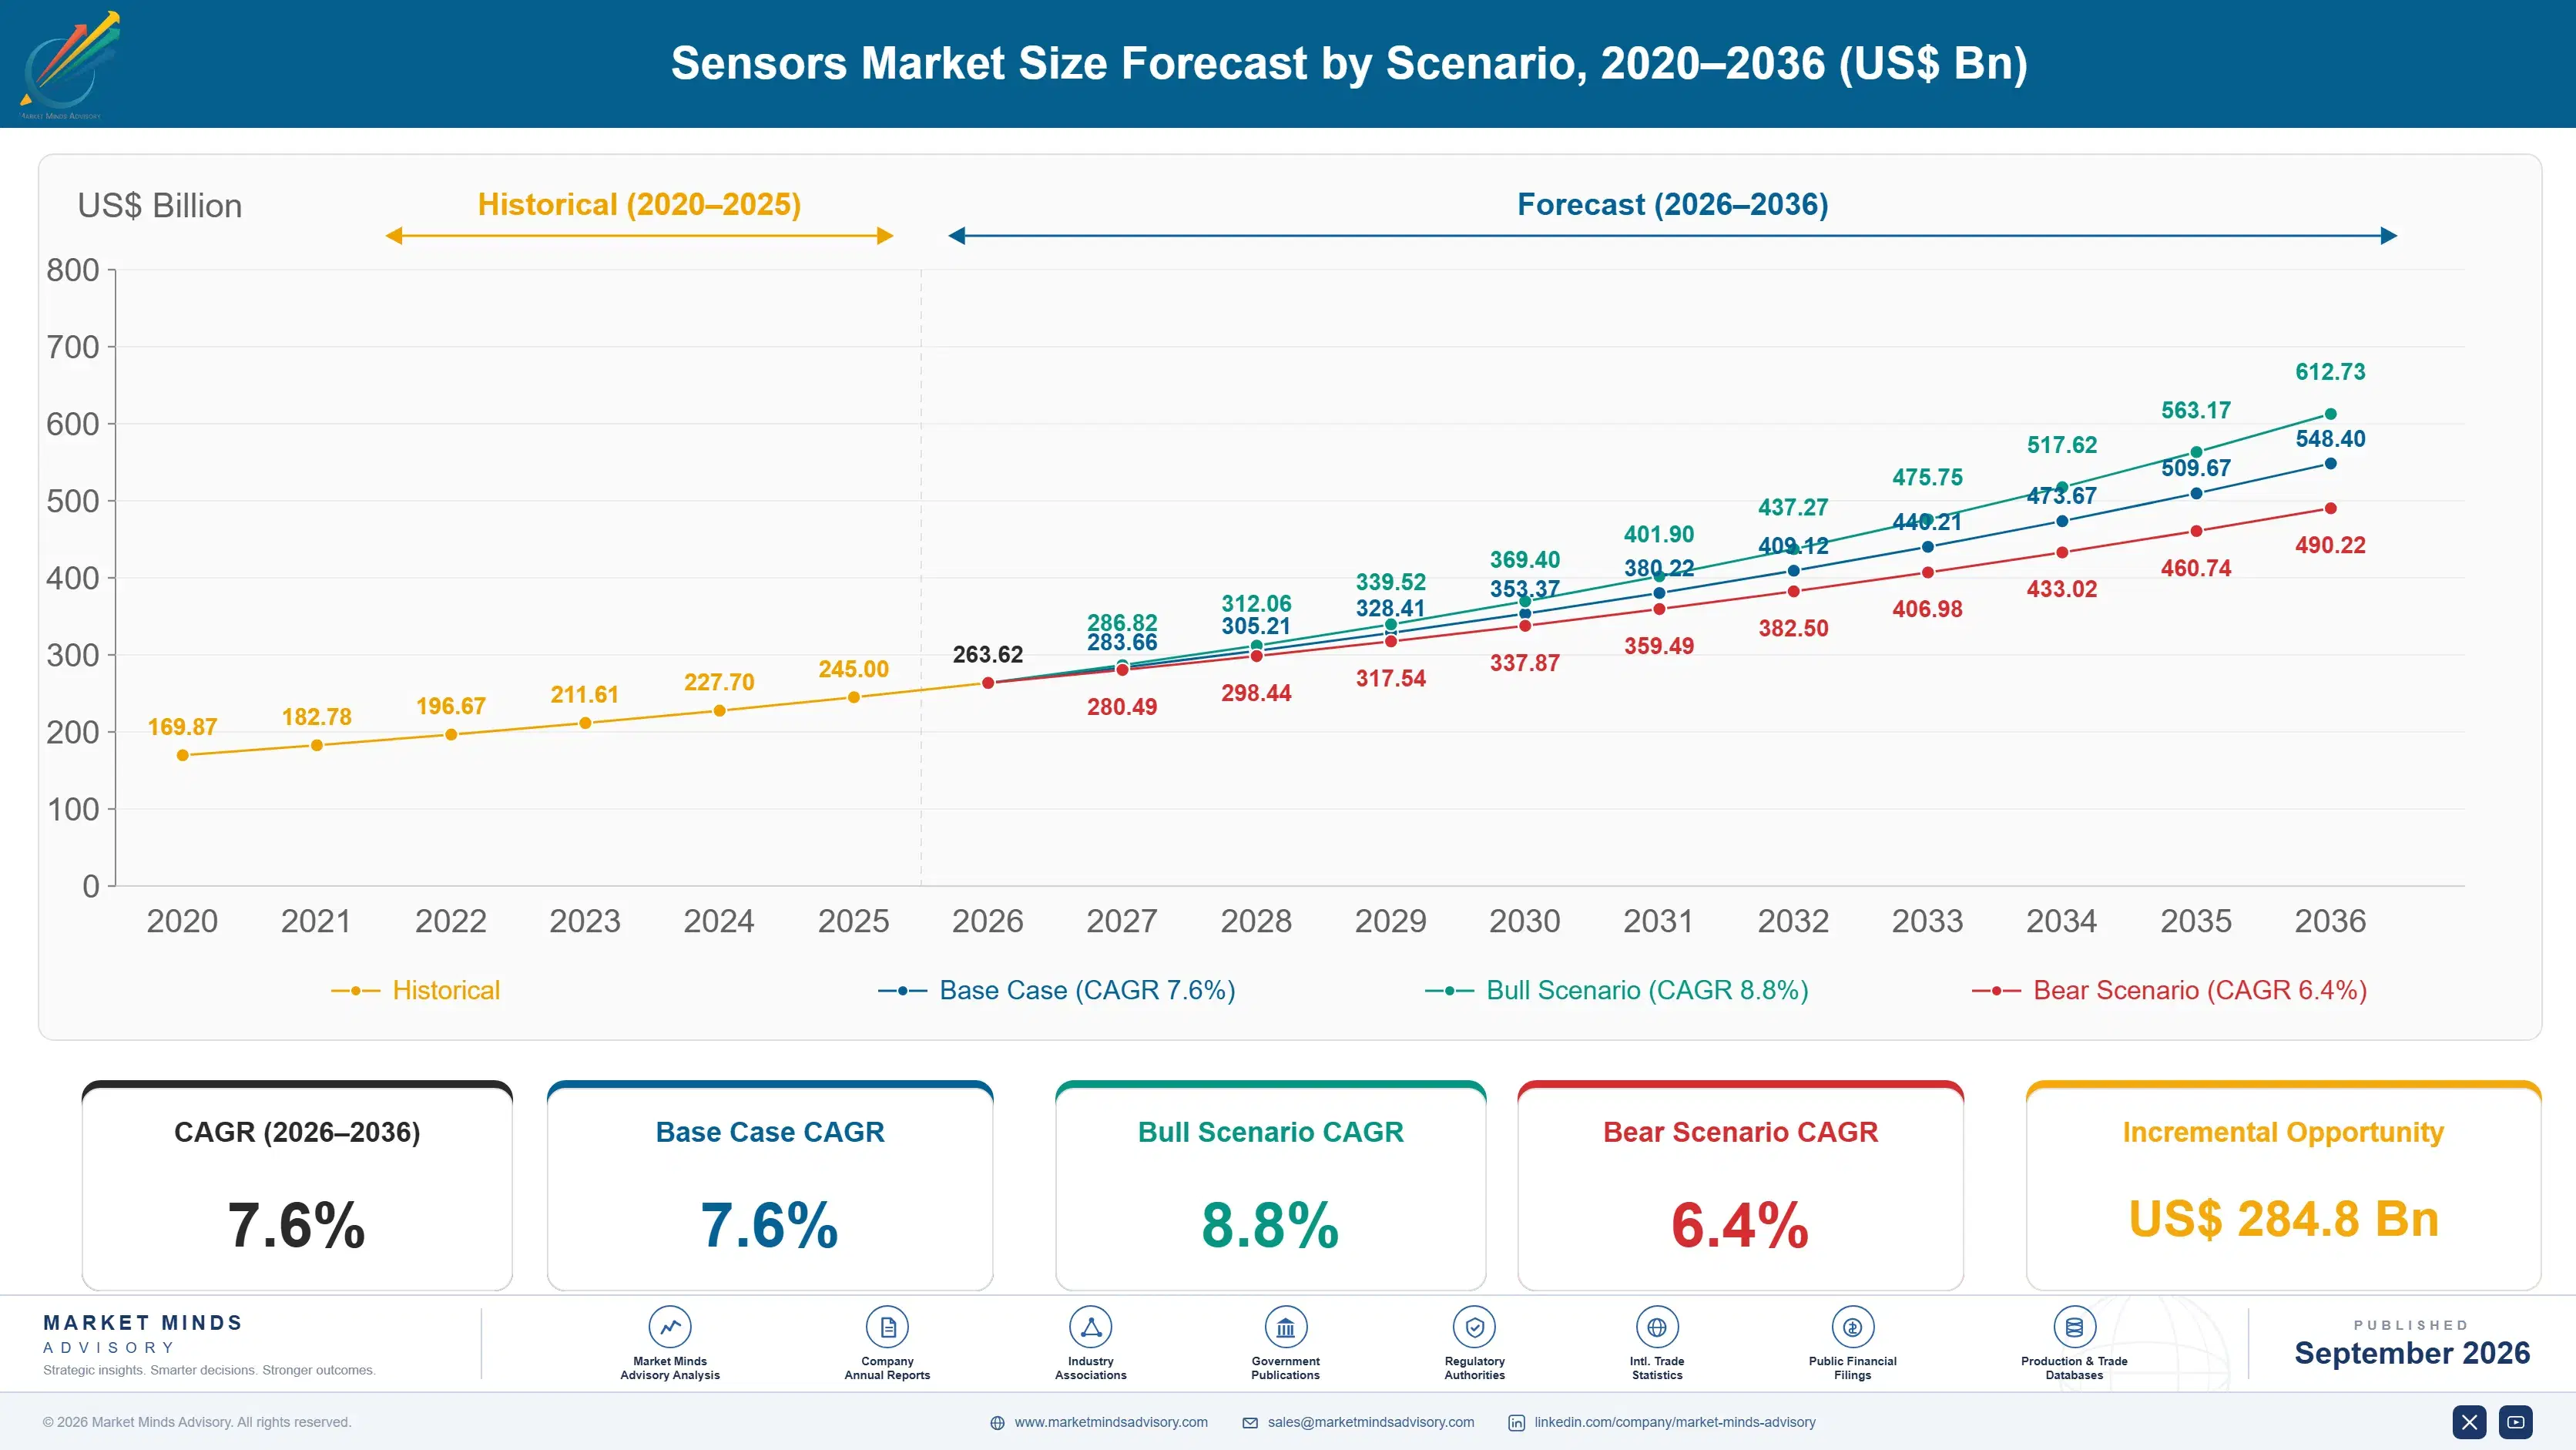
Growth ran at 6.6% from 2020 to 2025 on a path that was anything but smooth. Shortage conditions through 2021 and 2022 let suppliers price freely and pulled orders forward across automotive and industrial customers. The correction that followed was severe: automotive inventory unwound through 2024, industrial demand softened alongside it, and several suppliers spent 2025 shipping below end demand while customers worked down over-ordered stock.
The base case at 7.6% rests on three mechanisms. Sensor content per vehicle keeps rising, now near 78 units, as driver assistance, thermal management and battery monitoring add sensing combustion platforms never carried. Industrial and medical applications are growing faster than consumer ones and pay multiples of consumer prices for lower volumes. Third, chemical and gas sensing is moving from specialist instrumentation into buildings, vehicles and wearables, a genuinely new volume pool.
The bull case at 8.8% assumes vehicle electrification proceeds at announced rates, since battery and thermal monitoring add sensor content faster than any other automotive change. The bear case at 6.4% is a consumer electronics plateau combined with price erosion accelerating past 6%. Suppliers have no defence against either. Suppliers sit tiers below the decisions setting both, and learn about changes late.

Component Revenue Follows Production Plans Elsewhere

The commercial reality of a sensor business is that somebody else decides how much revenue it earns. Around 61% of volume is governed by vehicle build rates and handset shipment plans, and suppliers learn about changes to those plans through order adjustments rather than consultation. Forecasting is consequently poor, and the correction through 2024 and 2025 demonstrated exactly how poor.
TOP FIVE CONCENTRATION26%Fragmented across modalities with few genuinely overlapping competitors
DESIGN WIN CYCLE19 monthsTime from evaluation to volume production on a platform
AUTOMOTIVE CONSUMER SHARE61%Portion of volume set by vehicle and handset production
AVERAGE UNIT PRICEUSD 1.42Mean price across all modalities and application categories
ANNUAL PRICE EROSION6%Typical yearly decline on mature high volume components
SENSORS PER VEHICLE78Average count fitted across a modern passenger car
Design-in rather than performance is what determines who wins. A sensor qualified into a vehicle platform or handset design ships for the life of that programme, typically five to seven years in automotive and eighteen months in consumer, and displacing it means requalifying a safety-relevant part. That takes about 19 months from evaluation to volume. Suppliers therefore compete hardest at moments that occur rarely and then defend positions that renew automatically.
Price erosion near 6% a year on mature components is the constant that shapes everything else. A supplier holding a design win must cut cost faster than price falls or watch a profitable position turn loss-making. That pressure is why modality specialisation persists: a firm that understands one sensing physics deeply can engineer cost out of it, while a generalist across six cannot do it anywhere.
"The sensor industry keeps being described as a technology business and it behaves like a manufacturing one. What separates the profitable firms from the rest is not sensing performance at all; it is whether they can take six percent of cost out every year without the customer noticing anything change."
Director, Electronic Components and Sensing Practice · MMA Technology Practice · September 2026

Market Trends

Chemical and Gas Sensing Escapes Specialist Instrumentation

Gas and chemical sensing lived inside laboratory and industrial safety instruments for decades, at prices that ruled out any embedded application. Miniaturised metal oxide and electrochemical devices changed that, and the sensors now appear in building ventilation controls, vehicle cabin air management, refrigeration monitoring and consumer wearables. It is the fastest part of this market at 11.4%. The commercial character is unlike the rest of the industry: selectivity and drift matter more than price, calibration is a recurring obligation rather than a factory step, and customers accept unit costs that would be impossible in inertial or pressure sensing.
Market Impact: Adds 30 sensors per electric platform
Automotive Sensor Content Rises Faster Than Vehicle Volumes

Vehicle production has been broadly flat for several years while sensor content per car has climbed toward 78 units, which decouples supplier revenue from build rates for the first time. Driver assistance adds cameras, radar and ultrasonic devices; electrification adds battery cell monitoring, current sensing and far more thermal measurement than a combustion platform required; and cabin monitoring regulations add occupant sensing. Suppliers positioned on electrified platforms are growing while those anchored to powertrain sensing on combustion vehicles are managing decline, and the two look identical in aggregate statistics. Aggregate figures conceal that divergence completely.
Market Impact: Prices run 8 times consumer levels

Market Opportunities and Growth Drivers

Electrification Adds Sensing That Combustion Platforms Never Carried

Battery electric platforms require cell voltage and temperature monitoring at module level, high-current measurement on the traction path, coolant and refrigerant sensing across a thermal system far more complex than a radiator, and insulation monitoring for safety compliance. None of this existed on a combustion vehicle. The result is that a battery electric car carries meaningfully more sensing content than the vehicle it replaces even before driver assistance is counted. Suppliers holding positions on electrified platforms grow regardless of whether total vehicle production moves at all. Content growth is doing the work that volume growth no longer does.
Market Impact: Erodes 6% of price annually

Industrial Condition Monitoring Moves From Sampling to Continuous

Rotating equipment monitoring historically relied on periodic manual measurement because permanent instrumentation was too expensive to justify across a plant. Falling sensor and wireless costs inverted that, and continuous vibration, temperature and acoustic monitoring now installs across pumps, motors, compressors and gearboxes as standard practice in process industries. Unit volumes are modest against automotive but prices run several times consumer levels and replacement is driven by plant maintenance cycles rather than by product refresh. Suppliers value the segment for margin stability rather than for growth rate. Replacement follows plant shutdown schedules rather than any product cycle.
Market Impact: Correction ran across 2 years

Market Restraints and Challenges

Price Erosion Outruns Cost Reduction on Mature Components

Mature high volume sensors lose roughly 6% of price a year, and a supplier that cannot remove cost at the same rate watches a profitable design win become a loss across a platform life. The root cause is that customers negotiate annual reductions as a condition of continued supply and have alternatives qualified for exactly that purpose. Commercially this punishes generalists hardest, since cost engineering requires depth in one sensing physics. Suppliers mitigate through wafer size transitions, package simplification, test time reduction and moving assembly toward lower cost locations. Depth in one physics is what makes that possible.
Market Impact: Fastest segment at 11.4% growth

Customer Production Plans Are Invisible Until Orders Change

Suppliers discover shifts in vehicle build rates and handset volumes through order adjustments rather than through any forward consultation, which makes capacity and inventory planning close to guesswork. The root cause is that sensor suppliers sit two or three tiers below the production decision and customers treat forward plans as commercially sensitive. The 2024 and 2025 inventory correction demonstrated the cost precisely. Mitigation efforts centre on consignment arrangements, capacity reservation agreements with take-or-pay terms and diversifying into industrial and medical applications with different cycles. Buyers accept such terms only during shortages, which limits the window sharply.
Market Impact: Content reaches 78 units per vehicle
3 additional market trends, 4 additional growth drivers, and 2 additional restraints and challenges are covered in the full report. Contact sales@marketmindsadvisory.com to access the complete intelligence.

Segment CAGR and Growth Architecture

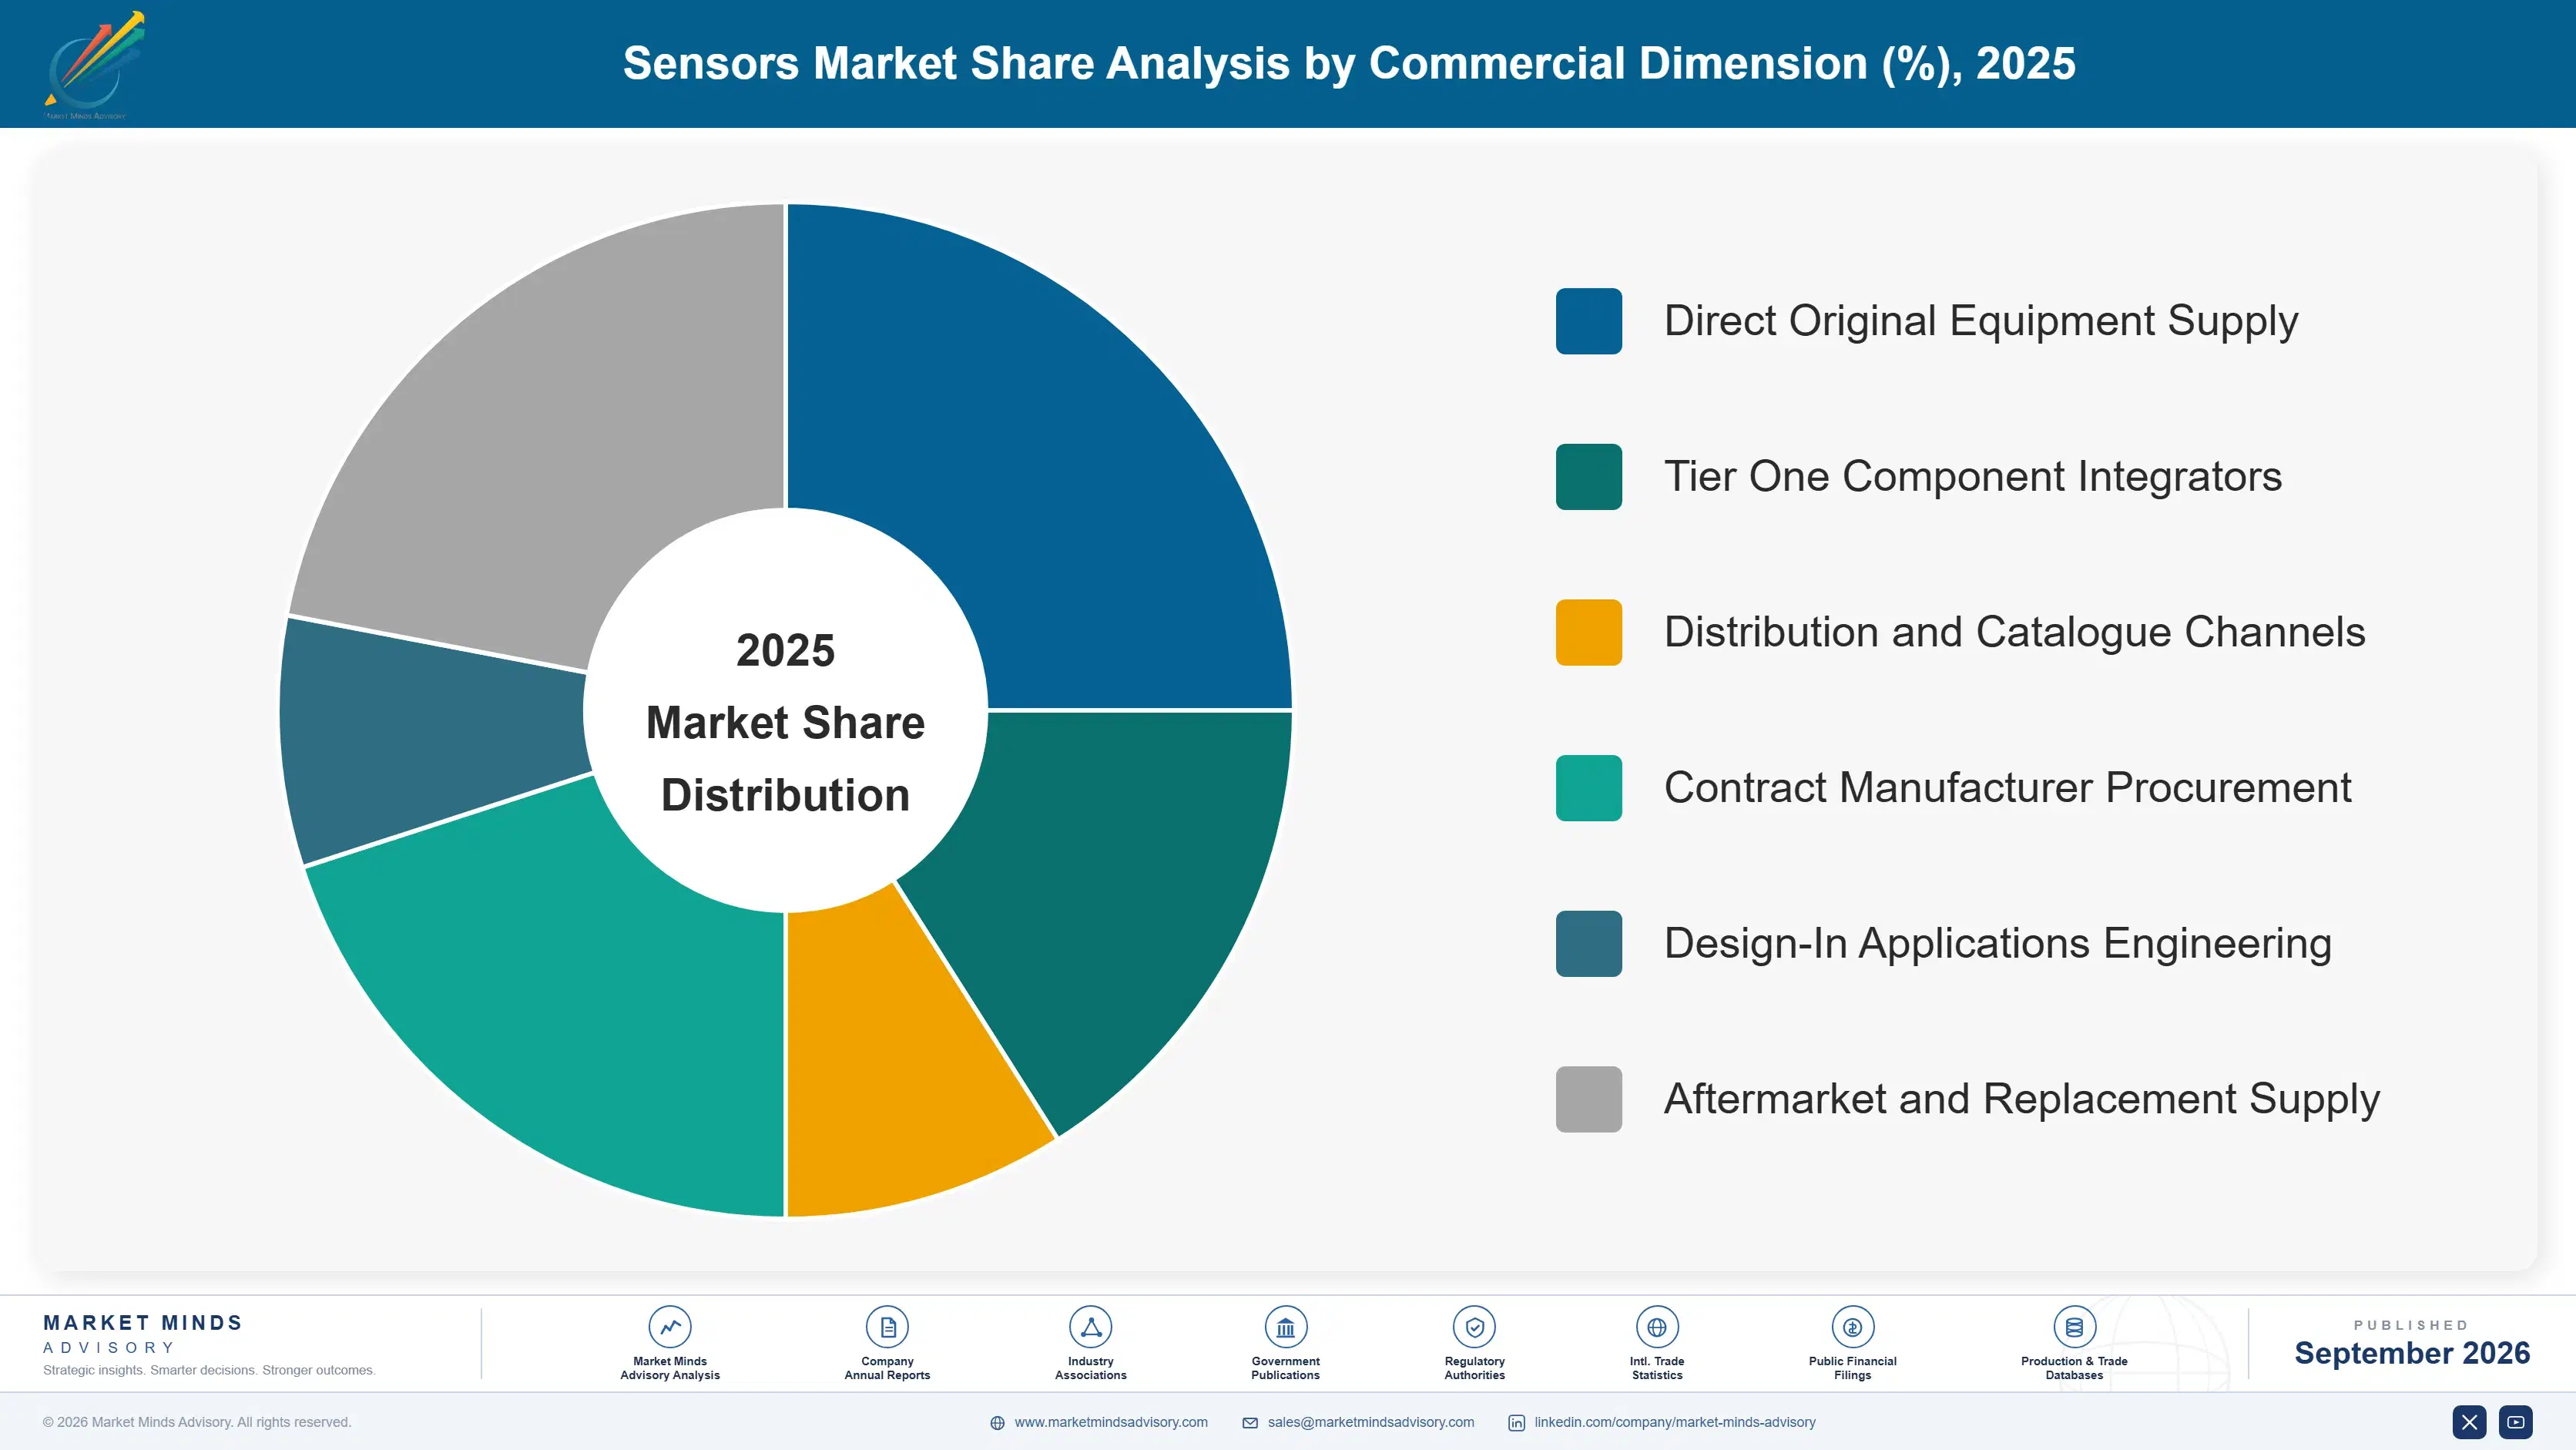
Segmentation follows sensing modality, because the physics determines the manufacturing process, the cost structure and the competitive set, and almost no supplier competes seriously across more than two or three. Growth divergence between modalities is wide enough that aggregate market figures conceal more than they reveal about any individual business. Aggregates conceal more than they show.
sensors-market-market-share-analysis-1788419679779

Chemical, Gas and Biosensors

This modality grows at 11.4%, half again the market rate of 7.6%, and it is the least like the rest of the industry commercially. Miniaturised metal oxide, electrochemical and optical devices have moved gas sensing out of specialist instrumentation into building ventilation, vehicle cabin management, refrigeration monitoring and wearables. Selectivity and long-term drift matter far more than unit price here, which supports margins the volume modalities cannot approach. Calibration is a recurring obligation rather than a factory step, creating replacement demand that pressure and inertial sensors simply do not generate. Biosensing for continuous glucose and other diagnostic applications sits within the same manufacturing base and carries the highest prices anywhere in this market.
CAGR 11.4%

Position, Proximity and Level Sensors

Position, proximity and level sensing grows at 9.0% on industrial automation demand rather than on consumer volumes, which gives it a different cyclical character to most of this market. Magnetic, inductive, capacitive, ultrasonic and radar level devices all sit here, serving factory automation, process industries, logistics handling and building systems. Prices run well above consumer components and design cycles are longer, with replacement driven by plant maintenance rather than product refresh. Competition is regional and application-specific rather than global, since specification practices and approval requirements differ by industry and jurisdiction, which protects established suppliers in ways that consumer modalities never experience. Approval and specification practice differ enough by jurisdiction that global competition rarely materialises here.
CAGR 9.0%
Full segment breakdown across 6 segments available in the complete report.

Regional Architecture and Country Demand Map

Regional demand follows where electronic devices and vehicles are physically assembled, not where they are designed or sold. Component consumption concentrates far more tightly than end product demand does, which is why the distribution looks unlike almost any other technology market. Design location tells you almost nothing.

East Asia

East Asia holds 41%, well above the regional band, and the justification is that sensors are consumed where products are assembled rather than where they are designed. Chinese electronics and vehicle assembly absorb the largest component volumes anywhere, and domestic sensor suppliers have taken substantial share in image, pressure and proximity devices over the past five years. Japanese suppliers remain dominant in image sensing and passive components and sell globally from a regional manufacturing base. Korean and Taiwanese handset, display and battery manufacturing add further concentrated demand. Regional growth at 8.6% runs ahead of the market on electrification and industrial automation together. Component distribution and stocking infrastructure across the region is also the deepest anywhere, which reinforces the concentration further.
Share: 41% | CAGR: 8.6% (2026 to 2036)

North America

North America holds 20%, below the regional band, because volume electronics assembly left the region decades ago and vehicle production, while substantial, is smaller than East Asian output. What remains is high value: aerospace, defence, medical device and industrial process sensing all pay multiples of consumer prices and specify components designed here even when assembly happens elsewhere. Medical sensing is particularly concentrated, with continuous monitoring and diagnostic device manufacture supporting the highest unit prices in the market. Semiconductor fabrication investment under federal incentives is adding process control sensing demand that did not exist five years ago. Regional growth at 6.8% reflects a value-weighted rather than volume-weighted base, with the highest average unit prices anywhere.
Share: 20% | CAGR: 6.8% (2026 to 2036)
Regional intelligence for 5 additional markets available in the complete report: Western Europe, South Asia and Pacific, Latin America, Middle East and Africa, Eastern Europe. Contact sales@marketmindsadvisory.com.
sensors-market-country-cagr-analysis-1788419680300

Where Sensor Suppliers Actually Make Money

Winning a design contest earns nothing on its own, because price erosion near 6% a year takes the margin back across a platform life. The positions that pay are modality depth deep enough to engineer cost out annually, applications where calibration creates recurring demand, and customers whose cycles differ from consumer electronics. Everything else is noise.

Specialise Deeply in Two Modalities Rather Than Six

Cost engineering is the whole game once a design win is held, and removing 6% of cost a year requires understanding one sensing physics well enough to change the wafer process, the package and the test flow. Suppliers concentrated in two or three modalities sustain gross margins roughly 11 percentage points above diversified competitors across comparable applications. Breadth looks like risk reduction on a strategy slide and behaves like cost disadvantage in every individual contest. The generalists lose slowly and consistently rather than dramatically, which disguises the pattern. It disguises the pattern for years.
Market Impact: Holds 11 further points of gross margin overall

Target Applications Where Calibration Creates Replacement Demand

Pressure and inertial sensors are fitted once and forgotten, which means revenue ends with the design win. Chemical, gas and certain optical devices drift and require periodic replacement or recalibration, generating recurring demand from an installed base rather than only from new production. Suppliers positioned there earn roughly 3 times the lifetime revenue per design win against equivalent volume in stable modalities. It also decouples revenue partly from the production plans that govern everything else, which is the only genuine diversification available in this industry. Installed base revenue is worth more than order book revenue here.
Market Impact: Earns 3 times the lifetime design win revenue

Weight Industrial and Medical Over Consumer Volume

Consumer and automotive volumes are large, cyclical and priced against annual reduction commitments. Industrial condition monitoring and medical sensing carry unit prices running roughly 8 times consumer levels, replacement driven by maintenance and regulatory cycles rather than product refresh, and qualification barriers that keep low-cost entrants out entirely. Volumes are far smaller. The commercial argument is margin stability rather than growth, and suppliers that built industrial and medical positions during the last cycle were the ones that survived the 2024 correction without restructuring. Qualification barriers keep the competition thin. Restructuring is what the alternative looked like in 2024.
Market Impact: Commands roughly 8 times the consumer unit pricing

Convert Capacity Risk Into Customer Commitment

Suppliers discover demand changes through order adjustments because they sit three tiers below the production decision, and the 2024 inventory correction cost the industry roughly 2 quarters of shipments below end demand. Capacity reservation agreements with take-or-pay terms transfer that risk to customers who actually hold the forward plan. Buyers resist until a shortage reminds them what unallocated capacity costs, which makes shortage periods the only realistic window to negotiate these terms. Suppliers that used the last one still hold the agreements. The window opens with scarcity and closes with it. Most suppliers missed the last one entirely.
Market Impact: Correction cost roughly 2 quarters of lost shipments

Who Controls the Margin Pool

Concentration measured across the whole market is low at roughly 26% for the top five on component shipment revenue, and it misleads badly. Within any single modality the set is tight, often three or four credible suppliers holding qualified positions customers are reluctant to disturb. Across modalities almost nobody competes with almost anybody. The aggregate describes a collection of concentrated contests rather than one fragmented market.
Competition runs on three dimensions. Cost reduction capability is first and decisive, since holding a design win against 6% annual erosion means removing cost at the same rate. Second is applications engineering at design-in, where solving a customer system problem wins positions specification comparison would not. Third is supply assurance across programme lives measured in years, where automotive and industrial customers punish discontinued parts.

Two pressures are reshaping positions. Chinese suppliers backed by domestic assembly volume have moved from value alternatives to qualified sources in image, pressure and proximity sensing, competing on cost structures European and American firms cannot match. Meanwhile customers are consolidating supplier lists to reduce qualification overhead, which favours suppliers with depth across an application rather than a single part. Rankings will move toward modality specialists with real cost engineering.
sensors-market-company-positioning-matrix-1788419680819

Competitive Moat and Risk Dimensions

SONY

Moat: Image sensor process leadership

Sony holds a manufacturing and process position in image sensing that has resisted challenge for over a decade, built on stacked sensor architectures and fabrication capability competitors have struggled to replicate at comparable yield. Image sensing is the largest single modality by value, which concentrates that advantage. Handset and automotive design relationships renew across programme generations with limited exposure.
SONY

Risk: Single modality dependence

The company's sensor business rests overwhelmingly on image sensing, which ties it directly to handset shipment volumes that have plateaued and to automotive camera adoption rates it does not control. Chinese image sensor suppliers have closed the performance gap in mid-tier applications considerably. Diversification into other sensing modalities would require manufacturing and applications capability the firm has not historically built.
ROBERT BOSCH

Moat: Automotive qualification and scale

Bosch combines the deepest automotive qualification history of any sensor supplier with genuine volume manufacturing across pressure, inertial and environmental modalities, letting it engineer cost out at rates smaller competitors cannot match. Its position inside vehicle platform development gives visibility into sensing requirements years before formal sourcing. The same manufacturing base serves consumer applications, spreading fixed cost across different cycles.
ROBERT BOSCH

Risk: Combustion platform exposure

A substantial share of automotive sensor revenue sits on powertrain and emissions sensing tied to combustion vehicles, which declines as electrification proceeds however well the company executes elsewhere. Rebuilding equivalent content on electrified platforms means competing against suppliers with battery and current sensing heritage. The transition is running faster in some regions than its positions were built to accommodate.

Players Tracked

Prominent Players

Sony
Robert Bosch
TE Connectivity
STMicroelectronics
Honeywell International

Other Key Players

Texas Instruments
Infineon Technologies
OMRON
TDK
Murata Manufacturing
Analog Devices
NXP Semiconductors
ams OSRAM
Samsung Electronics
OmniVision Technologies
Sensata Technologies
Amphenol
Vishay Intertechnology
Panasonic
Yokogawa Electric

Recent Developments

APRIL 2025

Automotive semiconductor inventory correction completes across tier one supply

Sensor suppliers reported shipments returning toward end demand after roughly two years of customers drawing down stock accumulated during the shortage period. Order visibility improved though forward plan sharing remained limited, and several suppliers noted that capacity reservation terms negotiated in 2022 had expired without renewal.
Signal: The correction ended without changing the information asymmetry that caused it, which makes a repeat entirely likely.
AUGUST 2025

Chinese image sensor suppliers qualify into mid-tier automotive camera platforms

Several domestic suppliers completed qualification into driver assistance camera modules for Chinese vehicle programmes, extending positions previously confined to handset applications. The qualifications were organic design wins rather than the result of any acquisition or joint venture arrangement between the parties. Volume commitments were not disclosed by any party.
Signal: Automotive qualification was the last barrier protecting incumbent image sensor positions, and it is now demonstrably passable.
JANUARY 2025

Ventilation standards revisions extend demand-controlled requirements to more building types

Updated standards in several jurisdictions extended demand-controlled ventilation requirements based on measured air quality to additional occupied building categories, including schools and healthcare facilities. Retrofit timetables were set over several years rather than requiring immediate compliance from existing buildings. Existing buildings face compliance at their next major refurbishment.
Signal: Building codes are becoming a more reliable volume driver for gas sensing than any industrial application currently is.

What Sits Inside a Sensor Price

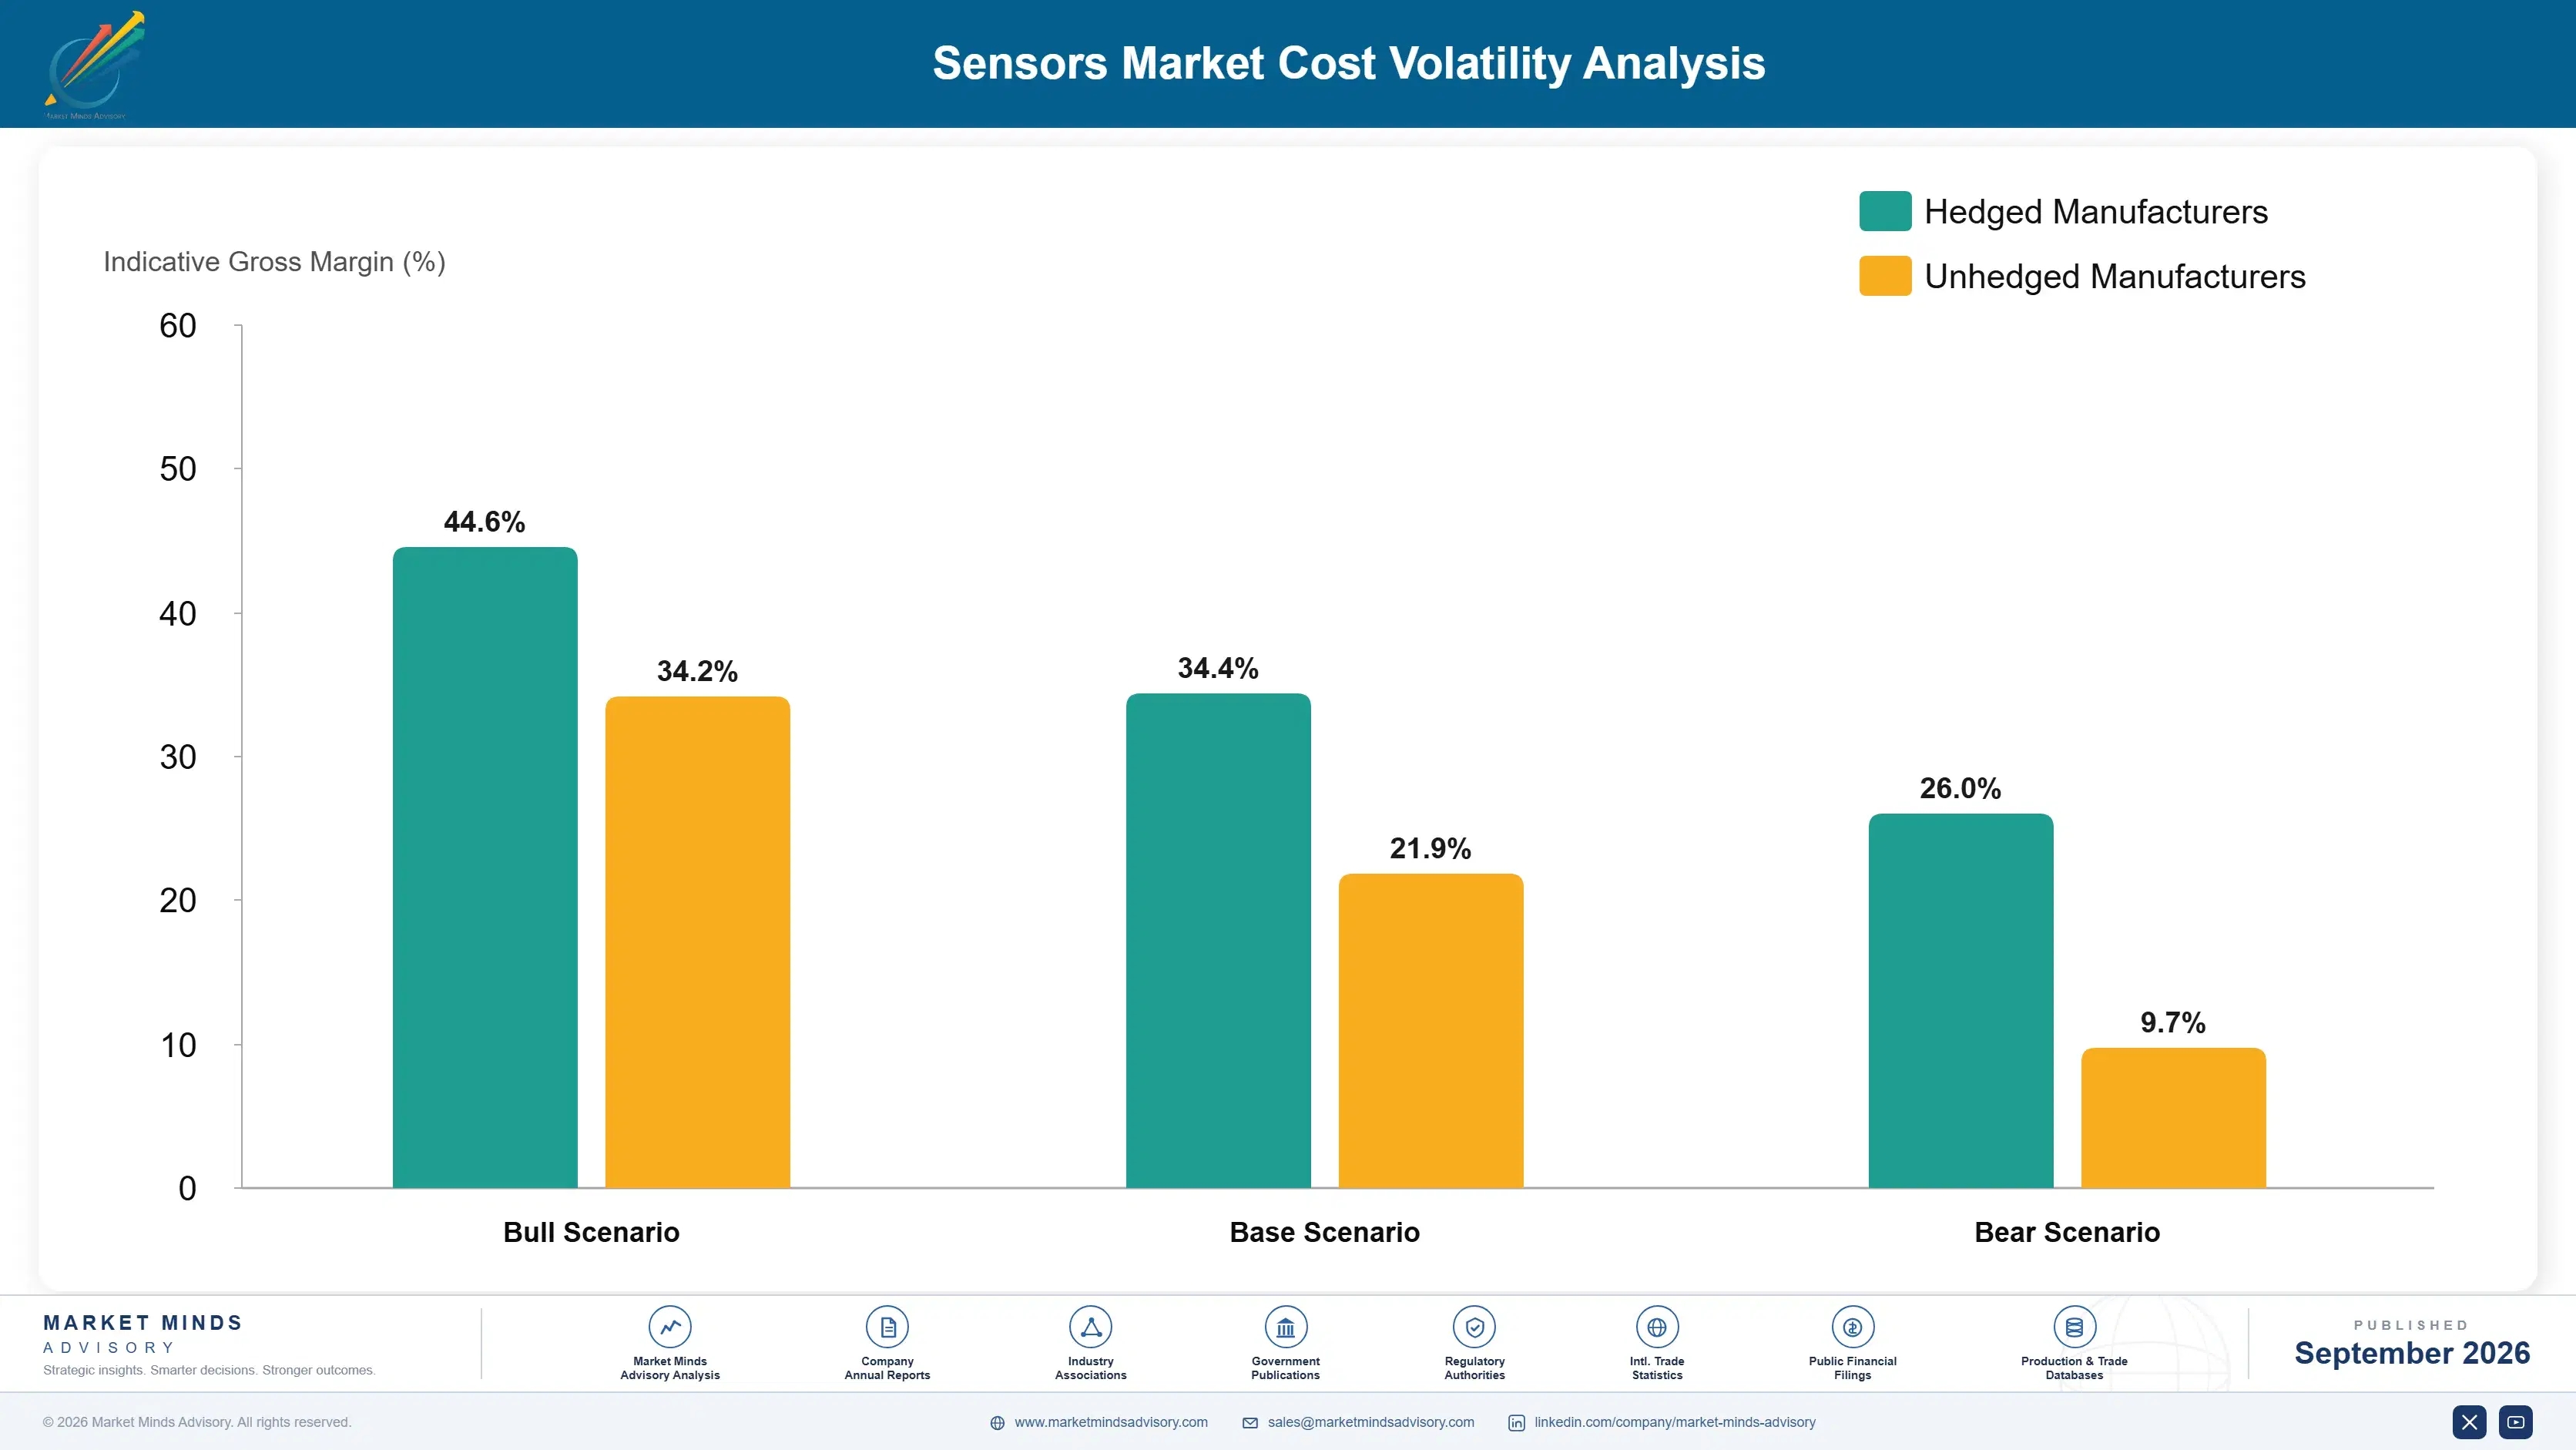
Cost structure varies enormously by modality, which makes any single figure misleading. Across the market, silicon and sensing element fabrication runs between 31% and 46% of cost of goods, the range reflecting standard semiconductor versus specialised micromachined processes. Packaging and interconnect add roughly 22%, test and calibration 17%, and assembly the balance. Test time is the line suppliers most often underestimate when costing devices.
The sharpest recent pressure came from volume rather than input prices. The automotive inventory correction through 2024 and 2025 left suppliers running fabrication and test capacity well below planned utilisation, and fixed cost absorption deteriorated accordingly across the industry. STMicroelectronics and Sensata Technologies both disclosed the effect in 2024 annual reporting. Specialised micromachining lines suffered most, since they cannot be repurposed to other products when sensor demand falls away.

Exposure varies by manufacturing model rather than by scale. Suppliers owning specialised fabrication carry fixed cost that punishes them in a downturn and rewards them at volume. Those using foundry capacity for standard processes flex more easily and pay more per device. Geography compounds it, since suppliers without East Asian assembly presence pay more and respond slower. Small specialists hold fixed capacity without volume to absorb it.
sensors-market-cost-volatility-analysis-1788419681014

Design sensing elements onto standard semiconductor processes

Specialised micromachining lines deliver the best cost per unit at volume and become a severe liability when volume falls, since nothing else can run on them. Designing elements to run on foundry-available standard processes converts fixed cost into variable and improves survivability. Unit cost is higher at full utilisation, a trade most suppliers now accept.

Attack test time before attacking material cost

Test and calibration is roughly 17% of cost and the line least examined during design, since attention concentrates on the sensing element. Parallel test, shortened routines and on-chip trim cut that time around 40%. The saving recurs on every unit for the life of the design, which makes it the most reliable source of the annual cost reduction customers demand.

Negotiate capacity reservation during shortage periods only

Customers accept take-or-pay capacity terms when supply is scarce and refuse them when it is not, which means the negotiating window opens and closes with the cycle rather than with supplier preference. Suppliers securing reservation agreements during the last shortage held visibility through the correction. Those that did not are negotiating when buyers have least reason to agree.

Portfolio Architecture for Margin Defence

Margin architecture in sensing separates on modality and application rather than on scale, which surprises people expecting semiconductor economics. High volume consumer and automotive components run thin, held down by annual price reduction commitments that suppliers accept as a condition of continued supply. Industrial, medical and process instrumentation devices clear far higher, since qualification barriers exclude low-cost entrants and buyers assess failure cost rather than unit price.
The volume tension is between the applications that fill a fabrication line and the applications that pay. Consumer and automotive volumes absorb fixed cost and make specialised capacity viable at all; industrial and medical volumes are too small to do that alone but carry the margin. Suppliers need both, and those drifting too far toward volume during the shortage met the 2024 correction with capacity, thin margins and no cushion.

High-value revenue concentrates in medical and diagnostic sensing and in process instrumentation for severe service conditions. Both share the property that failure carries consequences far exceeding component cost, which removes price from the centre of the purchase decision. Consumer and automotive volume sensing occupies the opposite position, and no engineering differentiation has ever changed how those contracts get negotiated.

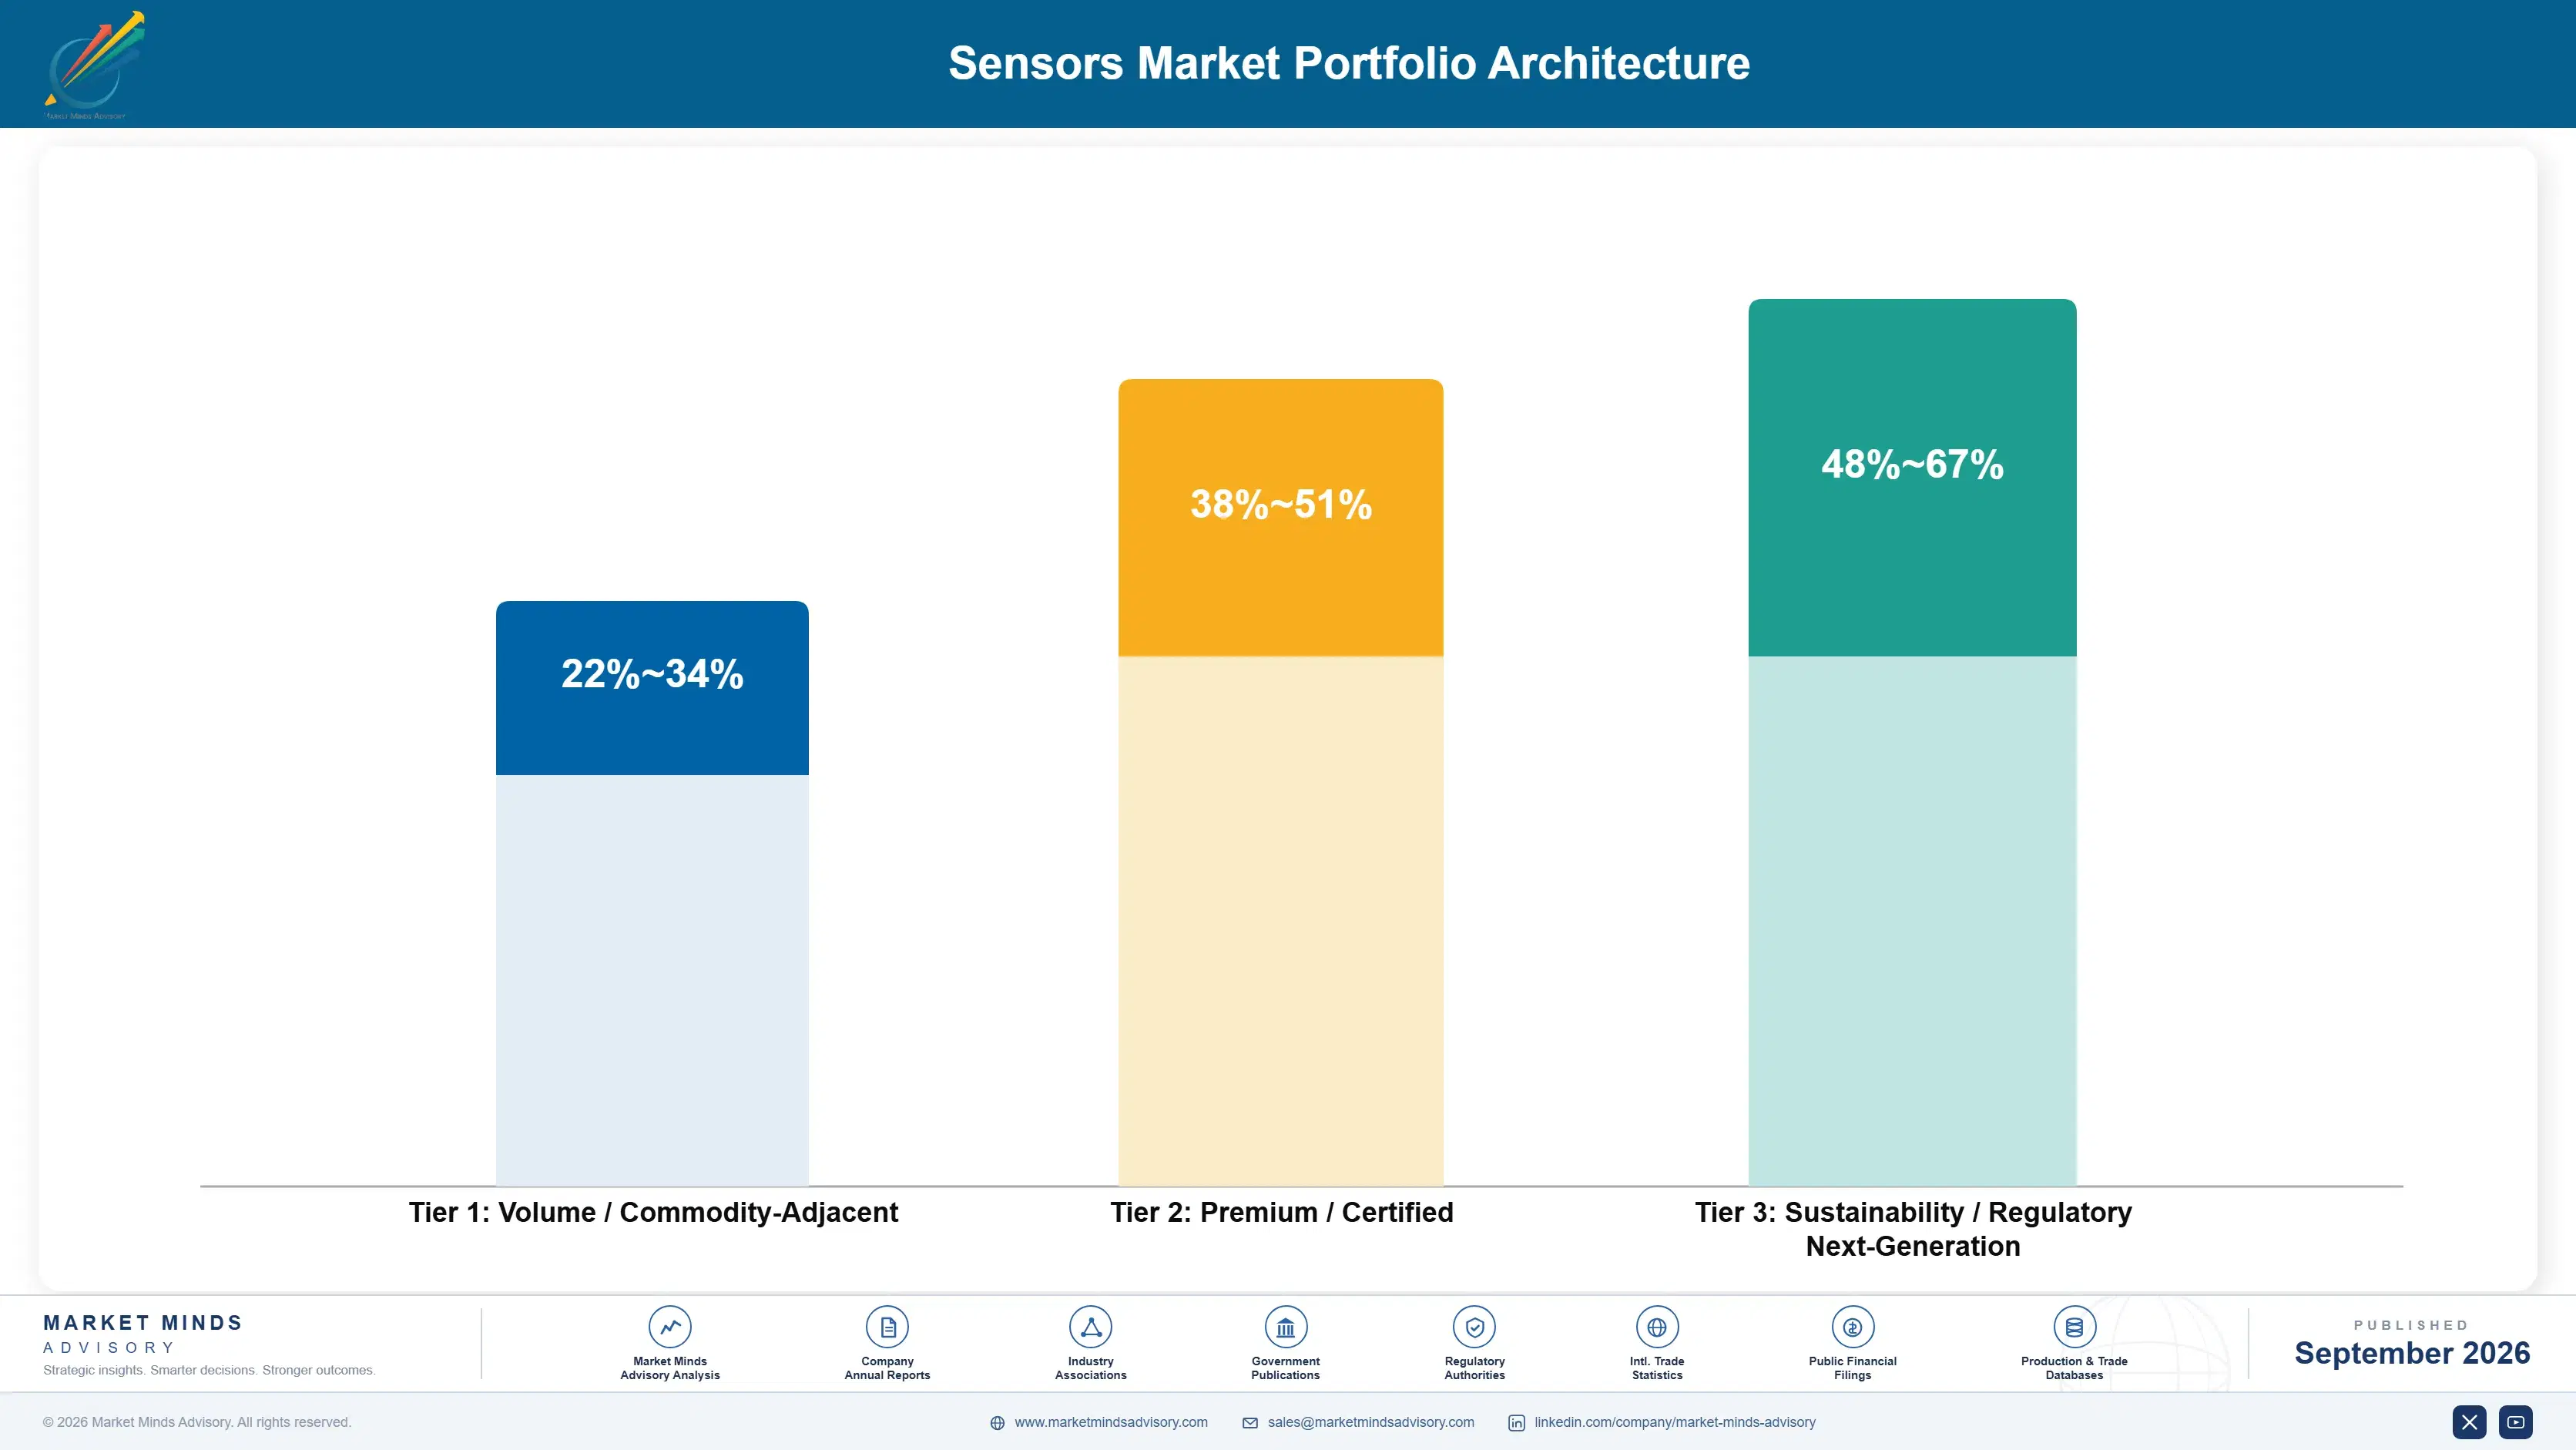
Volume / Commodity-Adjacent

High volume consumer and automotive sensors sold against annual price reduction commitments. The wide range separates suppliers with modality depth and cost engineering capability from those competing on catalogue breadth. Chinese entrants have compressed this tier considerably across image, pressure and proximity devices.
Gross Margin: 22-34%

Premium / Certified

Industrial automation, condition monitoring and factory sensing qualified to application standards, sold through longer design cycles to customers replacing on maintenance schedules. Margin holds because approval requirements and application specificity limit competitive entry. Volumes are modest but revenue is far steadier than consumer cycles.
Gross Margin: 38-51%

Sustainability / Regulatory / Next-Generation

Medical, diagnostic, process instrumentation and gas sensing devices where regulatory approval and failure consequence dominate the purchase. The widest range in the portfolio, since approval depth and calibration content differ enormously across applications. Highest margin, lowest volume, and the least exposed to any production cycle.
Gross Margin: 48-67%
sensors-market-portfolio-architecture-1788419681510

High-value Sub-segments and Strategic Watch-out

Medical and Diagnostic Sensing

High value and high growth together, with continuous monitoring and diagnostic applications carrying the highest unit prices anywhere in this market. The margin range reflects regulatory approval depth, which varies substantially by device class. Qualification barriers and clinical evidence requirements keep low-cost competitors out almost entirely across the segment.
Gross Margin: 56-67%

Gas and Air Quality Sensing

High value with strong growth, driven by ventilation standards that specify measured air quality rather than fixed schedules. The range reflects selectivity requirements, which differ sharply between building and industrial applications. Calibration drift creates genuine recurring replacement demand that the volume sensing modalities never generate at all.
Gross Margin: 44-58%

Automotive Volume Sensing

The volume core of the market, absorbing fixed manufacturing cost and carrying annual price reduction commitments that erode margin across platform lives. Electrification is redistributing content between suppliers rather than expanding the pool much. Nobody exits it and few earn adequately within it, the industry's permanent condition.
Gross Margin: 24-36%

Chinese Domestic Supplier Capacity

The strategic watch-out, carried at zero because it represents competitive capacity rather than addressable revenue. Domestic suppliers have moved from value alternatives to qualified automotive sources within five years. Incumbents assuming automotive qualification remains a durable barrier are relying on something that has already been demonstrably passed.
Gross Margin: 0-0%

How Sensor Revenue Repeats

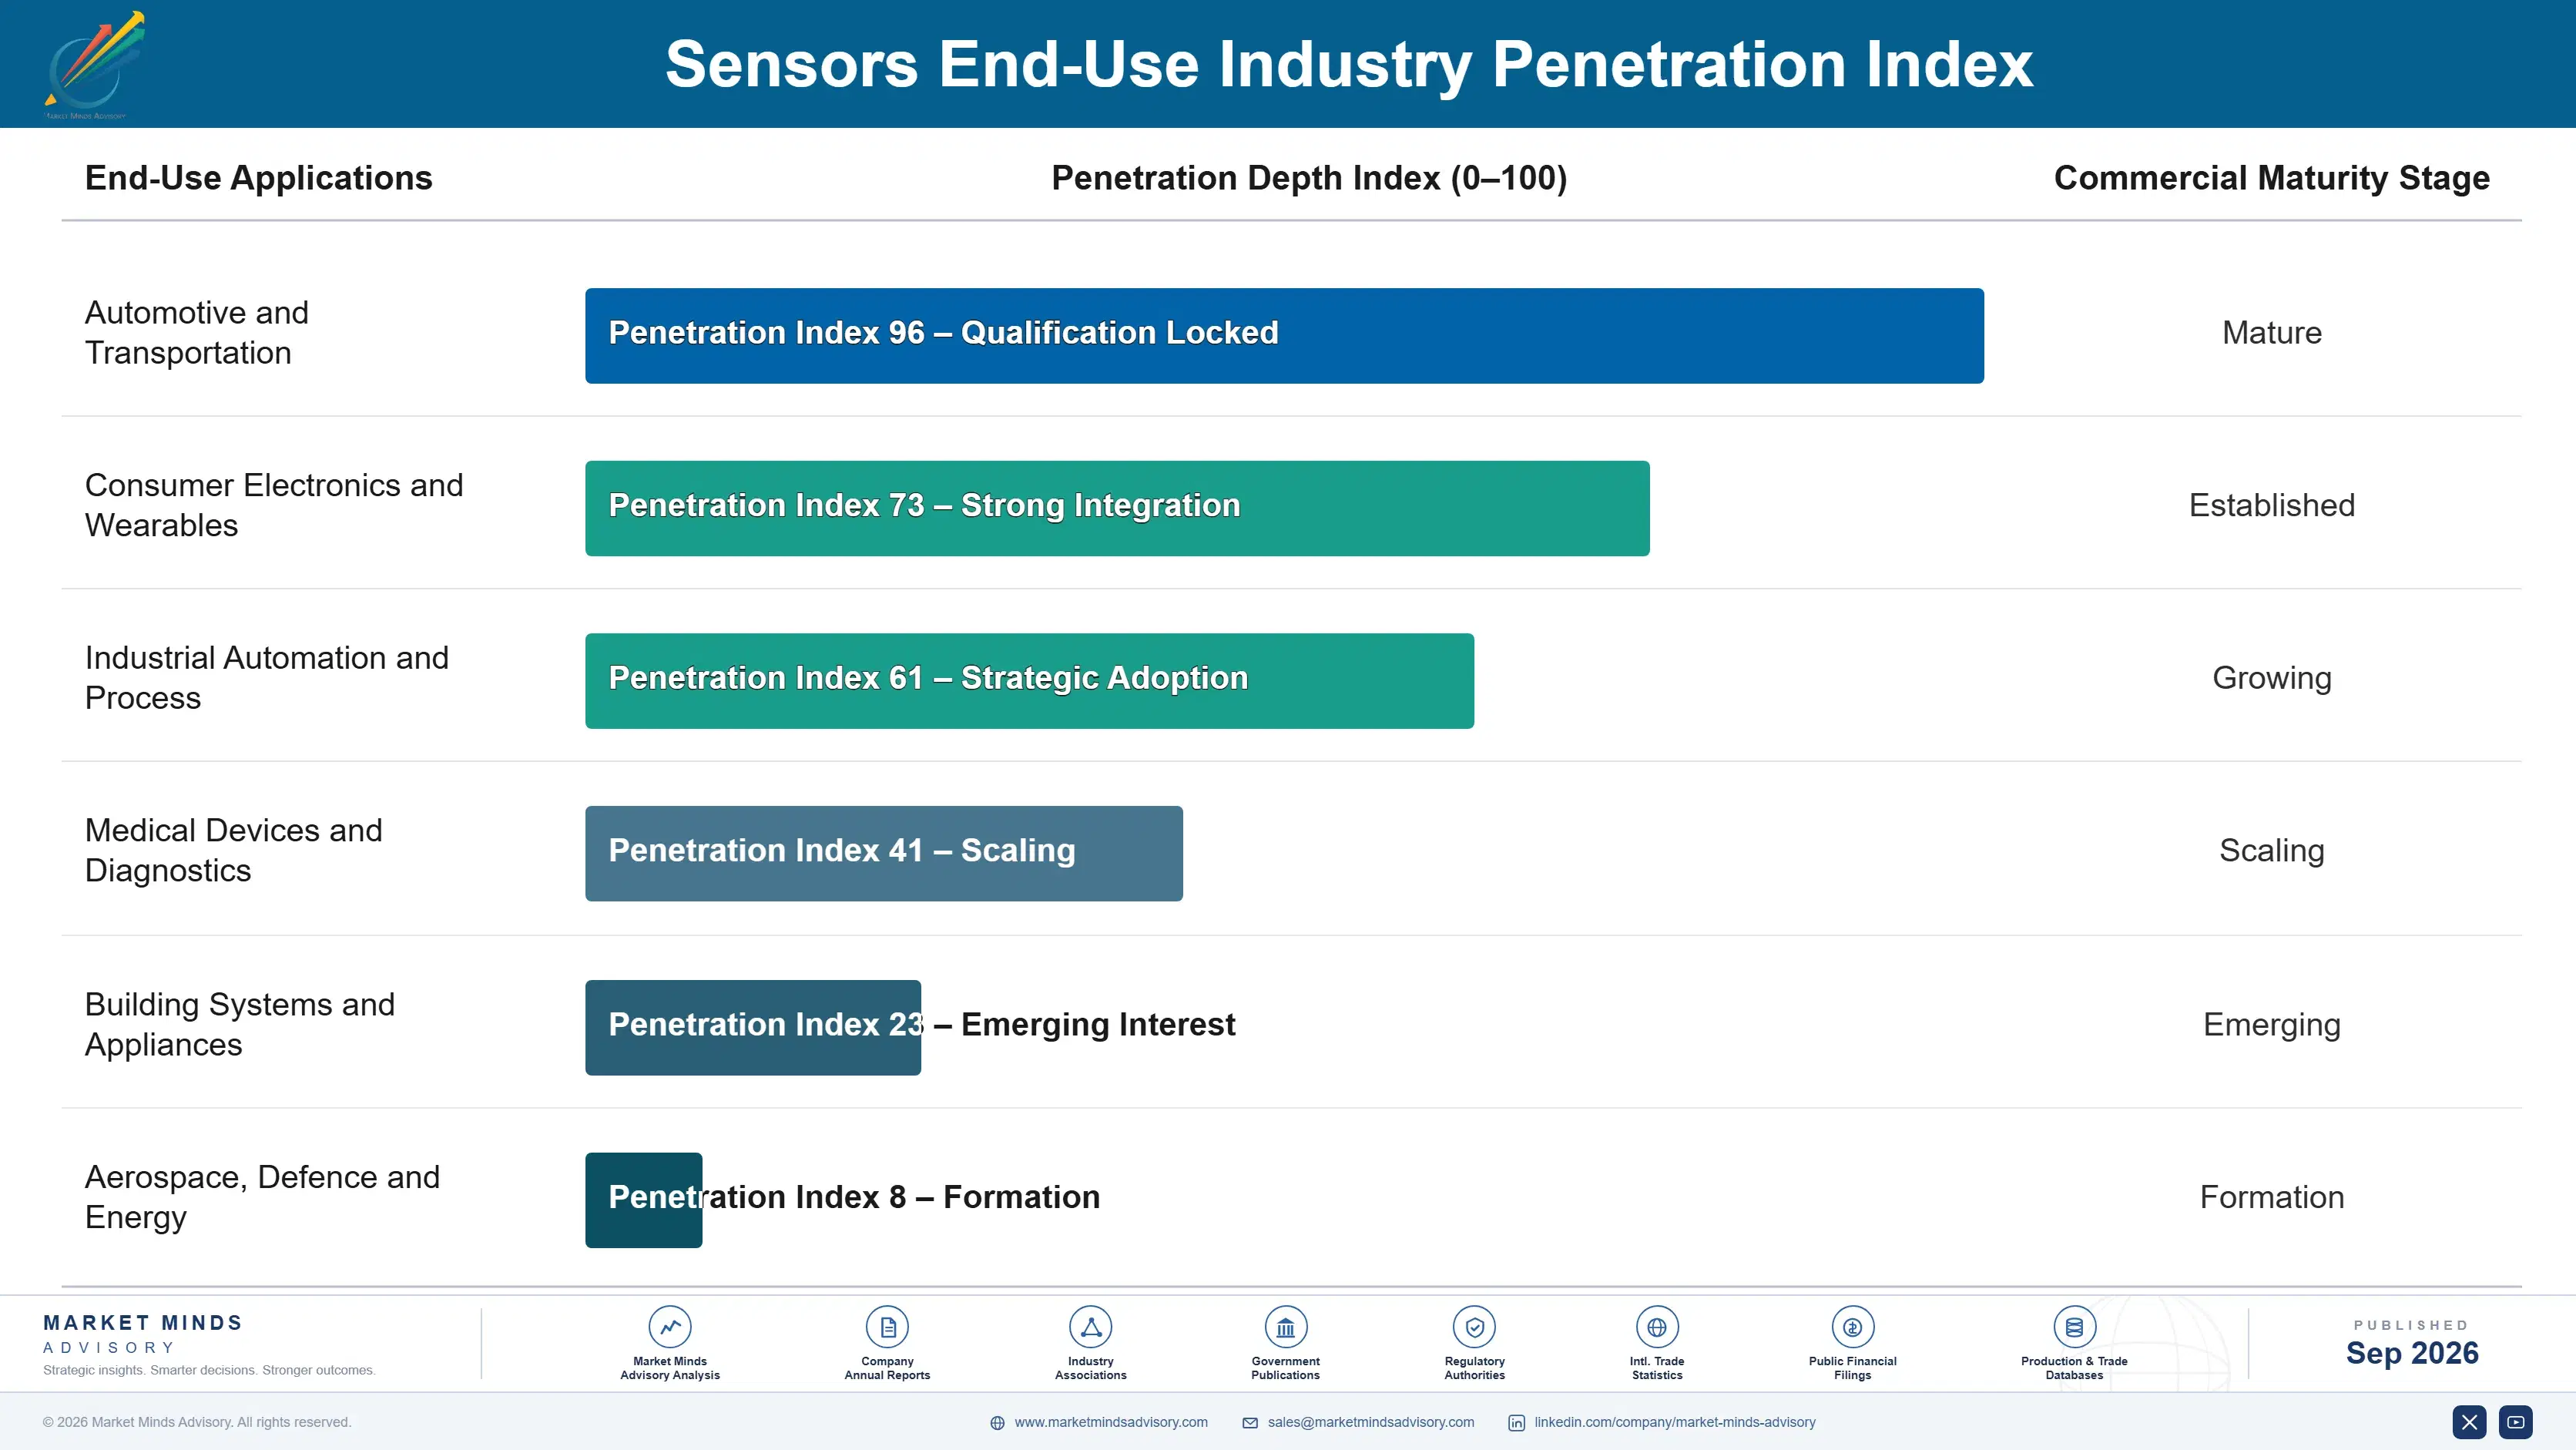
Revenue repeats through design wins rather than contracts, and the annuity attaches to a customer platform rather than to the customer. A sensor qualified into a vehicle programme ships for five to seven years with no further competitive exposure, and one qualified into a handset ships for eighteen months. The annuity ends when the platform ends, which means the real forward book is the set of programmes held, not orders placed.
Adoption depth varies by application in ways that shape strategy directly. Automotive uses sensors intensively and requalifies reluctantly, making positions durable and hard to win. Consumer electronics requalifies constantly, so positions are easy to win and impossible to hold. Industrial process customers replace on maintenance cycles and value continuity above all. Medical customers requalify almost never, because approval documentation makes a component change expensive and slow.

The buyer has shifted from component engineering toward supply chain management. A decade ago a design engineer chose a sensor on specification and the commercial terms followed. Today procurement consolidates approved supplier lists to cut qualification overhead and negotiates multi-part agreements, favouring depth across an application over one excellent part. Suppliers still selling on datasheet superiority address an engineer with far less authority.
sensors-market-end-use-penetration-index-1788419681996

What Separates Sensor Winners

These are among the four positions where our research anticipates prominent divergence between winners and laggards over the coming forecast period. Each is grounded in the demand model, the regulatory perimeter, and the announced capacity pipeline.
01 / MODALITY COST ENGINEERING

Go deep in two sensing physics, not broad across six

Holding a design win against 6% annual price erosion requires removing cost at the same rate every year, and that demands understanding a single sensing physics well enough to change the wafer process, the package and the test flow. Suppliers concentrated in two or three modalities sustain gross margins roughly 11 percentage points above diversified competitors in comparable applications. Catalogue breadth reads as risk reduction on a strategy document and behaves as a permanent cost disadvantage in every individual contest.
02 / RECURRING DEMAND POSITIONING

Choose modalities where calibration drift generates replacement

Pressure and inertial sensors are fitted once and generate no further revenue, so the design win itself is the whole opportunity. Chemical, gas and certain optical devices drift and require replacement or recalibration, which produces roughly 3 times the lifetime revenue per design win at broadly equivalent volumes. It also partially decouples revenue from the customer production plans that govern everything else in this industry, which is the only genuine diversification a component supplier of this kind can actually achieve.
03 / APPLICATION MIX DISCIPLINE

Buy margin stability with industrial and medical weighting

Industrial condition monitoring and medical sensing carry unit prices around 8 times consumer levels, replacement driven by maintenance and regulatory cycles, and qualification barriers that exclude low-cost entrants from the segment entirely. Volumes are far smaller and the fixed cost absorption is considerably worse. Suppliers that had built these positions before the last cycle turned were the ones that came through the 2024 correction without restructuring at all, which makes this an argument about survivability rather than about growth rates.
04 / CAPACITY RISK TRANSFER

Negotiate take-or-pay terms while shortages still exist

Component suppliers learn about production plan changes through order adjustments, and the resulting 2024 inventory correction cost the industry roughly 2 quarters of shipping below actual end demand. Capacity reservation agreements carrying take-or-pay terms move that risk onto the party actually holding the forward plan. Buyers accept such terms only when supply is scarce, which means the negotiating window opens with shortages and then closes again with them, and most suppliers in this industry missed the last such window entirely.

Engagement Snapshot From the Field

A live engagement with an industry participant carrying material or product regulatory and market exposure ahead of a defining policy shift, showing how our research translates into a defensible multi-year portfolio strategy.
MARKET MINDS ADVISORY · CLIENT ENGAGEMENT SUMMARY
Sensors Producer Strategic Portfolio Review and Transition Roadmap 2026·Investment Scenario on Sensors Exposure Evaluation 2025-26
CLIENT PROFILE
A European sensor manufacturer with annual revenue near USD 640 million (client-reported, unverified by MMA), shipping across five sensing modalities into automotive, industrial and appliance customers, and operating two owned fabrication sites including one specialised micromachining line. Automotive accounted for 58% of revenue, with roughly two thirds of that content on combustion powertrain and emissions applications.
STRATEGIC CHALLENGE
The inventory correction had left utilisation at 61% across both sites and operating margin near breakeven (client-reported, unverified by MMA). Management wanted to know whether to defend breadth across five modalities or concentrate, and whether the specialised micromachining line remained viable given how much of its loading came from combustion powertrain sensing in permanent decline.
MMA APPROACH
MMA rebuilt profitability by modality and by application rather than by customer, which the company had never done, allocating fabrication and test cost against actual loading. We interviewed 13 customers, four foundries and two equipment suppliers. Competitive cost position was modelled separately for each modality against the specialists in it, rather than against the diversified competitors management had been benchmarking itself on.
KEY FINDINGS
  1. Three of five modalities were loss-making at full cost allocation, and all three were ones where the company competed against dedicated specialists rather than other generalists.
  2. The micromachining line carried 71% of its loading from combustion powertrain sensing, giving it a demand profile that declines regardless of any commercial action the company takes.
  3. Gas sensing, the smallest modality by revenue, produced the highest contribution margin and had recurring replacement demand that none of the automotive positions generated.
  4. Two customers indicated they would accept foundry-manufactured equivalents of currently micromachined parts, a change management had assumed would require full and costly requalification across both programmes.
CLIENT PROFILE
A European sensor manufacturer with annual revenue near USD 640 million (client-reported, unverified by MMA), shipping across five sensing modalities into automotive, industrial and appliance customers, and operating two owned fabrication sites including one specialised micromachining line. Automotive accounted for 58% of revenue, with roughly two thirds of that content on combustion powertrain and emissions applications.
STRATEGIC CHALLENGE
The inventory correction had left utilisation at 61% across both sites and operating margin near breakeven (client-reported, unverified by MMA). Management wanted to know whether to defend breadth across five modalities or concentrate, and whether the specialised micromachining line remained viable given how much of its loading came from combustion powertrain sensing in permanent decline.
MMA APPROACH
MMA rebuilt profitability by modality and by application rather than by customer, which the company had never done, allocating fabrication and test cost against actual loading. We interviewed 13 customers, four foundries and two equipment suppliers. Competitive cost position was modelled separately for each modality against the specialists in it, rather than against the diversified competitors management had been benchmarking itself on.
KEY FINDINGS
  1. Three of five modalities were loss-making at full cost allocation, and all three were ones where the company competed against dedicated specialists rather than other generalists.
  2. The micromachining line carried 71% of its loading from combustion powertrain sensing, giving it a demand profile that declines regardless of any commercial action the company takes.
  3. Gas sensing, the smallest modality by revenue, produced the highest contribution margin and had recurring replacement demand that none of the automotive positions generated.
  4. Two customers indicated they would accept foundry-manufactured equivalents of currently micromachined parts, a change management had assumed would require full and costly requalification across both programmes.
RECOMMENDED STRATEGY
Phase 1: Exit two loss-making modalities over three years by allowing existing design wins to run out rather than through disruptive discontinuation notices. Phase 2: Migrate viable micromachined devices to standard foundry processes, converting fixed cost to variable and reducing exposure to the declining loading base. Phase 3: Reinvest the released engineering capacity in gas sensing, where contribution margin and recurring replacement demand are both materially better than elsewhere.
OUTCOME
The company exited two modalities on schedule and lifted operating margin by roughly 6 percentage points within eighteen months (client-reported, unverified by MMA). Gas sensing revenue grew 34% over the same period from a small base, and the micromachining line was reloaded with migrated industrial devices rather than closed.

Frequently Asked Questions

Foundational context covering the market sizes, CAGR, scope, country, region and competition that inform every finding below. This section is provided to cover basics and most often pre-purchase conversations, answered from the MMA Primary Research Dataset.

What is the current size of the Sensors Market?

The market was worth USD 245.0 billion in 2025 and reaches USD 263.6 billion in 2026. Roughly 61% of volume is set by vehicle and handset production plans.

How large will the Sensors Market be by 2036?

MMA forecasts USD 548.4 billion by 2036, an expansion of 2.08 times over the forecast period. That represents USD 284.8 billion of incremental annual revenue against 2026.

What is the CAGR for the Sensors Market 2026 to 2036?

The base case is 7.6% compound annual growth, with a bull case at 8.8% and a bear case at 6.4%. The pace of vehicle electrification separates the three scenarios.

Which segment is growing fastest?

Chemical, gas and biosensors grow at 11.4%, half again the market rate of 7.6%. Miniaturisation moved gas sensing out of specialist instrumentation into buildings, vehicles and wearables.

Who are the major companies in the Sensors Market?

Sony, Robert Bosch, TE Connectivity, STMicroelectronics and Honeywell International lead on measured component shipment revenue. Together they hold roughly 26%, though individual modalities are far more concentrated.

Which country is growing fastest?

India grows fastest at 12.4%, driven by electronics and automotive component assembly established under domestic manufacturing incentives. Several international suppliers have added local warehousing and applications support in response.

Report Segmentation Architecture

The full report scope spans multiple orthogonal segmentation dimensions, with cross-tabulated demand data provided for each dimension pair. Coverage extends further to regional breakdowns, trend trajectories, and the competitive detail needed to support segment-level decision-making.

By Primary Market Dimension

  • Image and Optical Sensors
  • Pressure and Force Sensors
  • Inertial and Motion Sensors
  • Chemical, Gas and Biosensors
  • Temperature and Thermal Sensors
  • Position, Proximity and Level Sensors

By End-Use Industry

  • Automotive and Transportation
  • Consumer Electronics and Wearables
  • Industrial Automation and Process
  • Medical Devices and Diagnostics
  • Building Systems and Appliances
  • Aerospace, Defence and Energy

By Commercial Dimension

  • Direct Original Equipment Supply
  • Tier One Component Integrators
  • Distribution and Catalogue Channels
  • Contract Manufacturer Procurement
  • Design-In Applications Engineering
  • Aftermarket and Replacement Supply

By Region

  • East Asia
  • North America
  • Western Europe
  • South Asia and Pacific
  • Latin America
  • Middle East and Africa
  • Eastern Europe

Scope, Methodology, and Coverage

Every figure in this report is reproducible from documented input assumptions. The scope below maps the historical period, the forecast horizon, the segmentation dimensions, and the countries covered, alongside the underlying primary and qualitative methodology.
Historical Period
2020 to 2025
Forecast Period
2026 to 2036
Base Year
2025 (USD billions; MMA Primary Research Dataset, September 2026)
Market Definition
This market covers discrete sensing devices and sensor modules sold as components or subassemblies at supplier level, spanning image and optical, pressure and force, inertial and motion, chemical, gas and biological, temperature and thermal, and position, proximity and level sensing modalities. Revenue is measured as component shipment value including modules where the sensing element is the principal content. Complete measurement instruments, laboratory analysers, standalone test and inspection equipment, sensor fusion software, calibration services and finished devices incorporating sensors are excluded.
Quantitative Units
USD billions, component shipment revenue at supplier level
Segmentation Dimensions
Sensing modality, end-use industry, commercial channel, region
Regions Covered
East Asia, North America, Western Europe, South Asia and Pacific, Latin America, Middle East and Africa, Eastern Europe
Countries Covered
United States, Canada, Germany, France, United Kingdom, Italy, Switzerland, Netherlands, Sweden, Ireland, Poland, Czechia, Hungary, Slovakia, China, Japan, South Korea, Taiwan, India, Vietnam, Thailand, Australia, Brazil, Mexico, Chile, Morocco, United Arab Emirates, South Africa
Key Companies Profiled
Sony, Robert Bosch, TE Connectivity, STMicroelectronics, Honeywell International, Texas Instruments, Infineon Technologies, OMRON, TDK, Murata Manufacturing, Analog Devices, NXP Semiconductors, ams OSRAM, Samsung Electronics, OmniVision Technologies, Sensata Technologies, Amphenol, Vishay Intertechnology, Panasonic, Yokogawa Electric
Quantitative Methodology
Primary survey, n=3,800 respondents, Q4 2025, six countries; demand-side model with trade association cross-validation
Qualitative Methodology
47 expert interviews, Q4 2025; applied to validate demand model assumptions, identify emerging dynamics, and assess competitive positioning
Report Format
PDF and XLSX data workbook (Word format preview document)
Publisher
Market Minds Advisory
Report Code
MMA-2026-TEC-801
Published
September 2026
Contact
sales@marketmindsadvisory.com | www.marketmindsadvisory.com

Purchase the full Sensors Market Report (2026 to 2036).

The full MMA report treats sensing as a set of separate component businesses rather than one market, and examines what actually determines profitability inside each of them. It sizes the market to 2036 across six sensing modalities, seven regions and 28 countries, with modality growth rates and regional demand mechanisms set out in full. Competitive analysis covers 20 suppliers assessed on measured component shipment revenue, including moat and risk assessment for the two leaders. The report quantifies cost structure by modality, design-in and price erosion economics, and margin architecture across three portfolio tiers. It closes with four strategic verdicts and an anonymised sensor manufacturer engagement.
Six sensing modalities sized to 2036
Seven regions with demand mechanism analysis
Twenty suppliers on consistent shipment revenue basis
Cost structure and price erosion benchmarks by modality
Margin architecture across three portfolio tiers
Anonymised sensor manufacturer portfolio concentration engagement

Built For The People Who Decide

From boardroom strategy to bench-side execution, this report is read cover-to-cover by leaders shaping the next decade of their industry, turning demand scenarios, market dynamics and valuation benchmarks into decisions.
CXOs/ Presidents/ VPs/ Managers
M&A and Corporate Development
Strategy Teams and R&D Heads
Procurement and Product Directors
Regulatory and Compliance Leaders
Investor Relations and Equity Analysts