Market Minds Advisory
Self-Supporting Aerial Optical Cable Market

Self-Supporting Aerial Optical Cable Market: Self-Supporting Aerial Optical Cable Market. Certification, Density, and Pole Attachment Economics.

Utilities and telecom operators are stringing aerial optical cable across existing poles to bypass trenching costs, even as rising fiber-count demand, storm-hardening codes, and copper-to-fiber migration timelines strain manufacturing and installation capacity.

Lead Analyst

Published

September 2026

Make Smarter Decisions with Customized Research Insights

Request a free sample report and evaluate market opportunities, growth trends, and competitive dynamics relevant to your business needs.

2025 MARKET VALUE$1.4BMarket Size 2025
2036 FORECAST VALUE$2.8BBase Case , 2026 to 2036
CAGR 2026 TO 20366.5 %Bull 7.7% / Bear 5.3%
INCREMENTAL OPPORTUNITY$1.3BNet 10- year value creation
EXPANSION MULTIPLE1.88x2036 value over 2026 base
Strategic Levers
M&A Pipeline
Regional Outlook
Country Rankings
Competitive Intelligence
Segmental Deep-dive
Call-Us : 91 93563 13602

Executive Snapshot and Market Trajectory.

Grid operators and last-mile telecom carriers are treating aerial optical cable as the fastest route to fiber densification, replacing copper spans without new pole permits or trenching approval delays across most jurisdictions. That speed advantage is now the primary purchase driver as subsidy deadlines tighten nationwide.
Rural broadband subsidy programmes, distribution utility grid-hardening mandates, and 5G fronthaul densification are concentrating demand in North America and East Asia, where pole attachment agreements and storm-resilience codes favour all-dielectric self-supporting designs over lashed or figure-eight alternatives. Certification requirements increasingly separate qualified suppliers from regional converters, and buyers now treat mechanical testing credentials as a precondition for utility contract eligibility rather than an optional differentiator.
Competitive intensity centres on fiber count scaling, ultraviolet and tracking resistance, and installation speed, while sheathing material costs and mechanical strength certification requirements from utility standards bodies increasingly separate qualified suppliers from regional converters chasing price alone. Chinese producers are scaling ribbon fiber capacity fast enough to pressure standard pricing, pushing established suppliers toward certified and sensing-enabled niches where scale alone matters less than certification credentials do, a shift visible in recent utility tenders.
Market Definition
This report covers self-supporting aerial optical cable designed for direct pole attachment without a separate messenger wire, spanning standard, high-strength, and sensing-enabled variants. Buried duct cable, lashed cable requiring messenger wire, and copper aerial plant are excluded.
Base Year Value
$1.4B in 2025 (MMA Primary Research Dataset, September 2026)
Forecast Period
2026 to 2036, eleven discrete annual values
CAGR
6.5% base case. Bull 7.7%. Bear 5.3%.
Fastest Growth Segment
AI-Enabled Smart Monitoring ADSS Cable Systems: 13.4% CAGR
Fastest Growth Country
India: 9.5% CAGR
Fastest Growth Region
South Asia and Pacific: 8.5% CAGR
Largest Region
East Asia: 30% of 2025 global value
Market Leaders
Corning Incorporated, Prysmian Group, Sterlite Technologies, Fujikura Ltd, ZTT Group. Source: MMA Analysis based on company annual reports.
Primary Survey
n=3,800 procurement and R&D decision-makers, Q4 2025, six countries
Methodology
Demand-side build-up, cross-validated against public data, 47 expert interviews

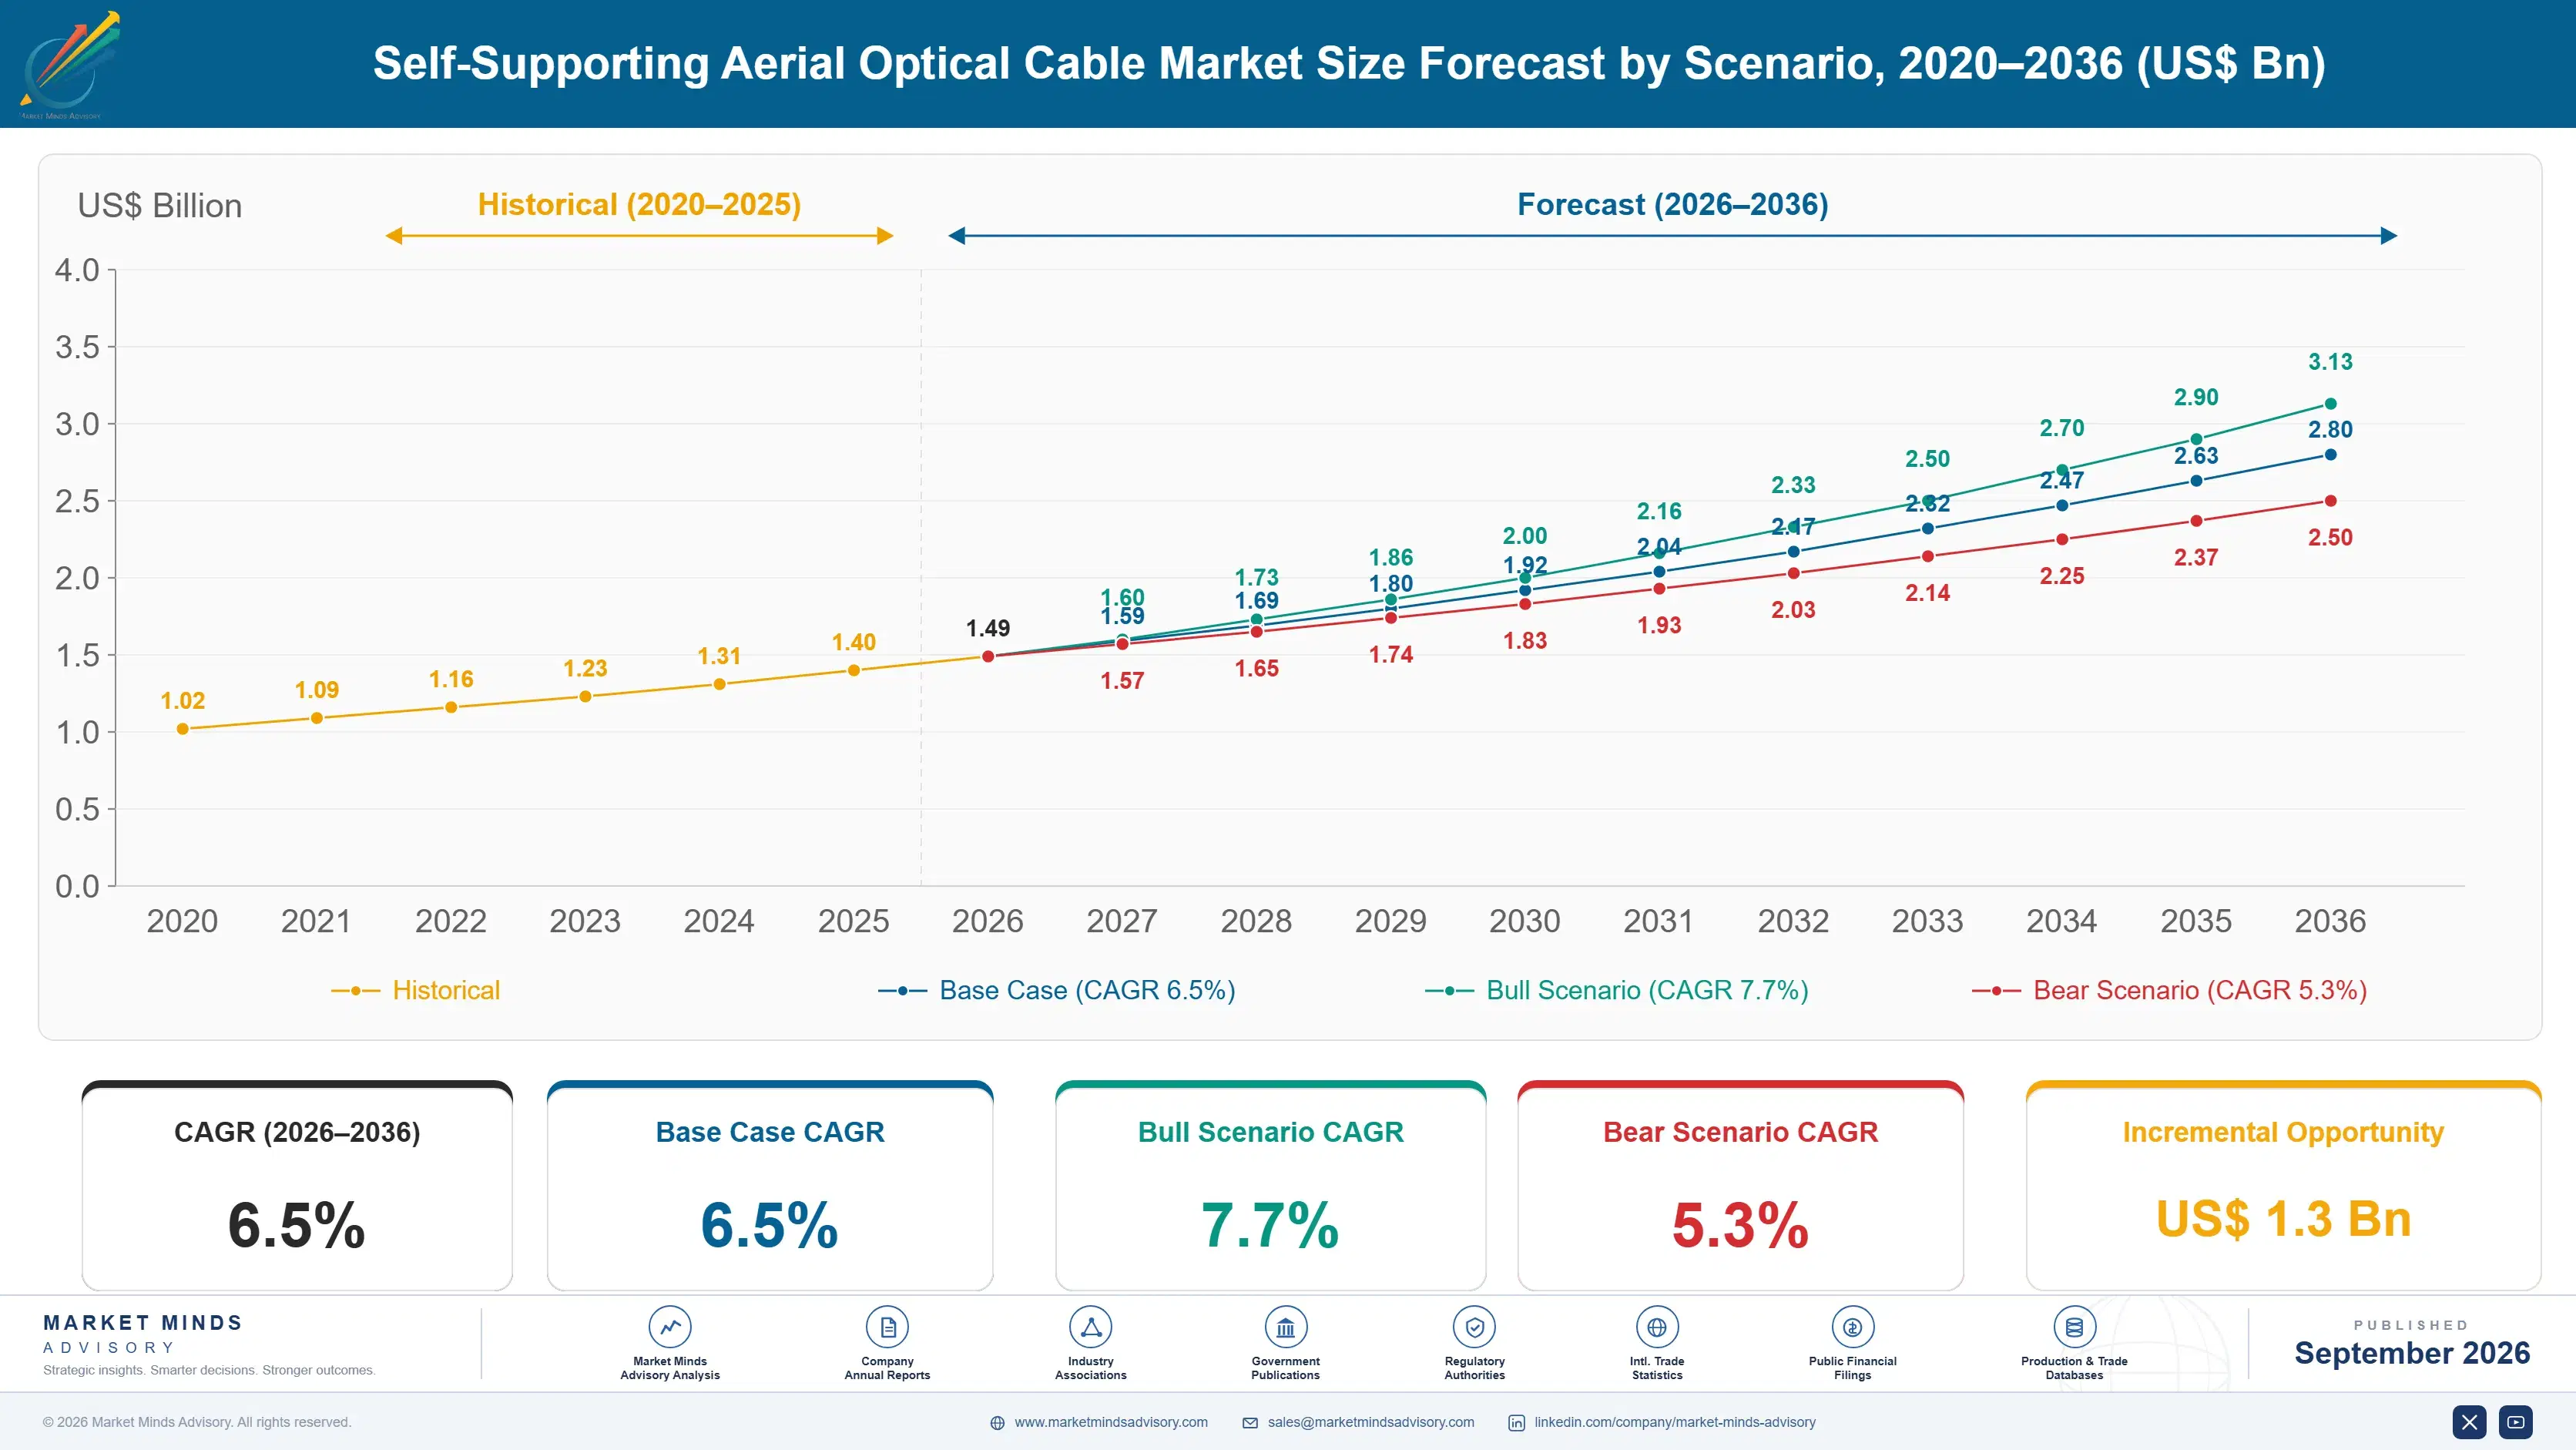
Self-Supporting Aerial Optical Cable Market Forecast Scenarios

self-supporting-aerial-optical-cable-market-size-forecast-scenario-1788454727970
Between 2020 and 2025, self-supporting aerial optical cable volumes expanded steadily as broadband stimulus funding and utility grid-hardening programmes overlapped, producing consistent double-digit annual order growth from a modest base across mature and emerging grids alike. Order books stayed comparatively resilient through interest rate tightening cycles that slowed other construction categories, since pole-based deployment carries materially lower capital intensity than trenched alternatives facing the same funding environment.
The base case assumes continued momentum from three mechanisms: national rural broadband subsidy disbursement schedules, replacement cycles on aging aerial copper plant nearing forty years of service, and utility storm-hardening capital programmes that favour dielectric cable immune to induced lightning current. Certification-driven supplier consolidation reinforces this trajectory further, since qualified capacity additions lag demand growth and keep pricing power concentrated among suppliers who have already cleared utility mechanical testing standards.
A bull scenario assumes accelerated 5G fronthaul densification pulls forward fiber-count upgrades across metro pole networks, while the principal bear risk is prolonged permitting backlogs at municipal pole-attachment authorities that delay contracted deployment schedules by multiple fiscal quarters. Either scenario still favours suppliers holding utility certification over uncertified regional converters competing mainly on price. for suppliers positioning capacity investment now.

Pole Economics and Certification-Driven Demand

Self-supporting aerial optical cable sits at the intersection of telecom fiber build-out and electric utility grid modernisation, and pricing increasingly reflects mechanical certification rather than raw fiber count alone. Buyers increasingly evaluate suppliers on certification portfolio breadth and production scale together, not on cable specifications viewed in isolation from deployment speed. Utility-grade product now trades at a meaningful premium over commodity cable.
MARKET CONCENTRATION41%share held by five largest global cable producers
AVERAGE SELLING PRICE$310/kmtypical average selling price per fiber kilometre installed
ASIAN MANUFACTURING SHARE54%share of output sourced from leading Asian mills
CAPACITY UTILISATION81%aerial cable plant currently operating above rated utilisation
TRADE INTENSITY36%share of finished cable value traded across borders
SERVICE LIFE32 yearsyears typical aerial cable remains in field service
Buyers now specify anti-tracking sheathing, extended span ratings, and ice and wind load tolerances as standard, pushing commodity converters toward regional niches while certified suppliers hold pricing power on utility-grade contracts. Installation service bundling is becoming a meaningful differentiator too, as carriers value deployment timeline certainty given fixed subsidy programme completion deadlines they cannot easily renegotiate. Suppliers combining certified manufacturing with installation support are pulling ahead.
Over the next decade, expect fiber count inflation, tighter storm-hardening codes, and utility right-of-way consolidation to keep qualified capacity scarce relative to announced broadband and grid-resilience commitments across most regions. Suppliers that under-invest in certification now risk permanent exclusion from the largest utility programmes as procurement panels standardise around a shrinking qualified vendor pool. Expect consolidation among regional converters lacking certification investment capacity.
"The real constraint here isn't fiber, it's the pole. Whoever controls attachment sequencing on utility poles effectively controls how fast this market can ship product."
Director, Telecom Infrastructure Practice · MMA Construction and Industrial Equipment Practice · September 2026

Market Trends

Utility Grid-Hardening Codes Favour Dielectric Cable Designs

Regional utility commissions across storm-exposed corridors have tightened aerial plant resilience codes since 2023, mandating lightning-induced current immunity that only all-dielectric self-supporting cable reliably meets without bonding hardware. Several state-level utility commissions now reference these standards directly in capital cost recovery filings, effectively steering aerial fiber replacement toward ADSS designs over lashed alternatives. Suppliers holding third-party mechanical certification against these codes report multi-year order backlogs, while uncertified regional converters are increasingly locked out of investor-owned utility procurement panels regardless of unit pricing offered. This dynamic is reshaping capital allocation industry-wide toward testing infrastructure.
Market Impact: Adds 11 million pole-kilometres demand

Rural Broadband Subsidy Rounds Compress Deployment Timelines

National rural connectivity subsidy programmes across North America, the European Union, and India carry strict multi-year build-out deadlines, pushing awarded carriers toward aerial deployment wherever pole access exists because trenching simply cannot meet contracted milestones. Programme administrators increasingly report aerial fiber accounting for the majority of newly awarded rural miles, reversing a historical preference for buried plant in flatter terrain. This timeline pressure is pulling forward cable orders that would otherwise have been staged across several budget cycles, compressing supplier lead times industry-wide by roughly two full quarters. This compresses lead times industry-wide by roughly two quarters.
Market Impact: Raises average fiber count 38%

Market Opportunities and Growth Drivers

Copper Retirement Programmes Trigger Aerial Replacement Cycles

Incumbent carriers across mature markets are formally retiring legacy copper aerial plant on regulator-approved schedules, and replacement almost universally defaults to self-supporting optical cable given existing pole rights and attachment agreements already in place. Regulatory filings in several jurisdictions now specify copper sunset dates within the next five to seven years, directly tying retirement volume to forecastable aerial fiber replacement demand. Because the pole infrastructure and easements already exist, replacement projects move through permitting far faster than greenfield builds, giving suppliers a comparatively predictable multi-year order visibility window. This visibility is rare for storm-damage-driven categories historically.
Market Impact: Delays 6 months of contracted revenue

5G Fronthaul Densification Drives Metro Fiber Count Inflation

Mobile operators densifying small-cell and fronthaul networks for 5G and early 6G trials increasingly specify higher fiber-count aerial cable per span to avoid repeat truck rolls as node density climbs across metro corridors. Average specified fiber counts on new metro aerial contracts have risen meaningfully over the past three years as operators plan for multi-carrier neutral-host sharing arrangements on shared pole infrastructure. This shift favours suppliers who can manufacture high-count, small-diameter cable without sacrificing the mechanical strength ratings utility pole owners require for attachment approval. Suppliers slow to adapt production risk losing allocation on the largest emerging metro contracts.
Market Impact: Adds 5 points to costs

Market Restraints and Challenges

Municipal Pole Attachment Backlogs Delay Contracted Deployments

Make-ready engineering queues at municipal and investor-owned utility pole owners remain a persistent bottleneck, with attachment applications in several dense metro markets taking considerably longer to clear than the underlying cable installation itself. The root cause is chronic underinvestment in utility make-ready engineering staff relative to the surge in attachment requests from broadband and wireless carriers simultaneously. The commercial impact shows up as slipped revenue recognition on subsidy-funded projects carrying fixed completion deadlines. Several state regulators are now piloting one-touch make-ready rules and shot-clock enforcement to compress these queues, though adoption remains uneven across jurisdictions.
Market Impact: Lifts certified ADSS share by 9%

Sheathing Resin Price Volatility Compresses Converter Margins

Polyethylene and specialty fire-retardant sheathing compounds, sourced largely from petrochemical feedstock, have swung sharply in price over recent contract cycles, squeezing margins at converters without long-term resin supply agreements. The underlying driver is feedstock naphtha volatility tied to global refining capacity utilisation rather than cable-specific demand shifts, leaving smaller producers exposed to costs they cannot pass through on fixed-price utility contracts. Larger suppliers are responding by locking multi-year resin offtake agreements and qualifying secondary bio-based compound sources, though certification lag on new formulations means relief remains at least several quarters away for most of the field.
Market Impact: Pulls forward 14 percent of orders
3 additional market trends, 4 additional growth drivers, and 2 additional restraints and challenges are covered in the full report. Contact sales@marketmindsadvisory.com to access the complete intelligence.

Segment CAGR and Growth Architecture

Segmentation follows cable design and application tier, from standard short-span aerial cable through high-strength long-span designs to instrumented smart-monitoring systems, keeping upstream manufacturing distinct from downstream deployment services, since bundled installation support increasingly shapes which suppliers win the largest multi-year utility and carrier framework agreements today. This distinction keeps commercial analysis aligned with how buyers actually issue.
self-supporting-aerial-optical-cable-market-market-share-analysis-1788454728502

AI-Enabled Smart Monitoring ADSS Cable Systems

Embedded distributed acoustic and temperature sensing fiber within the cable sheath lets utilities and carriers detect ice loading, unauthorized third-party attachment, and vegetation contact in near real time without dedicated inspection patrols. Grid operators piloting these systems report meaningfully reduced storm-related outage investigation time because fault location narrows to a specific span rather than an entire circuit. Adoption remains concentrated among investor-owned utilities and tier-one carriers with capital budgets for analytics platforms, but unit costs are falling as sensing interrogator hardware standardises across vendors. Expect this segment to keep outpacing the broader cable market as resilience mandates increasingly reference continuous monitoring rather than periodic manual inspection alone. Pricing reflects this scarcity directly.
CAGR 13.4%

High-Fiber-Count ADSS Cable for Metro and Data Center Interconnect

Rising small-cell density and hyperscale data center interconnect requirements are pushing specified fiber counts on new metro aerial spans well above legacy norms, favouring suppliers who can hold small cable diameter at high count without compromising span strength ratings. Neutral-host and shared-infrastructure arrangements among multiple carriers on a single pole run further inflate per-span fiber requirements since capacity must be provisioned for several tenants at once rather than a single operator. Manufacturers are responding with ribbon and rollable-ribbon fiber architectures that pack more strands into a comparable outer diameter, a design shift that is reshaping which converters can compete for the largest metro contracts going forward. Early movers are locking in share.
CAGR 10.8%
Full segment breakdown across 6 segments available in the complete report.

Regional Architecture and Country Demand Map

East Asia leads on manufacturing scale and domestic grid fiber build-out, North America follows closely on subsidy-funded rural deployment and grid-hardening capital programmes, while remaining regions trail on smaller pole networks, slower certification adoption, and gradual permitting reform, with the gap narrowing only slowly. Certification pace explains.

North America

Utility storm-hardening capital programmes and multi-year rural broadband subsidy rounds anchor demand here, with several state regulators now referencing dielectric cable performance directly in resilience filings. Investor-owned utilities are replacing aging aerial copper plant on regulator-approved retirement schedules, and the existing pole and easement base lets replacement projects clear permitting faster than greenfield builds elsewhere. Make-ready backlogs at municipal pole owners remain the binding constraint on how quickly awarded subsidy miles actually get strung, and several states are piloting shot-clock rules to compress attachment queues. Average selling prices stay firm because utility-grade mechanical certification requirements keep uncertified regional converters off the largest procurement panels, concentrating volume among suppliers who have already cleared third-party testing.
Share: 22% | CAGR: 7.5% (2026 to 2036)

Western Europe

National broadband agencies across the region continue funding rural fiber-to-the-premises extensions where trenching costs run prohibitively high across dispersed rural settlement patterns, favouring aerial deployment on existing utility poles instead. Grid operators in storm-exposed coastal and alpine corridors are separately upgrading aerial plant resilience specifications, a slower-moving but steady secondary demand channel. Fragmented national certification standards across member states raise qualification costs for suppliers trying to serve multiple markets from a single product line, a persistent friction not present in more centralised procurement regions. Overall order volumes track modestly below North America because a larger share of the remaining unconnected premises already sit within economically viable trenching distance of existing ducted infrastructure.
Share: 20% | CAGR: 5.0% (2026 to 2036)
Regional intelligence for 5 additional markets available in the complete report: East Asia, South Asia and Pacific, Latin America, Middle East and Africa, Eastern Europe. Contact sales@marketmindsadvisory.com.
self-supporting-aerial-optical-cable-market-country-cagr-analysis-1788454729028

Certification, Fiber Density, and Service Bundling Economics

Suppliers hold pricing power where mechanical certification, fiber count scaling, and installation service bundling combine, letting qualified players capture margin beyond raw cable manufacturing that commodity converters cannot easily replicate at comparable cost, speed, or scale across most major contract categories today. Suppliers lacking any of these three levers increasingly struggle to defend margin against faster-moving certified.

Third-Party Mechanical Certification for Utility Procurement Panels

Clearing recognised utility mechanical and dielectric certification standards is the single largest gate separating suppliers who can bid investor-owned utility contracts from regional converters restricted to smaller municipal work. Certification typically takes twelve to eighteen months and requires dedicated testing investment, but suppliers who clear it report utility contract pricing running roughly 15 to 20 percent above uncertified regional product on comparable specifications. Once certified, suppliers tend to retain panel status for multiple renewal cycles since utilities are reluctant to requalify new vendors absent a clear cost or performance gap, making certification a durable rather than temporary advantage.
Market Impact: Adds 15 to 20 percent price premium overall

High-Fiber-Count Ribbon Architecture for Metro Contracts

Shifting production toward rollable-ribbon fiber architecture lets suppliers offer higher strand counts within existing cable diameter limits, directly addressing the metro densification and neutral-host sharing trend reshaping specification requirements on new urban contracts. Suppliers who have converted at least part of their line capacity to ribbon architecture report capturing a growing share of the largest metro contracts specifically because incumbent round-fiber designs cannot match count within comparable outer diameter limits. The conversion capital cost is meaningful, but suppliers recover it within roughly 2 to 3 years given the price premium high-count ribbon cable commands over standard round-fiber product.
Market Impact: Captures 22 percent share of metro tenders now

Bundled Make-Ready Engineering and Installation Services

Suppliers who bundle make-ready engineering support alongside cable supply help carriers clear pole attachment queues faster, directly addressing the sector's single largest deployment bottleneck rather than competing on cable price alone. Carriers increasingly favour suppliers offering this bundled service given persistent make-ready staffing shortages at utility pole owners, and several suppliers now report service attach rates climbing by roughly 18 percentage points on major subsidy-funded contracts specifically because timeline certainty carries real value against fixed programme deadlines. This shift moves qualified suppliers up the value chain from commodity cable vendor toward deployment partner, a repositioning that supports.
Market Impact: Lifts blended contract margin by 4 points overall

Embedded Distributed Sensing for Resilience-Linked Contracts

Offering cable pre-integrated with distributed acoustic and temperature sensing fiber positions suppliers to capture premium pricing on the fastest-growing resilience-linked utility contracts, where continuous span monitoring is becoming a specification requirement rather than an optional add-on. Early adopting suppliers report meaningfully higher, roughly 25 to 30 percent, per-kilometre pricing on sensing-enabled contracts relative to standard ADSS cable, reflecting both the embedded fiber cost and the analytics platform integration utilities increasingly require. As sensing interrogator hardware standardises across vendors and unit costs continue falling, expect this premium to persist even as adoption broadens beyond the current tier-one utility.
Market Impact: Commands roughly 30 percent pricing premium across major contracts

Who Controls the Margin Pool

Concentration sits moderate at a cr5 near 41 percent measured on global production capacity, with a meaningful gap separating the top two certified suppliers from a long tail of regional converters competing mainly on price in uncertified segments of the market. Below that top tier, a long list of regional converters compete mainly on price within uncertified segments. That gap is widening rather than closing, since certified suppliers keep.
Current competitive activity centres on three dimensions: expanding ribbon fiber architecture production lines, pursuing utility mechanical certification across additional jurisdictions, and building distributed sensing integration partnerships with fiber optic sensing technology providers to capture resilience-linked contracts. Several suppliers are also adding regional compounding capacity to cushion feedstock cost swings. Consolidation activity has also picked up, with several mid-sized regional converters.

Emerging pressure comes from Chinese state-backed producers scaling ribbon architecture capacity faster than expected, which could compress pricing on standard fiber-count product and push established suppliers further toward certified high-strength and sensing-enabled niches where scale alone matters less. Established suppliers are responding by deepening certification moats rather than competing purely on unit price. Watch for share shifts toward suppliers combining certification breadth with sensing.
self-supporting-aerial-optical-cable-market-company-positioning-matrix-1788454729551

Competitive Moat and Risk Dimensions

CORNING INCORPORATED

Moat: Vertically integrated fiber production

Corning draws its own optical fiber and manufactures finished cable within the same production network, giving it cost and quality control that converters buying fiber on the open market cannot match. This integration lets Corning move faster on new ribbon architecture formats since fiber and cable teams coordinate directly.
CORNING INCORPORATED

Risk: Exposure to construction cycle swings

A meaningful share of Corning's cable volume ties to telecom carrier capital budgets, which move with broader construction and infrastructure spending cycles and can slow sharply during rate-driven capital discipline periods. Because fixed manufacturing costs stay largely constant regardless of order volume, utilisation swings compress margins faster here than at smaller, more flexible regional converters during a demand downturn.
PRYSMIAN GROUP

Moat: Broadest utility certification footprint

Prysmian holds mechanical and dielectric certification across more national utility standards bodies than most competitors, a portfolio built over years of jurisdiction-by-jurisdiction qualification work new entrants cannot replicate quickly. This breadth lets Prysmian bid utility contracts across three continents from a shared product platform. Few rivals can match this reach today.
PRYSMIAN GROUP

Risk: Integration risk from prior acquisitions

Prysmian's scale partly reflects a series of past cable industry acquisitions, and folding acquired production lines onto common quality and certification standards remains an ongoing operational task across its manufacturing footprint. Any execution slip on this integration work risks inconsistent product quality across plants, which could jeopardise certification standing with utility customers who audit supplier manufacturing sites directly.

Players Tracked

Prominent Players

Corning Incorporated
Prysmian Group
Sterlite Technologies
Fujikura Ltd
ZTT Group

Other Key Players

Nexans SA
LS Cable & System
Furukawa Electric
YOFC (Yangtze Optical Fibre and Cable)
OFS Fitel
Belden Inc
Hengtong Group
Finolex Cables
Birla Cable
HFCL Limited
TE Connectivity
CommScope Holding
AFL Telecommunications
Southwire Company
General Cable Technologies

Recent Developments

MARCH 2026

Corning Expands Ribbon Fiber Cable Line in North Carolina

Corning announced expanded rollable-ribbon fiber cable production capacity at its existing North Carolina facility, targeting rising metro fiber-count specifications tied to 5G densification and hyperscale data center interconnect demand across North American markets. The expansion follows sustained backlog growth on comparable ribbon lines. Regional capacity additions typically.
Signal: Signals suppliers are betting on sustained high-count aerial fiber demand from metro carriers. Reinforces confidence in multi-year metro contract pipelines.
NOVEMBER 2025

Prysmian Completes Utility Certification in Three New States

Prysmian Group completed third-party mechanical and dielectric certification for self-supporting aerial cable across three additional state utility jurisdictions, expanding the pool of investor-owned utility procurement panels the company can bid directly. The company now holds certification across a majority of major state utility jurisdictions nationwide.
Signal: Confirms certification remains the primary lever suppliers use to secure new utility contract access. Widens the addressable panel base materially.
JUNE 2025

ZTT Group Signs Supply Agreement With Southeast Asian Carrier

Jiangsu Zhongtian Technology signed a multi-year supply agreement with a Southeast Asian mobile carrier to provide high-fiber-count aerial cable for a metro backhaul densification programme spanning several major cities across the contract term. The agreement includes provisions for future high-count ribbon cable volume as the carrier's densification programme scales further.
Signal: Shows Chinese producers actively pursuing long-term contracts outside their traditional domestic base. Extends Chinese supplier reach into new export markets.

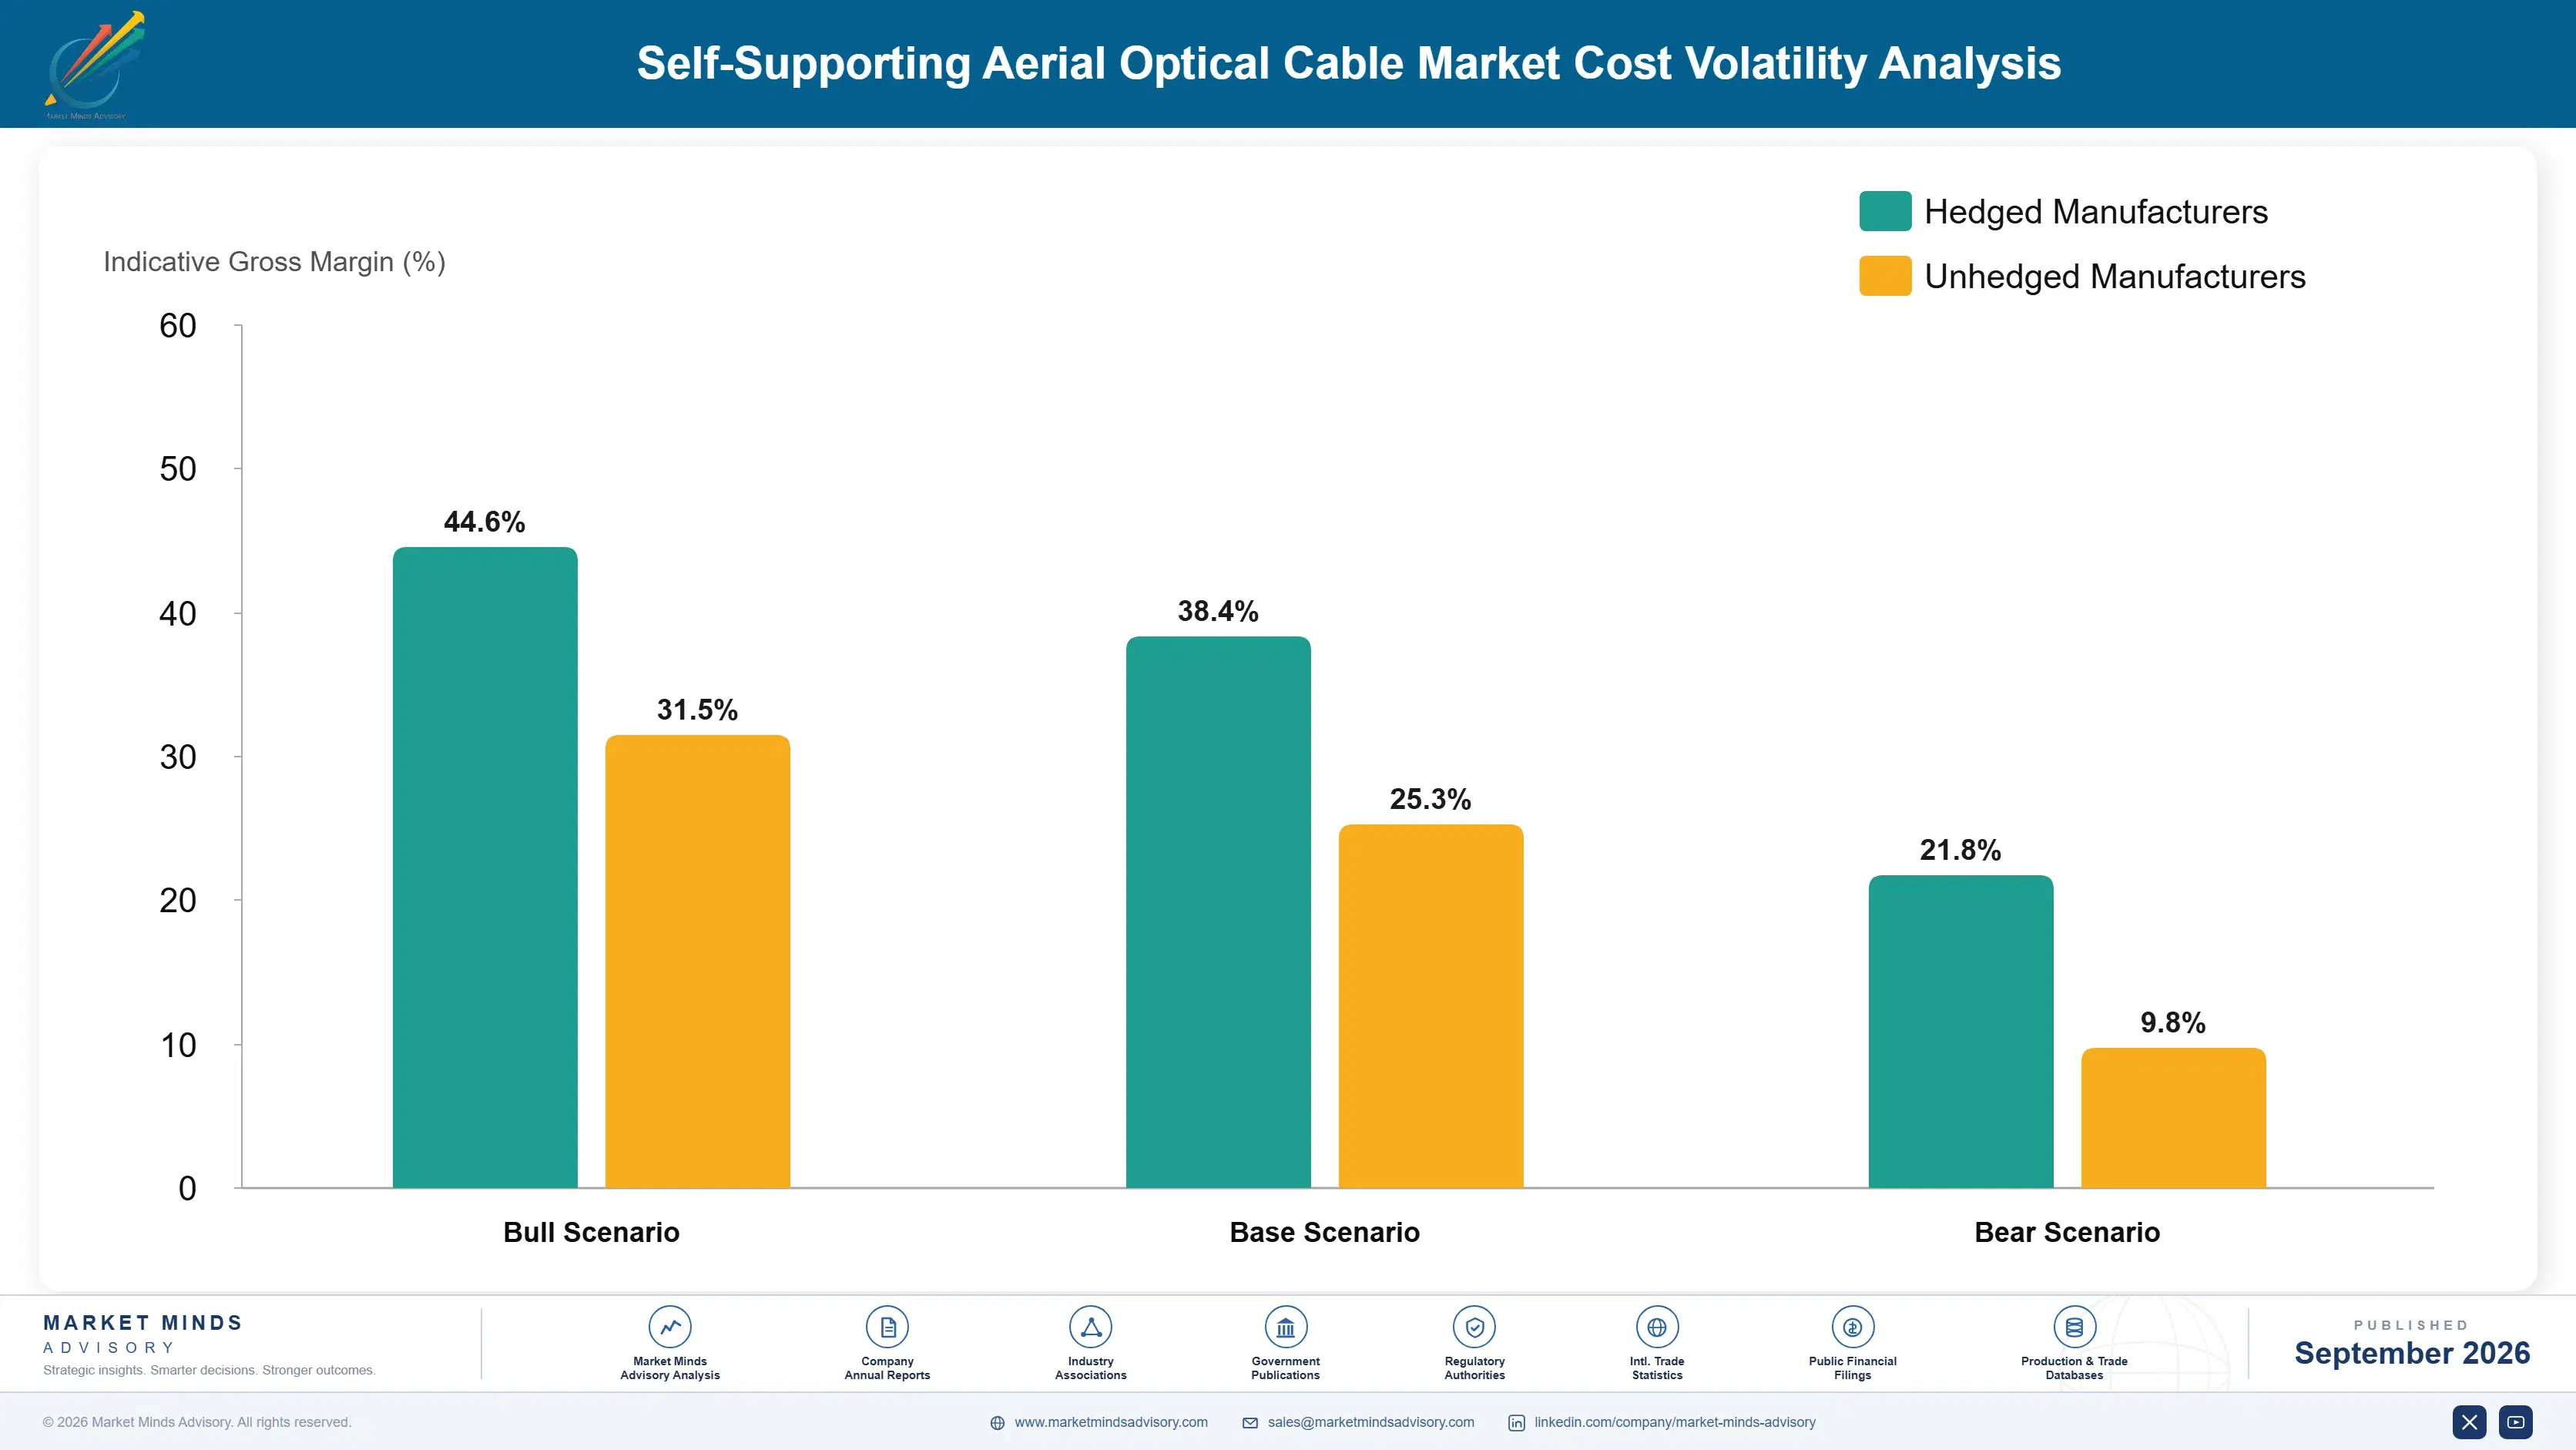
Resin and Fiber Feedstock Exposure

Polyethylene and fire-retardant compound sheathing typically account for a meaningful share of finished cable cost of goods sold, sourced largely from petrochemical feedstock refined across a concentrated set of global producers rather than cable-specific supply chains. Suppliers without long-term compound supply agreements carry the greatest direct exposure to this feedstock concentration. Suppliers holding long-term compound agreements largely insulate themselves from short-term spot market swings affecting.
Naphtha and polyethylene prices moved sharply during a 2024 refining capacity disruption tracked by the IEA, compressing converter margins across the industry within a single quarter and forcing several regional producers to renegotiate fixed-price utility supply agreements mid-contract. Several regional converters reported margin compression exceeding four points during the disruption quarter alone. Recovery took roughly two quarters as refining capacity gradually normalised, though several converters permanently renegotiated pricing terms with utility customers following the episode.

Smaller regional converters without long-term resin offtake agreements carry the largest exposure to this volatility since they typically lack the purchasing scale to negotiate multi-year fixed pricing, while vertically integrated global suppliers can partially hedge through diversified sourcing relationships. Vertically integrated global suppliers weathered the disruption with comparatively limited margin impact, particularly across smaller export-dependent manufacturing regions.
self-supporting-aerial-optical-cable-market-cost-volatility-analysis-1788454729745

Multi-Year Resin Offtake Agreements With Diversified Suppliers

Larger suppliers are locking multi-year polyethylene and compound supply agreements across multiple petrochemical producers rather than relying on spot purchases, smoothing input cost volatility and protecting margin on fixed-price utility contracts signed years in advance of delivery. This approach has already cut realised input cost volatility meaningfully for early adopters across recent contract cycles.

Qualification of Bio-Based Sheathing Compound Alternatives

Several suppliers are qualifying bio-based and recycled-content sheathing compounds as partial feedstock substitutes, reducing petrochemical exposure over time, though certification lag against existing utility mechanical standards means broad adoption remains several quarters away industry-wide. Early results suggest performance parity is achievable once certification testing catches up with formulation development timelines. Full-scale rollout remains contingent on standards bodies.

Regional Compounding Capacity Closer to Cable Plants

Suppliers are investing in regional compound mixing capacity located nearer finished cable plants, cutting logistics cost and lead time exposure that previously compounded raw feedstock price volatility with shipping and inventory carrying cost pressure. This localisation strategy also shortens response time when feedstock markets move sharply within a single quarter. It also builds local employment goodwill.

Portfolio Architecture for Margin Defence

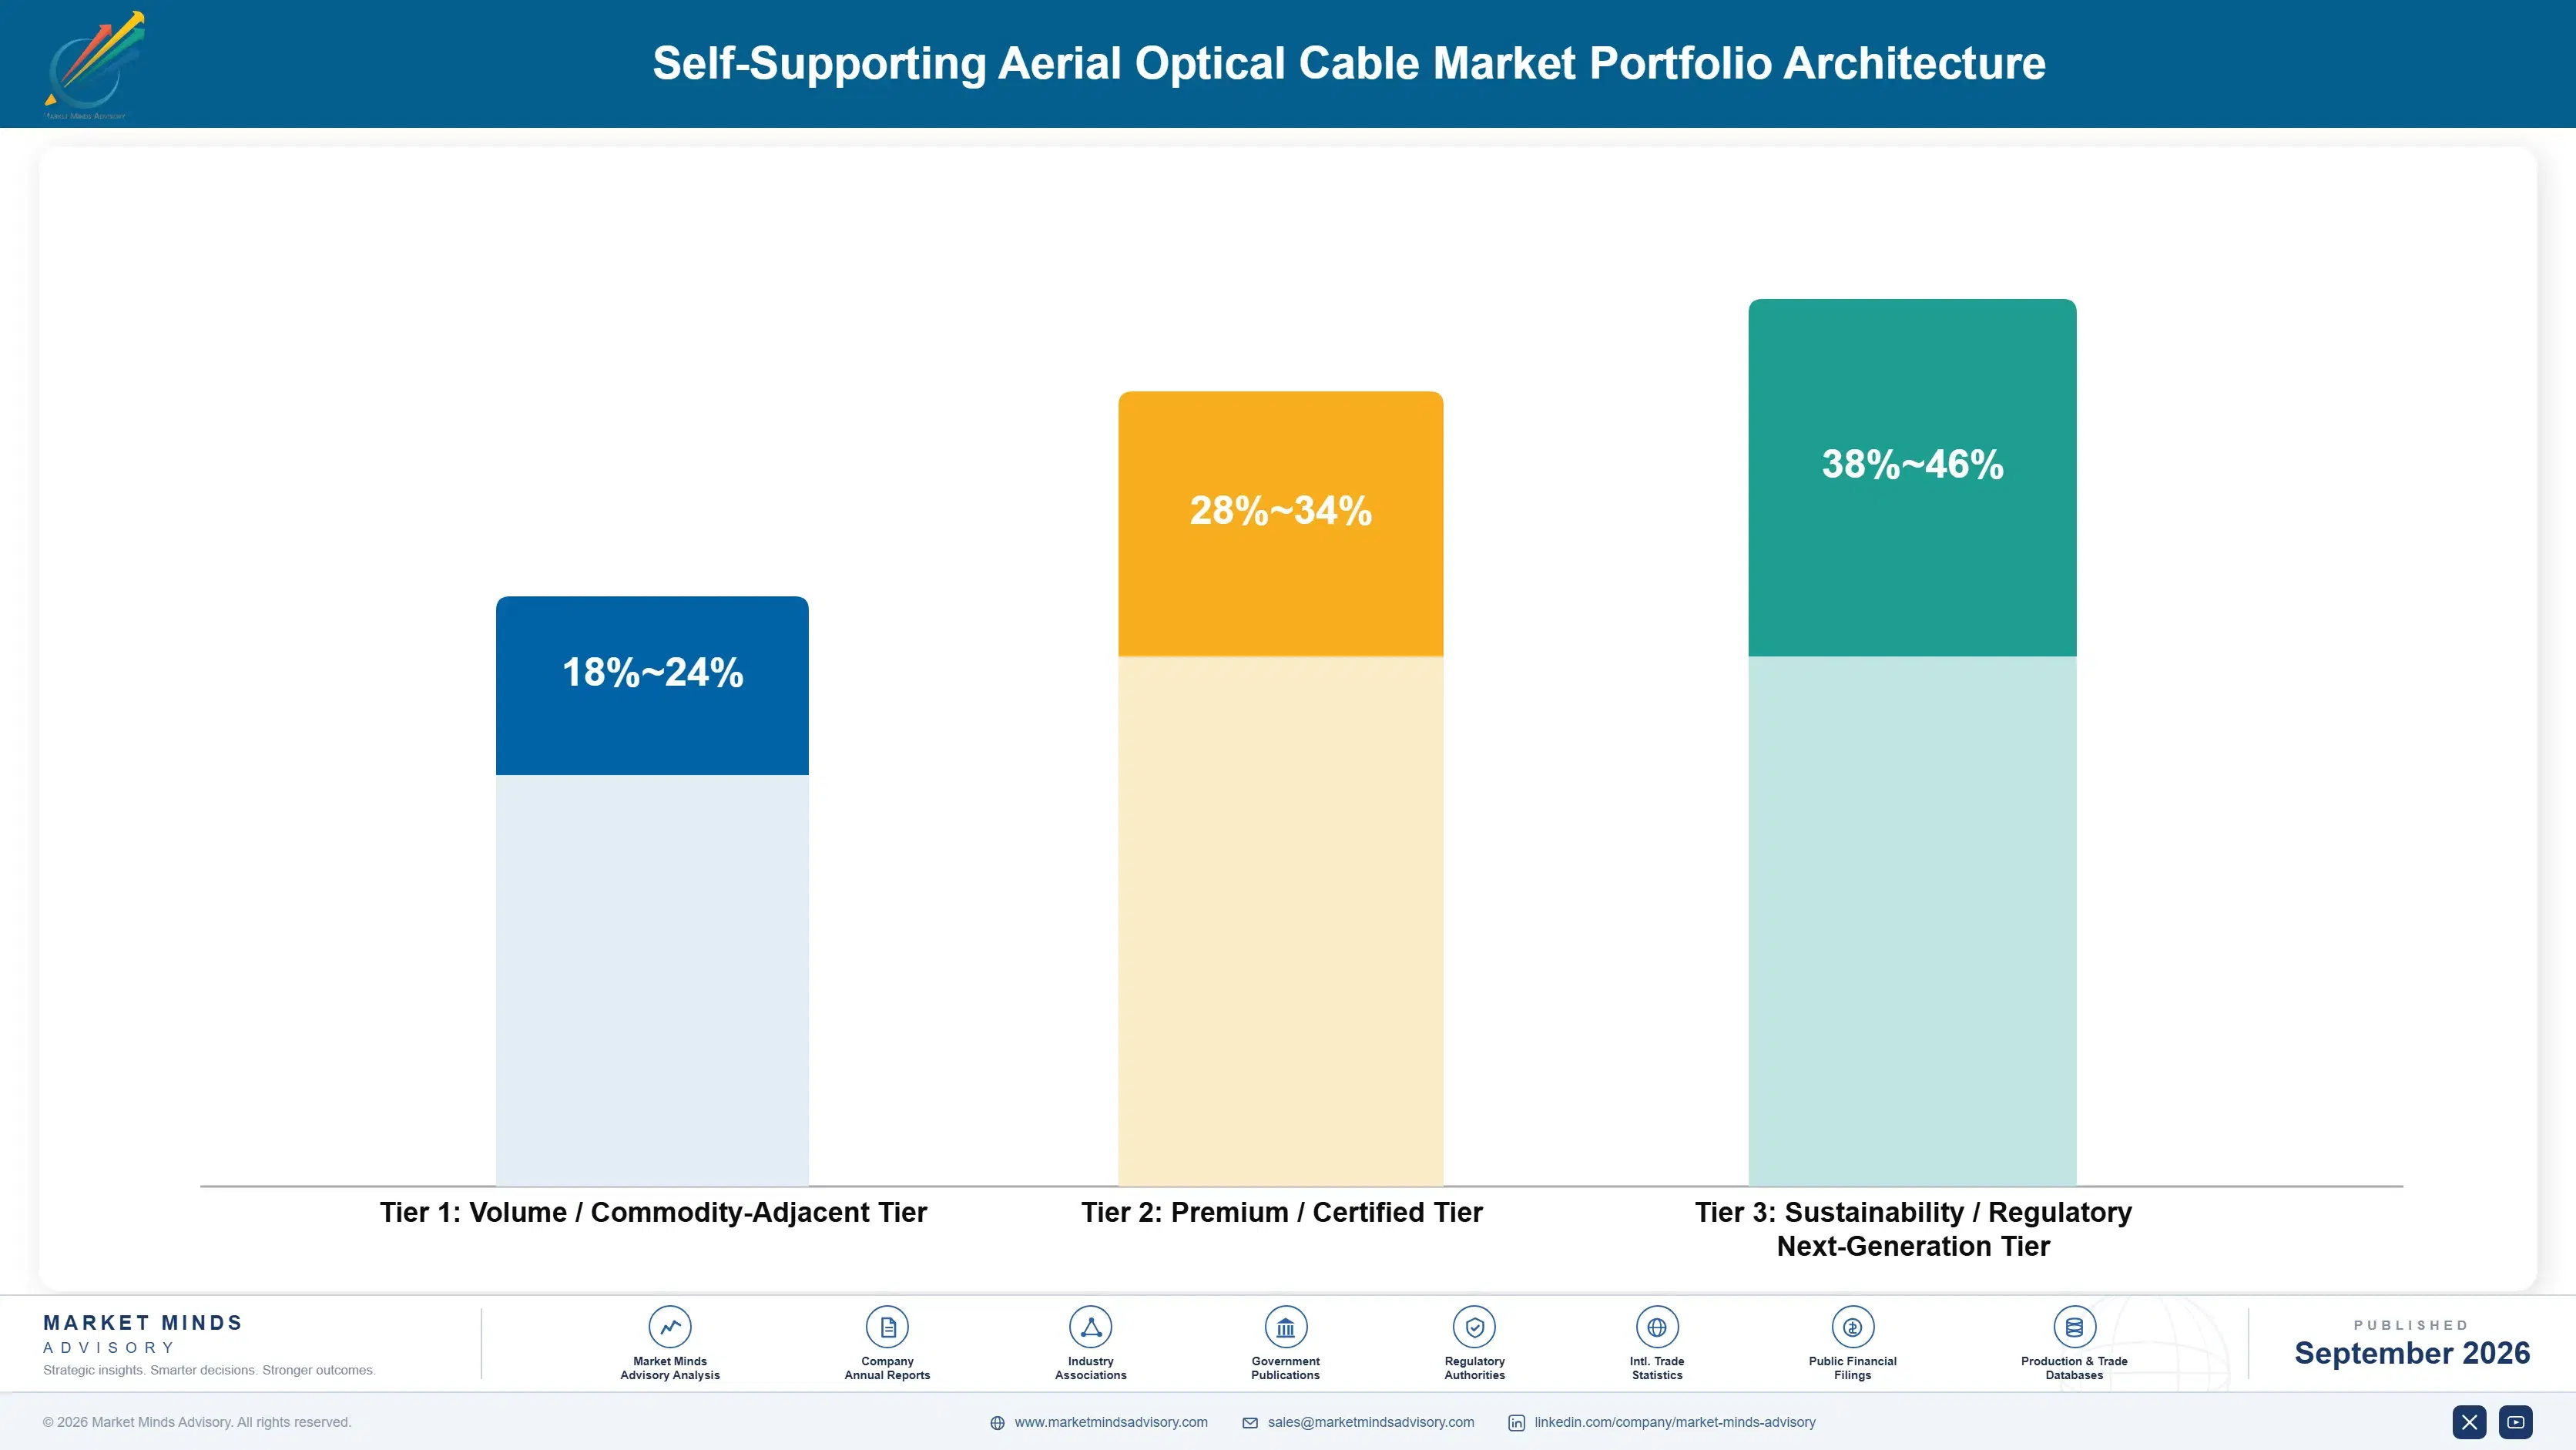
Portfolio economics split across three tiers running from commodity-adjacent standard aerial cable through certified premium product to sensing-enabled next-generation systems, with gross margin widening meaningfully at each successive tier as certification and integration complexity increase. Suppliers positioned only in the commodity-adjacent tier face the steepest margin pressure as certification requirements spread across more procurement panels. This structure mirrors margin patterns seen in other certified industrial component.
Volume still concentrates in the standard certified tier where most utility and carrier contracts sit today, but premium and next-generation tiers are growing faster and increasingly determine which suppliers win the largest multi-year framework agreements. Suppliers straddling both tiers manage this tension by dedicating separate production lines to each rather than blending specifications. Neither approach is inherently superior, but capital allocation decisions increasingly favour whichever.

High-value margin pools concentrate specifically around sensing-enabled resilience contracts and high-fiber-count metro ribbon product, where certification barriers and integration complexity keep commodity converters from competing effectively on price alone. Suppliers positioned early in these pools are best placed to defend margin as broader market growth inevitably moderates over time. Suppliers slow to build sensing and analytics capability risk ceding this margin pool.

Volume / Commodity-Adjacent Tier

Standard round-fiber ADSS cable meeting baseline mechanical and dielectric specifications, sold mainly on price and lead time into smaller municipal and rural carrier contracts without extended certification requirements. Margins stay thin given intense price competition.
Gross Margin: 18%-24%

Premium / Certified Tier

Certified high-strength cable meeting investor-owned utility mechanical standards and extended span ratings, commanding meaningful price premiums over standard product given the certification barrier competitors must clear first. Repeat business is common once qualified.
Gross Margin: 28%-34%

Sustainability / Regulatory / Next-Generation Tier

Sensing-enabled and ribbon high-fiber-count systems sold into resilience-linked utility contracts and metro densification tenders, carrying the widest margins given embedded analytics integration and scarce qualified production capacity. Few suppliers currently compete here at scale.
Gross Margin: 38%-46%
self-supporting-aerial-optical-cable-market-portfolio-architecture-1788454730246

High-value Sub-segments and Strategic Watch-out

Distributed Sensing-Enabled ADSS Systems

Cable pre-integrated with distributed acoustic and temperature sensing fiber commands the widest margins in the category as utility resilience mandates increasingly reference continuous monitoring, though adoption still concentrates among tier-one utilities with dedicated analytics budgets today. Expect broader adoption within several years. within the next several years across.
Gross Margin: 40%-46%

High-Fiber-Count Ribbon Metro Cable

Ribbon architecture cable serving neutral-host metro densification contracts grows steadily as multi-carrier pole sharing arrangements spread, commanding solid premiums over round-fiber product though not yet matching sensing-enabled system margins across most current contracts. Expect continued steady share gains ahead. as more carriers adopt shared neutral-host pole arrangements broadly.
Gross Margin: 30%-36%

Standard Certified Rural Broadband Cable

Certified standard cable serving subsidy-funded rural broadband build-out remains the largest volume pool by a wide margin, carrying moderate but stable margins as programme timelines guarantee multi-year order visibility across most participating suppliers. This tier anchors most supplier revenue today. and will likely remain the largest single volume.
Gross Margin: 26%-32%

Uncertified Commodity Regional Cable

Regional converters selling uncertified standard cable into smaller municipal contracts face the greatest margin compression risk as utility procurement panels increasingly require third-party certification, gradually excluding this tier from the largest available contracts. Consolidation among converters here looks likely. as certification requirements spread into smaller municipal contracts over time.
Gross Margin: 14%-20%

Replacement Cycles and Vertical Adoption Depth

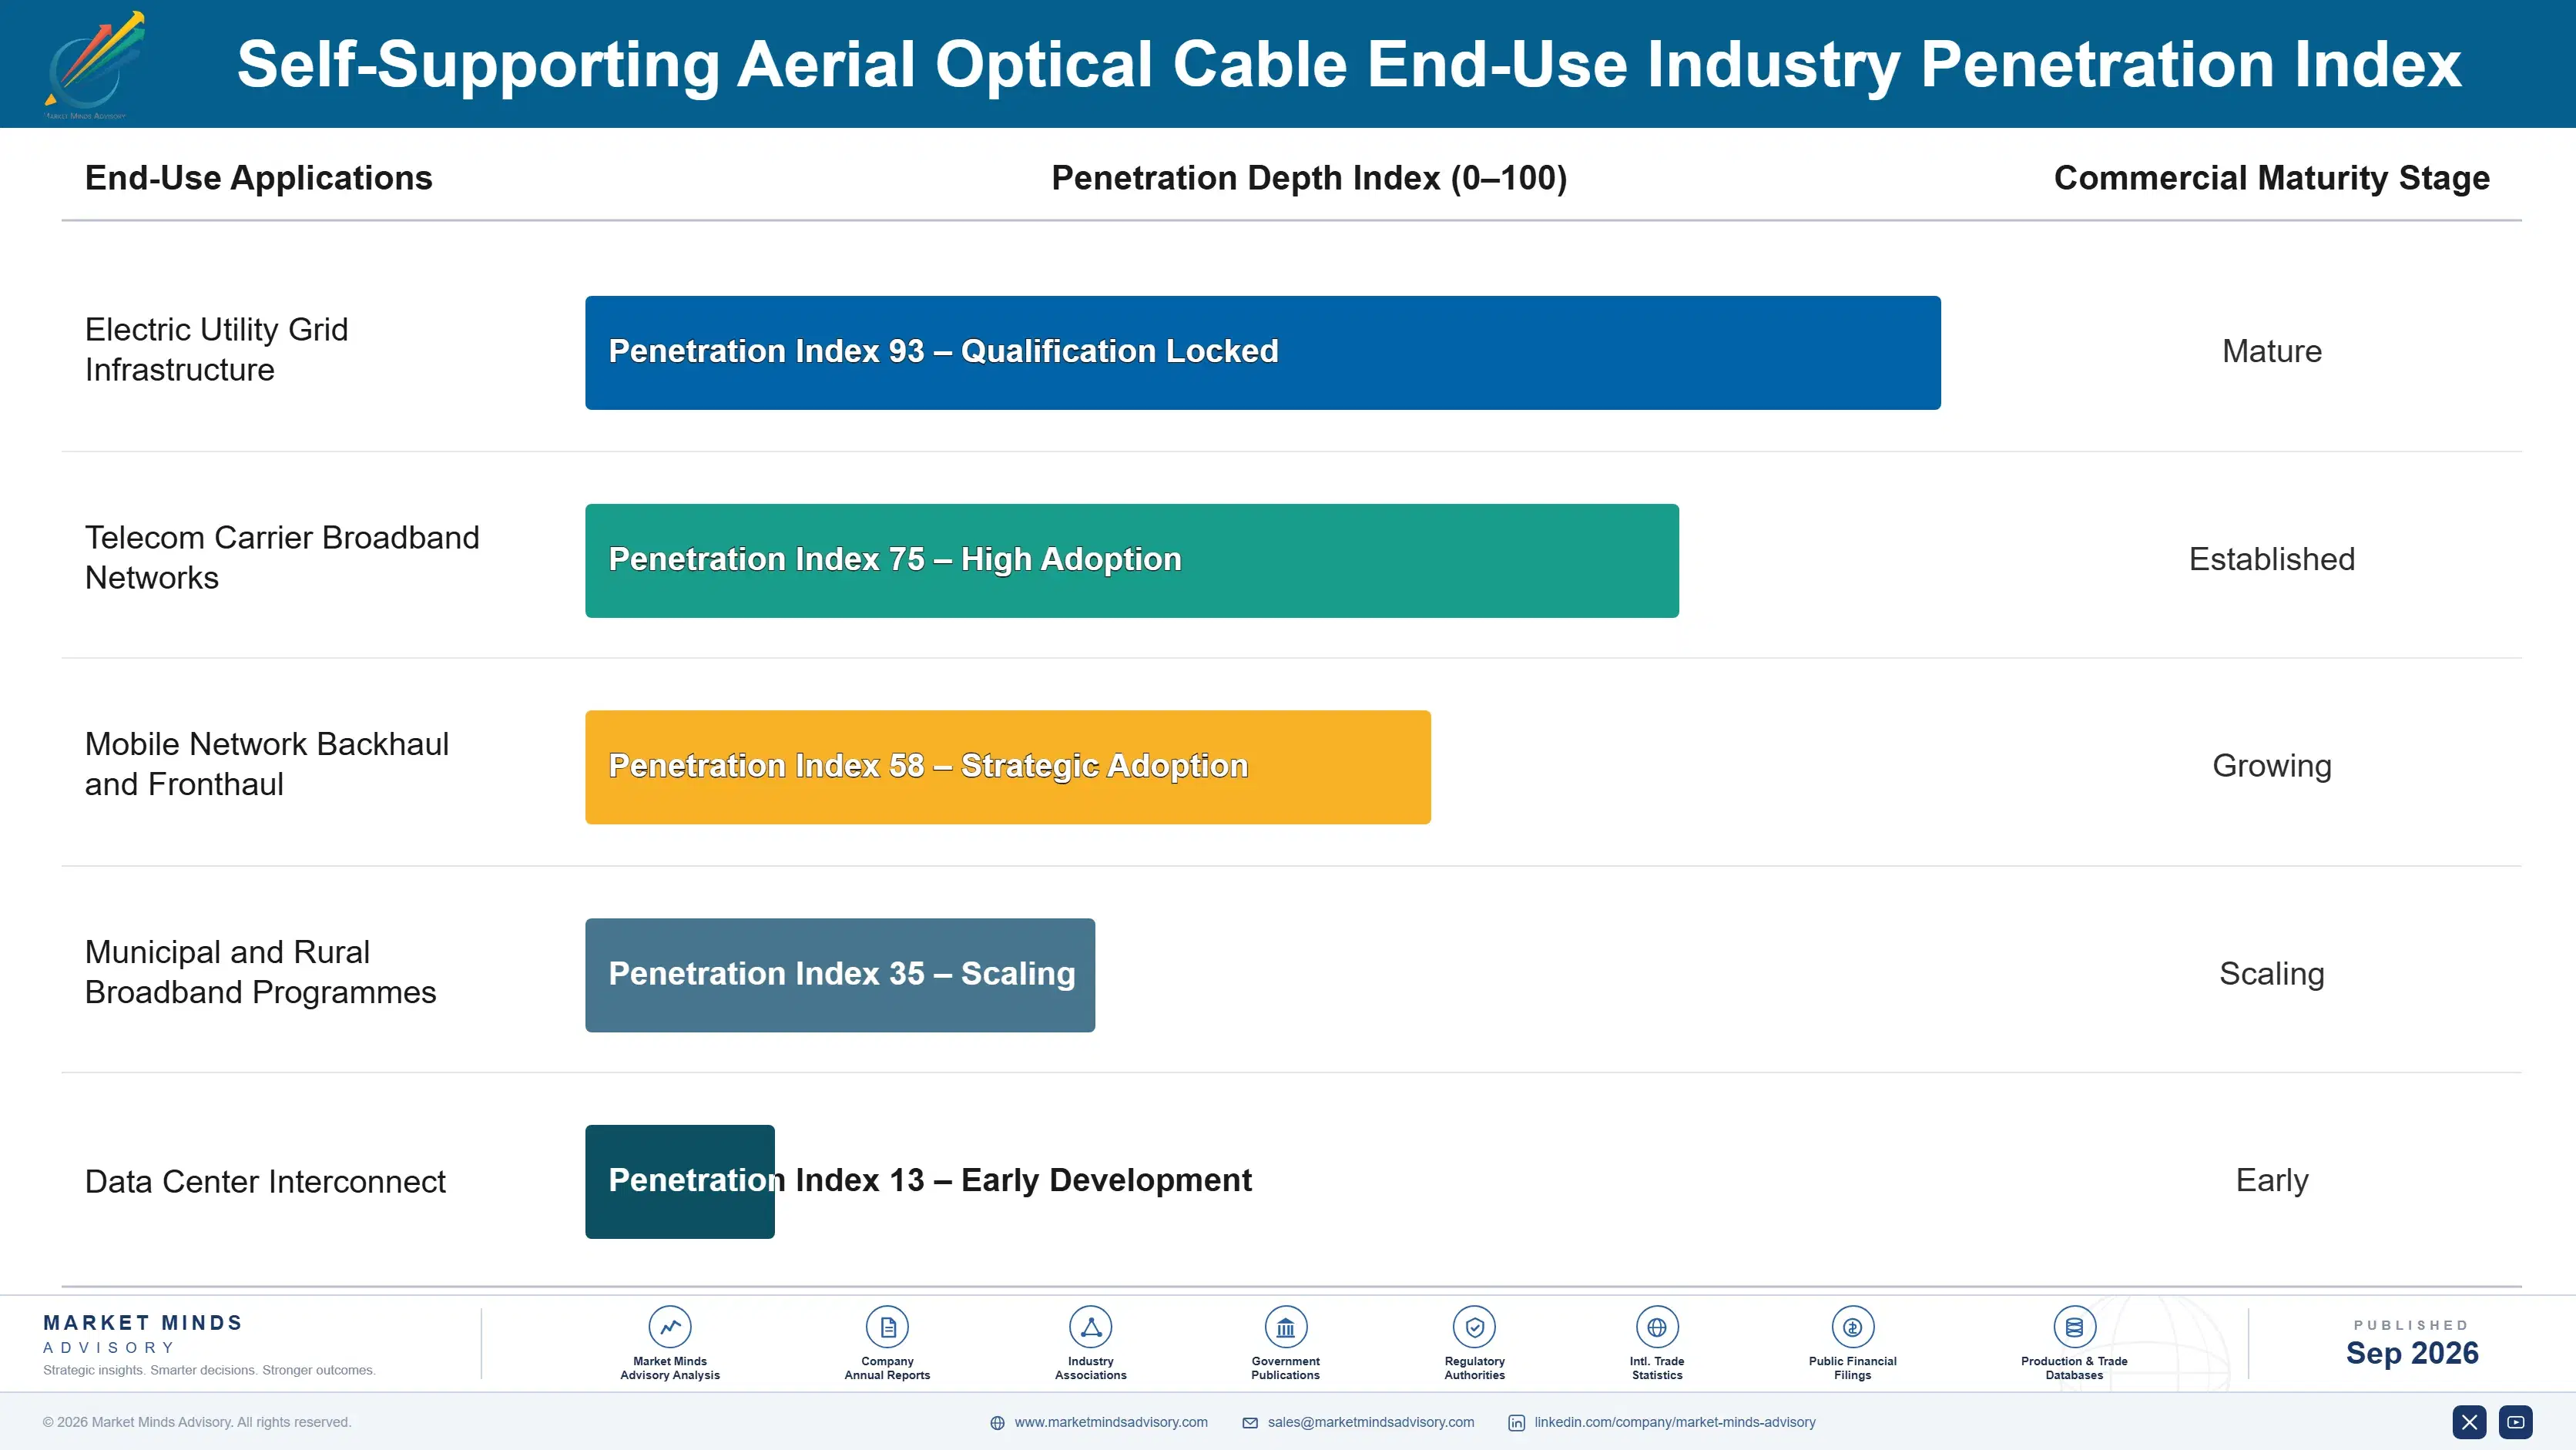
Aerial cable revenue behaves like a long-cycle annuity once installed, since replacement typically occurs only after twenty-five to forty years of service or following storm damage, giving suppliers predictable but infrequent per-site repeat purchase timing. This long service life makes installed base a poor proxy for near-term order volume compared with active build-out programmes. Suppliers instead depend on new build-out volume, which is why.
Adoption depth varies meaningfully by end-use vertical: investor-owned utilities integrate certified cable deeply into standardised procurement specifications across their entire service territory, while smaller rural cooperatives often mix suppliers project by project based on available budget. Hyperscale data center operators sit at the deepest adoption end, specifying certified high-count cable as a default rather than an exception. Smaller rural cooperatives sit at the shallow.

A generational shift is underway as utility engineering teams that specified copper and lashed fiber for decades give way to younger staff trained on dielectric and sensing-enabled systems, accelerating specification changes faster than the underlying replacement cycle alone would suggest. Vendor relationships are shifting accordingly toward suppliers who can demonstrate sensing and analytics competence, not cable manufacturing alone. Suppliers who fail to build credibility with newer engineers risk losing preferred status.
self-supporting-aerial-optical-cable-market-end-use-penetration-index-1788454730735

Where Suppliers Should Focus Capital Next

These are among the four positions where our research anticipates prominent divergence between winners and laggards over the coming forecast period. Each is grounded in the demand model, the regulatory perimeter, and the announced capacity pipeline.
01 / CERTIFICATION INVESTMENT PRIORITY

Clear Utility Certification Before Chasing Volume Growth

Suppliers without recognised mechanical and dielectric certification remain locked out of the largest and most stable utility procurement panels regardless of price competitiveness offered on comparable cable specifications. Certification takes twelve to eighteen months and meaningful testing investment, but it delivers pricing power and multi-year contract visibility that uncertified regional converters cannot access at any volume. MMA advises prioritising certification in target jurisdictions ahead of capacity expansion, since capacity without certification simply competes harder in the shrinking commodity tier., and delay here carries real opportunity cost.
02 / RIBBON ARCHITECTURE TRANSITION

Convert Production Capacity Toward High-Count Ribbon Fiber

Metro densification and neutral-host pole sharing arrangements are steadily raising specified fiber counts on new contracts faster than standard round-fiber architecture can economically accommodate within existing diameter limits. Suppliers who have already converted meaningful production capacity toward rollable-ribbon architecture are capturing a growing share of the largest metro tenders specifically because incumbent designs cannot compete on count. MMA sees the conversion window narrowing over the next several years as ribbon architecture becomes the default specification on major urban contracts rather than a differentiated offering.
03 / MAKE-READY SERVICE BUNDLING

Bundle Installation Support to Address the Real Bottleneck

Pole attachment make-ready backlogs, not cable manufacturing capacity, now represent the binding constraint on how quickly carriers can actually deploy contracted aerial fiber miles across most subsidy-funded programmes. Suppliers offering bundled make-ready engineering support alongside cable supply are winning larger allocations of major contracts because they directly address this bottleneck rather than simply supplying product faster than it can be installed. MMA recommends treating service bundling as a core commercial strategy rather than a peripheral offering, since it is increasingly what separates preferred suppliers from interchangeable vendors.
04 / FEEDSTOCK HEDGING STRATEGY

Lock Multi-Year Resin Agreements Before Signing Fixed-Price Contracts

Sheathing compound feedstock volatility has already compressed margins meaningfully at suppliers without long-term resin offtake agreements, and this exposure only grows as more suppliers sign fixed-price multi-year utility contracts without matching input cost protection. Locking diversified multi-year resin agreements ahead of major fixed-price contract commitments protects margin through the full contract term regardless of subsequent feedstock price swings in either direction. MMA sees this as a prerequisite for suppliers pursuing the largest utility framework agreements, not merely a defensive nice-to-have measure.

Engagement Snapshot From the Field

A live engagement with an industry participant carrying material or product regulatory and market exposure ahead of a defining policy shift, showing how our research translates into a defensible multi-year portfolio strategy.
MARKET MINDS ADVISORY · CLIENT ENGAGEMENT SUMMARY
Self-Supporting Aerial Optical Cable Producer Strategic Portfolio Review and Transition Roadmap 2026·Investment Scenario on Self-Supporting Aerial Optical Cable Exposure Evaluation 2025-26
CLIENT PROFILE
The client operates aerial distribution infrastructure across several storm-exposed states and approached MMA following a severe ice storm season that caused extended outages on legacy lashed fiber circuits, reportedly costing over 40 million dollars in restoration and customer credit expense (client-reported, unverified by MMA) across the affected service territory that single season. Board-level pressure to demonstrate a credible resilience investment plan followed shortly after the event.
STRATEGIC CHALLENGE
Leadership needed an evidence-based business case to justify a multi-year capital programme converting priority aerial circuits to certified self-supporting dielectric cable, but internal engineering and finance teams disagreed sharply on projected outage reduction and appropriate payback period assumptions for the investment. Without alignment, the capital request risked stalling in budget committee review indefinitely.
MMA APPROACH
MMA benchmarked comparable utility grid-hardening programmes across similar climate exposure profiles, modelled outage reduction against historical storm damage records, and built a phased capital deployment framework prioritising circuits by both outage history and customer count served. The framework was validated against engineering and finance stakeholders jointly before final presentation. Final recommendations reflected consensus from both engineering and finance stakeholders.
KEY FINDINGS
  1. Circuits already carrying lashed fiber accounted for a disproportionate share of storm-related outage minutes relative to their total circuit mileage across the service territory.
  2. Certified dielectric cable conversion reduced modelled lightning-induced outage incidence substantially based on comparable utility programme data reviewed across similar climate zones. across the comparable programmes reviewed
  3. Prioritising conversion by customer count served rather than mileage alone improved the projected payback period meaningfully within the proposed capital programme structure.
  4. Bundling make-ready engineering support with the cable supply contract shortened projected deployment timeline versus a traditional separately procured installation approach. and reduced coordination overhead materially
CLIENT PROFILE
The client operates aerial distribution infrastructure across several storm-exposed states and approached MMA following a severe ice storm season that caused extended outages on legacy lashed fiber circuits, reportedly costing over 40 million dollars in restoration and customer credit expense (client-reported, unverified by MMA) across the affected service territory that single season. Board-level pressure to demonstrate a credible resilience investment plan followed shortly after the event.
STRATEGIC CHALLENGE
Leadership needed an evidence-based business case to justify a multi-year capital programme converting priority aerial circuits to certified self-supporting dielectric cable, but internal engineering and finance teams disagreed sharply on projected outage reduction and appropriate payback period assumptions for the investment. Without alignment, the capital request risked stalling in budget committee review indefinitely.
MMA APPROACH
MMA benchmarked comparable utility grid-hardening programmes across similar climate exposure profiles, modelled outage reduction against historical storm damage records, and built a phased capital deployment framework prioritising circuits by both outage history and customer count served. The framework was validated against engineering and finance stakeholders jointly before final presentation. Final recommendations reflected consensus from both engineering and finance stakeholders.
KEY FINDINGS
  1. Circuits already carrying lashed fiber accounted for a disproportionate share of storm-related outage minutes relative to their total circuit mileage across the service territory.
  2. Certified dielectric cable conversion reduced modelled lightning-induced outage incidence substantially based on comparable utility programme data reviewed across similar climate zones. across the comparable programmes reviewed
  3. Prioritising conversion by customer count served rather than mileage alone improved the projected payback period meaningfully within the proposed capital programme structure.
  4. Bundling make-ready engineering support with the cable supply contract shortened projected deployment timeline versus a traditional separately procured installation approach. and reduced coordination overhead materially
RECOMMENDED STRATEGY
Phase 1: Phase 1 (Year 1): Convert the highest outage-history circuits serving the largest customer counts first, using certified dielectric cable with bundled make-ready support. Phase 2: Phase 2 (Years 2 to 3): Extend conversion across remaining priority circuits identified through the outage and customer-count prioritisation framework developed during scoping. Phase 3: Phase 3 (Years 4 to 5): Integrate distributed sensing capability on newly converted circuits to enable continuous monitoring ahead of the next storm season.
OUTCOME
The client approved a five-year capital programme following the engagement, with Phase 1 circuit conversion reportedly reducing storm-related outage minutes on converted segments by roughly 35 percent against the prior season baseline (client-reported, unverified by MMA), supporting the case for full programme continuation. Leadership cited the modelling framework directly in the board approval memo.

Frequently Asked Questions

Foundational context covering the market sizes, CAGR, scope, country, region and competition that inform every finding below. This section is provided to cover basics and most often pre-purchase conversations, answered from the MMA Primary Research Dataset.

What is the current size of the Self-Supporting Aerial Optical Cable Market?

The global self-supporting aerial optical cable market reached approximately 1.4 billion dollars in 2025. Growth has been steady as utilities and telecom carriers favour aerial deployment over trenching wherever pole access exists.

How large will the Self-Supporting Aerial Optical Cable Market be by 2036?

MMA projects the market reaching approximately 2.8 billion dollars by 2036 under the base case scenario. This reflects sustained demand from broadband subsidy programmes and utility grid-hardening capital commitments.

What is the CAGR for the Self-Supporting Aerial Optical Cable Market 2026 to 2036?

The base case CAGR is 6.5 percent across the forecast period. Bull and bear scenarios range between roughly 5.3 and 7.7 percent depending on permitting and densification timing.

Which segment is growing fastest?

AI-enabled smart monitoring ADSS cable systems lead at 13.4 percent CAGR, roughly double the overall market rate. Rising resilience mandates referencing continuous span monitoring are the primary driver behind this segment's outsized growth.

Who are the major companies in the Self-Supporting Aerial Optical Cable Market?

Leading suppliers include Corning Incorporated, Prysmian Group, Sterlite Technologies, Fujikura Ltd, and ZTT Group. Combined, the top five hold roughly 41 percent of global production capacity.

Which country is growing fastest?

India leads among major markets at approximately 9.5 percent CAGR, driven by its national broadband mission and rapid domestic cable manufacturing capacity expansion. Rural electrification tie-in programmes reinforce this pace.

Report Segmentation Architecture

The full report scope spans multiple orthogonal segmentation dimensions, with cross-tabulated demand data provided for each dimension pair. Coverage extends further to regional breakdowns, trend trajectories, and the competitive detail needed to support segment-level decision-making.

By Cable Design and Fiber Architecture

  • Standard Round-Fiber ADSS Cable
  • High-Fiber-Count Ribbon Architecture Cable
  • Sensing-Enabled Smart Monitoring Cable
  • High-Strength Long-Span Cable
  • Anti-Tracking Fire-Retardant Cable
  • Standard Short-Span Cable

By End-Use Industry

  • Electric Utility Grid Infrastructure
  • Telecom Carrier Broadband Networks
  • Mobile Network Backhaul and Fronthaul
  • Municipal and Rural Broadband Programmes
  • Data Center Interconnect

By Commercial Dimension

  • Direct Utility Procurement Contracts
  • Carrier Framework Agreements
  • Subsidy-Funded Programme Deployment
  • Installation Service Bundles

By Region

  • North America
  • Western Europe
  • East Asia
  • South Asia and Pacific
  • Latin America
  • Middle East and Africa
  • Eastern Europe

Scope, Methodology, and Coverage

Every figure in this report is reproducible from documented input assumptions. The scope below maps the historical period, the forecast horizon, the segmentation dimensions, and the countries covered, alongside the underlying primary and qualitative methodology.
Historical Period
2020 to 2025
Forecast Period
2026 to 2036
Base Year
2025 (USD billions; MMA Primary Research Dataset, September 2026)
Market Definition
This report covers self-supporting aerial optical cable designed for direct attachment to utility and telecom poles without a supporting messenger wire, including all-dielectric self-supporting designs across standard, high-strength, and sensing-enabled variants. It excludes buried duct cable, lashed or figure-eight cable requiring separate messenger wire, and copper aerial plant.
Quantitative Units
USD billions (current prices); pole-kilometres installed
Segmentation Dimensions
By Cable Design and Fiber Architecture; By End-Use Industry; By Commercial Dimension; By Region
Regions Covered
North America, Western Europe, East Asia, South Asia and Pacific, Latin America, Middle East and Africa, Eastern Europe
Countries Covered
USA, China, Germany, France, UK, Japan, South Korea, India, Australia, Canada, Brazil, Mexico, Indonesia, Vietnam, Thailand, Malaysia, UAE, Saudi Arabia, South Africa, Nigeria, Turkey, Poland, Netherlands, Italy, Spain, Sweden, Switzerland, Argentina, Colombia, Singapore, and additional markets relevant to this sector
Key Companies Profiled
Corning Incorporated, Prysmian Group, Sterlite Technologies, Fujikura Ltd, ZTT Group, Nexans SA, LS Cable & System, Furukawa Electric, YOFC (Yangtze Optical Fibre and Cable), OFS Fitel, Belden Inc, Hengtong Group, Finolex Cables, Birla Cable, HFCL Limited, TE Connectivity, CommScope Holding, AFL Telecommunications, Southwire Company, General Cable Technologies
Quantitative Methodology
Primary survey, n=3,800 respondents, Q4 2025, six countries; demand-side model with trade association cross-validation
Qualitative Methodology
47 expert interviews, Q4 2025; applied to validate demand model assumptions, identify emerging dynamics, and assess competitive positioning
Report Format
PDF and XLSX data workbook (Word format preview document)
Publisher
Market Minds Advisory
Report Code
MMA-2026-CON-123
Published
September 2026
Contact
sales@marketmindsadvisory.com | www.marketmindsadvisory.com

Purchase the full Self-Supporting Aerial Optical Cable Market Report (2026 to 2036).

The full MMA report delivers granular segmentation across six cable design tiers, seven-region demand and pricing forecasts through 2036, and a detailed competitive assessment of twenty profiled suppliers including certification status and production capacity positioning. It includes a dedicated make-ready and pole-attachment regulatory tracker covering major jurisdictions, plus quarterly resin feedstock cost pass-through analysis. Buyers receive editable data tables supporting internal capital planning models. It also profiles installation service bundling economics and benchmarks margin performance across all three portfolio tiers described in this summary. Analysts update the regulatory tracker quarterly as jurisdictions revise attachment rules.
Seven-region demand and pricing forecasts to 2036
Twenty-supplier certification and capacity status tracker
Pole attachment regulatory backlog delay tracker
Quarterly resin feedstock cost pass-through model
Segment-level margin benchmarking across all tiers
Editable capital planning data tables provided

Built For The People Who Decide

From boardroom strategy to bench-side execution, this report is read cover-to-cover by leaders shaping the next decade of their industry, turning demand scenarios, market dynamics and valuation benchmarks into decisions.
CXOs/ Presidents/ VPs/ Managers
M&A and Corporate Development
Strategy Teams and R&D Heads
Procurement and Product Directors
Regulatory and Compliance Leaders
Investor Relations and Equity Analysts