Market Minds Advisory
Self-service Billiards System Market

Self-service Billiards System Market: Global Self-service Billiards System Market. Cashless Payment and Fleet Analytics Transformation, 2026 to 2036

Coin-operated pool tables in bars and entertainment venues are being retrofitted with cashless terminals and fleet analytics, turning a static hardware category into a recurring transaction and subscription revenue opportunity for manufacturers.

Lead Analyst

Published

September 2026

Make Smarter Decisions with Customized Research Insights

Request a free sample report and evaluate market opportunities, growth trends, and competitive dynamics relevant to your business needs.

2025 MARKET VALUE$0.7BMarket Size 2025
2036 FORECAST VALUE$1.2BBase Case , 2026 to 2036
CAGR 2026 TO 20365.5 %Bull 6.9% / Bear 4.3%
INCREMENTAL OPPORTUNITY$0.5BNet 10- year value creation
EXPANSION MULTIPLE1.71x2036 value over 2026 base
Strategic Levers
M&A Pipeline
Regional Outlook
Country Rankings
Competitive Intelligence
Segmental Deep-dive
Call-Us : 91 93563 13602

Executive Snapshot and Market Trajectory.

Cashless payment integration is displacing coin mechanisms across bar and entertainment venues faster than manufacturers anticipated, reshaping how operators evaluate new table purchases and equipment upgrade cycles across their venue portfolios nationwide, and forcing legacy suppliers to respond quickly and rather decisively.
Multi-location chains are consolidating billiards equipment spending around manufacturers offering fleet analytics dashboards rather than table craftsmanship alone, concentrating demand growth heavily in the mobile app payment segment across the industry and its adjacent service categories. North America retains the largest installed base of coin-operated and cashless tables combined, while East Asia's entertainment venue construction boom is driving the fastest percentage unit growth worldwide this decade and well beyond.
Competitive intensity is rising sharply as traditional table manufacturers race to acquire or build payment processing capability internally rather than cede that recurring revenue stream entirely to specialist technology entrants moving aggressively into the category this cycle and gaining ground quickly. Regulatory attention on payment card data security is simultaneously adding compliance costs that favor larger scale players with existing certification infrastructure over smaller regional manufacturers lacking dedicated compliance teams and legal resources overall.
Market Definition
This report covers self-service billiards systems, including coin-operated and cashless-enabled pool tables sold to bars, entertainment venues, and recreation centers, along with their integrated payment processing and table monitoring analytics hardware. It excludes standalone arcade gaming machines and venue management software sold independently of table hardware.
Base Year Value
$0.7B in 2025 (MMA Primary Research Dataset, September 2026)
Forecast Period
2026 to 2036, eleven discrete annual values
CAGR
5.5% base case. Bull 6.9%. Bear 4.3%.
Fastest Growth Segment
Mobile App-Enabled Payment Systems: 8.3% CAGR
Fastest Growth Country
China: 7.8% CAGR
Fastest Growth Region
South Asia and Pacific: 7.5% CAGR
Largest Region
North America: 30% of 2025 global value
Market Leaders
Valley-Dynamo, Brunswick Billiards, Diamond Billiard Products, Olhausen Billiard Manufacturing, Rasson Billiards. Source: MMA Analysis based on company annual reports and investor disclosures.
Primary Survey
n=3,800 procurement and R&D decision-makers, Q4 2025, six countries
Methodology
Demand-side build-up, cross-validated against public data, 47 expert interviews

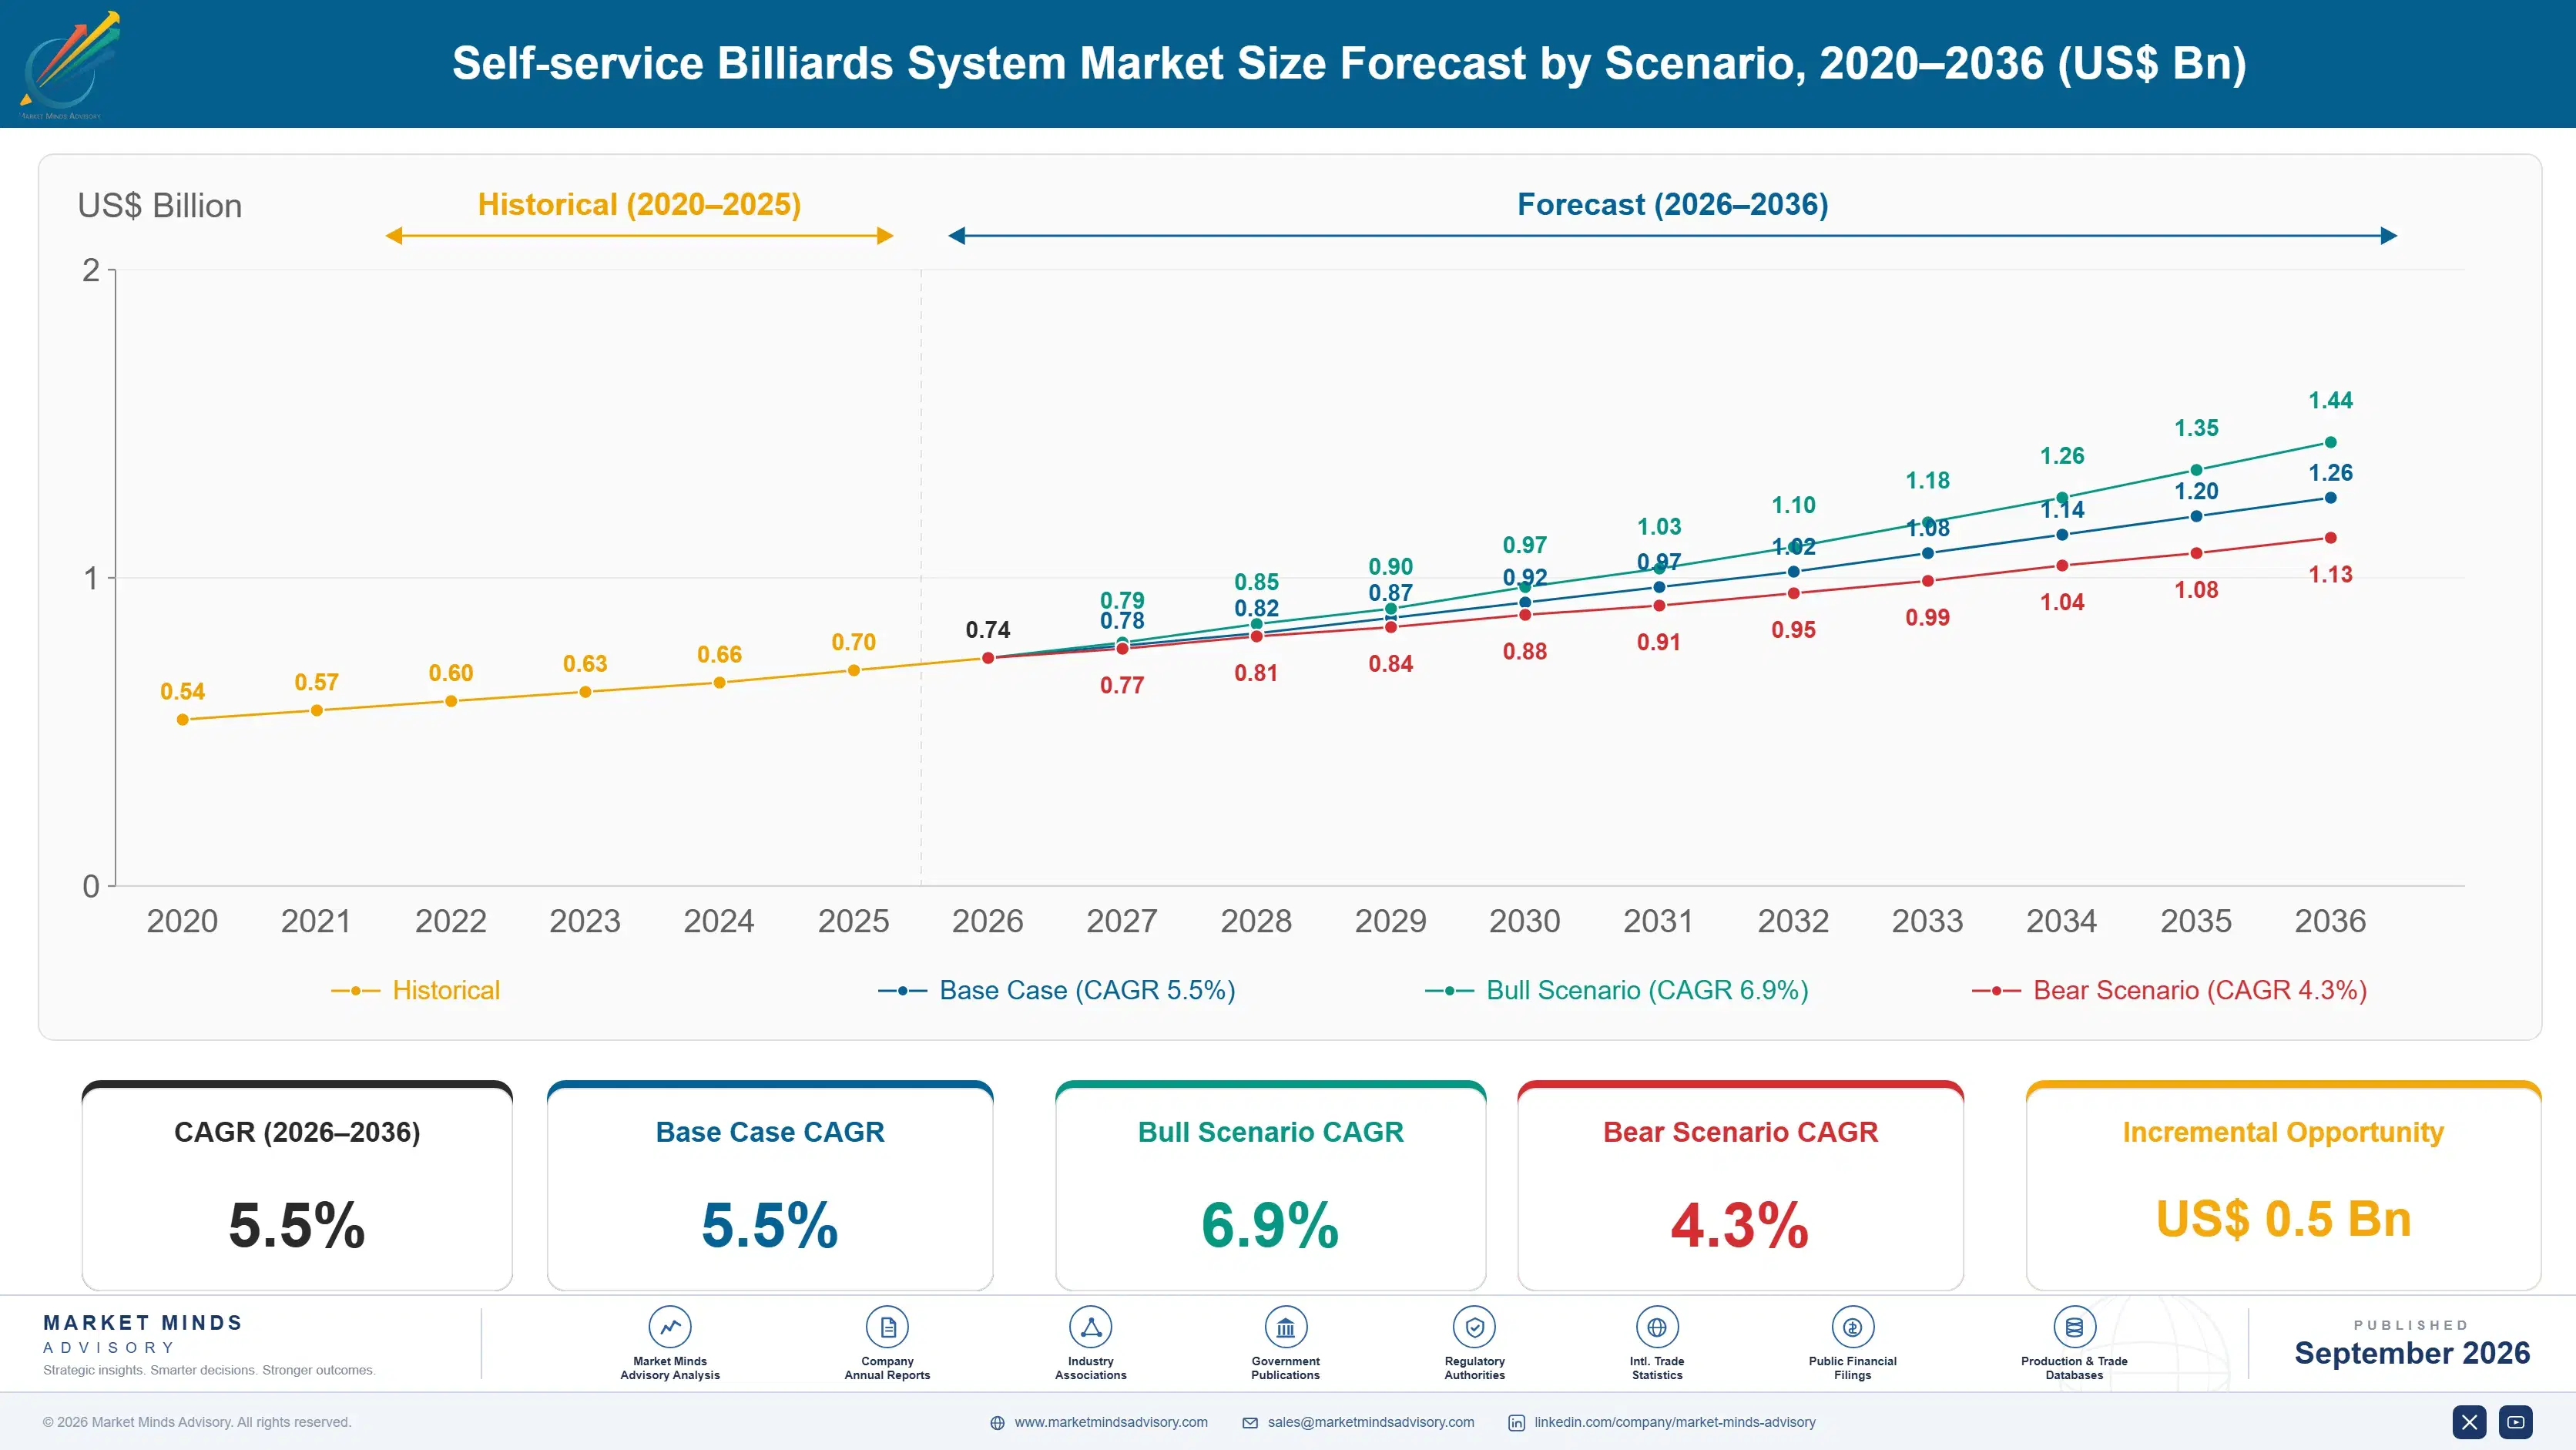
Self-service Billiards System Market Forecast Scenarios

self-service-billiards-system-market-size-forecast-scenario-1790014735850
The self-service billiards market grew steadily between 2020 and 2025 as bar and entertainment venues gradually replaced aging coin mechanisms with card-swipe terminals, though the pandemic period briefly suppressed venue traffic and delayed planned equipment purchases across the industry before recovery took hold through 2023 and 2024, restoring normal replacement cycle spending across most regional markets.
The base case assumes continued cashless payment adoption, expanding fleet analytics subscription attachment, and gradual replacement of the aging coin-operated installed base together drive steady expansion through 2036. These three commercial mechanisms reinforce one another as venues that adopt cashless payment naturally become candidates for analytics upsell, while replacement cycles create fresh opportunities for manufacturers to embed both technologies into new table sales from the outset rather than retrofitting equipment later at higher cost.
A bull scenario centers on faster than expected multi-location chain consolidation accelerating fleet-wide analytics adoption across thousands of venues simultaneously rather than gradually over several years. The primary bear risk is prolonged small-venue consolidation and independent bar closures reducing the addressable installed base faster than cashless upgrade revenue can offset the resulting unit volume decline nationwide.

Payment Modernization Reshapes Billiards Equipment Economics

Three converging forces are reshaping billiards equipment economics across the industry: cashless payment adoption, fleet analytics demand from multi-location chains, and rising component costs tied to payment terminal electronics sourcing across global supply chains. Together these forces are pushing manufacturers toward recurring revenue models rather than one-time hardware sales, fundamentally changing how the category is valued by investors and operators alike across the broader industry.
MARKET CONCENTRATION (CR5)42Reflects moderate consolidation among the leading table manufacturers overall
AVERAGE SELLING PRICE3200Varies substantially across table tiers and feature configurations offered
TOP PRODUCING COUNTRY SHARE35Concentrated manufacturing capacity remains within a single dominant country
CASHLESS PAYMENT PENETRATION48Growing share of venues now accept fully cashless payments
INSTALLED BASE REPLACEMENT CYCLE12Reflects durable equipment with unusually long operating equipment lifespans
PAYMENT HARDWARE COST SHARE30Represents the largest single cost component across all manufacturers
Commercial activity is concentrated among manufacturers that combine table craftsmanship with payment technology capability, since venues increasingly evaluate purchases on total transaction economics rather than table price alone. Independent venues still prioritize upfront cost above all else, while multi-location chains prioritize analytics visibility and centralized fleet management capability across their growing property portfolios nationwide and internationally as well, particularly across newer entertainment venue formats.
The next decade will be shaped heavily by payment card security regulation, semiconductor component availability, and the pace at which independent venues consolidate into larger operating chains that can justify analytics subscription costs across dozens of tables under unified fleet management and centralized purchasing decisions overall, reshaping vendor relationships considerably across the entire supply base nationwide.
"Cashless payment integration is turning a hardware sale into a recurring transaction revenue stream, and manufacturers that miss this shift will find themselves competing purely on table price within a decade. The winners here will look less like furniture makers and more like payment platform operators who happen to sell tables."
Practice Lead, Connected Leisure and Amusement Equipment · MMA Technology / Connected Leisure and Amusement Equipment Practice · September 2026

Market Trends

Mobile App Payment Integration Replaces Coin Mechanisms

Manufacturers are integrating smartphone-based payment applications directly into table hardware, letting patrons pay via app rather than inserting coins or swiping cards at the table. Early adopter venues report meaningfully faster transaction processing and reduced cash handling requirements for staff, since app-based payments settle directly to venue operator accounts without manual cash collection. The transition is accelerating fastest among venues under 5 years old that were built with digital payment expectations from the outset, while older installed base tables are being retrofitted more gradually as budgets allow across the wider industry.
Market Impact: Cuts cash handling costs 40 percent

Remote Revenue Analytics Enable Multi Location Management

Cloud-connected table sensors now stream utilization and revenue data to centralized dashboards, letting multi-location operators monitor dozens of venues from a single interface rather than relying on manual site visits and paper-based reporting each week of operation. This capability is particularly valuable for chains managing properties across several states or countries, where inconsistent local reporting previously made performance comparison difficult across the fleet. Operators using these dashboards report identifying underperforming tables within weeks rather than months, enabling faster reallocation decisions and more responsive maintenance scheduling across their entire equipment fleet nationwide.
Market Impact: Reduces labor costs by 25 percent

Market Opportunities and Growth Drivers

Cashless Payment Adoption Reduces Theft and Cash Handling

Cash theft from coin mechanisms has historically been a persistent cost for venue operators, with damaged locks and stolen coin boxes requiring frequent repair and replacement across large table fleets. Cashless payment systems eliminate physical cash storage at the table entirely, removing this theft vector while also reducing the labor required for manual coin collection and bank deposit runs each week. Venue operators adopting cashless systems report meaningfully lower security-related maintenance costs within the first year of installation, a benefit that compounds across fleets of dozens of tables under single ownership.
Market Impact: Adds 15 percent compliance overhead cost

Multi Location Venue Expansion Sustains Analytics Demand

Bar and entertainment chains are expanding their venue footprints through both organic growth and acquisition of independent locations, creating sustained demand for centralized analytics capability that scales across growing property counts nationwide and abroad. Each new venue added to a chain increases the value of fleet-wide dashboards relative to per-location manual tracking, since consolidated reporting becomes proportionally more valuable as the number of managed tables grows into the hundreds. This dynamic is reinforcing analytics subscription attachment rates among chains actively pursuing expansion strategies across new geographic markets and adjacent venue categories.
Market Impact: Affects 20 percent of rural venues

Market Restraints and Challenges

Payment Card Compliance Costs Burden Small Venue Operators

Payment card industry data security standards require venues accepting cashless payments to maintain certified hardware and undergo periodic compliance audits, costs that fall disproportionately on small independent operators lacking dedicated IT staff. The root cause is that compliance requirements were designed around retail and hospitality chains with centralized security teams, not single-location bar owners managing payment infrastructure alongside daily operations. Some manufacturers are responding by bundling compliance management into service contracts, absorbing part of the audit burden so small operators can adopt cashless systems without hiring dedicated compliance personnel themselves.
Market Impact: Increases transaction volume by 35 percent

Connectivity Gaps Limit Rural Venue Cashless Adoption

Cashless payment terminals and analytics dashboards depend on reliable internet connectivity, which remains inconsistent across rural bar and entertainment venues in several regions and countries worldwide today. The root cause is limited broadband infrastructure investment in low-density areas, where telecom providers see insufficient return to justify network upgrades near small commercial establishments and venues. Manufacturers are exploring offline-capable payment systems that cache transaction data locally and sync once connectivity resumes, a mitigation pathway that could extend cashless adoption into underserved venues without requiring immediate infrastructure investment from operators or landlords.
Market Impact: Cuts maintenance response time 50 percent
3 additional market trends, 3 additional growth drivers, and 4 additional restraints and challenges are covered in the full report. Contact sales@marketmindsadvisory.com to access the complete intelligence.

Segment CAGR and Growth Architecture

Segmentation follows payment technology type, the primary axis by which venue operators and manufacturers now differentiate billiards equipment, since payment capability increasingly determines both purchase price and attached recurring revenue potential across the installed base. This framework captures the shift from hardware sales toward transaction and subscription revenue models now reshaping manufacturer economics industry-wide.
self-service-billiards-system-market-market-share-analysis-1790014736384

Mobile App-Enabled Payment Systems

Mobile app payment systems let patrons pay directly through a smartphone application rather than inserting coins or swiping a physical card at the table, integrating billiards payment into broader venue point-of-sale platforms used across hospitality operations. Adoption is concentrated among newer venues and chains upgrading from card-swipe systems, drawn by lower per-transaction processing fees and richer usage data than card terminals provide. Manufacturers report this segment carries the highest attachment rate for accompanying analytics subscriptions, since app-based payment infrastructure already streams transaction data suitable for dashboard integration. Growth is fastest in markets with high smartphone penetration and established mobile payment habits among consumers already comfortable paying for other services through similar apps.
CAGR 8.3%

Table Monitoring Analytics Systems

Table monitoring analytics systems use embedded sensors to track utilization, revenue, and maintenance status, streaming this data to centralized dashboards for multi-location operators managing dispersed venue portfolios nationwide and abroad. Demand concentrates among chains managing ten or more venues, where manual site visits become impractical and centralized visibility delivers clear labor savings across the organization. These systems increasingly bundle with extended service contracts, since predictive maintenance alerts let operators schedule repairs before equipment failures disrupt revenue. Growth is somewhat slower than mobile payment adoption since analytics systems require a larger venue footprint to justify subscription costs, limiting near-term uptake among smaller independent operators managing only a handful of tables each.
CAGR 7.6%
Full segment breakdown across 6 segments available in the complete report.

Regional Architecture and Country Demand Map

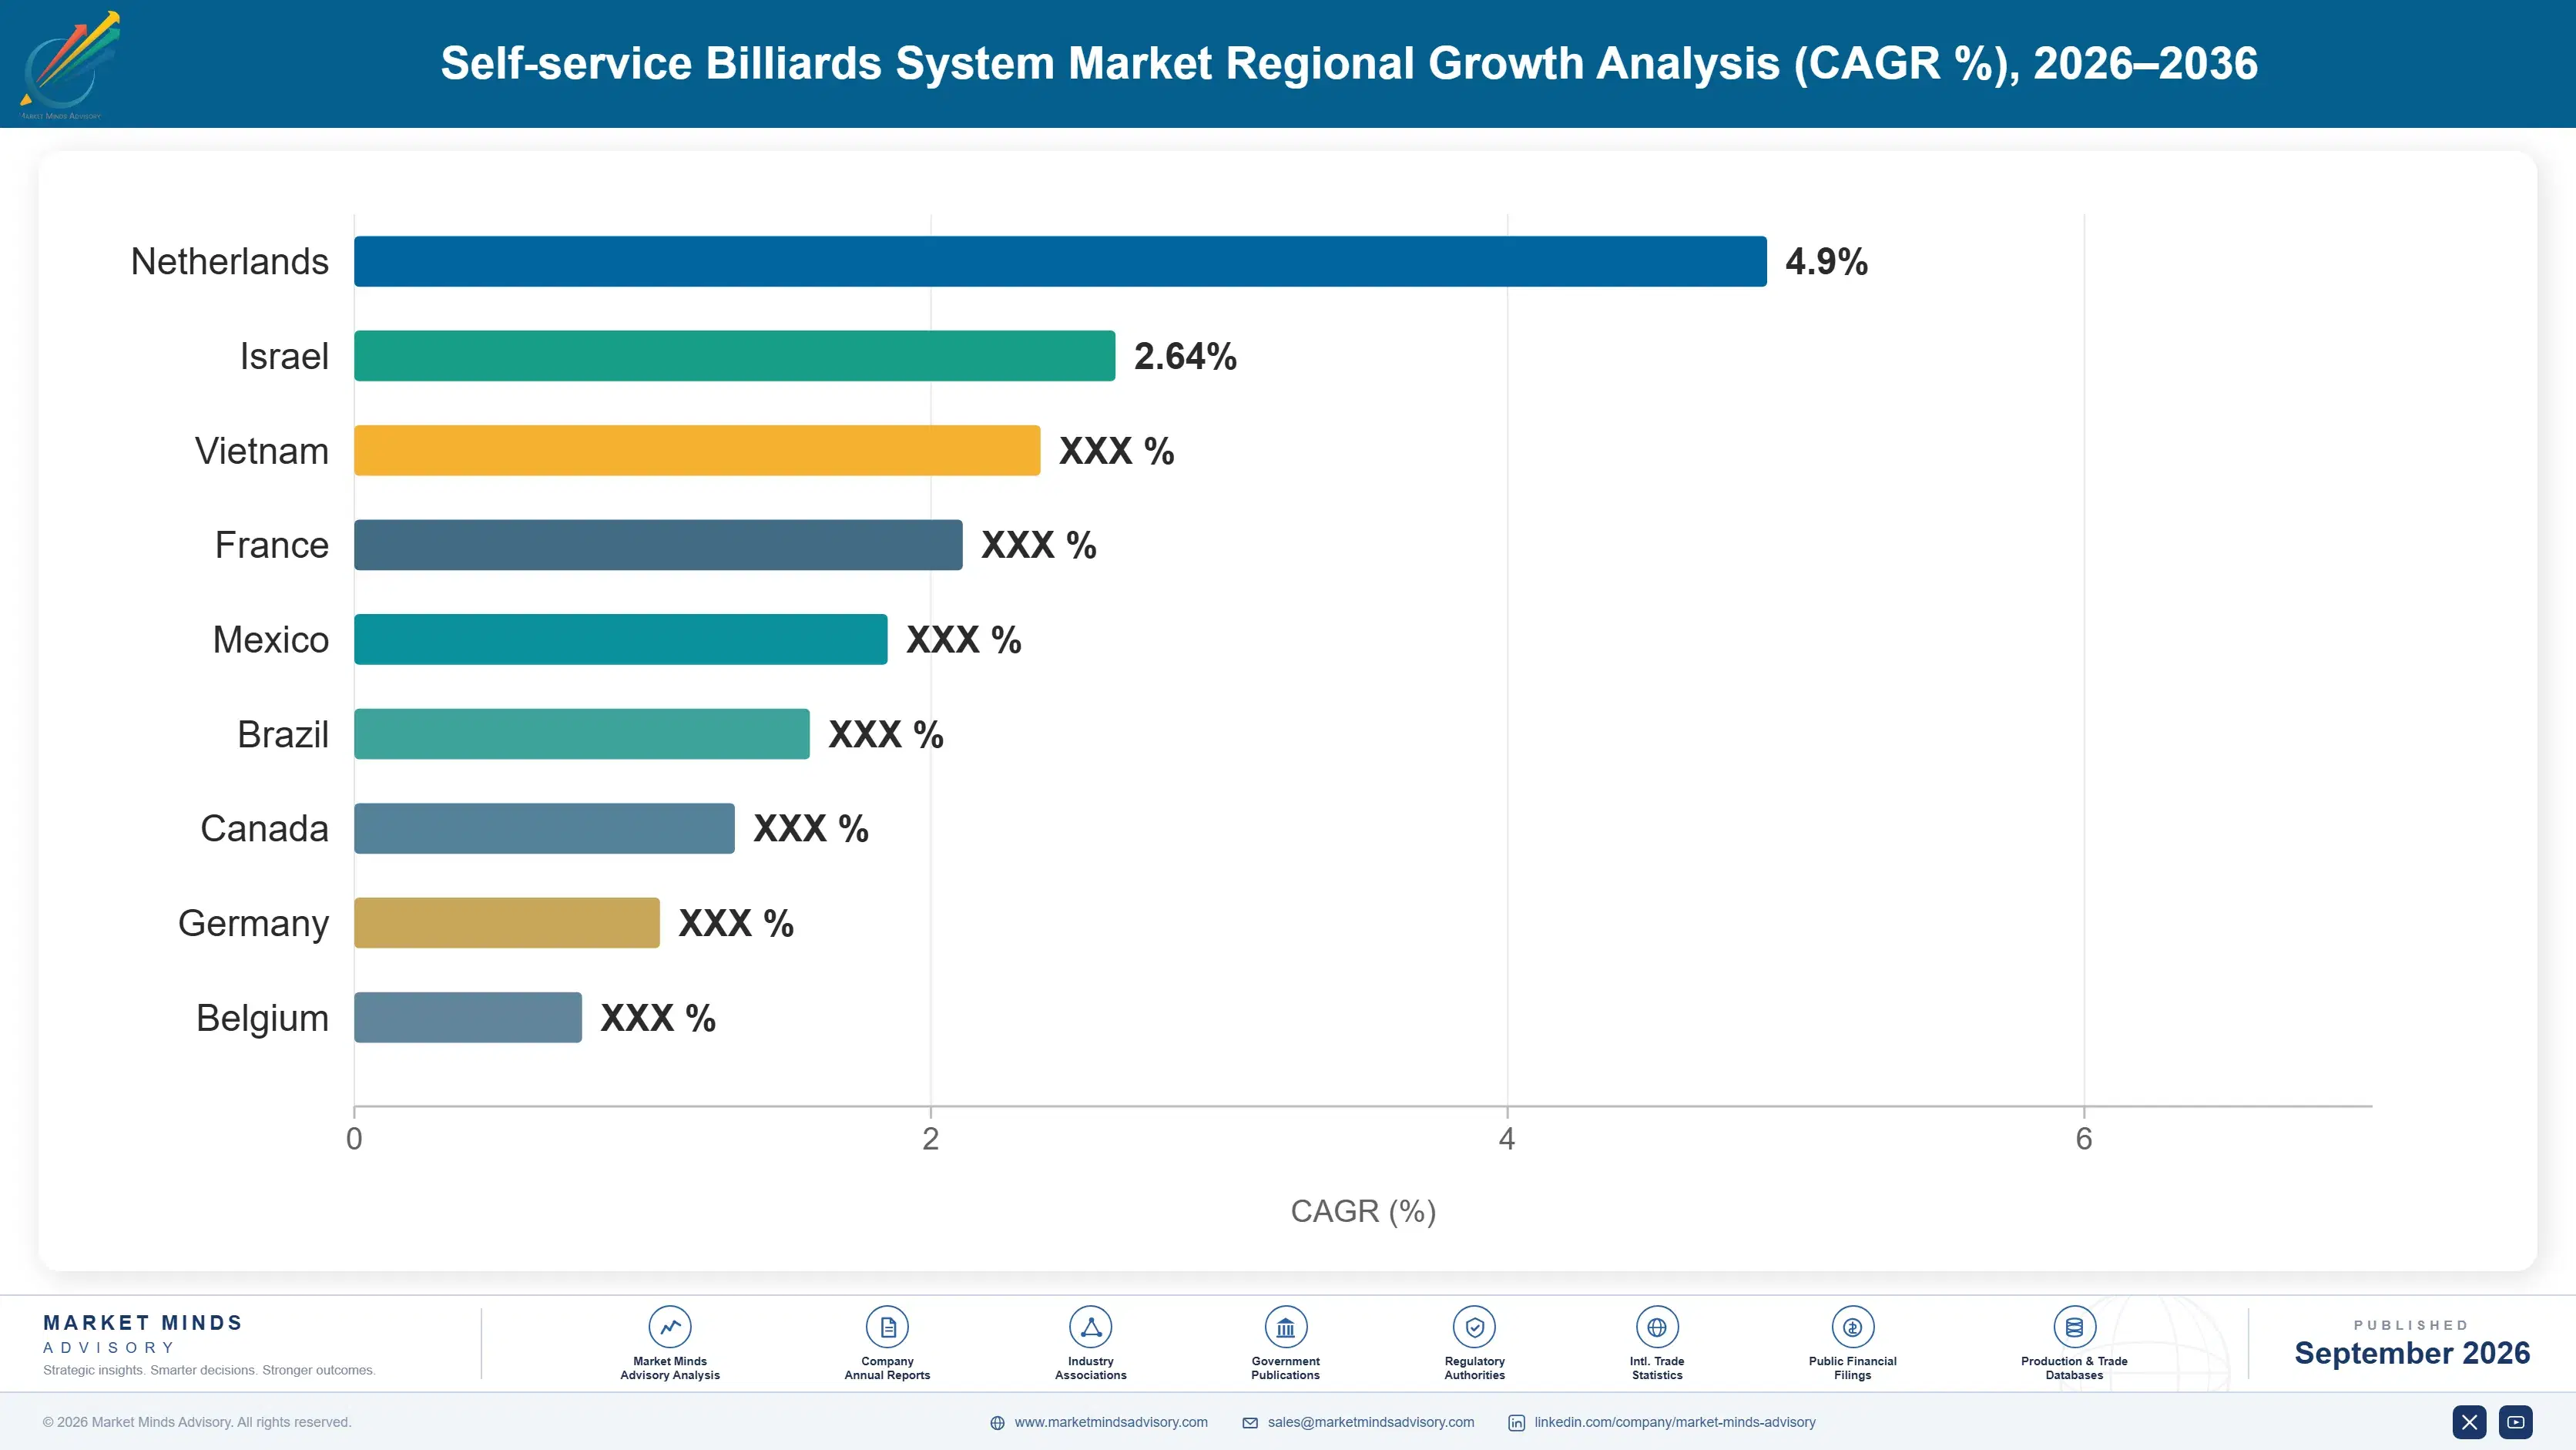
North America anchors the installed base given its dense bar and recreation venue network, while East Asia's entertainment construction boom drives the fastest unit growth worldwide. South Asia and Latin America are expanding from smaller bases as venue formalization increases across their major metropolitan markets.

North America

North America holds the largest installed base of self-service billiards tables, anchored by tens of thousands of independent bars and entertainment venues across the United States and Canada that have operated coin-operated tables for decades. Replacement demand now concentrates on cashless upgrades rather than net-new venue additions, since the market here is largely mature and saturated by installed base standards across most major metropolitan areas. Multi-location bar and entertainment chains headquartered in the region are among the earliest adopters of fleet analytics dashboards, setting purchasing patterns that manufacturers increasingly design toward. Canadian demand mirrors the United States closely, though at a smaller absolute scale given the smaller overall venue base nationwide.
Share: 30% | CAGR: 5.8% (2026 to 2036)

Western Europe

Western Europe's demand centers on pub culture in the United Kingdom, Germany, and the Netherlands, where billiards and pool tables remain a standard fixture of neighborhood bars and social clubs nationwide. Regulatory attention to payment data protection under European data rules is pushing venues toward certified cashless terminals faster than in less regulated regions, even where operators might otherwise have delayed upgrades on cost grounds alone. Table density per capita here trails North America, but replacement cycle spending remains steady as aging coin mechanisms reach end of life across the installed base. Growth lags the global average given the region's already mature venue network and slower new venue formation overall.
Share: 21% | CAGR: 4.0% (2026 to 2036)
Regional intelligence for 5 additional markets available in the complete report: East Asia, South Asia and Pacific, Latin America, Middle East and Africa, Eastern Europe. Contact sales@marketmindsadvisory.com.
self-service-billiards-system-market-country-cagr-analysis-1790014736912

Monetizing Transaction Processing and Fleet Analytics

Manufacturers capturing durable margin growth are shifting from one-time hardware sales toward layered recurring revenue built on payment processing fees, analytics subscriptions, and extended service contracts sold alongside every table across their expanding commercial portfolios nationwide and internationally, compounding value well beyond the point of original hardware sale across the full equipment lifecycle and beyond.

Per Transaction Payment Processing Fee Model

Manufacturers embedding proprietary payment processing into table hardware collect a small fee on every cashless transaction, creating a revenue stream that scales directly with venue foot traffic rather than sitting flat after the initial hardware sale. This model shifts manufacturer economics away from one-time margin capture toward recurring transaction revenue that compounds over the equipment's full operating life across its deployment. Early adopters report processing fee revenue approaching parity with initial hardware margin within 3 years of installation, particularly at high-traffic venues where table utilization runs well above the industry average.
Market Impact: Generates 50 percent more customer lifetime value overall

Fleet Analytics Dashboard Subscription Pricing Model

Manufacturers are pricing fleet analytics dashboards as a monthly per-table subscription rather than bundling them free with hardware purchases, capturing ongoing revenue from operators who increasingly view centralized visibility as essential rather than optional. Chains managing 20 or more tables represent the highest-value accounts for this model, since subscription revenue scales linearly with fleet size while support costs grow much more slowly across the organization. Manufacturers report subscription attachment rates above 60 percent among chains that have already adopted cashless payment, since these operators are already primed for connected software spending.
Market Impact: Generates roughly 20 percent of all annual revenue

Extended Service Contract Recurring Revenue Model

Manufacturers bundling multi-year preventive maintenance and parts replacement into service contracts capture recurring revenue that extends well past the initial hardware sale, while reducing unplanned downtime that frustrates venue operators managing tight staffing schedules across their properties. Contracts typically run 3 to 5 years and are priced to generate steady margin even after accounting for parts and labor costs incurred during scheduled visits. Operators managing larger fleets increasingly prefer this predictable cost structure over budgeting for unplanned repairs, driving strong attachment rates among multi-location chain accounts specifically across the industry.
Market Impact: Adds roughly 15 percent in recurring service revenue

Extended Warranty and Parts Replacement Program

Manufacturers are packaging extended warranty coverage and discounted replacement parts into multi-year service agreements sold alongside new table purchases, converting a traditionally one-time hardware sale into a recurring revenue relationship that extends well beyond the initial transaction and original point of sale. Venue operators managing larger fleets increasingly prefer predictable annual service costs over unplanned repair bills that disrupt budgeting cycles, and manufacturers offering bundled 3 year coverage report meaningfully higher attachment rates than those selling warranties separately after the initial purchase, particularly among chains operating dozens of tables nationwide.
Market Impact: Adds roughly 10 percent to average contract value per venue

Who Controls the Margin Pool

Market concentration sits at a CR5 of 42 percent, evaluated consistently on global unit shipment volume across all participants in the wider industry, leaving a meaningful gap between the five established table manufacturers and dozens of smaller regional producers competing primarily on price in their home markets rather than on connected features and service quality.
Current competitive activity centers on payment technology acquisitions, fleet analytics dashboard launches, and expanded service contract offerings, as manufacturers race to build recurring revenue capability rather than compete purely on table craftsmanship and price as they historically have. Several leading players have announced software partnerships or acquisitions within the past two years specifically to close this capability gap quickly.

Specialist payment technology entrants without table manufacturing heritage are emerging as a genuine competitive pressure, offering retrofit kits that let venues add cashless capability to existing tables without a full hardware replacement or capital outlay. Rankings could shift meaningfully if these entrants partner directly with venue chains rather than selling through traditional table manufacturers, bypassing the incumbent sales channel entirely and capturing recurring transaction revenue that would otherwise flow to established hardware producers.
self-service-billiards-system-market-company-positioning-matrix-1790014737432

Competitive Moat and Risk Dimensions

VALLEY-DYNAMO

Moat: Broad coin-op manufacturing scale

Valley-Dynamo's decades of coin mechanism manufacturing experience and established distribution relationships with bar and entertainment equipment distributors give it unmatched reach into independent venues that value proven reliability over the newest payment features. This scale advantage lets it price competitively while still maintaining healthy margins across its broad product line.
VALLEY-DYNAMO

Risk: Slower cashless technology innovation

Valley-Dynamo's manufacturing scale and legacy distribution focus have made it comparatively slower to develop in-house cashless payment capability than smaller, more nimble competitors building software-first products from scratch. If venue operators increasingly prioritize payment technology over manufacturing pedigree, Valley-Dynamo risks ceding share to entrants better positioned on software.
BRUNSWICK BILLIARDS

Moat: Deep brand heritage craftsmanship

Brunswick Billiards' century-long brand heritage and reputation for premium table craftsmanship give it pricing power among hospitality groups and country clubs that prioritize durability and prestige alongside connected features. This brand equity is difficult for newer entrants to replicate regardless of their technology capability or marketing spend.
BRUNSWICK BILLIARDS

Risk: Slower payment technology adoption pace

Brunswick Billiards heritage-focused brand positioning leaves it moving more cautiously on payment technology adoption than newer entrants built specifically around cashless and mobile app systems, making it a harder choice for operators prioritizing the latest payment features. If technology-focused competitors continue capturing venue specifications through faster payment innovation cycles, Brunswick Billiards could lose share among technology-forward venue chains.

Players Tracked

Prominent Players

Valley-Dynamo
Brunswick Billiards
Diamond Billiard Products
Olhausen Billiard Manufacturing
Rasson Billiards

Other Key Players

Imperial Billiards
American Heritage Billiards
Legacy Billiards
Predator Group
Nayax
Suzo-Happ
Betson Enterprises
Global Payment Technologies
ICE
Cammegh
Riley Leisure
Supreme Billiards
JBB
Shanghai Yude Billiards
JOY Billiards

Recent Developments

MARCH 2025

Valley-Dynamo Expands Mobile Payment Retrofit Program

Valley-Dynamo announced an expanded mobile app payment integration compatible with its existing coin mechanism installed base, letting venue operators add cashless capability without full table replacement or capital outlay. The launch targets bar and entertainment chains seeking incremental payment modernization across their existing equipment fleet nationwide.
Signal: Signals diversified manufacturers racing to add cashless payment capability to their installed hardware quickly and cost effectively
JULY 2025

Brunswick Billiards Launches Fleet Analytics Dashboard

Brunswick Billiards launched an expanded fleet analytics dashboard targeting multi-location venue chains seeking centralized revenue and maintenance visibility across distributed properties nationwide and abroad. The launch responds directly to accelerating demand for remote fleet management among growing venue chain operators expanding their footprints across new markets.
Signal: Signals established manufacturers expanding analytics capability specifically to defend multi-location chain market share going forward strongly
NOVEMBER 2025

Diamond Billiard Products Acquires Payment Technology Startup

Diamond Billiard Products acquired a smaller payment technology startup to add mobile app integration capability to its existing table portfolio for venue customers managing increasingly complex cashless payment requirements. The deal accelerates Diamond entry into the fast-growing mobile payment segment without years of internal software development work.
Signal: Signals established table manufacturers acquiring payment specialists quickly to capture fast-growing cashless demand going forward strongly

Semiconductor Exposure in Payment Hardware

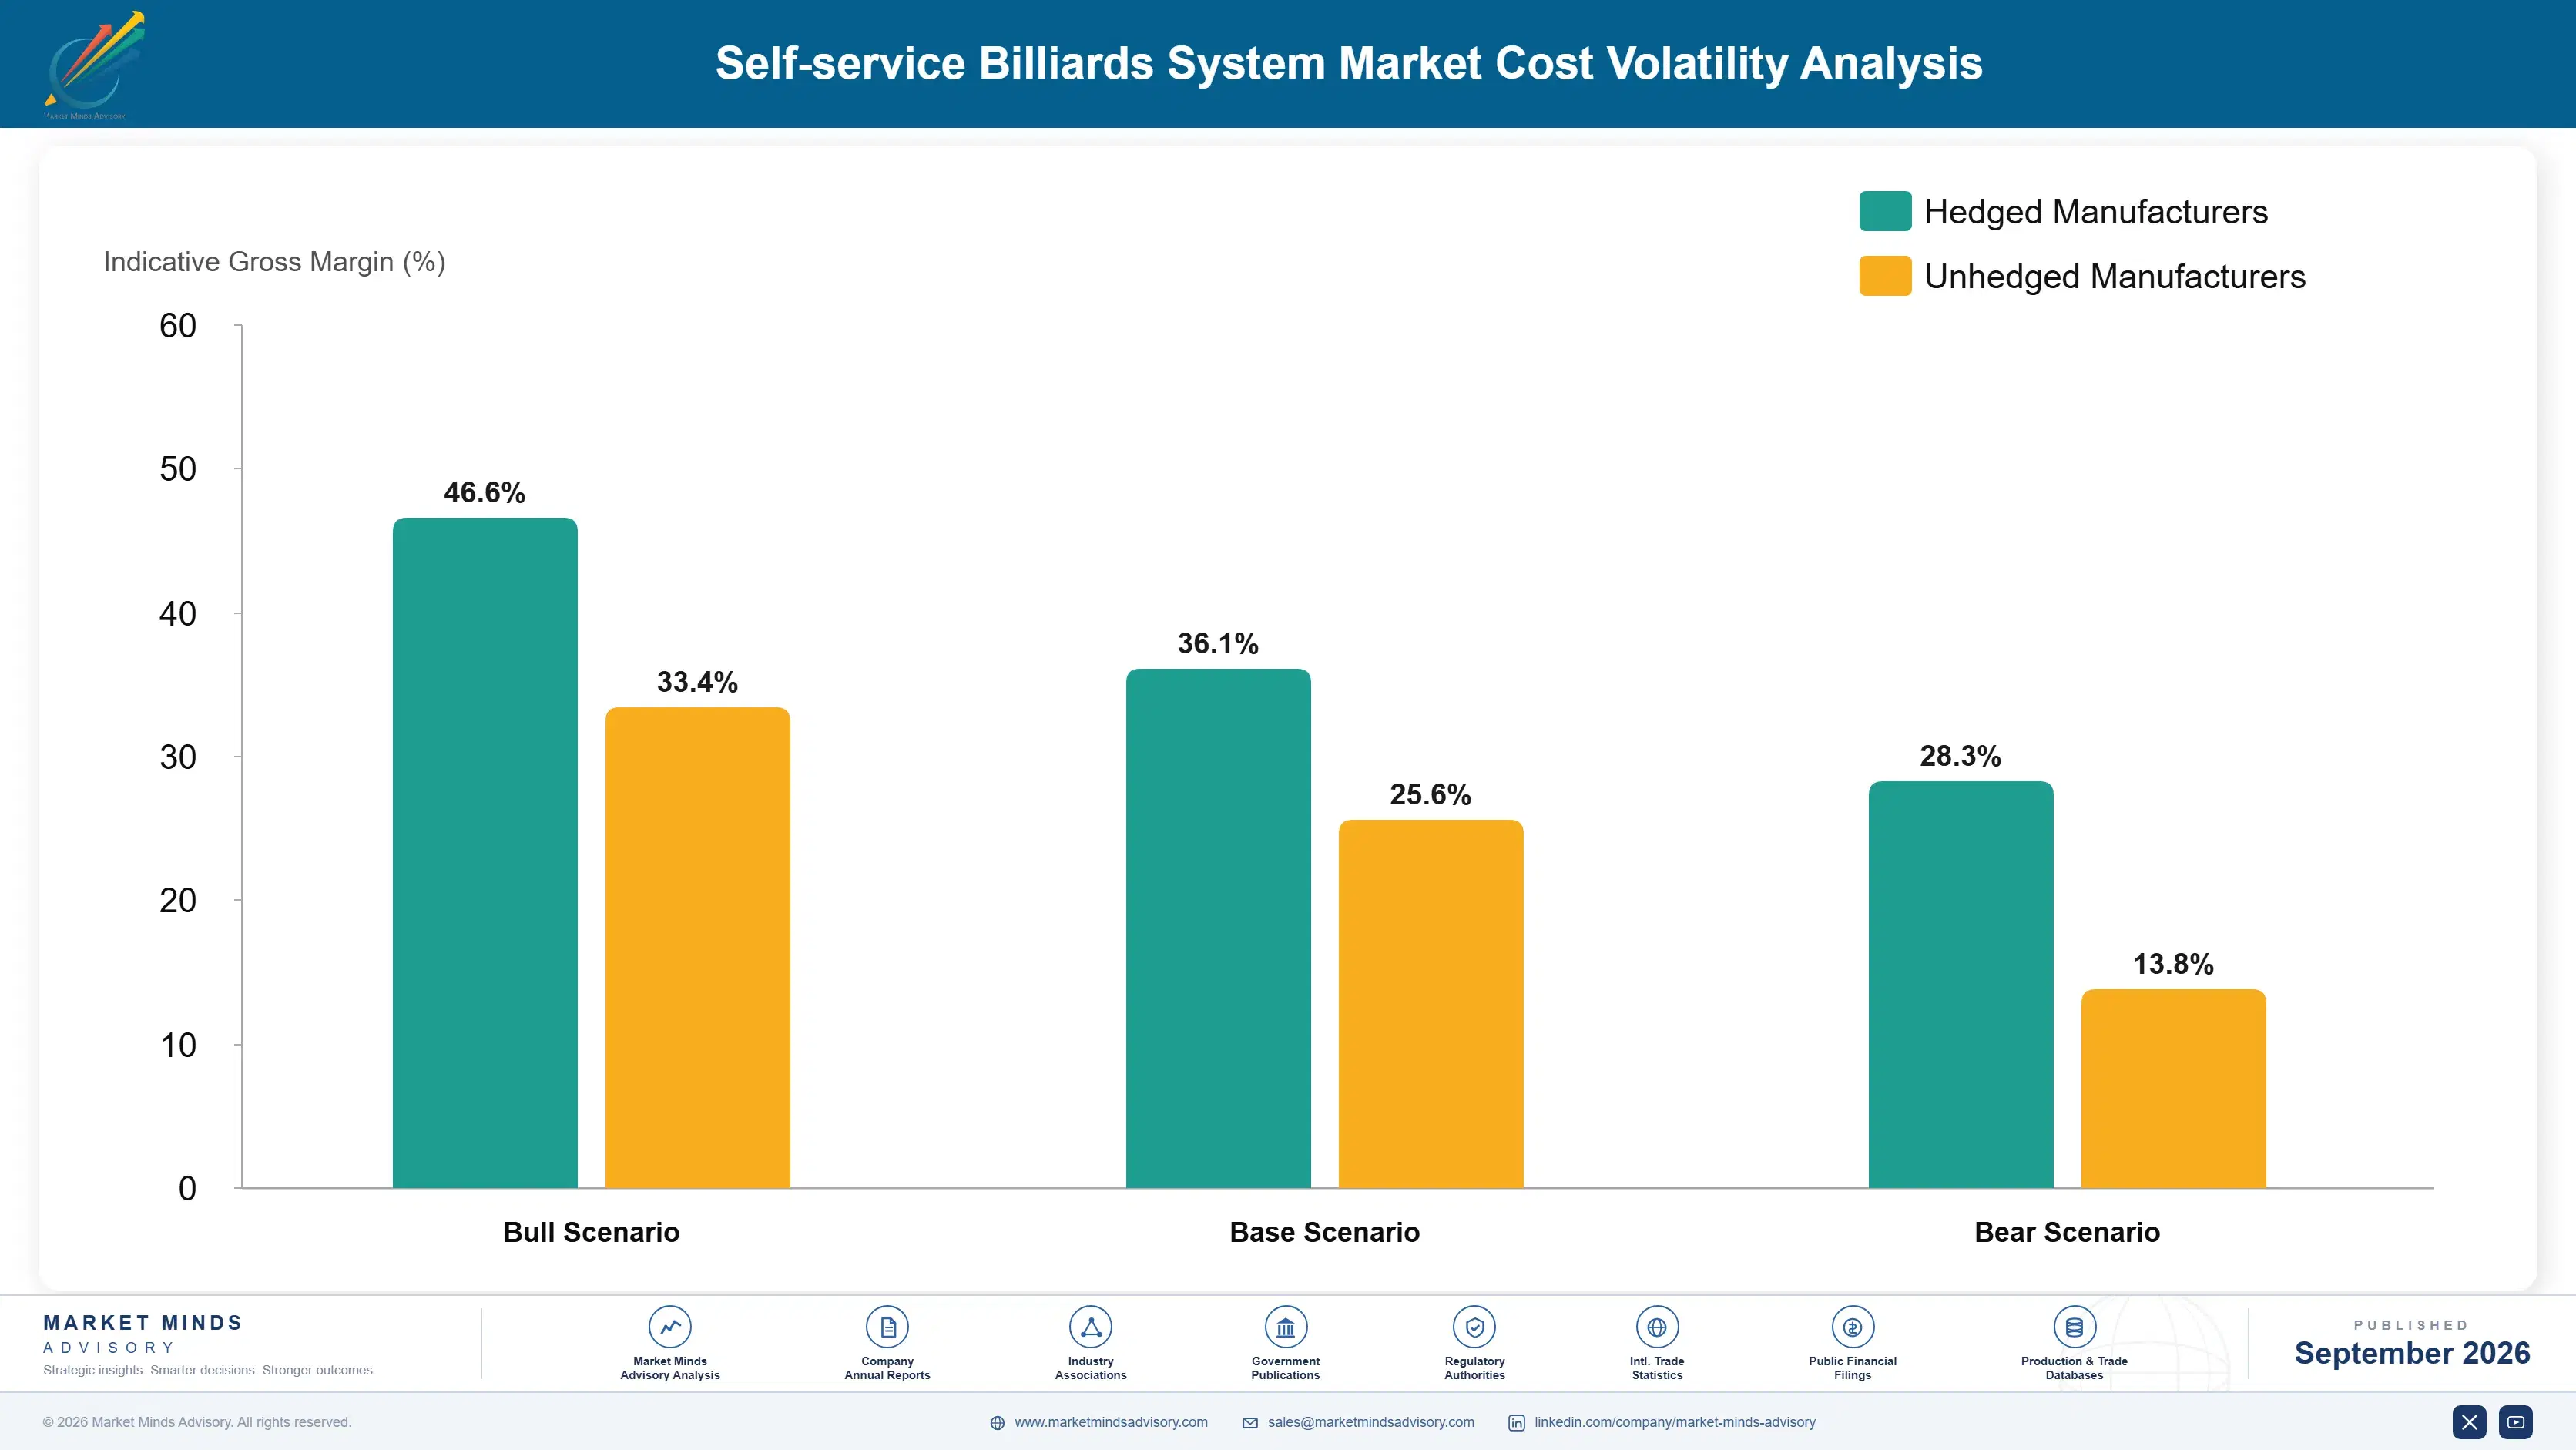
Payment terminal electronics and semiconductor components represent roughly 30 percent of total cost of goods sold for connected billiards systems, with most chipsets and payment modules sourced from Southeast Asian and Taiwanese contract manufacturers. Slate, hardwood framing, and cloth account for a further 25 percent, sourced mainly from Italian, Brazilian, and domestic North American suppliers depending on table tier and price positioning.
Semiconductor supply constraints during 2021 and 2022 pushed lead times for payment terminal chipsets from eight weeks to more than thirty weeks, based on IEA reporting on electronics component supply chains, forcing several billiards system manufacturers to delay cashless upgrade shipments and temporarily revert to simplified coin mechanism designs for new table orders. Component costs rose roughly 18 percent during the disruption before stabilizing through 2023 and 2024 as capacity expanded.

Smaller regional manufacturers without long-term semiconductor supply agreements face materially higher input cost volatility than the five largest producers, who negotiate multi-year chipset pricing directly with contract manufacturers. This gap widens further for operators in markets with weaker currency stability, since payment hardware imports are priced in dollars while venue revenue is collected in local currency, compressing margins for smaller international distributors.
self-service-billiards-system-market-cost-volatility-analysis-1790014737627

Diversifying Payment Component Sourcing Across Multiple Regions

Manufacturers are qualifying payment module suppliers across Taiwan, Vietnam, and Mexico rather than relying on a single sourcing region, reducing exposure to any single country's export restrictions or capacity constraints. This multi-region approach adds modest qualification costs upfront but meaningfully shortens recovery time when disruption hits any one supplier base across the wider manufacturing network overall.

Locking Multi-Year Pricing Agreements With Chipset Suppliers

Larger manufacturers are negotiating three-year fixed pricing contracts directly with semiconductor foundries, trading some flexibility for protection against spot market price swings. This approach favors scale players with reliable order volumes, leaving smaller manufacturers more exposed to spot pricing during future component shortages across the industry, particularly during periods of constrained global chipset supply.

Redesigning Hardware To Reduce Component Count

Engineering teams are simplifying payment terminal circuit boards to reduce the number of discrete semiconductor components per unit, lowering both cost exposure and supply chain complexity. Fewer unique components also shortens repair cycles for field technicians servicing multi-location venue fleets, a secondary benefit operators increasingly value across growing fleet deployments nationwide and across international markets overall.

Portfolio Architecture for Margin Defence

Volume-tier coin-operated tables still anchor unit shipments across value-focused bar and recreation venues nationwide, but gross margins there sit well below premium segments where cashless payment integration and branded craftsmanship command materially higher prices from operators willing to pay for reliability and modern features across their venue portfolios and long-term equipment investment plans overall and into the future.
Premium tables paired with subscription analytics dashboards generate the highest margin pools, since recurring software revenue carries far less cost drag than one-time hardware sales once initial development costs are recovered across the product lifecycle. Manufacturers increasingly bundle multi-year service contracts into premium table sales specifically to capture this durable margin advantage over time, rather than competing purely on upfront unit pricing alone across a crowded competitive field.

The tension between volume shipment targets and premium margin capture is pushing several manufacturers toward tiered product lines rather than a single table design, letting them serve price-sensitive independent venues while still capturing high-value multi-location chain accounts that prioritize connected analytics features and centralized fleet management capability across their growing venue networks and expanding equipment fleets nationwide and internationally overall.

Volume / Commodity-Adjacent Tier

Coin-operated and basic card-swipe tables sold primarily to independent bars and recreation centers on price, with gross margins in the 20 to 28 percent range typical of commodity hardware manufacturing.
Gross Margin: 20%-28%

Premium / Certified Tier

Cashless-enabled tables with branded craftsmanship and warranty support sold to venue chains and hospitality groups, carrying gross margins in the 35 to 45 percent range supported by brand premium and service attachment.
Gross Margin: 35%-45%

Sustainability / Regulatory / Next-Generation Tier

Fully connected tables bundled with analytics subscriptions and extended service contracts, carrying gross margins above 50 percent driven by recurring software revenue and multi-year contract attachment across growing multi-location venue chain accounts nationwide.
Gross Margin: 50%-58%
self-service-billiards-system-market-portfolio-architecture-1790014738129

High-value Sub-segments and Strategic Watch-out

Fleet Analytics Subscription Bundles

Fleet analytics subscription bundles for multi-location chains combine high per-account revenue with the fastest unit growth in the market, as venue operators increasingly manage properties centrally rather than location by location, driving strong demand for consolidated dashboards and centralized reporting across their entire equipment fleet nationwide.
Gross Margin: 50%-58%

Premium Cashless-Enabled Chain Tables

Premium cashless-enabled tables sold to established hospitality groups generate high per-unit revenue with steady, moderate volume growth as chains gradually replace aging equipment across their existing venue footprints rather than expanding rapidly into new locations or untested geographic markets this cycle, preferring measured rollouts instead.
Gross Margin: 35%-45%

Basic Coin-Operated Independent Venue Tables

Basic coin-operated tables remain the volume core of the market, serving thousands of independent bars and recreation venues that prioritize low upfront cost over connected features, sustaining steady replacement demand even as growth concentrates elsewhere in premium segments across the wider industry landscape overall this coming decade.
Gross Margin: 20%-28%

Rural Low-Connectivity Venue Segment

Rural and low-connectivity venues represent a strategic watch-out, since limited network infrastructure constrains cashless and analytics adoption regardless of operator willingness to upgrade, potentially leaving a persistent minority of the installed base on legacy coin mechanisms indefinitely across underserved regions nationwide and internationally for years to come.
Gross Margin: 20%-28%

Recurring Transaction and Service Revenue

Cashless payment fees and analytics subscriptions convert what was once a one-time table sale into an annuity-like revenue stream that compounds over the equipment's operating life, with manufacturers increasingly valued on recurring attach rates rather than unit shipment counts alone across the wider industry. This shift mirrors patterns seen earlier in point-of-sale and vending equipment categories, where recurring fees eventually outweighed original hardware margin.
Adoption depth varies meaningfully by end-use vertical: multi-location bar and entertainment chains adopt both cashless payment and fleet analytics quickly given clear centralized management benefits across their growing property counts, while independent single-location venues adopt cashless payment alone but rarely justify analytics subscription costs given their smaller table counts and simpler operating needs. Hotels and private clubs sit between these two extremes, adopting analytics selectively where table counts justify the added cost.

A generational shift in buyer profiles is underway as younger venue operators who grew up with mobile payment expect connected features by default, replacing an older generation of owners who prioritized table durability and craftsmanship above software capability when making purchasing decisions. This handoff is accelerating cashless adoption even in venue segments that manufacturers previously considered resistant to change.
self-service-billiards-system-market-end-use-penetration-index-1790014738621

Where Billiards Equipment Value Concentrates Next

These are among the four positions where our research anticipates prominent divergence between winners and laggards over the coming forecast period. Each is grounded in the demand model, the regulatory perimeter, and the announced capacity pipeline.
01 / PAYMENT PLATFORM POSITIONING

Build payment processing capability rather than license it

Manufacturers that own their payment processing stack capture transaction fee revenue directly rather than sharing it with a third-party processor, compounding into a materially larger revenue base over a multi-year contract lifecycle. Licensing payment technology may look cheaper initially, but it caps the long-term margin ceiling and leaves manufacturers dependent on an external partner for their fastest-growing revenue stream. Building in-house processing capability requires upfront investment, yet it positions manufacturers to capture the full value of the cashless transition already underway across venue types nationwide.
02 / FLEET ANALYTICS EXPANSION

Prioritize multi-location chain accounts over single venue sales

Multi-location chains generate substantially higher lifetime value per account than single independent venues, since fleet analytics subscriptions scale directly with the number of tables under management across each chain's footprint. Winning a single chain account can deliver the equivalent of dozens of independent venue sales without a proportional increase in sales and service overhead costs. Manufacturers should reorganize sales teams around chain relationship management rather than transactional individual venue selling to capture this disproportionate value concentration effectively across their broader commercial pipeline going forward.
03 / RURAL MARKET COVERAGE

Develop offline-capable payment systems for low-connectivity venues

A meaningful share of the installed base sits in venues with unreliable internet connectivity, and manufacturers ignoring this segment cede it entirely to legacy coin mechanisms rather than capturing incremental cashless revenue. Offline-capable payment systems that sync transaction data when connectivity resumes let manufacturers serve these venues without requiring continuous network access. This segment will not drive premium growth, but abandoning it entirely surrenders replacement cycle revenue to competitors willing to build simpler offline solutions for these underserved venues instead.
04 / MANUFACTURING COST RESILIENCE

Qualify multiple payment component suppliers before the next shortage

The 2021 semiconductor shortage demonstrated how quickly single-region sourcing can stall cashless system shipments entirely, and manufacturers that responded by diversifying supplier qualification recovered faster than those relying on one primary source. Building redundant sourcing relationships before the next disruption, rather than during one, preserves shipment continuity when competitors face component delays across their own production schedules. This resilience becomes a genuine competitive advantage precisely when supply conditions tighten again across the broader electronics industry and adjacent hardware manufacturing sectors.

Engagement Snapshot From the Field

A live engagement with an industry participant carrying material or product regulatory and market exposure ahead of a defining policy shift, showing how our research translates into a defensible multi-year portfolio strategy.
MARKET MINDS ADVISORY · CLIENT ENGAGEMENT SUMMARY
Self-service Billiards System Producer Strategic Portfolio Review and Transition Roadmap 2026·Investment Scenario on Self-service Billiards System Exposure Evaluation 2025-26
CLIENT PROFILE
The client operates a regional chain of 40 bar and entertainment venues across the southeastern United States, each equipped with coin-operated billiards tables installed over the previous decade. Facing rising maintenance costs and declining table utilization data visibility, leadership sought guidance on whether a fleet-wide cashless payment upgrade would justify the required capital investment across their venue portfolio.
STRATEGIC CHALLENGE
Coin mechanism maintenance costs had risen 28 percent (client-reported, unverified by MMA) over three years, while management lacked visibility into which tables generated the highest utilization and revenue per location across the entire chain. The client needed an objective framework for prioritizing which venues to upgrade first given constrained capital budgets.
MMA APPROACH
MMA analyzed utilization patterns and payment technology adoption across comparable multi-location chains, benchmarking upgrade costs against realized revenue lift from cashless and analytics adoption in similar venue formats. The engagement combined primary operator interviews with manufacturer specification comparisons to build a phased upgrade prioritization model tailored to the client's specific venue mix.
KEY FINDINGS
  1. Highest-utilization venues generating over 60 percent above-average revenue per table justified immediate upgrade priority ahead of the rest of the fleet (client-reported, unverified by MMA).
  2. Cashless payment adoption correlated with a measured 22 percent increase in average per-table transaction revenue across comparable venues (client-reported, unverified by MMA).
  3. Fleet analytics visibility identified three underperforming venues suitable for equipment reallocation rather than new capital investment across the broader chain footprint overall.
  4. Phased upgrade sequencing reduced required upfront capital by 35 percent compared to a simultaneous fleet-wide rollout across all forty venues (client-reported, unverified by MMA).
CLIENT PROFILE
The client operates a regional chain of 40 bar and entertainment venues across the southeastern United States, each equipped with coin-operated billiards tables installed over the previous decade. Facing rising maintenance costs and declining table utilization data visibility, leadership sought guidance on whether a fleet-wide cashless payment upgrade would justify the required capital investment across their venue portfolio.
STRATEGIC CHALLENGE
Coin mechanism maintenance costs had risen 28 percent (client-reported, unverified by MMA) over three years, while management lacked visibility into which tables generated the highest utilization and revenue per location across the entire chain. The client needed an objective framework for prioritizing which venues to upgrade first given constrained capital budgets.
MMA APPROACH
MMA analyzed utilization patterns and payment technology adoption across comparable multi-location chains, benchmarking upgrade costs against realized revenue lift from cashless and analytics adoption in similar venue formats. The engagement combined primary operator interviews with manufacturer specification comparisons to build a phased upgrade prioritization model tailored to the client's specific venue mix.
KEY FINDINGS
  1. Highest-utilization venues generating over 60 percent above-average revenue per table justified immediate upgrade priority ahead of the rest of the fleet (client-reported, unverified by MMA).
  2. Cashless payment adoption correlated with a measured 22 percent increase in average per-table transaction revenue across comparable venues (client-reported, unverified by MMA).
  3. Fleet analytics visibility identified three underperforming venues suitable for equipment reallocation rather than new capital investment across the broader chain footprint overall.
  4. Phased upgrade sequencing reduced required upfront capital by 35 percent compared to a simultaneous fleet-wide rollout across all forty venues (client-reported, unverified by MMA).
RECOMMENDED STRATEGY
Phase 1: Phase 1 (Immediate): Prioritizes the top ten highest-utilization venues for cashless and analytics upgrades within the first two quarters of the engagement. Phase 2: Phase 2 (Mid-Term): Extends upgrades to mid-tier venues while reallocating underperforming equipment identified during the initial fleet-wide assessment phase of the engagement. Phase 3: Phase 3 (Ongoing): Establishes ongoing analytics-driven review cycles to guide future capital allocation decisions across the full venue portfolio each year.
OUTCOME
The client completed phase one upgrades across ten venues within the planned timeline, reporting a 19 percent increase in table revenue at upgraded locations within the first two quarters (client-reported, unverified by MMA). Leadership adopted the phased framework as the standing approach for future fleet expansion decisions.

Frequently Asked Questions

Foundational context covering the market sizes, CAGR, scope, country, region and competition that inform every finding below. This section is provided to cover basics and most often pre-purchase conversations, answered from the MMA Primary Research Dataset.

What is the current size of the Self-service Billiards System Market?

The global self-service billiards system market reached an estimated 0.65 billion dollars in 2025, covering coin-operated and cashless-enabled tables sold to bars, entertainment venues, and recreation centers worldwide.

How large will the Self-service Billiards System Market be by 2036?

MMA projects the market will reach approximately 1.18 billion dollars by 2036, driven primarily by cashless payment adoption and expanding fleet analytics subscription revenue across multi-location venue chains.

What is the CAGR for the Self-service Billiards System Market 2026 to 2036?

The market is forecast to grow at a compound annual growth rate of 5.5 percent between 2026 and 2036, reflecting steady but mature-industry-adjacent expansion rather than explosive early-stage growth.

Which segment is growing fastest?

Mobile app-enabled payment systems represent the fastest-growing segment, expanding roughly 1.5 times faster than the overall market as venues replace coin mechanisms with smartphone-based transaction capability.

Who are the major companies in the Self-service Billiards System Market?

Leading companies include Valley-Dynamo, Brunswick Billiards, Diamond Billiard Products, Olhausen Billiard Manufacturing, and Rasson Billiards, together holding a combined market share of roughly 42 percent.

Which country is growing fastest?

China is expanding fastest in percentage terms as entertainment venue construction accelerates nationwide, even though the United States retains the largest absolute installed base of tables given its dense independent bar network.

Report Segmentation Architecture

The full report scope spans multiple orthogonal segmentation dimensions, with cross-tabulated demand data provided for each dimension pair. Coverage extends further to regional breakdowns, trend trajectories, and the competitive detail needed to support segment-level decision-making.

By Payment Technology Type

  • Coin-Operated Mechanisms
  • Card Swipe Terminals
  • Mobile App Payment Systems
  • NFC and Tap-to-Pay Systems
  • Hybrid Multi-Payment Systems
  • Table Monitoring Analytics Hardware

By End-Use Industry

  • Bars and Taverns
  • Entertainment and Recreation Centers
  • Hotels and Hospitality Venues
  • Private Clubs and Associations
  • Educational and Institutional Facilities

By Commercial Dimension

  • Independent Venue Operators
  • Multi-Location Chain Operators
  • Direct Manufacturer Sales
  • Distributor and Reseller Channels

By Region

  • North America
  • Western Europe
  • East Asia
  • South Asia and Pacific
  • Latin America
  • Middle East and Africa
  • Eastern Europe

Scope, Methodology, and Coverage

Every figure in this report is reproducible from documented input assumptions. The scope below maps the historical period, the forecast horizon, the segmentation dimensions, and the countries covered, alongside the underlying primary and qualitative methodology.
Historical Period
2020 to 2025
Forecast Period
2026 to 2036
Base Year
2025 (USD billions; MMA Primary Research Dataset, September 2026)
Market Definition
This report covers self-service billiards systems, including coin-operated and cashless-enabled pool tables and their associated payment and analytics hardware, sold to bars, entertainment venues, and recreation centers. It excludes standalone arcade gaming equipment, non-billiards recreational furniture, and venue management software sold independently of table hardware.
Quantitative Units
USD billions (current prices); unit shipment volume where applicable
Segmentation Dimensions
By Payment Technology Type; By End-Use Industry; By Commercial Dimension; By Region
Regions Covered
North America, Western Europe, East Asia, South Asia and Pacific, Latin America, Middle East and Africa, Eastern Europe
Countries Covered
USA, China, Germany, France, UK, Japan, South Korea, India, Australia, Canada, Brazil, Mexico, Indonesia, Vietnam, Thailand, Malaysia, UAE, Saudi Arabia, South Africa, Nigeria, Turkey, Poland, Netherlands, Italy, Spain, Sweden, Switzerland, Argentina, Colombia, Singapore, and additional markets relevant to this sector
Key Companies Profiled
Valley-Dynamo, Brunswick Billiards, Diamond Billiard Products, Olhausen Billiard Manufacturing, Rasson Billiards, Imperial Billiards, American Heritage Billiards, Legacy Billiards, Predator Group, Nayax, Suzo-Happ, Betson Enterprises, Global Payment Technologies, ICE, Cammegh, Riley Leisure, Supreme Billiards, JBB, Shanghai Yude Billiards, JOY Billiards
Quantitative Methodology
Primary survey, n=3,800 respondents, Q4 2025, six countries; demand-side model with trade association cross-validation
Qualitative Methodology
47 expert interviews, Q4 2025; applied to validate demand model assumptions, identify emerging dynamics, and assess competitive positioning
Report Format
PDF and XLSX data workbook (Word format preview document)
Publisher
Market Minds Advisory
Report Code
MMA-2026-TEC-703
Published
September 2026
Contact
sales@marketmindsadvisory.com | www.marketmindsadvisory.com

Purchase the full Self-service Billiards System Market Report (2026 to 2036).

The full report provides comprehensive coverage of the global self-service billiards system market across all seven regions, ten years of forecast data, and detailed competitive profiling of twenty leading manufacturers. It includes granular segmentation analysis, regional demand architecture, and revenue lever modeling calibrated to real industry margin structures. Subscribers receive access to underlying primary survey data spanning 3,800 respondents and 47 expert interviews conducted during the fourth quarter of 2025. The report is designed for strategic planning, investment due diligence, and competitive benchmarking purposes across manufacturer and investor audiences alike.
Full competitive profiles of twenty key market participants
Detailed regional demand architecture across seven global regions
Revenue lever modeling with quantified financial impact estimates
Primary survey data from 3,800 respondents across six countries
Segment-level growth forecasts through the 2036 forecast horizon
Input cost risk analysis with supplier mitigation strategies

Built For The People Who Decide

From boardroom strategy to bench-side execution, this report is read cover-to-cover by leaders shaping the next decade of their industry, turning demand scenarios, market dynamics and valuation benchmarks into decisions.
CXOs/ Presidents/ VPs/ Managers
M&A and Corporate Development
Strategy Teams and R&D Heads
Procurement and Product Directors
Regulatory and Compliance Leaders
Investor Relations and Equity Analysts