Market Minds Advisory
Self-checkout Systems Market

Self-checkout Systems Market: Self-checkout Systems Market. Retail Labor Economics Meet Computer Vision Loss Prevention

Grocery chains and big-box retailers are racing to deploy computer vision loss prevention alongside self-checkout kiosks, forcing suppliers to balance rising labor cost pressure against shrinkage rates that erode retailer margin.

Lead Analyst

Published

September 2026

Make Smarter Decisions with Customized Research Insights

Request a free sample report and evaluate market opportunities, growth trends, and competitive dynamics relevant to your business needs.

2025 MARKET VALUE$8.4BMarket Size 2025
2036 FORECAST VALUE$27.0BBase Case , 2026 to 2036
CAGR 2026 TO 203611.2 %Bull 12.5% / Bear 9.9%
INCREMENTAL OPPORTUNITY$17.7BNet 10- year value creation
EXPANSION MULTIPLE2.89x2036 value over 2026 base
Strategic Levers
M&A Pipeline
Regional Outlook
Country Rankings
Competitive Intelligence
Segmental Deep-dive
Call-Us : 91 93563 13602

Executive Snapshot and Market Trajectory.

Retail labor shortages and rising minimum wage costs are pushing grocery and big-box chains toward self-checkout at a pace unmatched in the category's prior decade of gradual adoption. Chains that resisted full conversion for years are now moving faster than the category has ever seen.
Computer vision loss prevention systems, which flag mis-scans and unscanned items in real time, are becoming standard equipment rather than an optional upgrade as retailers confront shrinkage rates that eat directly into thin grocery margins. Adoption concentrates most heavily in large-format grocery and big-box formats across North America and East Asia, where labor cost pressure is most acute. Vendors that can demonstrate measurable shrinkage reduction command premium pricing over those offering scanning hardware alone.
Competitive character is shifting from hardware sales toward software-driven loss prevention subscriptions, a model that rewards vendors with proven detection accuracy over those selling kiosks alone. Regulatory scrutiny over biometric camera data collection in several jurisdictions is forcing suppliers to redesign vision systems around anonymized detection rather than facial recognition. Vendors slow to adapt risk losing contracts to competitors that solved the privacy question earlier. Timing matters.
Market Definition
This market covers self-checkout kiosk hardware, scanning software, and computer vision loss prevention systems deployed in grocery, convenience, and general merchandise retail settings. It excludes mobile scan-and-go smartphone applications and standard staffed point-of-sale terminals.
Base Year Value
$8.4B in 2025 (MMA Primary Research Dataset, September 2026)
Forecast Period
2026 to 2036, eleven discrete annual values
CAGR
11.2% base case. Bull 12.5%. Bear 9.9%.
Fastest Growth Segment
Computer Vision Loss Prevention Systems: 17.8% CAGR
Fastest Growth Country
China: 15.1% CAGR
Fastest Growth Region
South Asia and Pacific: 13.2% CAGR
Largest Region
North America: 28% of 2025 global value
Market Leaders
NCR Voyix, Diebold Nixdorf, Toshiba Global Commerce Solutions, Fujitsu Limited, Zebra Technologies. Source: MMA Analysis based on company annual reports.
Primary Survey
n=3,800 procurement and R&D decision-makers, Q4 2025, six countries
Methodology
Demand-side build-up, cross-validated against public data, 47 expert interviews

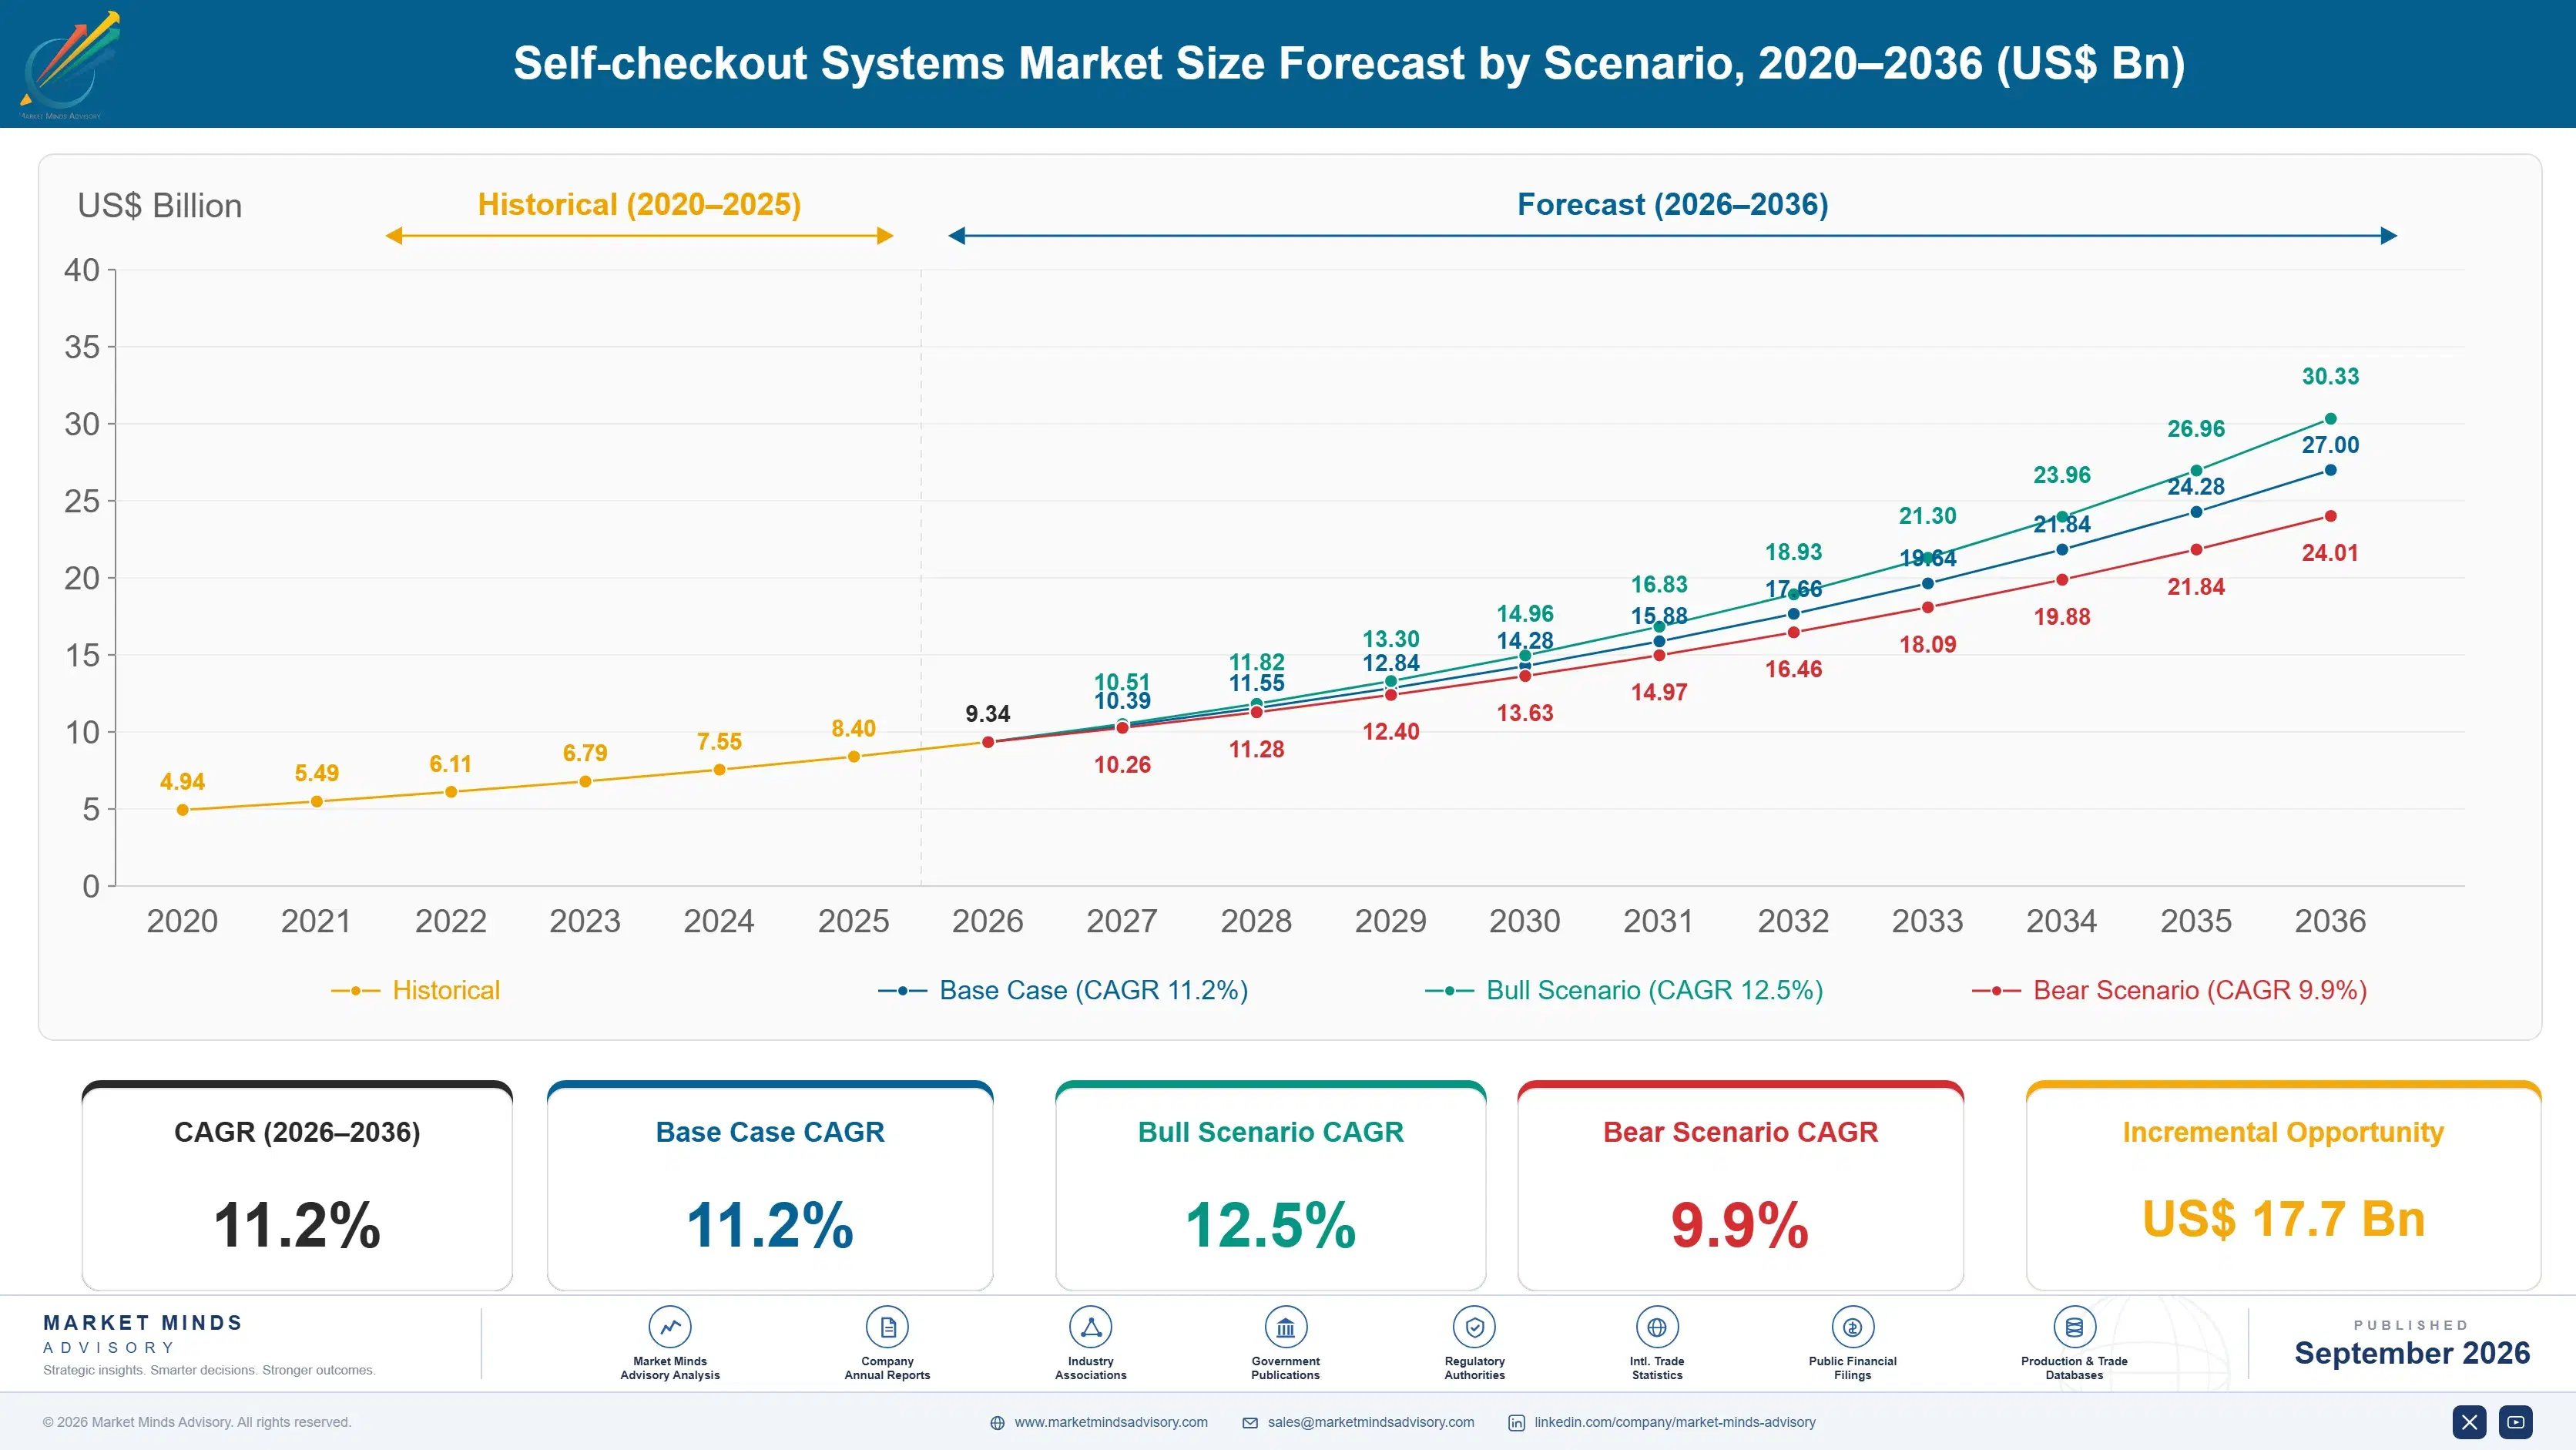
Self-checkout Systems Market Forecast Scenarios

self-checkout-system-market-size-forecast-scenario-1788415679122
Self-checkout adoption between 2020 and 2025 grew steadily as grocery chains expanded kiosk counts, though the historical growth rate of 10.3 percent understated a sharper acceleration in the final two years, once labor cost pressure intensified nationwide. Kiosk vendors that entered the period selling hardware alone increasingly found retailers demanding bundled software and maintenance contracts instead.
The base case rests on three commercial mechanisms: continued grocery labor cost inflation pushing chains toward automation, computer vision loss prevention proving measurable shrinkage reduction that justifies premium software pricing, and East Asian convenience store operators standardizing self-checkout across national store networks. Together these sustain low double-digit growth through the forecast period. Vendors that fail on any one of these three fronts risk ceding share to faster-moving competitors within a single product cycle.
The bull case assumes faster-than-expected computer vision accuracy gains that let retailers remove staffed checkout lanes entirely, pulling forward capital spending. The bear case centers on consumer backlash and biometric privacy regulation in Europe, which could slow vision deployment and push retailers back toward simpler scan-only kiosks. Either scenario reshapes vendor investment priorities meaningfully within the next few years.

Where Labor Costs Meet Loss Prevention Software

Self-checkout hardware margin has compressed as kiosk components commoditize, pushing vendors to shift revenue toward loss prevention software subscriptions that carry recurring, higher-margin contracts. Retailers now negotiate multi-year software agreements alongside one-time kiosk purchases rather than treating the two as separate decisions. Vendors unable to make that transition risk being squeezed out by competitors offering an integrated hardware and analytics package.
MARKET CONCENTRATIONCR5 52%Top five vendors control just over half the market
AVERAGE KIOSK PRICE$8,000-$18,000/unitPrice varies by vision system and scanning configuration included
LEADING DEPLOYMENT COUNTRYUSA 34% shareUnited States leads installed kiosk base by unit count
SOFTWARE ATTACH RATE46%Share of kiosks paired with loss prevention subscriptions
SHRINKAGE REDUCTION RATE18-24%Typical reduction retailers report after vision system deployment
AVERAGE KIOSK SERVICE LIFE7-9 yearsTypical hardware lifespan before full replacement cycle begins
Computer vision accuracy has become the primary purchase criterion, ahead of scanning speed or kiosk footprint, since false accusations of theft generate customer complaints that damage retailer reputation faster than any hardware defect. Vendors investing heavily in detection algorithm accuracy are winning multi-store rollout contracts over competitors offering cheaper but less reliable systems. That gap between accuracy leaders and laggards widens further as retailers share performance data across their own peer networks.
Grocery and big-box retailers dominate deployment volume, though East Asian convenience stores are adopting kiosks faster than any other retail format, driven by staffing shortages in dense urban locations. Full-service restaurants and quick-service chains remain a smaller but growing adjacent deployment category. Vendors tailoring kiosk footprint to these smaller store formats are capturing share that larger, bulkier hardware designs cannot easily serve.
"Retailers that treat computer vision as a loss prevention tool rather than a customer experience feature are already ahead of competitors still debating the investment. Shrinkage reduction pays for the hardware within two years in most large-format formats."
Director, Retail Technology and Automation Practice · MMA Technology Practice · September 2026

Market Trends

Computer Vision Loss Prevention Becomes Standard Equipment

Retailers are moving computer vision loss prevention from a pilot program tested at a handful of stores to a standard specification required across every new kiosk order, a shift that happened faster than most vendors anticipated entering 2025. Chains report shrinkage reduction of eighteen to twenty-four percent once vision systems flag mis-scans and unscanned items in real time, a figure large enough to justify the added hardware and software cost within roughly two years across most large-format stores. Vendors without a proven vision offering are increasingly excluded from multi-store rollout bids entirely.
Market Impact: staffing gap widened 3 years running
Software Subscription Models Replace One-Time Hardware Sales

Vendors are restructuring commercial terms around recurring software subscriptions tied to loss prevention analytics rather than one-time kiosk hardware sales, a shift that mirrors the broader industry move toward software-as-a-service pricing seen across retail technology. Roughly forty-six percent of deployed kiosks now carry an attached software subscription, up sharply from a much smaller share only three years ago, as retailers recognize that ongoing detection accuracy improvements require continuous vendor investment rather than a static one-time purchase. This shift raises switching costs for retailers once a vendor's software becomes embedded. Retailers now expect roadmap commitments.
Market Impact: rollout covers most stores by 2030

Market Opportunities and Growth Drivers

Grocery Labor Shortages Push Automation Investment

United States grocery chains report persistent front-end staffing shortages that minimum wage increases across several states have made considerably harder to solve through pay adjustments alone, pushing capital budgets toward self-checkout automation instead of continued hiring. USDA retail labor data shows grocery employment growth trailing store count growth for three consecutive years, a gap that self-checkout kiosks fill without requiring the wage premium that attracting new front-end staff now demands. Big-box retailers are following the same pattern at a larger scale. Vendors offering financing arrangements tied to labor cost savings are winning deals faster than those selling hardware outright.
Market Impact: compliance redesign adds 6-9 months

East Asian Convenience Store Networks Standardize Kiosks

Japanese and South Korean convenience store operators are standardizing self-checkout across national store networks numbering in the tens of thousands of locations, driven by demographic labor shortages that are more acute in East Asia than almost anywhere else in the world. Seven Eleven's parent company and several regional chains have both announced multi-year kiosk rollout programs covering the large majority of their store footprint by the end of the decade. Suppliers with proven compact kiosk designs suited to small-format stores are capturing this wave. Regional hardware customization has become a genuine competitive differentiator.
Market Impact: some chains report 12% lane abandonment

Market Restraints and Challenges

Biometric Privacy Regulation Constrains Vision Deployment

Several European Union member states and a handful of United States jurisdictions have introduced biometric data collection restrictions that directly affect how loss prevention camera systems can process and retain shopper images, forcing vendors to redesign detection models around anonymized data rather than facial recognition. The root cause is a broader public trust deficit around retail camera surveillance that predates self-checkout entirely, making regulators wary of any new deployment involving customer-facing cameras. Vendors are responding by shifting detection logic toward item-level anomaly flags rather than person-level tracking, a mitigation path several suppliers have already adopted.
Market Impact: shrinkage falls 18-24% after deployment

Consumer Backlash Over Self-Checkout Experience Persists

A vocal segment of shoppers continues to resist self-checkout, citing frustration with mis-scans, age verification holdups, and the sense that retailers are shifting labor costs onto customers without a corresponding price reduction. The root cause traces to inconsistent kiosk reliability during the technology's earlier rollout years, which left a lasting impression that newer, more accurate systems have not fully erased. Some chains are mitigating this by maintaining staffed lanes alongside kiosks and training floor staff to assist self-checkout users quickly rather than eliminating human help entirely. Retailers striking this balance report fewer complaints than those removing staffed lanes entirely.
Market Impact: attach rate reached 46% of kiosks
3 additional market trends, 4 additional growth drivers, and 3 additional restraints and challenges are covered in the full report. Contact sales@marketmindsadvisory.com to access the complete intelligence.

Segment CAGR and Growth Architecture

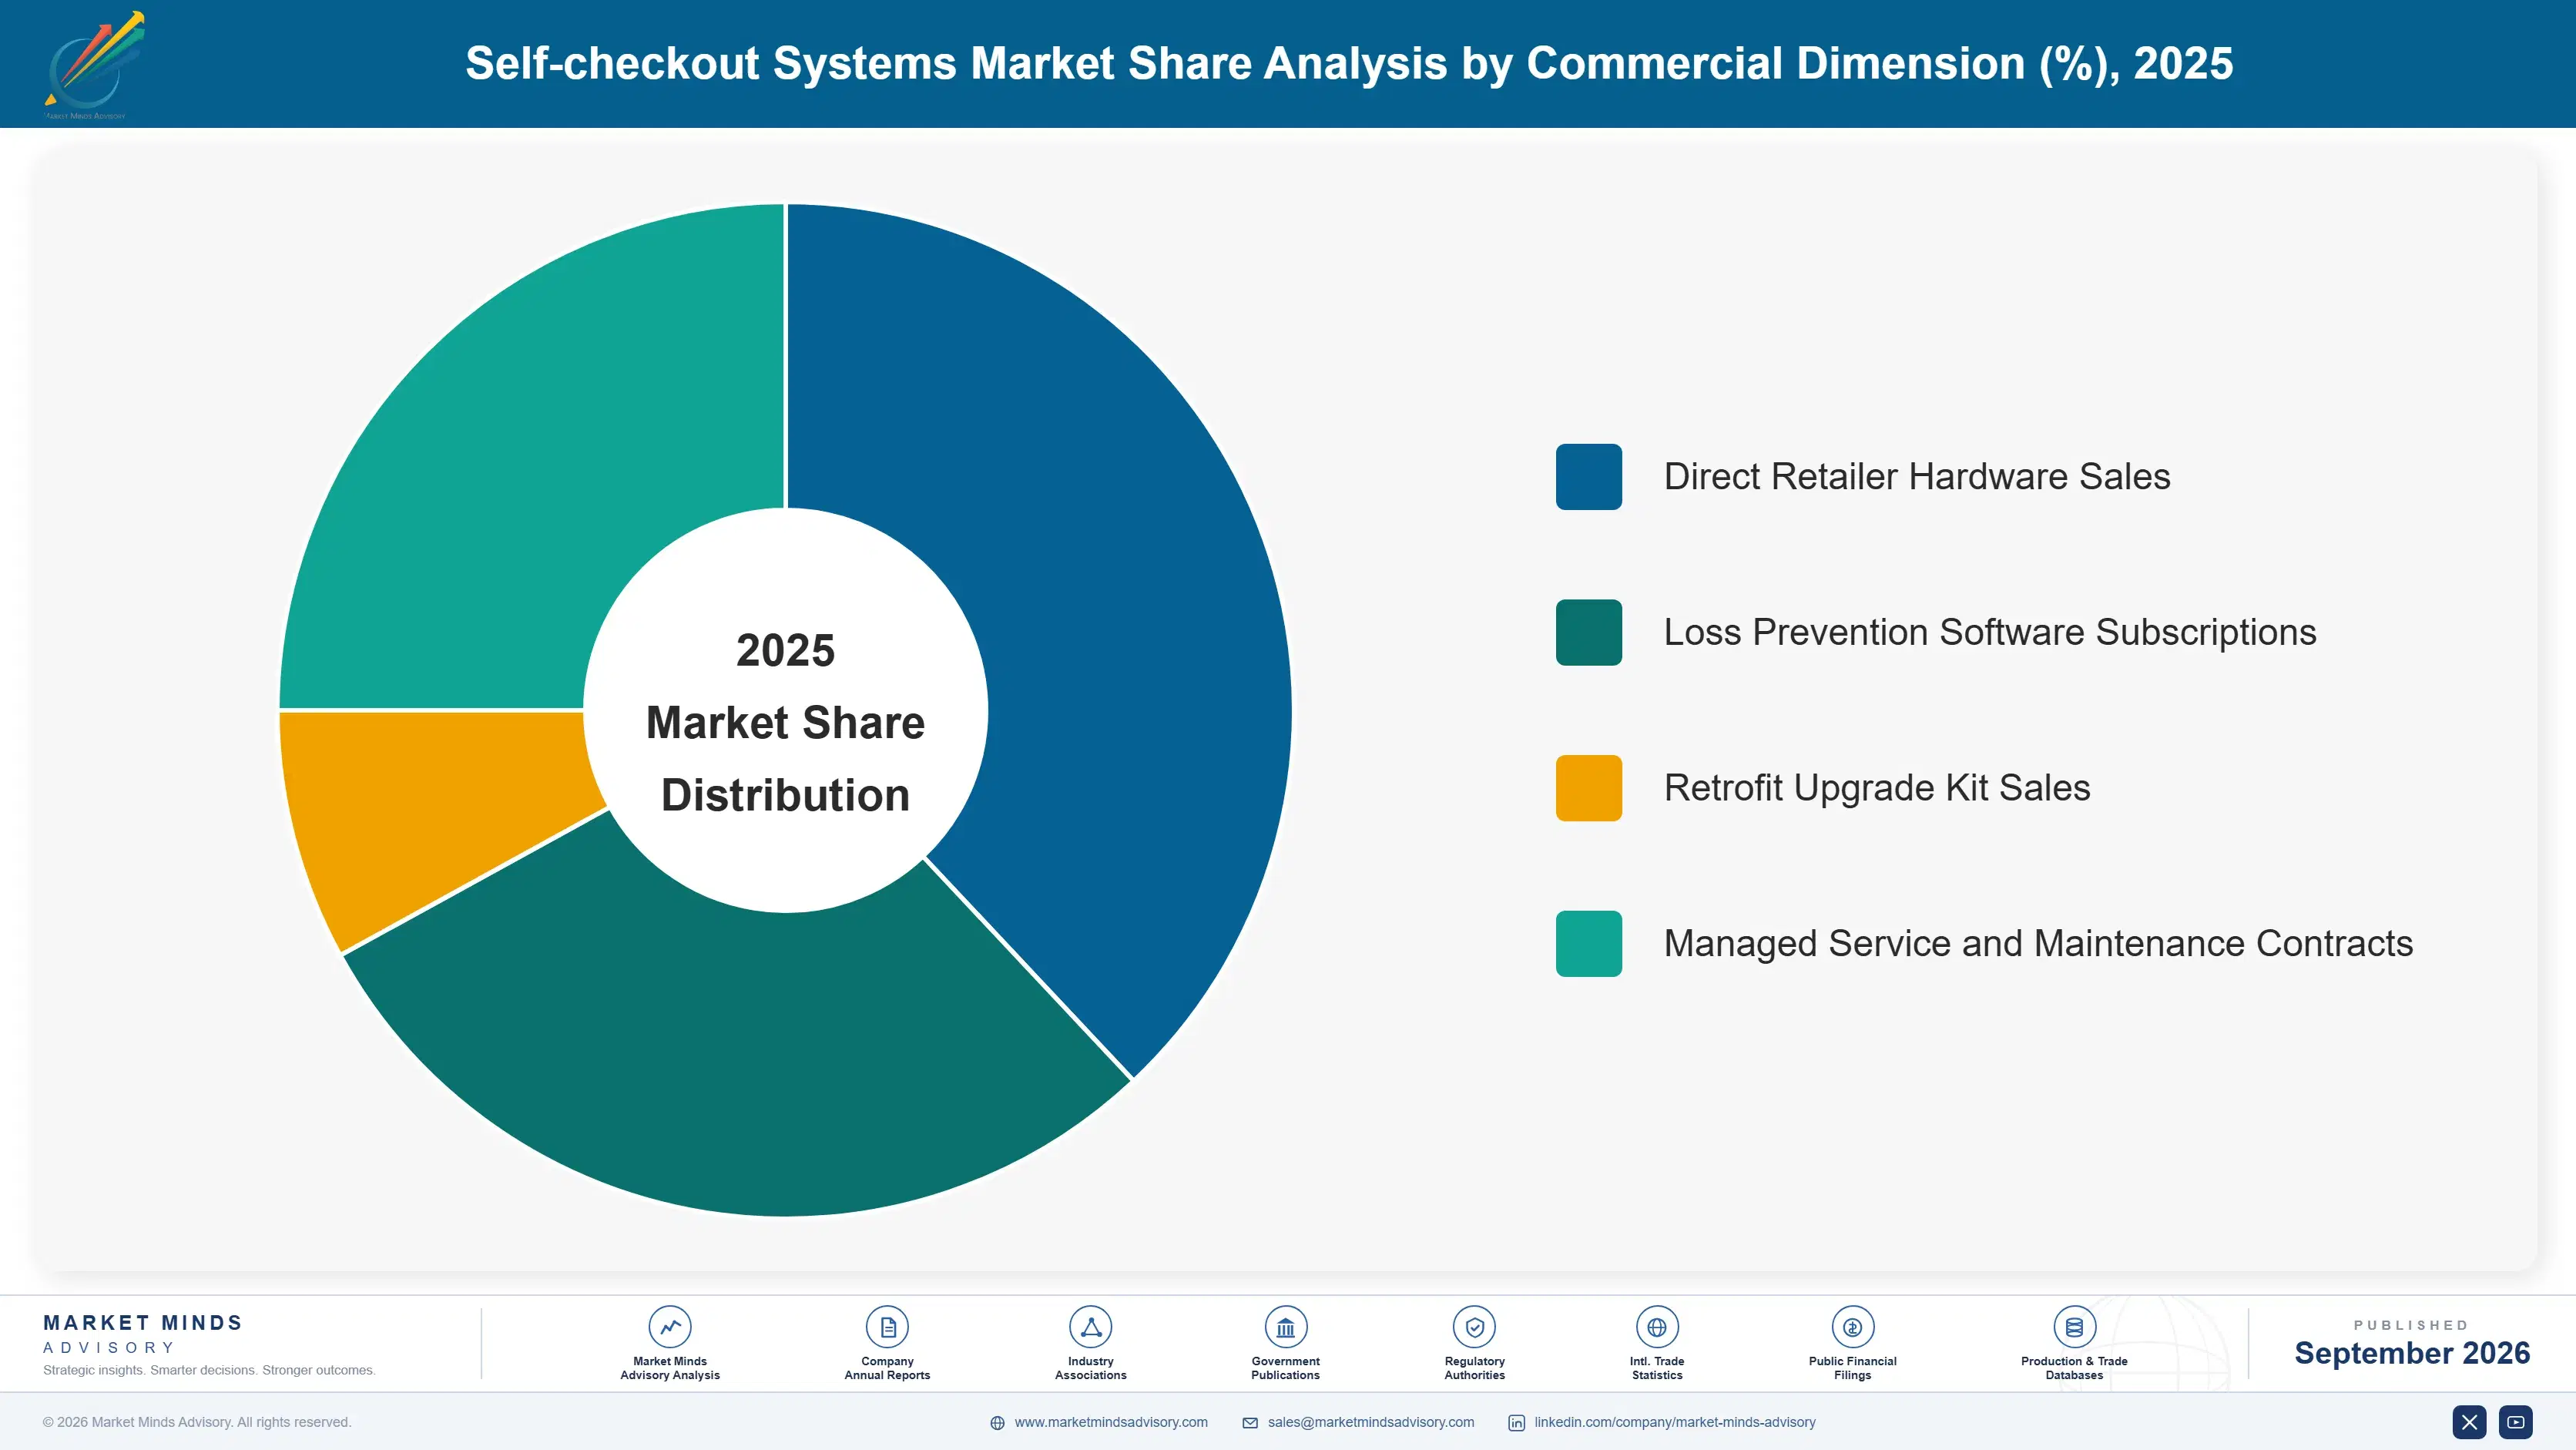
Self-checkout systems segment by kiosk format and detection technology rather than by retail vertical, since a single grocery chain typically deploys multiple kiosk types across its store footprint depending on format size and shrinkage risk profile. Vendors treating detection technology and kiosk form factor as separate purchasing decisions win more design-in contracts than those bundling both into one fixed configuration.
self-checkout-system-market-market-share-analysis-1788415679653

Computer Vision Loss Prevention Systems

Computer vision loss prevention systems use overhead and kiosk-mounted cameras paired with machine learning models to flag mis-scans, unscanned items, and suspicious bagging behavior in real time as shoppers move through self-checkout lanes. Retailers report shrinkage reduction of eighteen to twenty-four percent after deployment, a figure large enough to justify premium software subscription pricing on top of standard kiosk hardware costs. Adoption is accelerating fastest in large-format grocery, where shrinkage rates run highest and staffing constraints make human oversight impractical. Vendors are also extending vision detection to catch weighing discrepancies on produce items, a use case that grocery chains specifically requested after early rollouts focused only on barcode mis-scans. Retailers value this addition highly.
CAGR 17.8%

Full-Size Grocery Self-Checkout Kiosks

Full-size grocery kiosks handle high transaction volumes across large-format supermarkets and hypermarkets, typically bundling barcode scanning, weight verification, and payment processing into a single integrated unit. This segment represents the largest installed base by unit count, reflecting decades of gradual adoption since the format's introduction, though unit growth now trails the faster-growing vision and compact-format segments. Replacement cycles increasingly favor units with modular vision camera slots that support future upgrades without full hardware replacement. Big-box retailers outside grocery are adopting the same core hardware platform, adapting kiosk footprint and payment configuration to general merchandise transaction patterns rather than grocery-specific weight verification needs. Replacement decisions increasingly hinge on upgrade flexibility rather than sticker price alone.
CAGR 12.9%
Full segment breakdown across 6 segments available in the complete report.

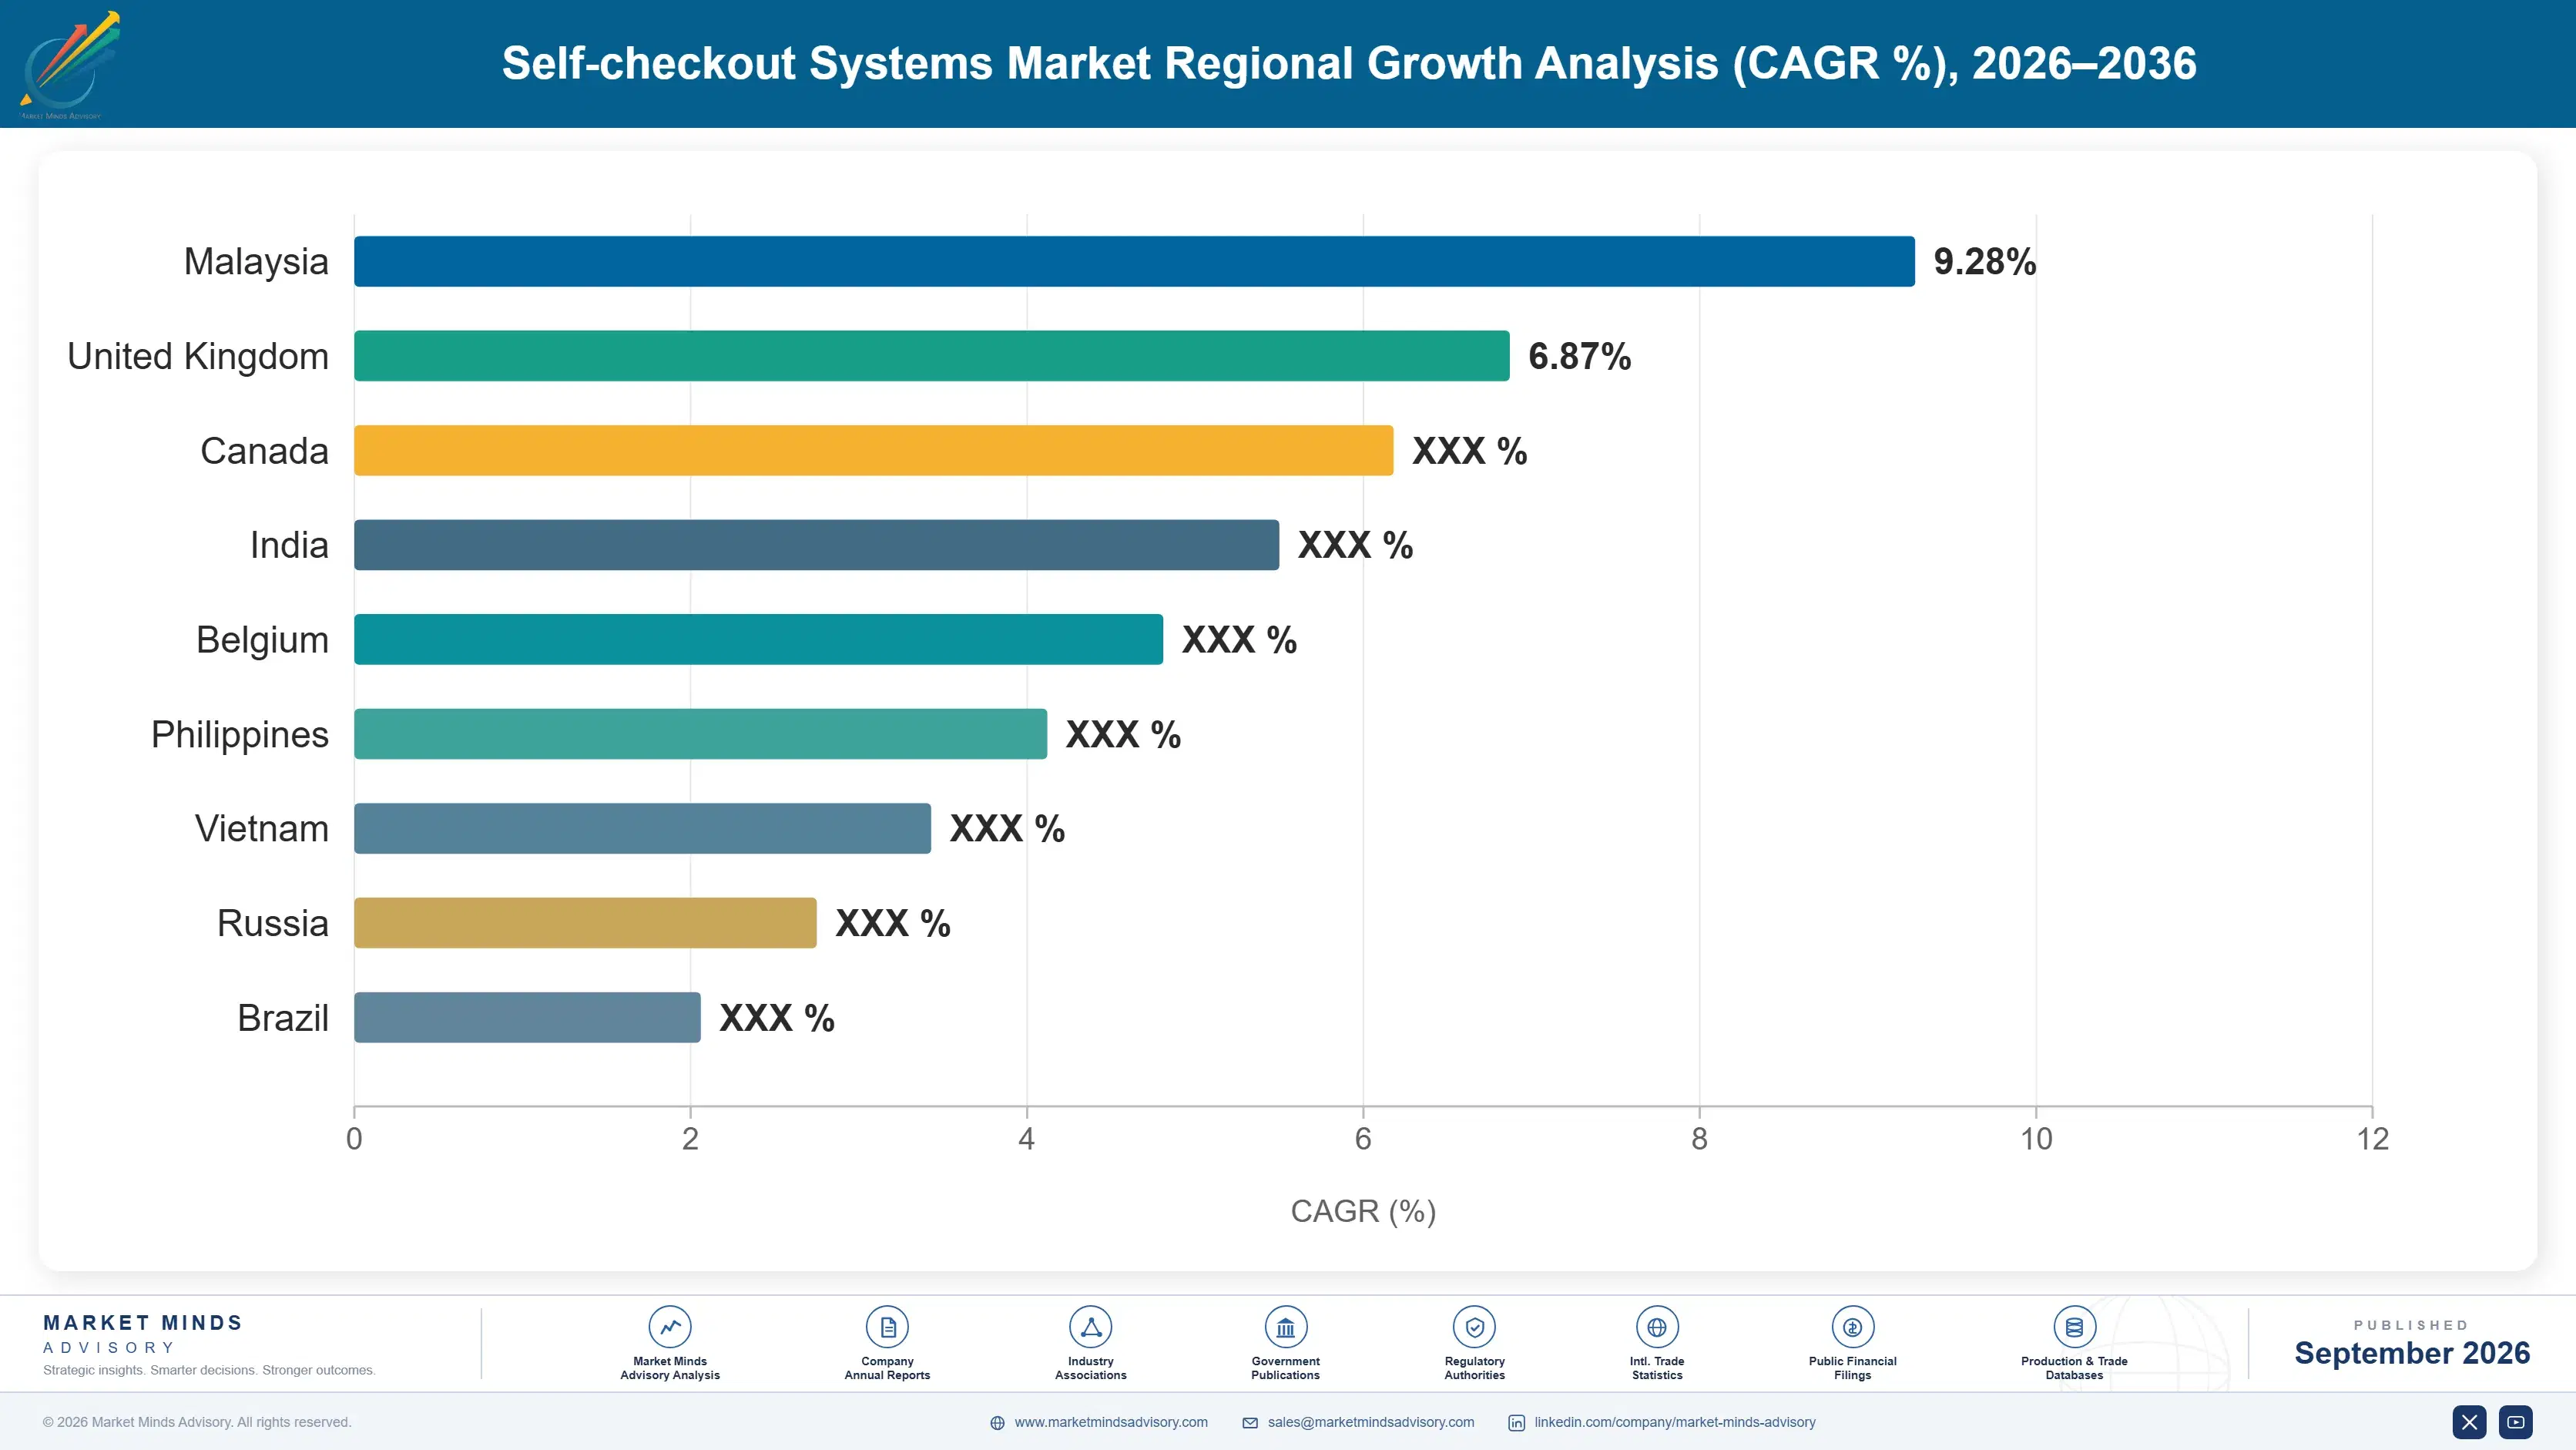
Regional Architecture and Country Demand Map

North America leads global self-checkout deployment on the strength of grocery and big-box retail labor cost pressure, while South Asia and Pacific posts the fastest regional growth as India's organized retail sector scales rapidly from a small existing installed base today. Big-box retailers everywhere are watching.

North America

United States grocery chains and big-box retailers anchor North American demand, with Kroger, Walmart, and Target all running large-scale kiosk rollouts across thousands of store locations nationwide. Minimum wage increases across California, New York, and several other states have made front-end staffing costs rise faster than store count growth, pushing capital budgets toward automation rather than continued hiring. Canadian grocery chains are following a similar pattern at a smaller scale, though with somewhat slower vision system adoption given a less acute labor shortage than in comparable United States markets currently. Vendors report United States buyers negotiate harder on software subscription pricing than on hardware itself, treating the recurring contract as the more consequential decision.
Share: 28% | CAGR: 10.4% (2026 to 2036)

Western Europe

Germany's discount grocery chains, led by Aldi and Lidl, have moved aggressively into self-checkout as part of a broader low-cost operating model that depends on minimizing front-end labor headcount. United Kingdom supermarkets including Tesco and Sainsbury's maintain large installed kiosk bases but face growing consumer and regulatory pushback over camera-based loss prevention under strict data protection rules. Regional growth trails the global average because much of the addressable grocery market already completed its initial kiosk rollout during the prior decade, leaving vision system upgrades rather than first-time kiosk adoption as the dominant purchase pattern. France's Carrefour is pursuing a comparable strategy, betting that vision-based loss prevention can offset years of stagnant grocery margin growth.
Share: 20% | CAGR: 9.6% (2026 to 2036)
Regional intelligence for 5 additional markets available in the complete report: East Asia, South Asia and Pacific, Latin America, Middle East and Africa, Eastern Europe. Contact sales@marketmindsadvisory.com.
self-checkout-system-market-country-cagr-analysis-1788415680234

Software Attach Rates Drive Margin Expansion

Vendors that shift revenue mix toward recurring loss prevention software, bundle detection accuracy guarantees into contracts, and expand compact kiosk formats for smaller-footprint stores capture disproportionate margin as hardware itself continues commoditizing across the category. Vendors slow to act cede share to faster-moving rivals within a single procurement cycle. First movers on each front are pulling ahead noticeably.

Loss Prevention Subscription Bundling Program Strategy

Vendors that bundle computer vision loss prevention as a mandatory recurring subscription alongside kiosk hardware, rather than an optional add-on, convert a one-time hardware sale into a multi-year revenue relationship. NCR Voyix and Toshiba Global Commerce Solutions have both restructured pricing around this model, and roughly 46% of deployed kiosks now carry an attached subscription, up sharply from a much smaller share three years ago. This shift also raises switching costs for retailers once detection models train on a store's specific shrinkage patterns. Vendors slower to transition still depend on one-time hardware margin that keeps compressing each generation.
Market Impact: software attach rate reached 46% of kiosks sold

Detection Accuracy Performance Guarantee Contract Design

Vendors offering contractual shrinkage reduction guarantees, backed by performance data rather than marketing claims, win multi-store rollout bids that vendors without measurable accuracy data cannot credibly compete for. Diebold Nixdorf has structured several recent contracts around guaranteed reduction thresholds tied to penalty clauses, a model that shifts commercial risk toward the vendor but commands a price 20-30% higher per unit in return. Retailers increasingly favor this structure over unverified vendor claims. Smaller vendors without accuracy data to back a similar guarantee are increasingly locked out of these bids entirely. Buyers view this as risk transfer worth paying for.
Market Impact: guaranteed-outcome contracts price 20-30% above standard offerings today

Compact Kiosk Format for Convenience Stores

Vendors developing compact kiosk footprints suited to convenience store formats capture volume that full-size grocery hardware cannot serve, particularly across East Asia's dense convenience store networks numbering in the tens of thousands. Fujitsu Limited has scaled a dedicated compact kiosk line specifically for this format, reporting unit shipments up 28% yearly, faster than its full-size grocery kiosk line over the past two years. This format also opens quick-service restaurant and pharmacy channels previously underserved by bulkier hardware designs. Vendors without a dedicated compact line are ceding this fast-growing channel to competitors better suited to smaller store footprints.
Market Impact: compact kiosk unit shipments up 28% yearly overall

Retrofit Vision Camera Upgrade Kit Program

Vendors selling retrofit vision camera kits that upgrade existing scan-only kiosks without full hardware replacement capture revenue from the large installed base of older units still lacking loss prevention capability. Zebra Technologies markets a modular retrofit kit compatible with several competitors' existing kiosk hardware, letting retailers add detection capability at roughly 40% of full replacement cost while extending existing hardware service life. This approach converts a slow, capital-gated replacement cycle into an ongoing upgrade revenue stream. Retailers value this path since it avoids the multi-year capital planning cycle that full kiosk replacement typically requires.
Market Impact: retrofit kits cost roughly 40% less than replacement

Who Controls the Margin Pool

Five vendors control fifty-two percent of global self-checkout revenue on a shipment and installed-base basis, with NCR Voyix and Diebold Nixdorf holding the two largest positions. The gap between the leader and the nearest mid-tier challenger has narrowed as vision software vendors enter from the technology side. That narrowing reflects how quickly detection accuracy has become the deciding factor in rollout contracts.
Current competitive activity centers on loss prevention software accuracy and subscription bundling rather than hardware price, since retailers treat the software relationship as more consequential than the one-time kiosk purchase. Several vendors have restructured commercial teams around software renewal sales over the past two years. Vendors slow to reorganize report weaker contract renewal rates than those that adapted early.

Emerging pressure comes from computer vision specialists entering directly from the technology sector, bypassing kiosk hardware altogether by selling camera retrofit kits compatible with existing installed hardware. Rankings among the second tier remain fluid as these technology-first entrants win contracts traditional vendors assumed were locked in. Traditional vendors are responding by acquiring smaller vision specialists rather than building comparable capability internally. Expect more such deals soon.
self-checkout-system-market-company-positioning-matrix-1788415680755

Competitive Moat and Risk Dimensions

NCR VOYIX

Moat: Installed Base Depth

NCR Voyix holds the deepest installed kiosk base across United States grocery, built over more than two decades of continuous retail hardware relationships. That footprint gives the company a natural retrofit and software upsell channel that newer entrants without existing hardware in stores cannot easily replicate.
NCR VOYIX

Risk: Legacy Hardware Drag

A large share of the installed base runs older kiosk generations that lack the camera mounting points modern vision systems require, forcing costly retrofit work. Competitors selling newer integrated hardware can undercut on total cost of ownership for retailers planning a full refresh. Retailers increasingly favor the refresh path.
DIEBOLD NIXDORF

Moat: European Grocery Relationships

Diebold Nixdorf's decades-long relationships with major European grocery chains give it a qualification advantage that newer vision-first entrants lack in that market. Its existing service and maintenance network across the region also lowers the switching cost retailers weigh against newer, unproven suppliers. That trust took decades to build.
DIEBOLD NIXDORF

Risk: Balance Sheet Constraints

The company's history of financial restructuring limits how aggressively it can invest in vision technology research relative to better-capitalized competitors entering from the technology sector. Slower R&D spending risks ceding the accuracy race to rivals with deeper investment capacity. Investors have pushed management to prioritize near-term margin over research spending in recent years.

Players Tracked

Prominent Players

NCR Voyix
Diebold Nixdorf
Toshiba Global Commerce Solutions
Fujitsu Limited
Zebra Technologies

Other Key Players

Pan-Oston
ITAB Shop Concept
Datalogic
Honeywell International
Gilbarco Veeder-Root
Everseen
AiFi
Grabango
Simbe Robotics
Focal Systems
Posiflex Technology
Ingenico Group
Verifone
StrongPoint
Displaydata

Recent Developments

FEBRUARY 2026

NCR Voyix Acquires Computer Vision Loss Prevention Startup

NCR Voyix acquired a smaller computer vision loss prevention startup based in Austin, Texas, adding proprietary detection algorithms to its existing kiosk hardware platform. The deal closed for an undisclosed sum and folds the acquired detection technology directly into NCR Voyix's next-generation kiosk software roadmap.
Signal: Confirms detection accuracy, not hardware design, is now the primary competitive battleground across the industry today.
OCTOBER 2025

Diebold Nixdorf Signs Multi-Year Contract With European Grocery Chain

Diebold Nixdorf signed a multi-year supply and software agreement with a major German grocery chain to deploy vision-enabled kiosks across several hundred store locations nationwide. The agreement is a supply commitment rather than an equity stake or joint venture, and locks in volume through the chain's next store refresh cycle.
Signal: Shows European grocery chains now bundle vision software into hardware refresh decisions as standard practice broadly.
JUNE 2025

Toshiba Global Commerce Launches Compact Convenience Store Kiosk

Toshiba Global Commerce Solutions launched a compact self-checkout kiosk designed specifically for convenience store footprints across Japan and South Korea, targeting the region's dense retail networks. The launch is an organic product expansion rather than an acquisition or partnership, aimed squarely at East Asia's fastest-growing deployment segment.
Signal: Signals hardware vendors are tailoring form factor to regional store formats rather than shipping one universal design.

Camera and Display Component Exposure

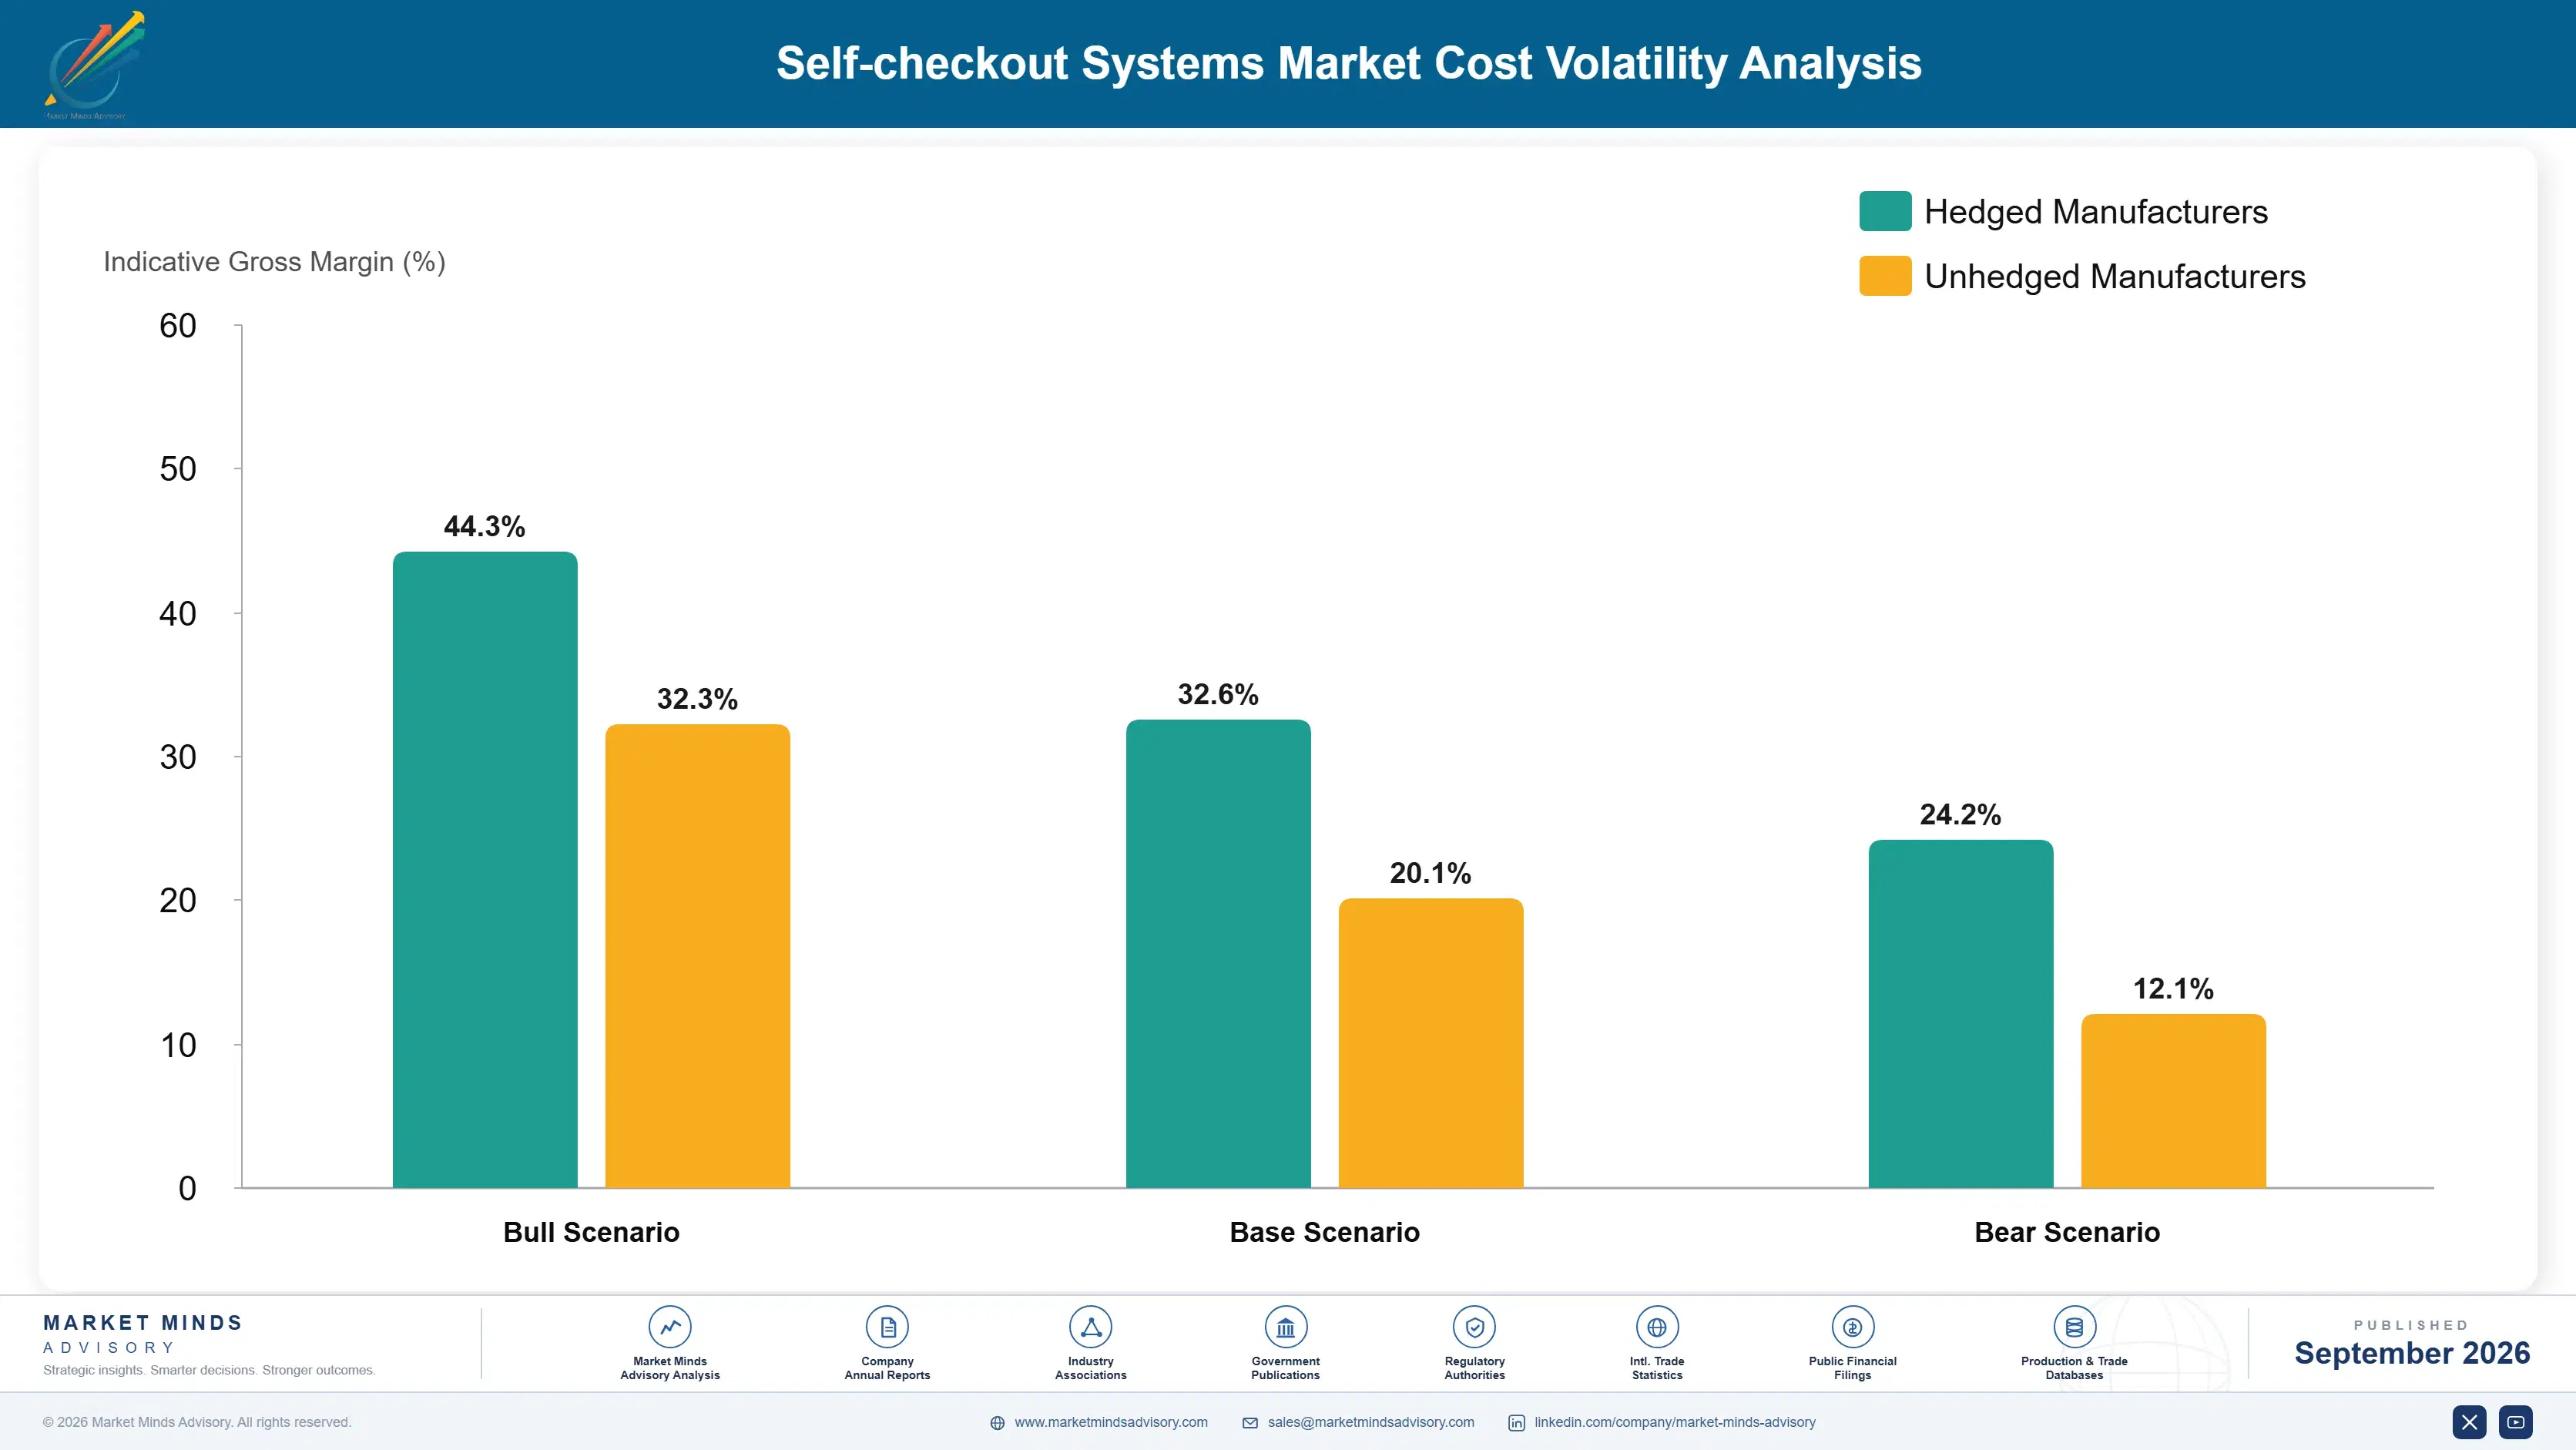
Camera modules and touchscreen display panels together account for roughly thirty-six percent of a self-checkout kiosk's cost of goods sold, with the remainder split between payment hardware, enclosure materials, and assembly labor. Most camera sensors and display panels originate from South Korean and Taiwanese suppliers, concentrating meaningful upstream cost exposure outside vendor control. This dependency has narrowed only slightly over the past several years.
Display panel pricing swung more than fifteen percent within a single year during the 2022 to 2023 period, driven by a semiconductor supply disruption that the IEA's 2023 electronics supply chain review attributed to constrained fabrication capacity following pandemic-era demand shifts. Several kiosk vendors delayed new orders temporarily rather than absorbing the full price increase, pushing some retail rollout timelines back by a full fiscal quarter.

Smaller vendors without long-term panel purchase agreements face sharper margin compression during price spikes than the top five, who typically lock multi-year pricing with upstream display and camera partners. This gap widens further for vendors concentrated in a single sourcing region, since they lack the flexibility larger competitors use to shift orders toward whichever regional supplier offers the better terms that quarter.
self-checkout-system-market-cost-volatility-analysis-1788415680951

Multi-Year Display Panel Purchase Agreements

Leading vendors now lock display panel and camera module pricing into multi-year agreements with South Korean and Taiwanese partners, trading some upside flexibility for predictable input costs. This shields margin during commodity spikes. Vendors without such agreements have historically absorbed a larger share of spot-price volatility directly into quarterly margin figures. This gap widens further during extended volatility.

Dual-Region Component Sourcing Strategy

Vendors qualifying camera and display components from both East Asian and domestic sources can shift orders toward whichever region offers better terms in a given quarter, reducing exposure. Smaller vendors rarely qualify a second source. Building that second qualified source takes significant capital and lead time, keeping this advantage concentrated among the largest vendors for now.

Standardized Component Platform Across Kiosk Lines

Several vendors have standardized camera and display components across multiple kiosk product lines, letting them negotiate volume pricing that smaller, more fragmented product portfolios cannot match with the same suppliers. Adoption remains uneven across the vendor base. Vendors that consolidated onto fewer component families report meaningfully better purchasing leverage than those still running fragmented legacy product lines.

Portfolio Architecture for Margin Defence

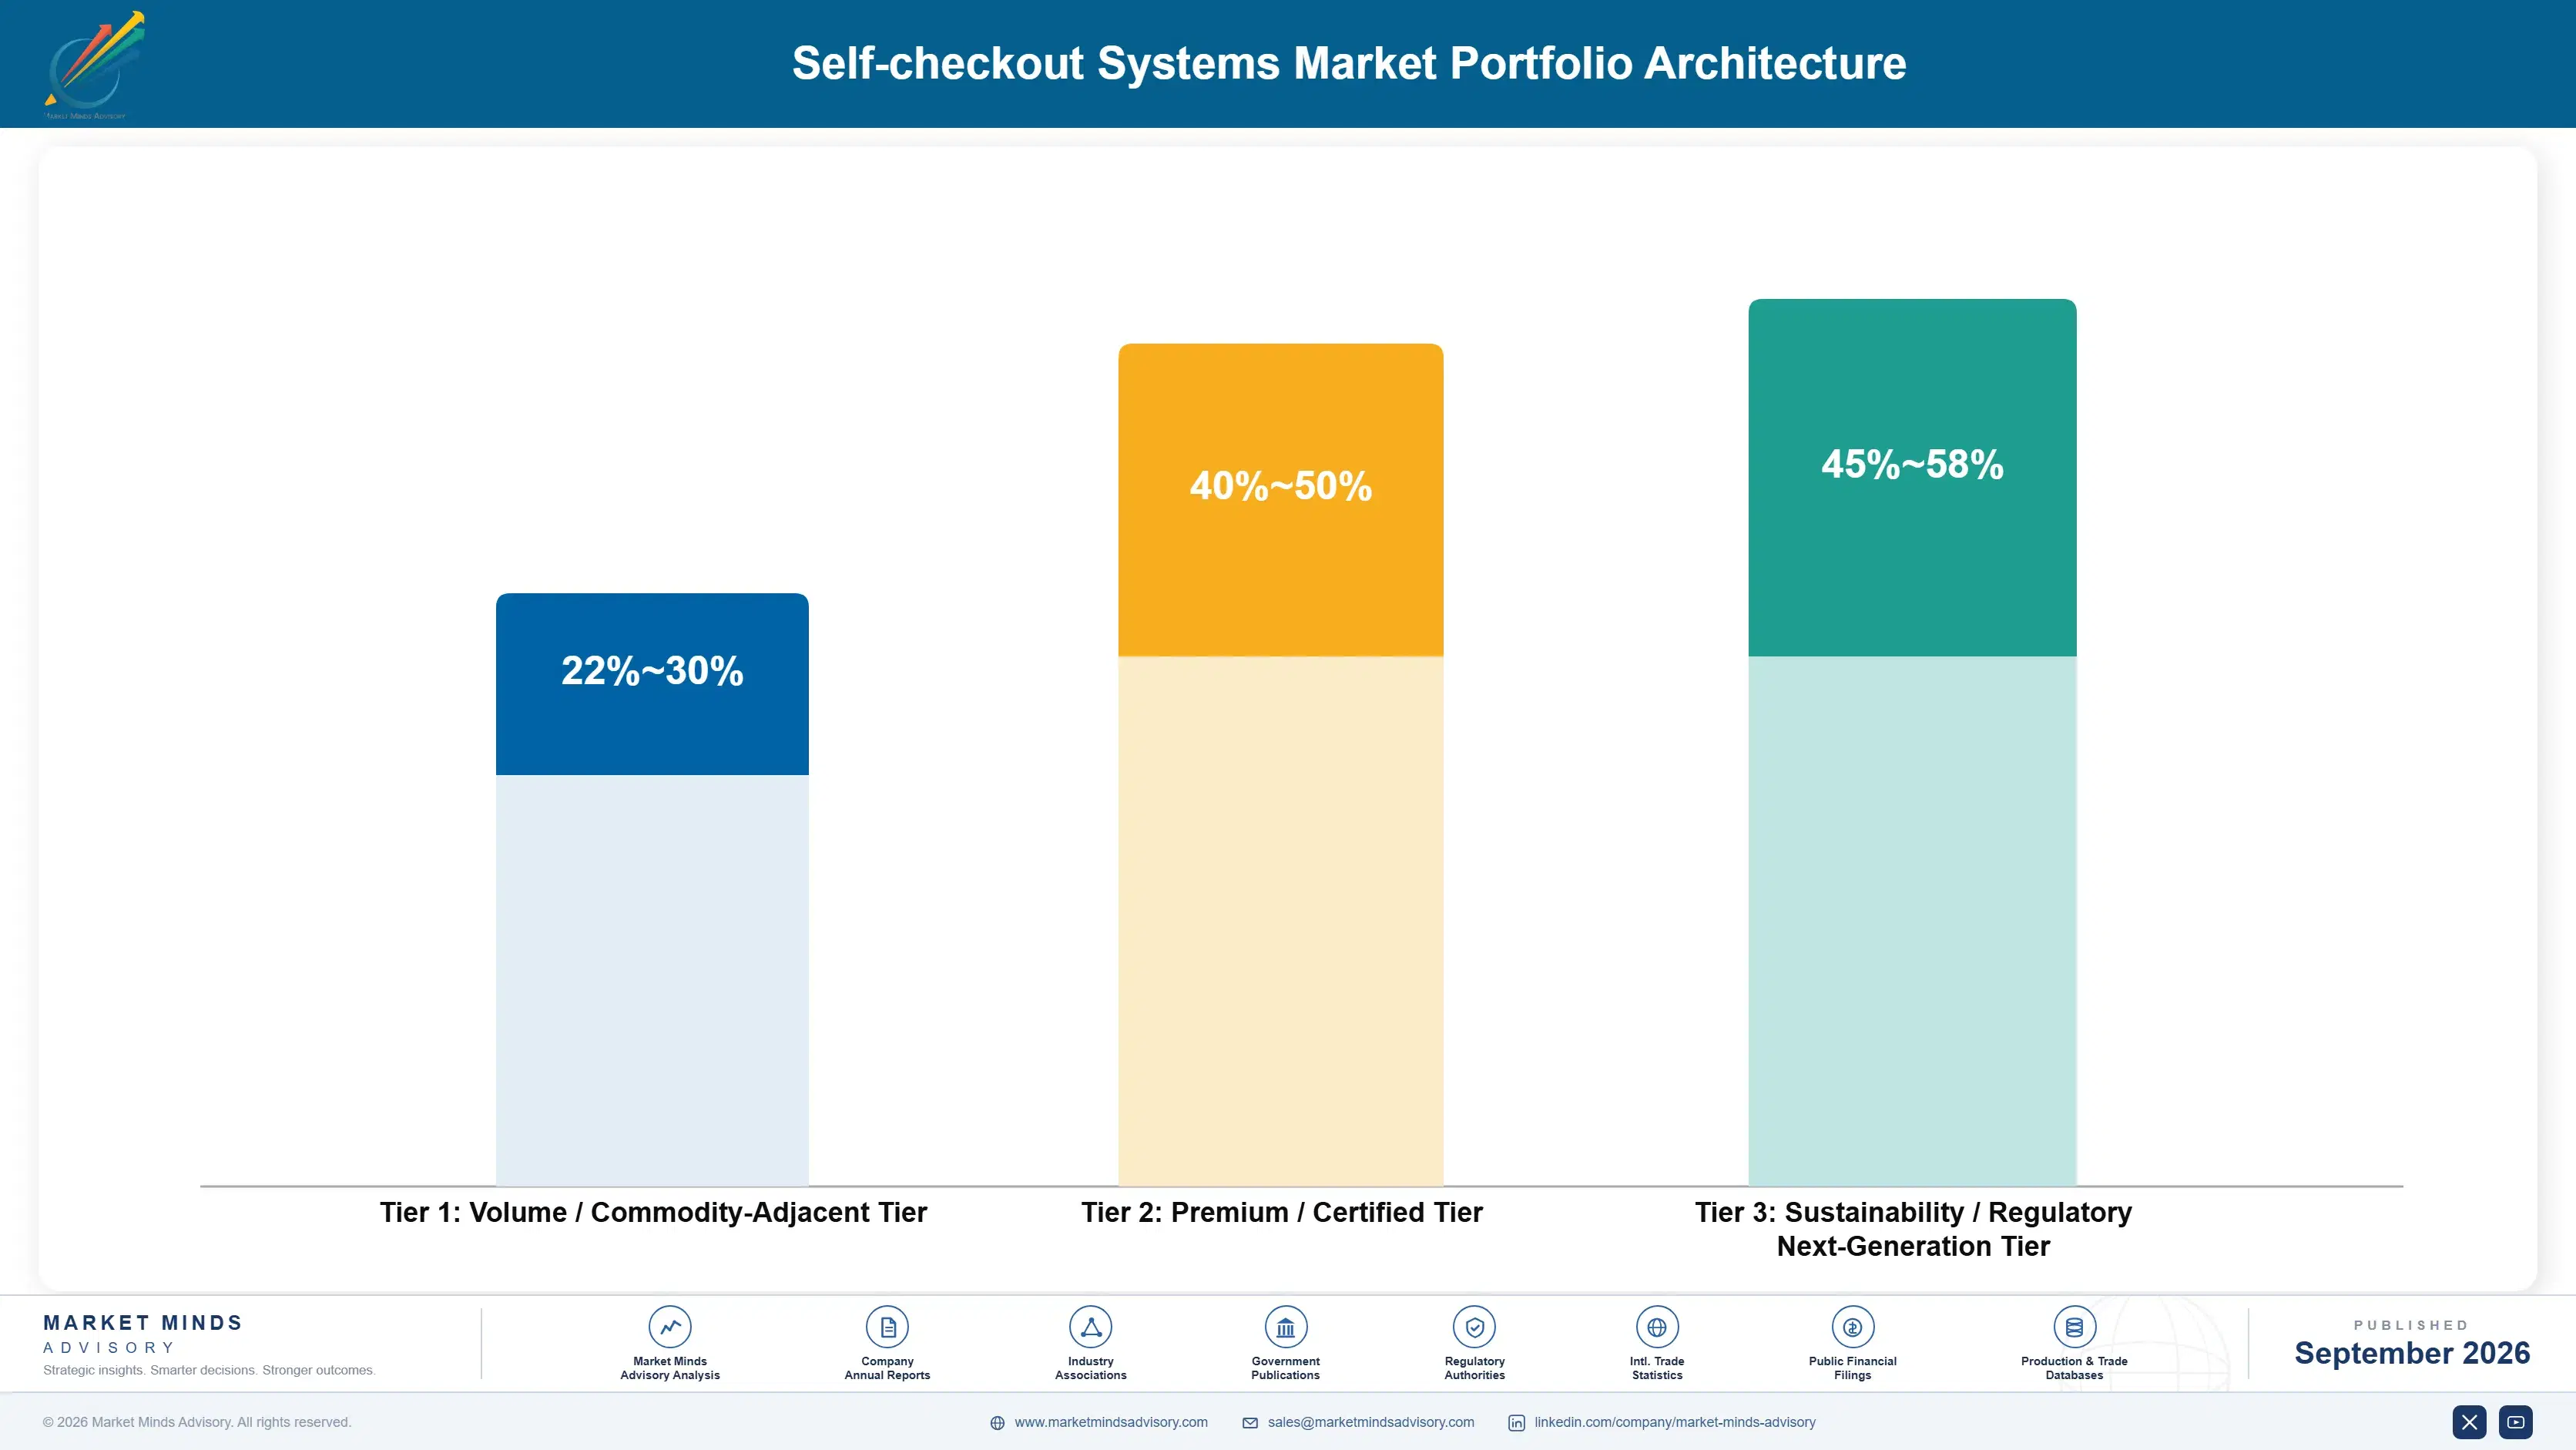
Self-checkout margin economics split across three tiers, with commodity full-size kiosks competing on volume pricing while vision-enabled and next-generation frictionless systems command materially wider gross margin. Volume kiosks still generate the bulk of unit shipments even as revenue concentrates increasingly in the higher tiers. That gap has widened as vision requirements tighten, making unqualified hardware a poor allocation for vendors with a credible upgrade path.
The tension between volume and premium is sharpest in grocery, where a vendor's average contract value can differ by a factor of two between a scan-only kiosk and a fully vision-enabled equivalent serving the same store. Vendors chasing volume alone cede the margin pool to competitors willing to invest in detection accuracy. That gap has widened over the past several years as retailers weigh accuracy claims more heavily than raw scanning speed.

High-value margin pools concentrate in vision-enabled loss prevention systems and emerging frictionless checkout formats, both requiring upfront software investment that smaller vendors frequently cannot justify against uncertain contract-win probability. This concentration is expected to deepen as vision detection accuracy keeps improving. Vendors positioned early in both capture disproportionate revenue growth relative to unit volume growth across the decade ahead.

Volume / Commodity-Adjacent Tier

Standard scan-only kiosks sold on price into general merchandise and grocery formats, competing primarily on manufacturing scale rather than detection capability. Price pressure remains steady across this tier. Chinese hardware manufacturers apply particular pressure here.
Gross Margin: 22-30%

Premium / Certified Tier

Vision-enabled kiosks with loss prevention software sold at a durable premium, defended by detection accuracy and switching costs competitors cannot easily replicate quickly. Established vendors with proven accuracy data hold this ground firmly against newer entrants.
Gross Margin: 40-50%

Sustainability / Regulatory / Next-Generation Tier

Emerging frictionless checkout formats using computer vision alone without traditional scanning, carrying the widest margins as early scaled volume remains constrained today. Scale should follow as retailer confidence in vision-only checkout accuracy grows over the coming years.
Gross Margin: 45-58%
self-checkout-system-market-portfolio-architecture-1788415681468

High-value Sub-segments and Strategic Watch-out

High-value high-growth segment

Computer vision loss prevention systems sit at the intersection of premium margin and the fastest unit volume growth, as retailers standardize around vision-enabled kiosks rather than legacy scan-only designs across new store rollouts. This is the clearest growth vector across the entire forecast decade. Adoption keeps accelerating.
Gross Margin: 40-50%

High-value moderate-growth segment

Detection accuracy performance guarantee contracts carry strong recurring margins tied to retailer confidence in measurable shrinkage reduction, though adoption grows more gradually as vendors build the track record needed to offer credible guarantees. Vendors treat this as a durable, if slower-building, opportunity. Vendors treat this as durable revenue worth pursuing.
Gross Margin: 35-45%

Volume core segment

Standard full-size grocery kiosks remain the largest unit volume base across established retail markets globally, sustaining steady if unremarkable margins as the category matures and price competition among established vendors intensifies nationwide. Scale and distribution reach determine share here overall. Volume here funds the fixed cost base broadly.
Gross Margin: 22-30%

Strategic watch-out segment

Technology-first vision specialists entering directly from the software sector threaten to disintermediate established hardware vendors over the coming decade, particularly where retailers favor accuracy-proven retrofit kits over full hardware replacement from incumbents. This shift bears close monitoring ahead. Established players are responding through acquisition. Timing matters here.
Gross Margin: n/a

Contracts Behave Like Annuities

A self-checkout software contract functions like an annuity rather than a single transaction, since retailers rarely switch loss prevention vendors once a system trains on a store's specific shrinkage patterns and staff workflows. A single grocery chain contract can generate recurring subscription revenue across an entire hardware refresh cycle lasting seven to nine years, turning one initial deployment into a durable, multi-year revenue stream for the winning vendor.
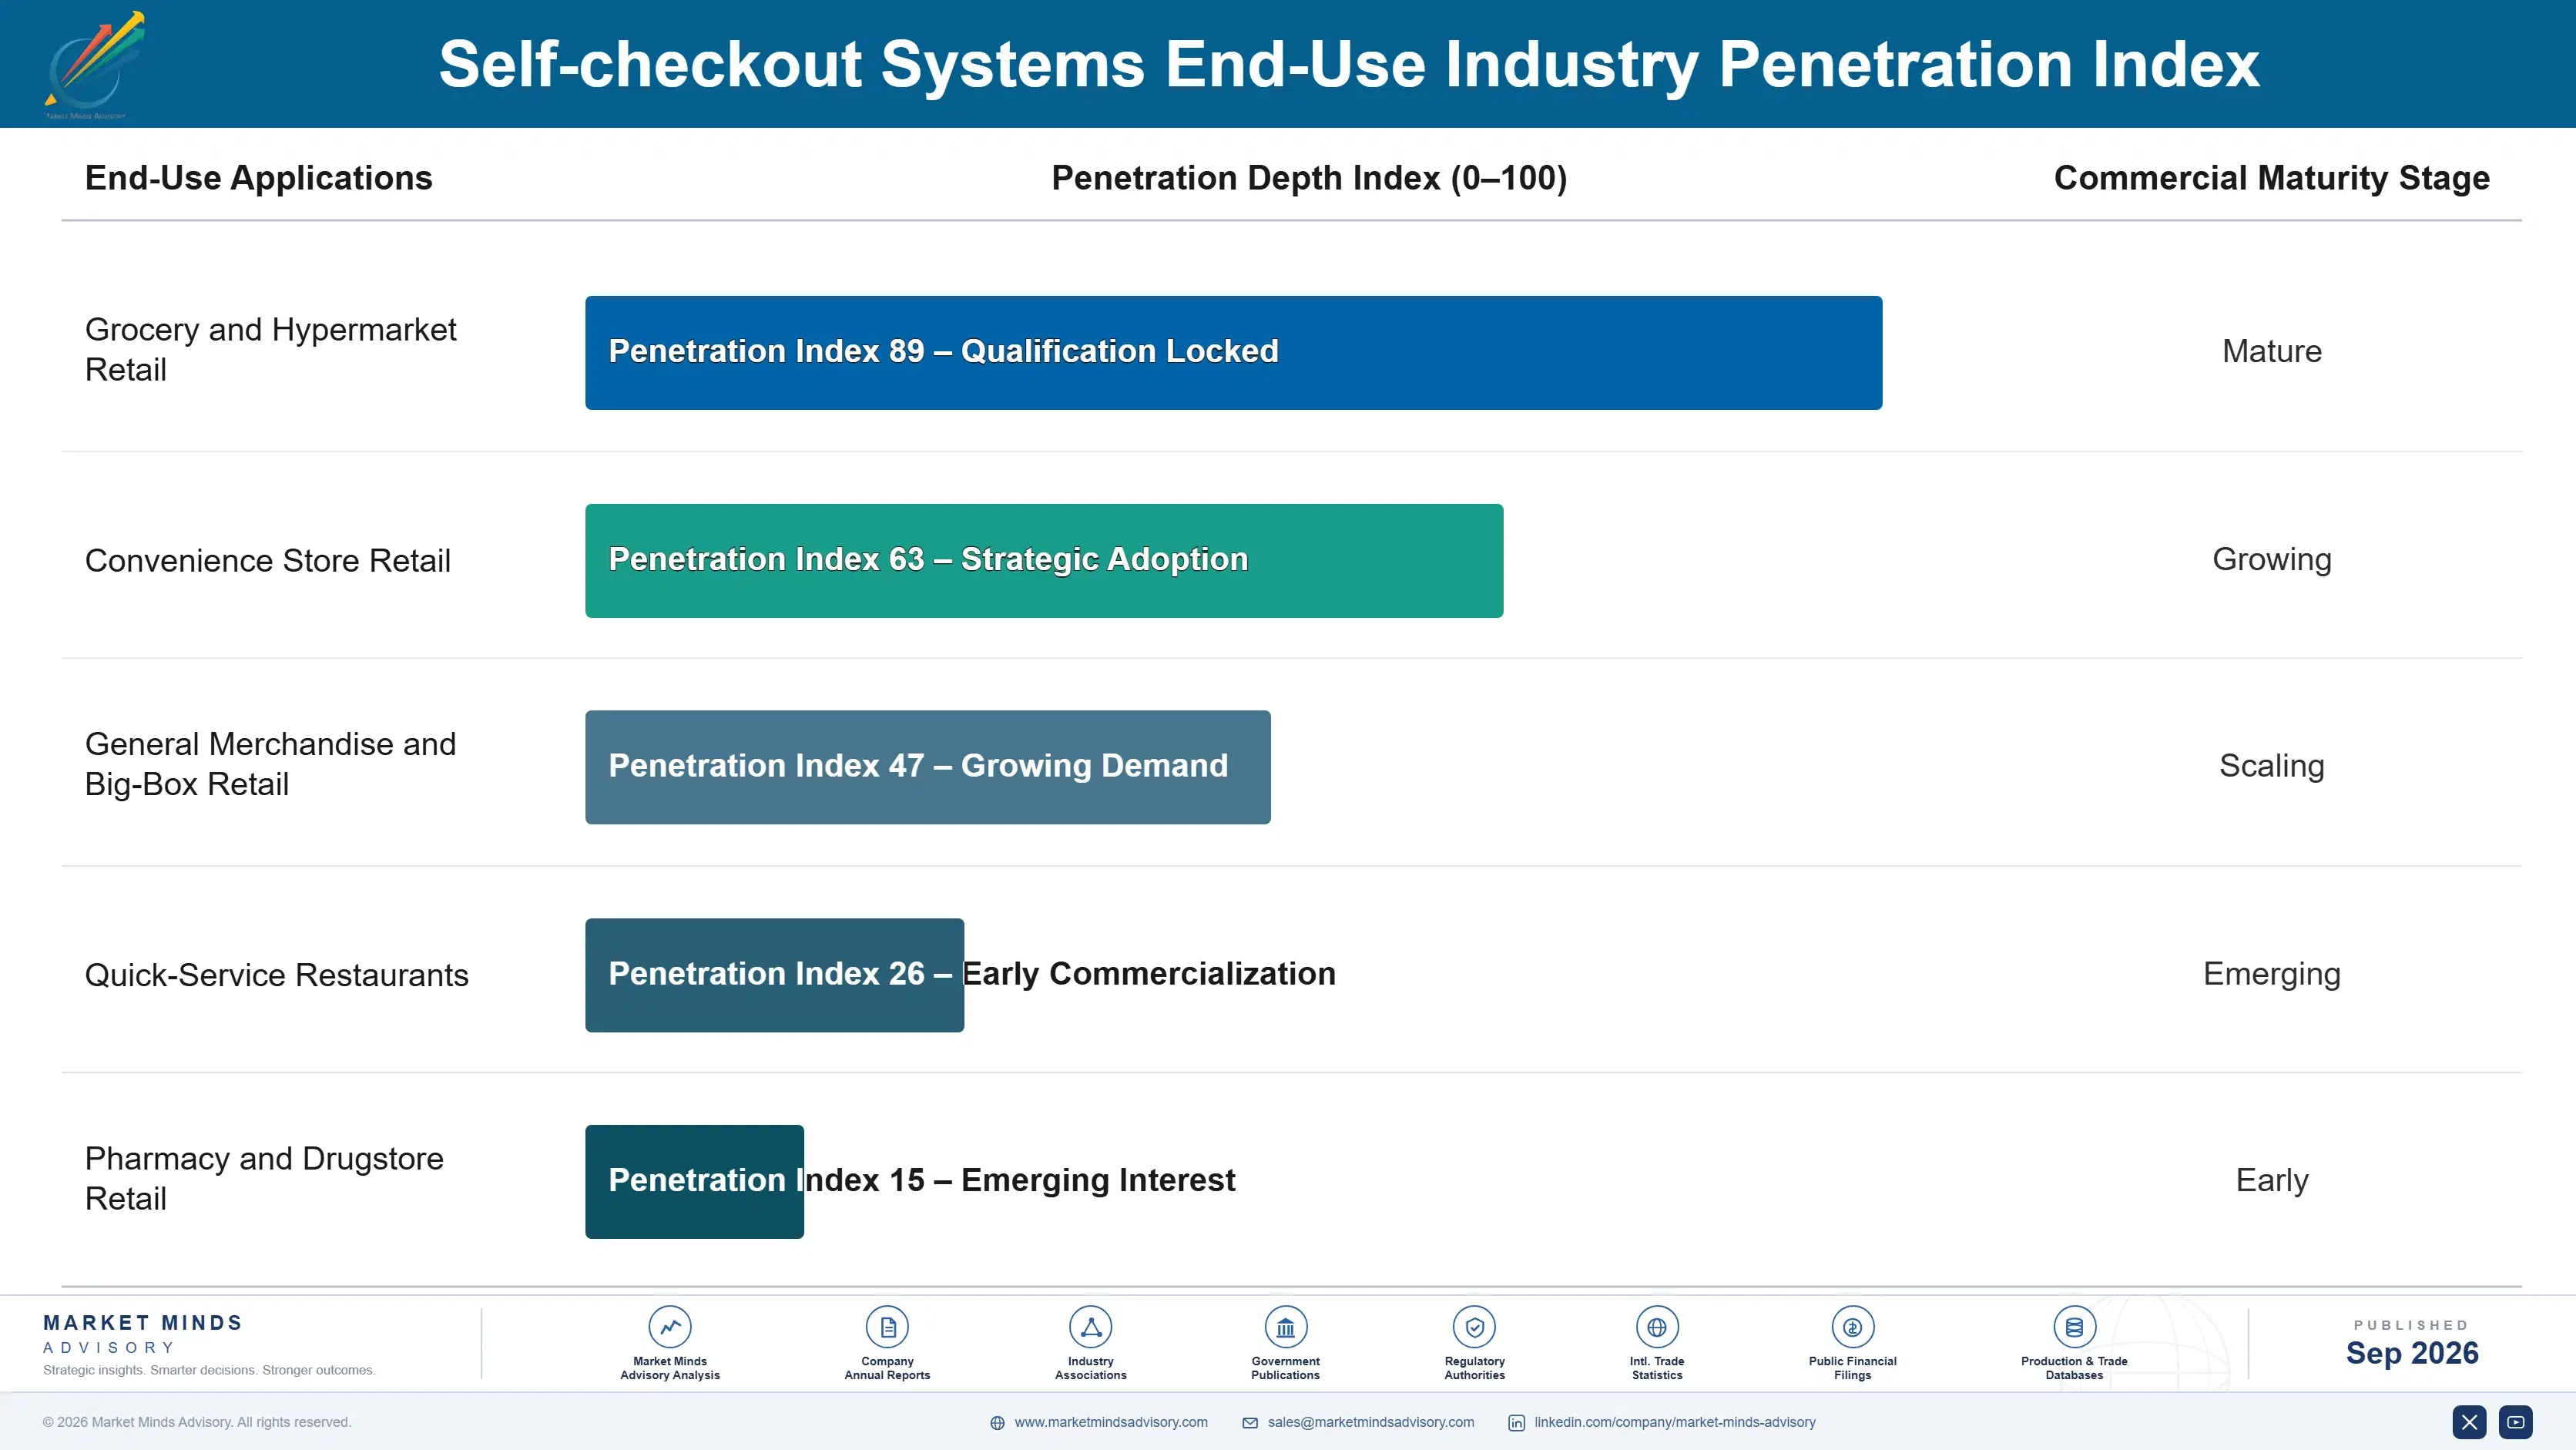
Adoption depth varies sharply by end-use vertical. Grocery chains embed loss prevention relationships into multi-year contracts tied to measurable shrinkage reduction, while convenience stores treat vision upgrades as a more standardized, chain-wide rollout decision. Quick-service restaurants sit at an earlier adoption stage, favoring simpler scan-only kiosks for now. That spread explains why unit volume and margin diverge across these three verticals.

Buyer profiles are shifting generationally as well. A newer cohort of retail operations executives, trained on data-driven loss prevention from early in their careers, increasingly defaults to vision-enabled systems over legacy scan-only kiosks. Older store operations teams in established grocery accounts still favor familiar hardware, though retirement and workforce turnover are steadily closing that generational gap across the forecast decade.
self-checkout-system-market-end-use-penetration-index-1788415682074

Where Vendors Should Focus

These are among the four positions where our research anticipates prominent divergence between winners and laggards over the coming forecast period. Each is grounded in the demand model, the regulatory perimeter, and the announced capacity pipeline.
01 / VISION SOFTWARE INVESTMENT PRIORITY

Build detection accuracy before retailers standardize requirements

Computer vision loss prevention already commands the widest margins in the category, and that gap is widening as retailers increasingly treat detection accuracy as essential to any new kiosk order rather than a discretionary premium feature layered on top. Vendors without proven vision capability risk exclusion from the fastest-growing multi-store rollout bids within the next several years, not just margin erosion, since procurement contracts increasingly name detection accuracy as a scoring criterion. Building that capability now, ahead of full market consolidation, converts a technology investment into a lasting contract advantage.
02 / SUBSCRIPTION MODEL TRANSITION STRATEGY

Shift revenue mix toward recurring software before margins erode further

Recurring loss prevention subscriptions increasingly determine vendor profitability, more so than one-time kiosk hardware sales alone in most competitive procurement bids across the category and its adjacent applications today. Vendors that demonstrate proven subscription attach rates capture premium pricing that hardware-only competitors cannot match, since retailers increasingly value ongoing accuracy improvement over marginal upfront price differences when comparing options. This advantage compounds as software attach rates continue expanding across the broader category and its many retail deployment formats worldwide today.
03 / COMPACT FORMAT DEVELOPMENT STRATEGY

Develop convenience store hardware before East Asian rollouts complete

East Asian convenience store networks are standardizing self-checkout faster than any other retail format tracked, rewarding vendors with proven compact kiosk designs suited to small-format stores over those offering only full-size grocery hardware. Vendors that establish compact format credibility now capture rollout volume that competitors without a dedicated small-format line simply cannot bid on, since store footprint constraints rule out bulkier designs entirely. Waiting until these rollouts complete will make this positioning meaningfully harder and more costly to establish afterward.
04 / PRIVACY COMPLIANCE POSITIONING

Redesign vision systems around anonymized detection before regulation tightens

Biometric privacy regulation across Europe and parts of the United States threatens vendors still relying on facial recognition rather than anonymized item-level detection, risking exclusion from regulated markets entirely. Vendors that redesign detection logic around anonymized data now retain access to privacy-sensitive markets rather than ceding them entirely to competitors that solved this question earlier in the product cycle. Waiting until regulation tightens further across additional jurisdictions will make this redesign meaningfully harder, slower, and considerably more costly to complete.

Engagement Snapshot From the Field

A live engagement with an industry participant carrying material or product regulatory and market exposure ahead of a defining policy shift, showing how our research translates into a defensible multi-year portfolio strategy.
MARKET MINDS ADVISORY · CLIENT ENGAGEMENT SUMMARY
Self-checkout Systems Producer Strategic Portfolio Review and Transition Roadmap 2026·Investment Scenario on Self-checkout Systems Exposure Evaluation 2025-26
CLIENT PROFILE
The client is a national grocery chain operating several hundred stores across the United States, with annual self-checkout category revenue in the tens of millions of dollars (client-reported, unverified by MMA). The chain had historically deployed scan-only kiosks without a formal computer vision loss prevention strategy. Rising shrinkage rates across its store network prompted leadership to reconsider its checkout technology roadmap.
STRATEGIC CHALLENGE
Rising shrinkage rates and growing customer complaints about mis-scans forced the chain to reconsider its self-checkout strategy across its entire store network within a compressed budget cycle. Management needed to decide whether to deploy vision loss prevention chain-wide, pilot it in a subset of stores first, or maintain existing scan-only kiosks despite the ongoing shrinkage exposure.
MMA APPROACH
MMA conducted structured interviews with the chain's loss prevention and store operations leadership alongside a benchmarking exercise against three peer grocery chains' vision system deployments and vendor relationships across comparable store networks. The engagement combined primary qualitative interviews with MMA's proprietary self-checkout market dataset to assess vendor accuracy claims, deployment costs, and shrinkage reduction under each rollout option.
KEY FINDINGS
  1. Vision-enabled stores reduced shrinkage by roughly twenty-two percent compared to scan-only stores over the trailing eighteen-month period reviewed (client-reported, unverified by MMA).
  2. Peer grocery chains that piloted vision systems before full rollout reported fewer implementation issues than those deploying chain-wide immediately. Vendor support quality during rollout mattered as much as raw detection accuracy claims.
  3. Full chain-wide deployment would have required capital investment the engagement estimated at nine months beyond the chain's current budget cycle. Budget timing constraints made a phased approach the more practical path forward.
  4. Chains that piloted vision systems in highest-shrinkage stores first captured most of the reduction benefit at a fraction of full rollout cost.
CLIENT PROFILE
The client is a national grocery chain operating several hundred stores across the United States, with annual self-checkout category revenue in the tens of millions of dollars (client-reported, unverified by MMA). The chain had historically deployed scan-only kiosks without a formal computer vision loss prevention strategy. Rising shrinkage rates across its store network prompted leadership to reconsider its checkout technology roadmap.
STRATEGIC CHALLENGE
Rising shrinkage rates and growing customer complaints about mis-scans forced the chain to reconsider its self-checkout strategy across its entire store network within a compressed budget cycle. Management needed to decide whether to deploy vision loss prevention chain-wide, pilot it in a subset of stores first, or maintain existing scan-only kiosks despite the ongoing shrinkage exposure.
MMA APPROACH
MMA conducted structured interviews with the chain's loss prevention and store operations leadership alongside a benchmarking exercise against three peer grocery chains' vision system deployments and vendor relationships across comparable store networks. The engagement combined primary qualitative interviews with MMA's proprietary self-checkout market dataset to assess vendor accuracy claims, deployment costs, and shrinkage reduction under each rollout option.
KEY FINDINGS
  1. Vision-enabled stores reduced shrinkage by roughly twenty-two percent compared to scan-only stores over the trailing eighteen-month period reviewed (client-reported, unverified by MMA).
  2. Peer grocery chains that piloted vision systems before full rollout reported fewer implementation issues than those deploying chain-wide immediately. Vendor support quality during rollout mattered as much as raw detection accuracy claims.
  3. Full chain-wide deployment would have required capital investment the engagement estimated at nine months beyond the chain's current budget cycle. Budget timing constraints made a phased approach the more practical path forward.
  4. Chains that piloted vision systems in highest-shrinkage stores first captured most of the reduction benefit at a fraction of full rollout cost.
RECOMMENDED STRATEGY
Phase 1: Phase 1 (Months 1-3): Deploy vision loss prevention in the twenty highest-shrinkage stores identified through historical loss and cost review data. Phase 2: Phase 2 (Months 4-9): Evaluate pilot performance carefully and expand deployment to additional stores based on demonstrated shrinkage reduction outcomes achieved. Phase 3: Phase 3 (Months 10-16): Negotiate a chain-wide vendor agreement covering full store network deployment over the following fiscal budget cycle.
OUTCOME
Within sixteen months of implementation, the chain reported a reduction in overall shrinkage tied to vision system deployment of approximately nineteen percent (client-reported, unverified by MMA). The phased approach demonstrated sufficient shrinkage reduction to justify expanded deployment, and the chain has since committed to a fully vision-enabled checkout strategy across its entire store network.

Frequently Asked Questions

Foundational context covering the market sizes, CAGR, scope, country, region and competition that inform every finding below. This section is provided to cover basics and most often pre-purchase conversations, answered from the MMA Primary Research Dataset.

What is the current size of the Self-checkout Systems Market?

The Self-checkout Systems Market reached an estimated 8.4 billion dollars in 2025. Growth is driven by rising grocery labor costs and expanding computer vision loss prevention adoption worldwide.

How large will the Self-checkout Systems Market be by 2036?

MMA projects the market will reach approximately 27.0 billion dollars by 2036 under the base case scenario. This represents nearly triple the 2026 opening value over the ten year forecast window.

What is the CAGR for the Self-checkout Systems Market 2026 to 2036?

The base case compound annual growth rate is 11.2 percent across the forecast period. Bull and bear scenarios range from 12.5 percent to 9.9 percent depending on vision adoption pace.

Which segment is growing fastest?

Computer Vision Loss Prevention Systems is the fastest growing segment, expanding at 17.8 percent annually. That is roughly 1.59 times the overall market growth rate through 2036.

Who are the major companies in the Self-checkout Systems Market?

Leading participants include NCR Voyix, Diebold Nixdorf, Toshiba Global Commerce Solutions, Fujitsu Limited, and Zebra Technologies. Together these five companies hold a combined production share estimated near 52 percent.

Which country is growing fastest?

China is the fastest growing country market, supported by its expanding hypermarket chains and rising urban labor costs pushing retailers toward automation. Demand is further reinforced by growing e-commerce-linked grocery retail infrastructure nationwide.

Report Segmentation Architecture

The full report scope spans multiple orthogonal segmentation dimensions, with cross-tabulated demand data provided for each dimension pair. Coverage extends further to regional breakdowns, trend trajectories, and the competitive detail needed to support segment-level decision-making.

By Primary Market Dimension

  • Full-Size Grocery Self-Checkout Kiosks
  • Compact Convenience Store Kiosks
  • Computer Vision Loss Prevention Systems
  • Handheld Scan-and-Verify Devices
  • Frictionless Checkout Systems
  • Self-Service Payment Terminals

By End-Use Industry

  • Grocery and Hypermarket Retail
  • Convenience Store Retail
  • General Merchandise and Big-Box Retail
  • Quick-Service Restaurants
  • Pharmacy and Drugstore Retail

By Commercial Dimension

  • Direct Retailer Hardware Sales
  • Loss Prevention Software Subscriptions
  • Retrofit Upgrade Kit Sales
  • Managed Service and Maintenance Contracts

By Region

  • North America
  • Western Europe
  • East Asia
  • South Asia and Pacific
  • Latin America
  • Middle East and Africa
  • Eastern Europe

Scope, Methodology, and Coverage

Every figure in this report is reproducible from documented input assumptions. The scope below maps the historical period, the forecast horizon, the segmentation dimensions, and the countries covered, alongside the underlying primary and qualitative methodology.
Historical Period
2020 to 2025
Forecast Period
2026 to 2036
Base Year
2025 (USD billions; MMA Primary Research Dataset, September 2026)
Market Definition
This market covers self-checkout kiosk hardware, scanning software, and computer vision loss prevention systems deployed in grocery, convenience, and general merchandise retail settings. It excludes mobile scan-and-go smartphone applications and standard staffed point-of-sale terminals.
Quantitative Units
USD billions (current prices); unit shipment volume where noted
Segmentation Dimensions
By Primary Market Dimension; By End-Use Industry; By Commercial Dimension; By Region
Regions Covered
North America, Western Europe, East Asia, South Asia and Pacific, Latin America, Middle East and Africa, Eastern Europe
Countries Covered
USA, China, Germany, France, UK, Japan, South Korea, India, Australia, Canada, Brazil, Mexico, Poland, Czech Republic, Hungary, Romania, Slovakia, UAE, Saudi Arabia, South Africa, Egypt, Turkey, Netherlands, Italy, Spain, Sweden, Switzerland, Argentina, Colombia, Vietnam, and additional markets relevant to this sector
Key Companies Profiled
NCR Voyix, Diebold Nixdorf, Toshiba Global Commerce Solutions, Fujitsu Limited, Zebra Technologies, Pan-Oston, ITAB Shop Concept, Datalogic, Honeywell International, Gilbarco Veeder-Root, Everseen, AiFi, Grabango, Simbe Robotics, Focal Systems, Posiflex Technology, Ingenico Group, Verifone, StrongPoint, Displaydata
Quantitative Methodology
Primary survey, n=3,800 respondents, Q4 2025, six countries; demand-side model with trade association cross-validation
Qualitative Methodology
47 expert interviews, Q4 2025; applied to validate demand model assumptions, identify emerging dynamics, and assess competitive positioning
Report Format
PDF and XLSX data workbook (Word format preview document)
Publisher
Market Minds Advisory
Report Code
MMA-2026-TEC-173
Published
September 2026
Contact
sales@marketmindsadvisory.com | www.marketmindsadvisory.com

Purchase the full Self-checkout Systems Market Report (2026 to 2036).

This report provides comprehensive analysis of the Self-checkout Systems Market, covering size, forecasts, segmentation, and regional dynamics through 2036. It examines competitive positioning among leading hardware and software vendors, input cost exposure across the camera and display panel supply chain, and portfolio economics across volume, premium, and next-generation tiers. The analysis draws on primary survey data covering 3,800 respondents and 47 expert interviews conducted in the fourth quarter of 2025. Buyers receive a complete strategic view suitable for investment planning, procurement strategy, and competitive benchmarking decisions across the retail technology value chain.
Full ten-year market and segment forecasts through 2036
Regional analysis across all seven MMA-tracked geographies
Competitive benchmarking of top five and fifteen additional players
Camera and display panel input cost exposure analysis
Revenue lever framework tied to quantified commercial impact
Anonymised grocery chain case study with strategy phasing

Built For The People Who Decide

From boardroom strategy to bench-side execution, this report is read cover-to-cover by leaders shaping the next decade of their industry, turning demand scenarios, market dynamics and valuation benchmarks into decisions.
CXOs/ Presidents/ VPs/ Managers
M&A and Corporate Development
Strategy Teams and R&D Heads
Procurement and Product Directors
Regulatory and Compliance Leaders
Investor Relations and Equity Analysts