

Market Minds Advisory
Seismic Services Market

Seismic Services Market: Seismic Services Market: Ocean Bottom Technology and Deepwater Exploration

Ocean bottom node technology is rapidly reshaping deepwater exploration investment priorities as operators weigh premium 4D reservoir monitoring costs against legacy towed-streamer survey economics across contested, complex-geology basins worldwide today.

Lead Analyst

Published

September 2026

Make Smarter Decisions with Customized Research Insights

Request a free sample report and evaluate market opportunities, growth trends, and competitive dynamics relevant to your business needs.

2025 MARKET VALUE$9.5BMarket Size 2025
2036 FORECAST VALUE$17.3BBase Case , 2026 to 2036
CAGR 2026 TO 20365.6 %Bull 6.8% / Bear 4.4%
INCREMENTAL OPPORTUNITY$7.3BNet 10- year value creation
EXPANSION MULTIPLE1.72x2036 value over 2026 base
Strategic Levers
M&A Pipeline
Regional Outlook
Country Rankings
Competitive Intelligence
Segmental Deep-dive
Call-Us : 91 93563 13602

Executive Snapshot and Market Trajectory.

Seismic service providers are capturing accelerating demand from expanding ocean bottom seismic technology adoption and rising deepwater exploration investment simultaneously, as operators demand verified data quality over unverified vendor claims, reshaping provider pricing strategy considerably across nearly every major national exploration and operator procurement contract channel worldwide.
Deepwater exploration budgets and ocean bottom node adoption are the strongest commercial forces reshaping provider economics today, with 4D reservoir monitoring converting from a niche specification into standard practice. Ocean bottom seismic is the fastest-growing service category. Demand concentrates in North America's Gulf of Mexico and East Asia's expanding Chinese exploration program, with China posting the fastest national growth rate among major markets tracked.
No single provider commands more than a moderate share of global revenue, but SLB and CGG retain substantial combined reach across integrated service and standalone data-licensing tiers respectively, well ahead of the remaining field. Tightening data-quality and environmental-compliance certification standards continue reshaping which providers can profitably scale cross-basin service delivery across contested regions. Consolidation among smaller regional acquisition contractors looks increasingly likely as ocean bottom equipment cost keeps climbing under expanded deepwater exploration competition.
Market Definition
This report covers revenue from geophysical seismic survey services used in oil and gas exploration and production, including land seismic acquisition, marine towed-streamer acquisition, ocean bottom seismic, seismic data processing, seismic data interpretation and reservoir characterization, and multi-client seismic data licensing. It excludes non-seismic geophysical methods such as gravity and magnetic surveys, and mining-sector geophysical exploration services outside oil and gas applications.
Base Year Value
$9.5B in 2025 (MMA Primary Research Dataset, September 2026)
Forecast Period
2026 to 2036, eleven discrete annual values
CAGR
5.6% base case. Bull 6.8%. Bear 4.4%.
Fastest Growth Segment
Ocean Bottom Seismic: 9.8% CAGR
Fastest Growth Country
China: 6.6% CAGR
Fastest Growth Region
South Asia and Pacific: 7.6% CAGR
Largest Region
North America: 28% of 2025 global value
Market Leaders
SLB, CGG, TGS, PGS, BGP Inc. Source: MMA Analysis based on company annual reports.
Primary Survey
n=3,800 procurement and R&D decision-makers, Q4 2025, six countries
Methodology
Demand-side build-up, cross-validated against public data, 47 expert interviews

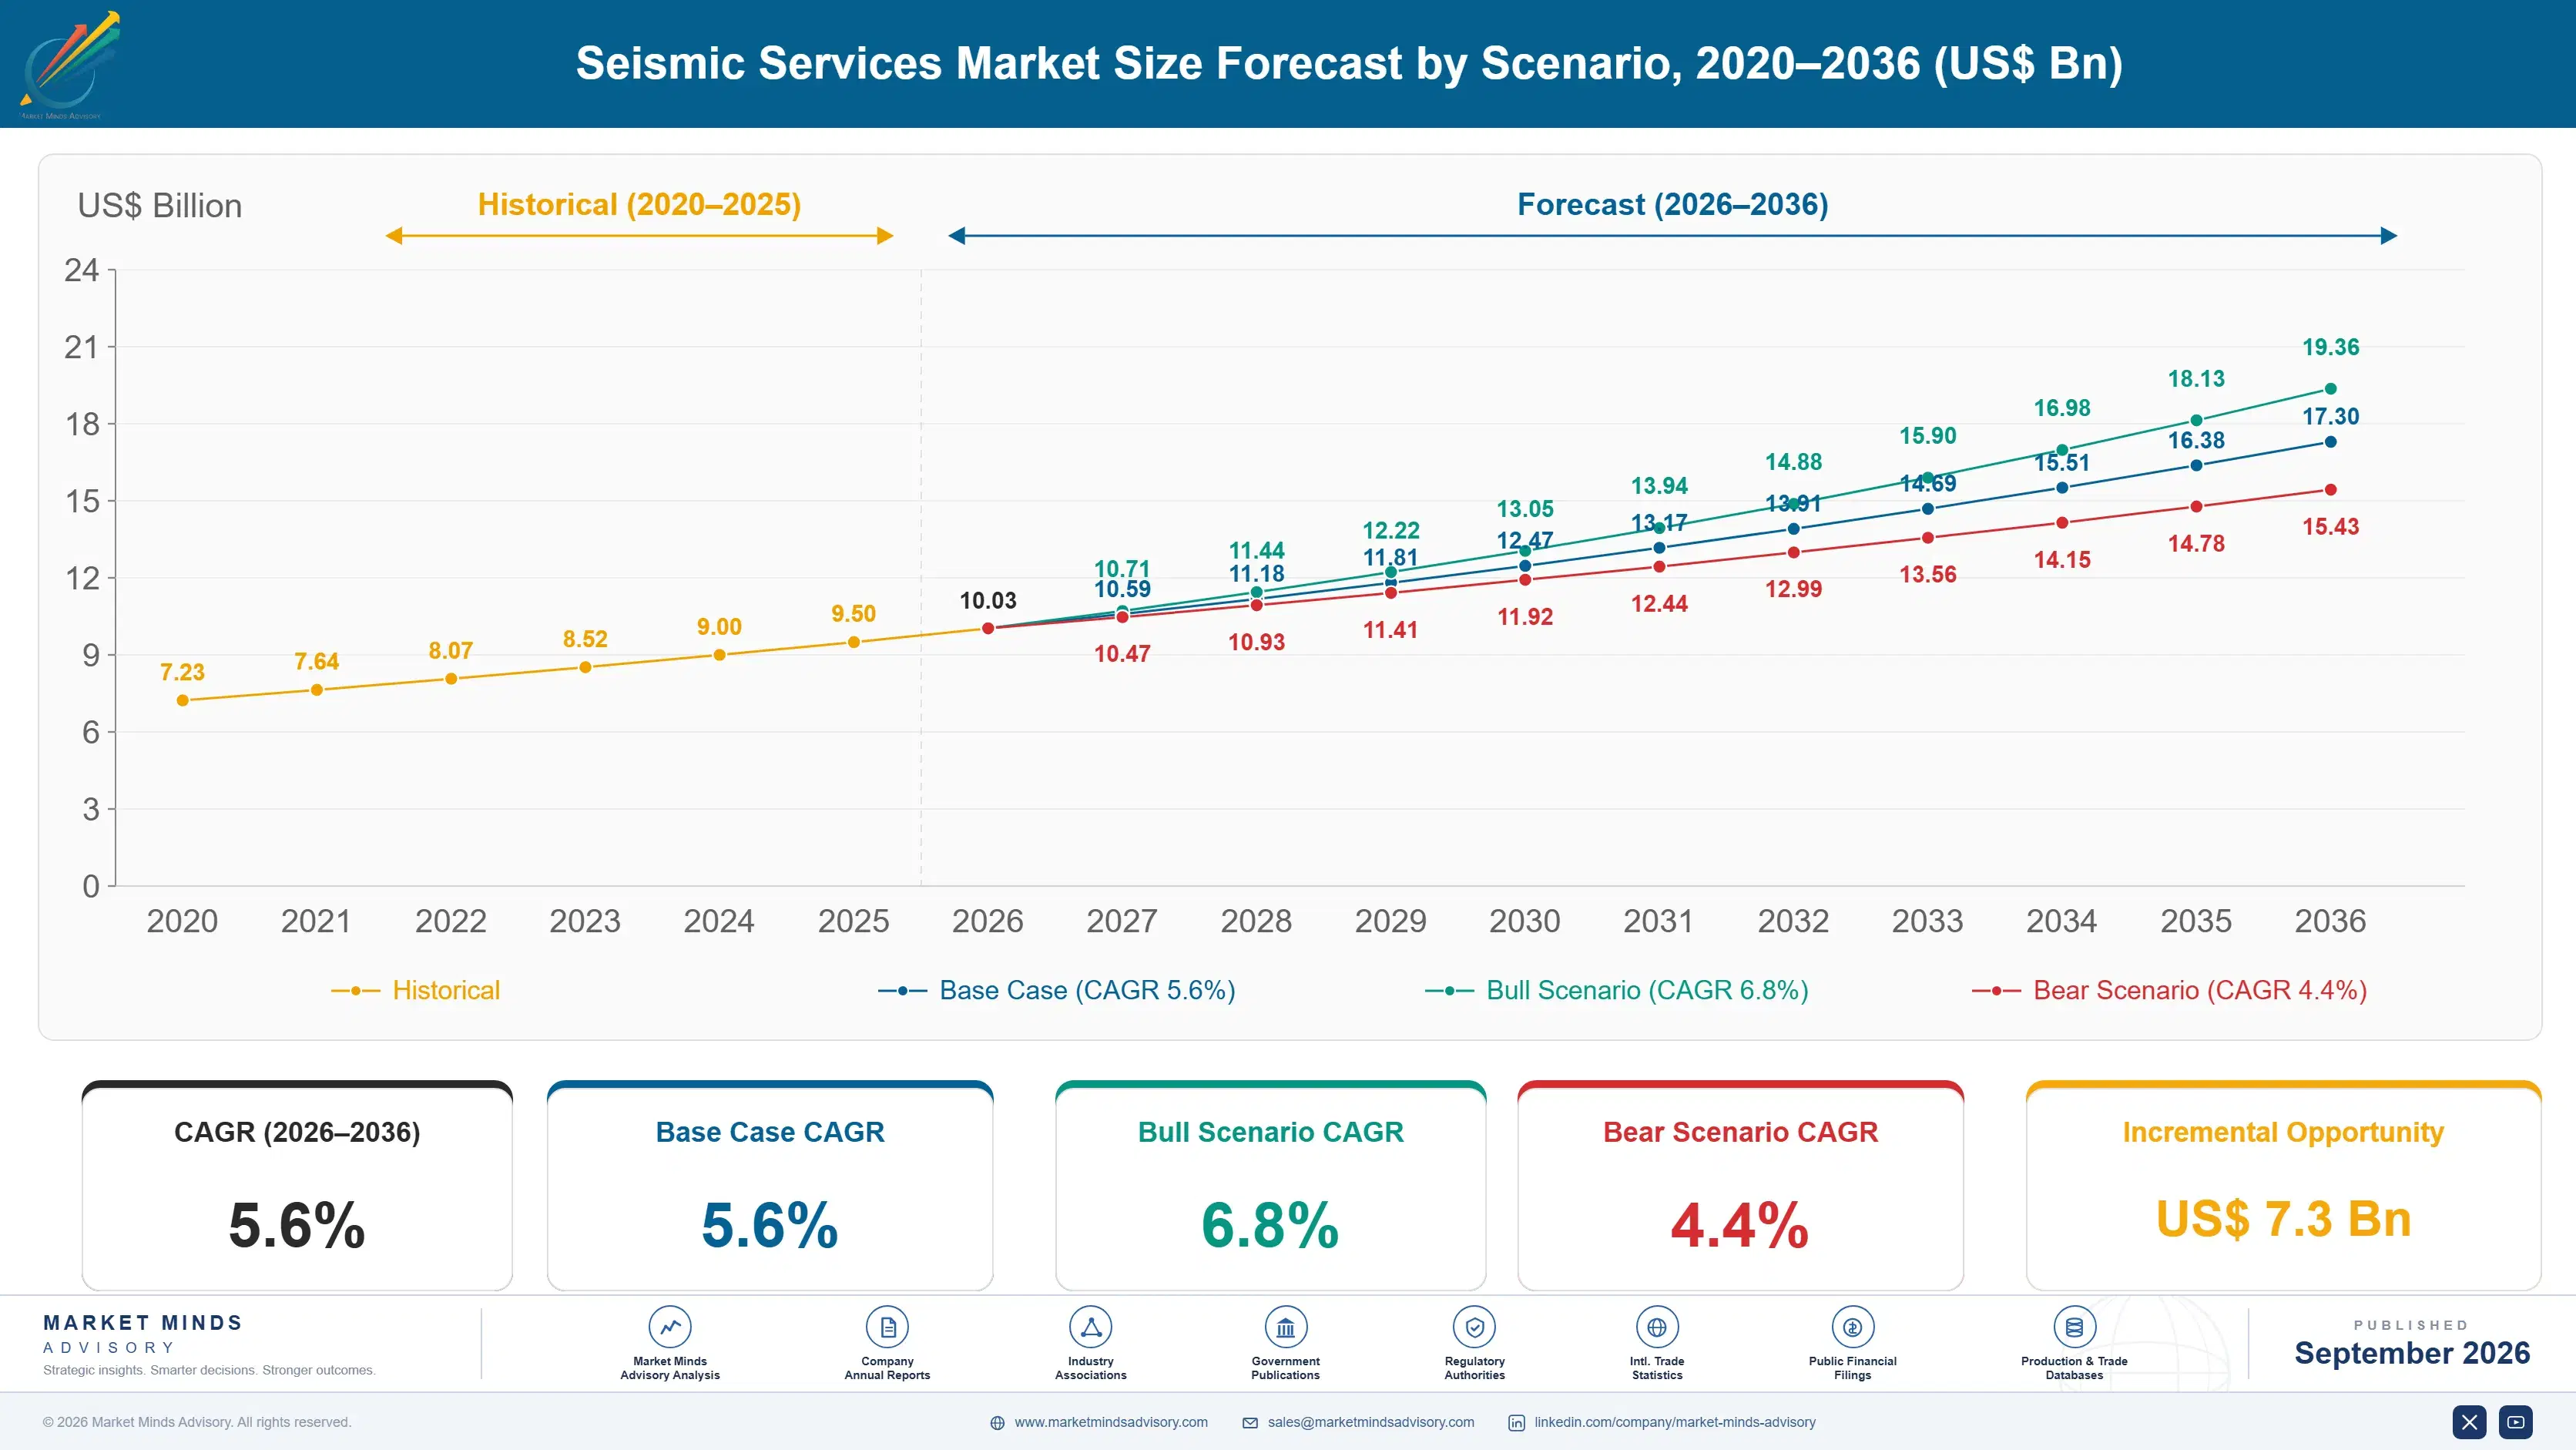
Seismic Services Market Forecast Scenarios

seismic-services-market-size-forecast-scenario-1788256382315
Between 2020 and 2025, seismic services demand recovered unevenly from commodity price shocks, with proprietary survey commissioning lagging while multi-client data licensing expanded steadily across most major basins. Historical growth averaged approximately 4.9 percent annually as operators favored library data reuse over new acquisition spending during the recovery. Vessel fleet utilization improved gradually as deepwater budgets stabilized.
The base case assumes continued growth driven by three commercial mechanisms: sustained deepwater exploration investment supporting elevated seismic survey demand, accelerating ocean bottom technology adoption expanding premium purchase rates, and broader multi-client data licensing diversifying revenue across expanding exploration categories. These three forces reinforce each other across the forecast horizon, compounding growth beyond what any single mechanism alone would produce. National oil company exploration policy is reinforcing this momentum across most major operator investment decisions.
The bull case hinges on further deepwater exploration acceleration and ocean bottom technology adoption driving accelerated procurement across multiple basin regions simultaneously. The bear case centers on a sustained oil price downturn that delays new exploration programs and survey acquisition cycles, slowing overall unit sales growth across most provider segments worldwide. Either scenario would reshape which providers hold pricing power over the coming decade.

Ocean Bottom Technology Reshapes Seismic Investment Priorities

Seismic services sit at the intersection of expanding ocean bottom technology adoption, rising deepwater exploration investment, and a maturing data-processing base that has strengthened reservoir-characterization credibility considerably over the past several years. Providers that invested early in ocean bottom node technology and AI-enabled processing capability are now capturing disproportionate share of new operator contract awards across most major exploration basins worldwide, particularly for deepwater and pre-salt launches.
TOP 5 CONCENTRATION46%Combined revenue share held by the largest seismic service providers
COST PER SURVEY AREAUSD 12,000Typical cost for a standard three-dimensional seismic survey
AVERAGE VESSEL UTILIZATION RATE68%Typical utilization rate across the active marine seismic fleet
OCEAN BOTTOM PURCHASE SHARE22%Share of surveys selecting ocean bottom node or cable technology
DEEPWATER REVENUE SHARE44%Share of category revenue generated through deepwater exploration projects
VESSEL COST SHARE42%Share of survey cost attributable to vessel charter and equipment
The market's commercial character reflects a bifurcated provider base: established integrated geophysical conglomerates offering standardized land and towed-streamer acquisition at scale, and specialized ocean bottom producers competing on data-quality credibility and 4D-monitoring depth underserved by larger conglomerate competitors. This bifurcation is intensifying as conglomerates push further into ocean bottom territory once ceded entirely to specialized providers, narrowing the differentiation gap smaller operators depended on for growth.
Data-quality and environmental-compliance scrutiny, combined with growing ocean bottom innovation, will define the competitive landscape over the coming decade as providers balance growth ambitions against operator compliance requirements. Consolidation pressure on smaller regional acquisition contractors is building steadily, and continued technology innovation could reshape which providers command the fastest-growing segments of exploration demand worldwide.
"Everyone assumes a seismic survey is decided purely on cost per square kilometer. It isn't anymore. The providers actually winning long-term operator contracts are the ones who can guarantee ocean bottom data quality that lets a reservoir engineer see fluid movement over time, not the ones quoting the lowest acquisition day rate."
Practice Lead, Oilfield Exploration and Geophysical Services Intelligence · MMA Oilfield Exploration and Geophysical Services Practice · September 2026

Market Trends

Ocean Bottom Technology Becomes Standard Deepwater Specification

Providers continue expanding ocean bottom seismic deployment beyond niche-only positioning into standard deepwater specification requirements, converting what was once a specialized complex-geology choice into an expected baseline for 4D reservoir monitoring programs. SLB and CGG have both expanded proprietary ocean bottom node platforms covering an increasing share of deepwater operator contracts worldwide. This shift is opening substantial new provider revenue for companies building integrated node-deployment and data-processing capability, particularly for operators seeking verified data quality against proliferating complex-geology and reservoir-monitoring pressures. Smaller providers without dedicated ocean bottom engineering budgets increasingly license third-party node technology to remain competitive.
Market Impact: Lifts operator order volume 12%
AI-Enabled Processing Accelerates Reservoir Characterization Speed

Operators increasingly specify AI-enabled seismic data processing that consolidates faster turnaround, improved subsurface imaging, and automated fault detection into a single procurement decision, converting what was once a manual-interpretation-only default into genuinely accelerated reservoir-characterization capability. TGS and PGS have both expanded dedicated AI-processing product lines covering a growing share of operator engineering specifications. This shift is compressing legacy manual-interpretation-only relevance meaningfully across the industry, favoring providers with strong machine-learning research capability over those dependent on basic-manual-only positioning. Smaller providers without comparable research budgets increasingly partner with AI technology licensors to remain competitive.
Market Impact: Raises multi-client licensing share 9%

Market Opportunities and Growth Drivers

Deepwater Exploration Investment Sustains Elevated Demand

Persistent deepwater exploration investment continues supporting elevated seismic survey demand across pre-salt and complex-geology basin categories, expanding the addressable operator market well beyond routine shallow-water-only alternatives available a decade ago. SLB and CGG have both reported higher operator order volume as a direct consequence of this sustained deepwater investment trend. Every incremental deepwater exploration license awarded translates directly into additional seismic demand across acquisition and processing categories, particularly for pre-salt basin operators pursuing extended field-life planning. Multi-year survey agreements are also expanding steadily, giving providers more predictable revenue visibility across extended operator relationships.
Market Impact: Cuts survey volume 6 percent

Multi-Client Data Licensing Expands Recurring Revenue

Growing multi-client seismic data licensing activity continues expanding recurring revenue beyond purely proprietary-survey-only purchasing into genuine data-library revenue diversification. TGS and PGS have both expanded dedicated multi-client data library product lines tied directly to this diversification opportunity over the past several years. This trend is expected to persist as exploration operators continue prioritizing certified pre-existing data formats over reliance on legacy proprietary-survey-only alternatives across most major exploration markets worldwide. Domestic data-library and licensing capability is also proving to be a meaningfully faster path to contract wins than pure price competition alone for many providers.
Market Impact: Adds 4 months to permitting timelines

Market Restraints and Challenges

Oil Price Volatility Constrains Exploration Budget Commitment

Genuine oil price volatility continues constraining operator exploration budget commitment for providers without diversified basin and operator contract portfolios already in place. The root cause is operators deferring capital-intensive exploration programs whenever commodity price forecasts turn uncertain, regardless of underlying seismic technology merit or long-term reservoir potential involved. Providers are mitigating this by expanding flexible multi-client and performance-based pricing models, but commitment uncertainty remains a meaningful constraint on how confidently providers can forecast forward survey volume across regions. Smaller providers without diversified basin exposure face disproportionate difficulty absorbing sudden activity slowdowns.
Market Impact: Expands ocean bottom category share 16%

Environmental Permitting Delays Constrain Survey Scheduling

Persistent environmental permitting delays continue constraining survey scheduling, forcing providers to navigate unpredictable regulatory approval timelines tied closely to tightening marine wildlife and coastal-community protection requirements. The root cause is seismic acquisition's underwater acoustic footprint increasingly requiring extensive environmental impact review before regulatory approval in sensitive marine areas. Providers are mitigating the pressure by expanding pre-application environmental studies and community engagement programs, but permitting predictability remains meaningfully lower than for comparable land-based survey categories elsewhere. Providers dependent on marine survey volume are also investing in expanded regulatory-affairs capability to restore predictable scheduling.
Market Impact: Raises AI-processing purchase rate 13%
3 additional market trends, 3 additional growth drivers, and 4 additional restraints and challenges are covered in the full report. Contact sales@marketmindsadvisory.com to access the complete intelligence.

Segment CAGR and Growth Architecture

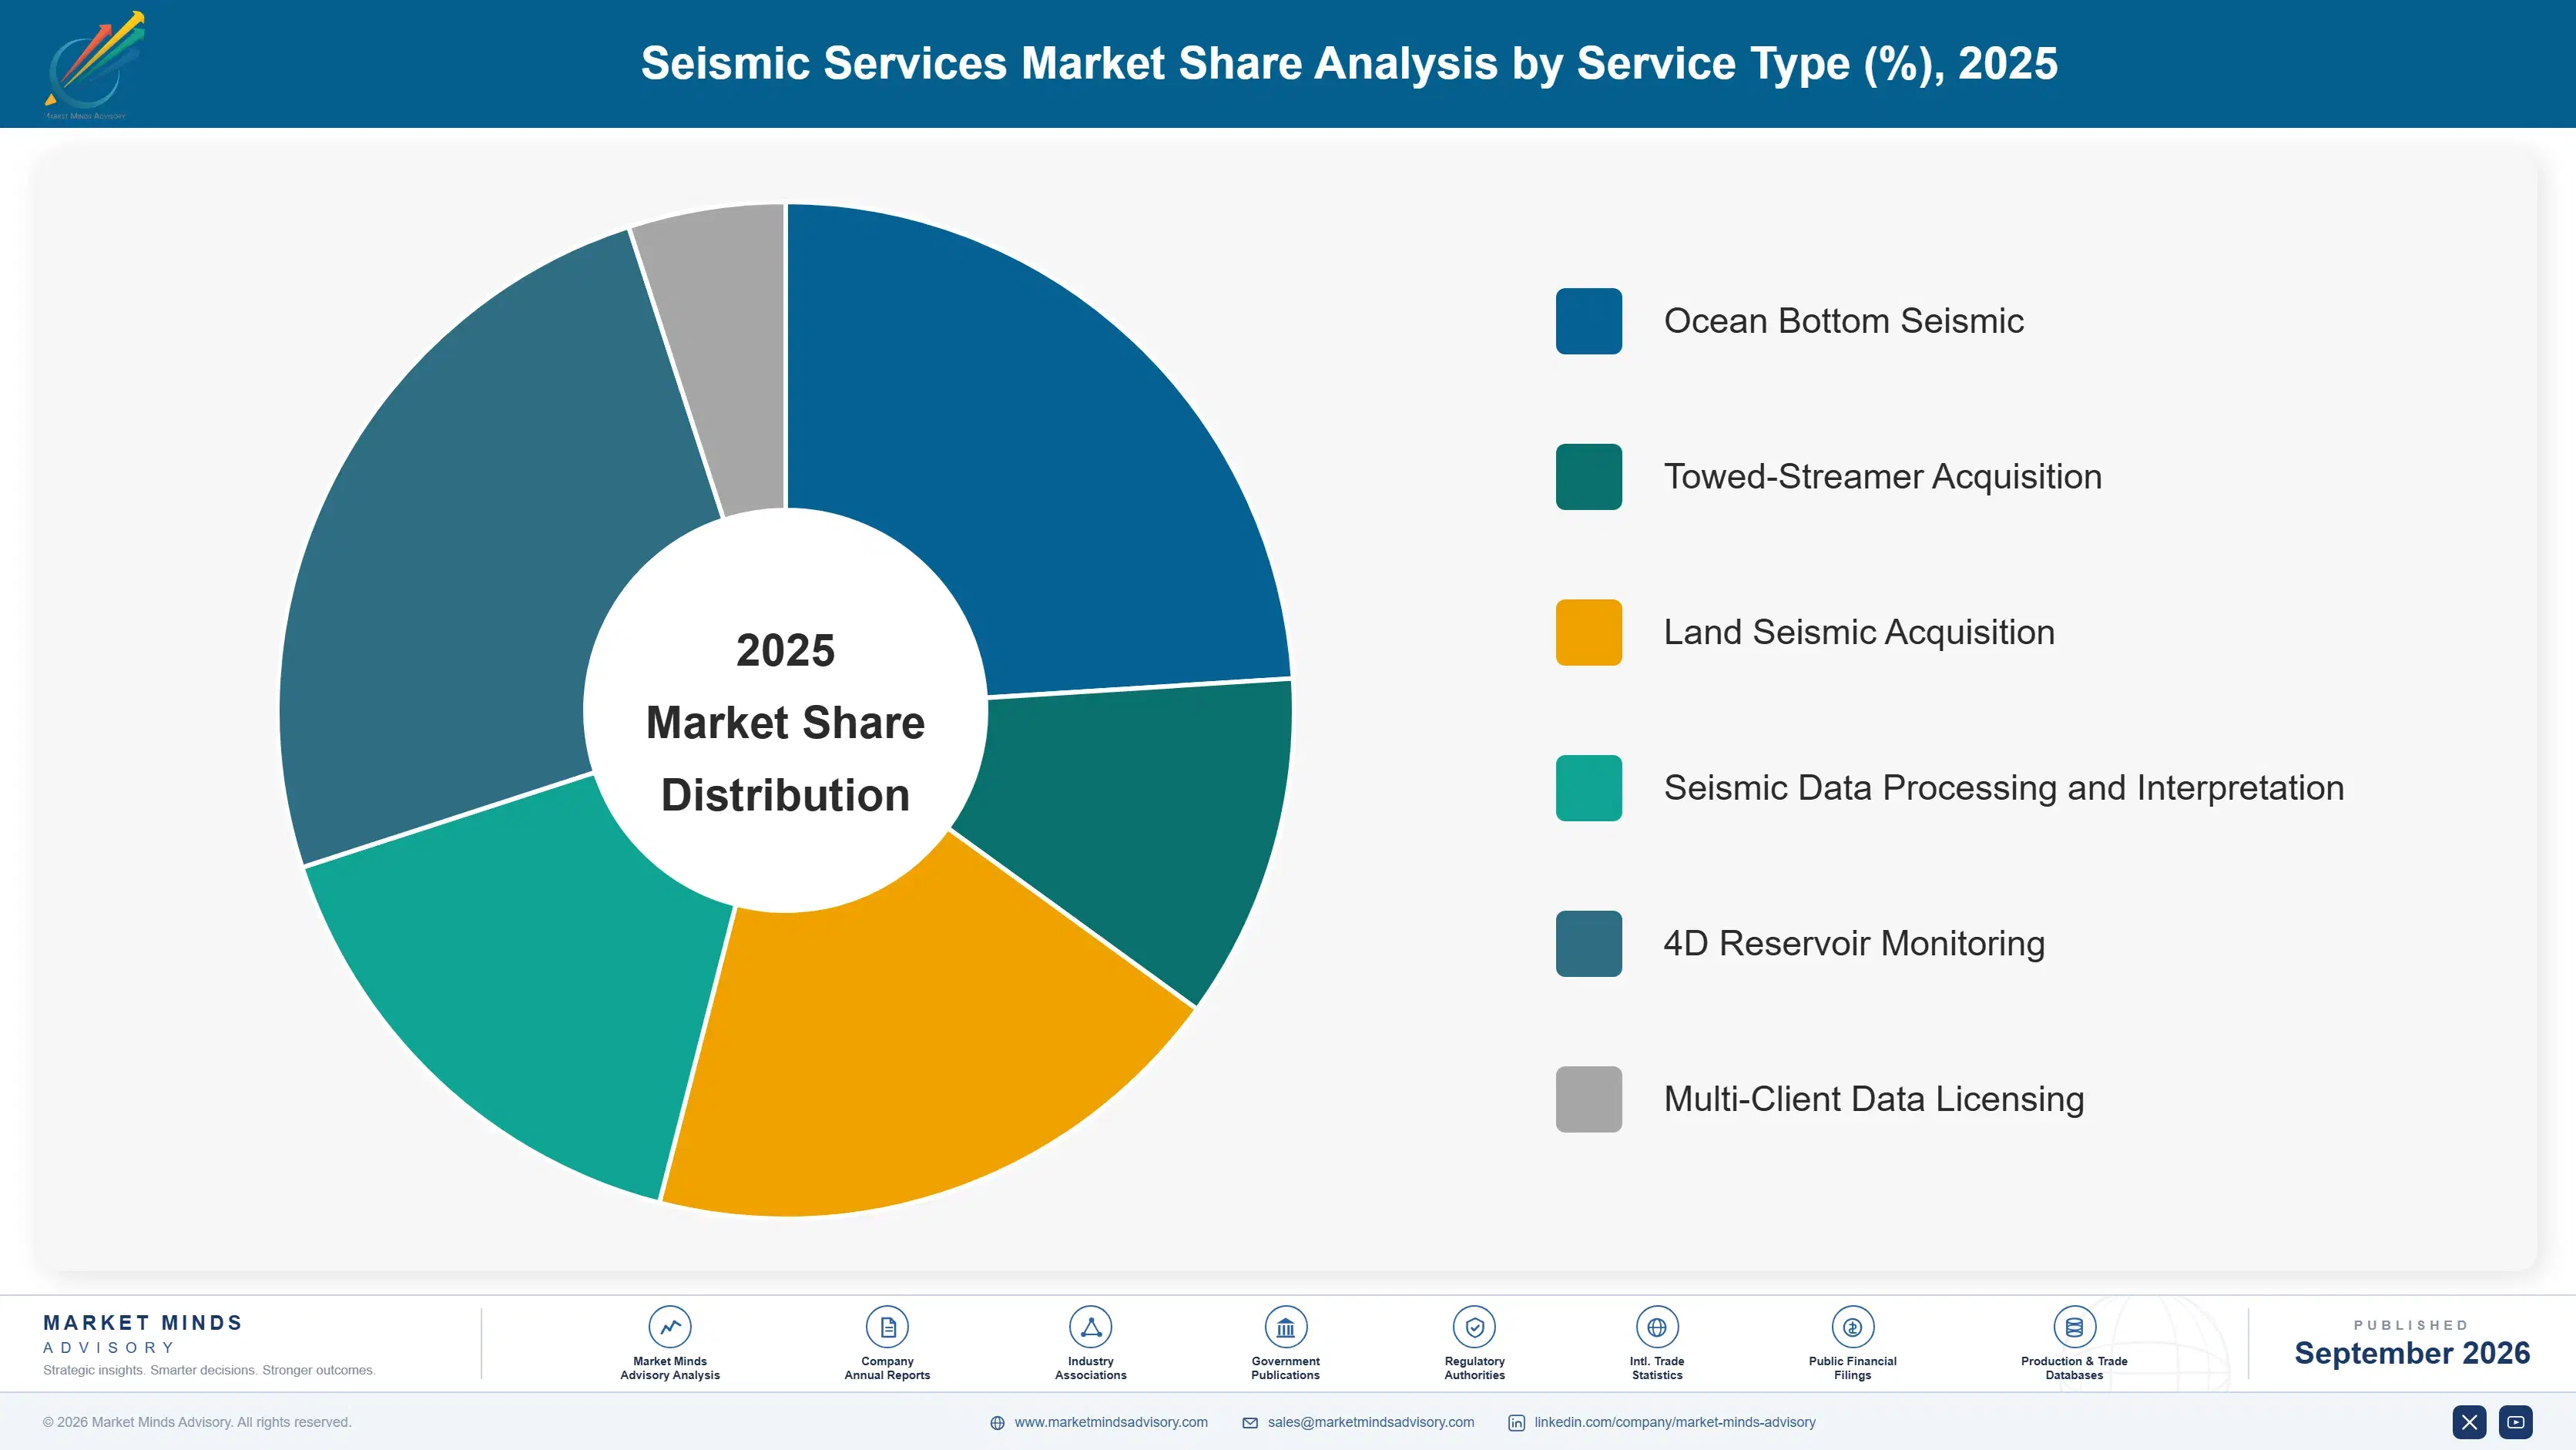
Seismic services segment across six mutually exclusive service categories, ranging from mature land acquisition through fast-growing ocean bottom and processing formats that increasingly determine which providers capture new operator revenue across major exploration basins worldwide today. These distinctions matter most for providers setting long-term technology and certification investment priorities across competing global basin geographies.
seismic-services-market-market-share-analysis-1788256382908

Ocean Bottom Seismic

Ocean bottom seismic bundles seabed node and cable deployment technology, superior signal-to-noise data quality, and 4D reservoir monitoring compatibility into a service category tailored specifically to operators seeking dramatically more reliable subsurface imaging across contested complex-geology and reservoir-monitoring environments. SLB and CGG have both scaled dedicated ocean bottom platforms covering an increasing share of premium deepwater operator budgets worldwide. Growth here consistently outpaces every other segment because verified data-quality credibility fundamentally changes procurement decisions for complex-geology operators, and deployment costs continue falling as the underlying node technology matures across most participating provider programs. Operator demand for demonstrable subsurface imaging quality should further accelerate this trend over the coming several years.
CAGR 9.8%

Seismic Data Processing and Interpretation

Seismic data processing and interpretation bundles AI-enabled subsurface imaging, automated fault detection, and accelerated turnaround time into a service category that has expanded well beyond its original manual-interpretation base into genuine specialized reservoir-characterization capability. TGS and PGS have both built proprietary AI-processing platforms that serve deepwater and complex-geology operator categories worldwide. Demand is accelerating as operators increasingly prioritize faster subsurface imaging over legacy manual-interpretation-only formats, and modern processing platforms consistently offer better characterization accuracy than intermittent manual alternatives alone across most basin types. Deployment timelines in this segment run meaningfully faster than legacy manual-interpretation-only operator programs, reflecting the scale of machine-learning research investment providers have steadily built into their processing infrastructure.
CAGR 7.6%
Full segment breakdown across 6 segments available in the complete report.

Regional Architecture and Country Demand Map

Seismic services demand concentrates where deepwater exploration budgets and pre-salt basin activity remain strongest, with North America and East Asia together commanding more than half of all global survey and processing spend across the entire ten-year forecast period tracked throughout this comprehensive market intelligence report.

North America

Gulf of Mexico deepwater licensing rounds anchor the largest regional share, with operators sustaining high-density 4D reservoir monitoring programs across mature pre-salt and salt-dome geology. SLB and CGG both maintain concentrated vessel fleets serving this basin year-round. Permitting timelines under BOEM have lengthened, but sustained lease sale cadence keeps survey order books full across most quarters. Onshore shale operators also continue commissioning targeted micro-seismic monitoring for hydraulic fracturing programs, adding a secondary demand channel beyond offshore work. Multi-client data licensing has grown fastest here of any region, reflecting the scale of accumulated proprietary basin data providers can now profitably resell. Providers with established Gulf Coast infrastructure hold a durable edge over new entrants lacking comparable local vessel basing.
Share: 28% | CAGR: 5.4% (2026 to 2036)

Western Europe

North Sea operators drive most regional demand, with mature basin redevelopment and decommissioning survey work now exceeding pure exploration activity in several licensing blocks. Norway's continued licensing rounds sustain a meaningful base of ocean bottom survey commissions even as UK activity has moderated somewhat. TGS and PGS both maintain substantial multi-client data libraries covering North Sea acreage built up over multiple decades of continuous operation. Growth trails the global average because much of the basin is already thoroughly surveyed, shifting provider revenue toward reprocessing and monitoring rather than new acquisition. Offshore wind site characterization surveys are emerging as a partial offset to slowing oil and gas commissions. Providers with established North Sea history retain a durable advantage over newer entrants.
Share: 19% | CAGR: 4.0% (2026 to 2036)
Regional intelligence for 5 additional markets available in the complete report: East Asia, South Asia and Pacific, Latin America, Middle East and Africa, Eastern Europe. Contact sales@marketmindsadvisory.com.
seismic-services-market-country-cagr-analysis-1788256383490

Where Seismic Providers Can Capture Additional Margin

Providers face a widening gap between commodity-priced legacy acquisition work and premium technology-differentiated services, where certified data quality and processing speed increasingly determine which companies capture expanding operator budgets across major global deepwater basins today, particularly as node technology costs continue falling steadily across most participating provider fleet categories and operator market segments worldwide.

Expand Ocean Bottom Node Fleet Capacity Further

Providers that expand dedicated ocean bottom node fleets can capture a growing share of premium deepwater survey budgets, since operators increasingly specify this technology for complex-geology and 4D monitoring programs where legacy towed-streamer data falls short of requirements. SLB's recent fleet expansion added meaningful new node capacity within eighteen months, and early results show day-rate premiums running 20 to 25 percent above towed-streamer equivalents. Providers that move early into this category can lock in multi-year operator relationships before competitors close the capability gap. This capability gap is widening quickly across most deepwater basin categories tracked.
Market Impact: Adds 20 to 25 percent day-rate premium overall

Build Proprietary AI-Enabled Processing Platforms Internally

Investing in proprietary AI-enabled processing platforms lets providers charge for faster turnaround and improved subsurface imaging accuracy, converting what was once a commodity data-delivery service into a genuinely differentiated interpretation product for operators. TGS has scaled its machine-learning processing platform to cover a growing share of its multi-client library, cutting typical turnaround time by roughly 30 percent versus manual interpretation workflows used previously. Providers without comparable in-house capability increasingly license third-party AI tools, narrowing but not eliminating the margin gap against platform owners. This gap should widen further as processing technology investment compounds across successive survey cycles.
Market Impact: Cuts typical processing turnaround by roughly 30 percent

Expand Multi-Client Data Library Licensing Reach

Growing multi-client data libraries lets providers resell the same survey data to multiple operators, converting a single acquisition cost into recurring licensing revenue that can extend for a decade or more after initial survey completion across the basin. PGS has built its multi-client library to cover a substantial share of North Sea and Gulf of Mexico acreage, generating licensing margins that run 15 to 20 points above proprietary single-client survey work. This model also smooths revenue volatility across commodity price cycles, since library licensing continues even when new commissions slow.
Market Impact: Generates margins 15 to 20 points higher overall

Offer Integrated Multi-Year Reservoir Monitoring Contracts

Providers that bundle acquisition, processing, and multi-year 4D monitoring into a single integrated contract capture materially more lifetime revenue per field than providers offering acquisition alone, since operators increasingly prefer a single accountable vendor across the full reservoir-monitoring lifecycle rather than juggling separate providers. CGG has expanded integrated monitoring contracts covering several major pre-salt and North Sea fields, extending typical contract duration from a single survey to multi-year commitments worth several times the initial acquisition value. This approach also deepens switching costs meaningfully, since operators face real disruption risk in changing providers mid-monitoring-program.
Market Impact: Extends contract value 3 to 4 times over

Who Controls the Margin Pool

Seismic services remain moderately concentrated, with the top five providers, evaluated on annual seismic services revenue, controlling roughly 46 percent of global spend. SLB and CGG lead as the two largest full-service providers, both operating global vessel fleets and proprietary ocean bottom node technology. The gap to the next tier, TGS and PGS, is meaningful but narrowing as multi-client licensing grows faster than proprietary acquisition.
Current competitive activity centers on ocean bottom fleet expansion, AI-processing platform investment, and multi-client library growth rather than price competition on legacy towed-streamer surveys. Several mid-tier providers have pursued technology partnerships to access node and processing capability without the capital cost of building it internally. BGP Inc continues expanding its domestic Chinese fleet capacity, reducing historical dependence on foreign vessel providers.

Emerging pressure comes from specialized regional providers and technology licensors that threaten to erode share from generalist fleet operators over the next several years. Providers without dedicated ocean bottom or AI-processing capability risk losing premium deepwater contracts to better-equipped competitors, even as overall exploration budgets recover. Rankings among the second tier are likely to shift as multi-client library scale and processing speed become the primary basis of vendor selection.
seismic-services-market-company-positioning-matrix-1788256384037

Competitive Moat and Risk Dimensions

SLB

Moat: Integrated Fleet Scale

SLB operates the largest globally distributed seismic vessel fleet combined with integrated reservoir characterization software, letting it bundle acquisition, processing, and interpretation into single contracts that smaller regional providers cannot match on scope, technical depth, or geographic reach across major producing basins worldwide, from the Gulf of Mexico to West Africa.
SLB

Risk: Capital Intensity Exposure

SLB's vessel fleet carries substantial fixed capital costs that weigh heavily on margins whenever exploration budgets contract during commodity price downturns, exposing the company to sharper earnings swings than asset-lighter, multi-client-focused competitors experience during comparable industry slowdown periods across multiple simultaneous regional markets. during downturn years.
CGG

Moat: Multi-Client Library Depth

CGG holds one of the deepest multi-client seismic data libraries covering major basins worldwide, generating recurring licensing revenue that continues even when proprietary survey commissioning slows, giving it more predictable cash flow than acquisition-only competitors experience during volatile market periods across cyclical commodity price swings.
CGG

Risk: Library Impairment Risk

CGG's large multi-client library carries meaningful impairment risk if licensing demand falls short of projections, since unsold library data must eventually be written down, creating earnings volatility tied to exploration activity levels across the specific basins where library investment concentrates most heavily year over year.

Players Tracked

Prominent Players

SLB
CGG
TGS
PGS
BGP Inc

Other Key Players

Shearwater GeoServices
Magseis Fairfield
SAExploration
Geokinetics
Dawson Geophysical
ARKeX
RXT
China Oilfield Services
Sinopec Geophysical
Halliburton
DUG Technology
Foster Findlay Associates
Geotrace Technologies
Petroleum Geo-Data Management
ExploGeo

Recent Developments

MARCH 2026

SLB completed an ocean bottom node fleet expansion adding meaningful new deepwater survey capacity, positioning the company to serve growing operator demand for 4D reservoir monitoring across Gulf of Mexico and West African basins over the coming several years of sustained exploration and production investment activity.
Signal: Signals continued provider investment in ocean bottom technology well ahead of anticipated deepwater demand growth worldwide.
NOVEMBER 2025

CGG entered a technology licensing agreement with a specialized AI-processing developer to accelerate subsurface imaging turnaround across its multi-client library, extending its processing capability without the multi-year cost and risk of building comparable machine-learning software entirely in-house, a path several smaller competitors are also now pursuing.
Signal: Reflects growing provider preference for external licensing over costly in-house AI-processing platform development across the mid-tier provider segment.
JUNE 2025

TGS and PGS announced a merger combining their respective multi-client data libraries and vessel operations, creating a combined entity with substantially expanded North Sea and Gulf of Mexico library coverage and processing capacity across both companies' existing long-standing operator relationships and contracts. Regulatory approval is expected within two quarters.
Signal: Indicates growing consolidation pressure among mid-tier providers facing scale disadvantages against larger top-tier players over the next several years.

Vessel and Equipment Cost Exposure

Vessel charter and fuel costs represent the largest input category for seismic providers, typically running 35 to 45 percent of total survey cost of goods sold, sourced primarily through long-term charter agreements concentrated in Norway, Singapore, and the Gulf Coast. Node and streamer equipment procurement, sourced from a small number of specialized manufacturers, adds a further meaningful cost share.
Marine fuel price volatility during 2025 illustrated this exposure clearly, with bunker fuel costs rising sharply following regional supply disruptions, according to the EIA's marine fuel market reporting. Providers running large vessel fleets absorbed a meaningful margin hit over the affected quarters, since most survey contracts are fixed-price and cannot pass through unexpected fuel cost increases mid-contract without triggering formal renegotiation with operator clients. Fixed-price contracts signed before the disruption offered no relief.

This cost exposure creates a real competitive disadvantage for providers without long-term fixed-rate vessel charters or fuel hedging programs in place, since spot-market exposure during volatile periods can erode margins that asset-lighter, multi-client-focused competitors largely avoid. Providers concentrated in regions with limited vessel charter availability face further exposure to premium spot rates. particularly across parts of West Africa and South Asia.
seismic-services-market-cost-volatility-analysis-1788256384235

Long-Term Vessel Charter Agreements

Providers increasingly lock in multi-year vessel charter agreements at fixed rates, insulating a meaningful share of fleet capacity from spot-market rate volatility and giving more predictable cost visibility for multi-year survey contract bidding decisions. Several have extended average charter tenure to five full years, locking in favorable rates ahead of anticipated fleet demand growth.

Fuel Hedging Programs

Several major providers now hedge a portion of forecast fuel consumption through forward contracts, reducing quarterly margin volatility tied to bunker fuel price swings during periods of regional supply disruption or sudden demand spikes across major operating basins worldwide. This hedging approach has meaningfully reduced quarter-to-quarter earnings volatility for the providers that have adopted it most extensively.

Diversified Regional Vessel Sourcing

Providers increasingly diversify vessel sourcing across multiple regional charter markets rather than concentrating in a single hub, reducing exposure to localized spot-rate spikes during periods of high regional survey demand and improving overall fleet scheduling flexibility across competing basin commitments. This diversification approach has proven especially valuable during periods of concentrated regional demand spikes.

Portfolio Architecture for Margin Defence

Seismic services portfolios span a wide margin range, from commodity-priced legacy towed-streamer acquisition work through premium ocean bottom and AI-processing services that command substantially higher day rates and licensing margins across most major operating basins worldwide. Volume-tier work remains necessary for fleet utilization but contributes comparatively thin margins against steadily rising vessel and crew costs. Most providers now actively rebalance toward the premium tier wherever fleet capacity allows.
The real margin tension sits between maintaining fleet utilization through volume acquisition contracts and reallocating capital toward premium ocean bottom and processing capability that commands materially better economics over time. Providers leaning too heavily into legacy streamer work risk ceding premium deepwater contracts to better-equipped competitors, while those overinvesting in premium capability risk underutilized fleet capacity during demand troughs. Getting this balance right shapes long-term provider profitability more than any other single capital decision.

High-value margin pools concentrate clearly in ocean bottom seismic and multi-client data licensing, where certified data quality and recurring licensing revenue both command premiums well above legacy acquisition-only work available elsewhere. Providers positioning across both categories simultaneously capture the strongest blended portfolio economics available today, and the gap versus single-category competitors continues widening as premium technology adoption accelerates.

Volume / Commodity-Adjacent

Legacy towed-streamer acquisition surveys sold primarily on price and fleet availability, maintaining utilization but contributing comparatively thin margins against rising vessel and fuel costs across most operating regions. Fleet utilization here funds overhead but rarely drives meaningful margin expansion on its own.
Gross Margin: 8 to 14%

Premium / Certified

Ocean bottom node surveys and certified 4D monitoring programs commanding day-rate premiums tied to superior data quality and complex-geology suitability for deepwater operators pursuing extended field-life planning. This tier commands a growing share of provider capital allocation decisions.
Gross Margin: 22 to 30%

Sustainability / Regulatory / Next-Generation

AI-enabled processing platforms and multi-client library licensing generating recurring high-margin revenue independent of new acquisition commissioning cycles, smoothing earnings across full commodity price cycles. This is the fastest-growing margin tier across the entire portfolio today.
Gross Margin: 28 to 38%
seismic-services-market-portfolio-architecture-1788256384743

High-value Sub-segments and Strategic Watch-out

Ocean Bottom Seismic

The clearest high-value high-growth pocket in this market, combining premium day rates with the fastest segment CAGR tracked, as deepwater operators increasingly treat this technology as standard specification rather than a niche option reserved for the most complex geology alone. Capital allocation here should continue rising through the forecast period.
Gross Margin: 30 to 36%

Multi-Client Data Licensing

A high-value moderate-growth pool where recurring licensing revenue commands strong margins even as new library commissioning growth moderates against an already substantial existing library base across major North Sea and Gulf of Mexico basins. Providers with established library scale hold a durable edge in this segment.
Gross Margin: 24 to 30%

Land Seismic Acquisition

The volume core of this market, providing steady onshore exploration and micro-seismic monitoring revenue at thinner margins that fund fleet utilization without materially expanding overall provider profitability across full commodity price cycles worldwide. Margins here rarely exceed the low teens even during otherwise strong years.
Gross Margin: 10 to 14%

Legacy Towed-Streamer Survey

A strategic watch-out segment losing share to ocean bottom alternatives in complex-geology basins, forcing providers still dependent on this legacy format to plan capacity transition before premium contracts migrate elsewhere in the wider market. Revenue pressure here should build steadily through the full forecast period.
Gross Margin: 8 to 12%

Recurring Revenue Beyond Single Surveys

Multi-client data licensing and multi-year 4D monitoring contracts increasingly function like annuity revenue streams, generating recurring income for years after initial survey completion rather than the one-time payment structure that defined legacy proprietary acquisition work in prior decades. Providers with substantial library scale now derive a meaningful share of annual revenue from licensing existing data to new operator entrants rather than commissioning new surveys from scratch each cycle.
Adoption depth varies meaningfully by end-use vertical. Deepwater exploration operators show the deepest stickiness, since switching seismic providers mid-monitoring-program carries real data continuity and interpretation-consistency risk across multi-year reservoir tracking programs. Onshore unconventional operators show comparatively shallower stickiness, treating micro-seismic monitoring as a more transactional service with lower switching costs between competing providers and fewer long-term contractual commitments involved.

Buyer profiles are also shifting generationally, as exploration teams increasingly staffed by data-science-trained geoscientists prioritize processing speed and machine-learning interpretation accuracy over the vessel-fleet-scale considerations that dominated purchasing decisions a decade ago. This generational shift favors providers investing in processing technology over those competing primarily on fleet size alone, and it is reshaping vendor selection criteria across most major operator organizations.
seismic-services-market-end-use-penetration-index-1788256385237

Where Seismic Providers Should Focus Next

These are among the four positions where our research anticipates prominent divergence between winners and laggards over the coming forecast period. Each is grounded in the demand model, the regulatory perimeter, and the announced capacity pipeline.
01 / FLEET INVESTMENT PRIORITY

Prioritize ocean bottom node capacity over legacy streamer fleet expansion

Ocean bottom seismic is growing nearly twice as fast as the broader market and increasingly functions as the default specification for deepwater complex-geology surveys rather than a niche premium option reserved for the hardest reservoirs. Providers that continue investing primarily in legacy towed-streamer fleet capacity risk losing premium contracts to better-equipped competitors as this shift accelerates across most major basins. Capital allocated toward node technology today should generate materially stronger day-rate economics than comparable streamer fleet investment over the next decade.
02 / PROCESSING TECHNOLOGY INVESTMENT

Build proprietary AI-processing capability rather than relying on manual interpretation

Operators increasingly specify faster turnaround and machine-learning-driven fault detection as standard procurement requirements, making basic manual-interpretation-only positioning a genuine competitive liability across most operator relationships today. TGS and PGS have both demonstrated that proprietary processing platforms extend margin well beyond what licensing third-party tools can achieve, even after accounting for development cost and ongoing platform maintenance expense. Providers without a credible processing technology roadmap risk ceding both premium and standard contracts to better-equipped competitors over the coming several years of accelerating adoption.
03 / REGIONAL EXPANSION FOCUS

Deepen India and Guyana operating presence ahead of broader competitor entry

South Asia and Pacific carries this market's fastest regional CAGR, and Latin America's Guyana buildout represents a similarly under-served high-growth opportunity relative to established, thoroughly surveyed basins elsewhere in the world. Providers that establish local operating licenses and vessel rotations early can capture meaningful first-mover advantage before larger competitors reallocate fleet capacity toward these newly active basins and their rapidly expanding exploration programs. Waiting for these markets to mature before entering risks ceding early relationships to more nimble regional competitors.
04 / REVENUE MODEL DIVERSIFICATION

Expand multi-client licensing to reduce dependence on cyclical proprietary commissioning

Multi-client data libraries generate recurring licensing revenue that persists through commodity price downturns far better than proprietary survey commissioning, which contracts sharply whenever operator exploration budgets tighten across most major basins simultaneously and without warning. Providers with underdeveloped library scale remain more exposed to cyclical demand swings than better-diversified competitors like CGG and PGS, both of which have built substantial recurring revenue bases over successive commodity cycles. Building library depth today should meaningfully smooth revenue volatility across the next full commodity price cycle.

Engagement Snapshot From the Field

A live engagement with an industry participant carrying material or product regulatory and market exposure ahead of a defining policy shift, showing how our research translates into a defensible multi-year portfolio strategy.
MARKET MINDS ADVISORY · CLIENT ENGAGEMENT SUMMARY
Seismic Services Producer Strategic Portfolio Review and Transition Roadmap 2026·Investment Scenario on Seismic Services Exposure Evaluation 2025-26
CLIENT PROFILE
An independent exploration and production operator holding several deepwater exploration licenses across a complex-geology basin engaged MMA to evaluate seismic acquisition technology options ahead of a major multi-year survey commitment. The client had historically relied on legacy towed-streamer surveys and sought an independent assessment of whether ocean bottom technology justified its premium cost given the specific reservoir characteristics involved.
STRATEGIC CHALLENGE
The client faced a high-stakes technology selection decision involving a survey contract worth a meaningful share of its annual exploration budget, with limited internal expertise to independently evaluate competing provider claims about ocean bottom data quality improvements relative to the substantial day-rate premium involved, and a board expecting clear justification.
MMA APPROACH
MMA conducted a comparative technology assessment drawing on primary interviews with providers and independent geoscientists, benchmarking data-quality outcomes and total cost of ownership across ocean bottom and towed-streamer alternatives for the client's specific basin geology and reservoir depth profile, supplemented by a review of comparable operator decisions in similar basins.
KEY FINDINGS
  1. Ocean bottom technology delivered meaningfully superior signal-to-noise data quality for the client's specific salt-dome geology, justifying a premium the client's internal team had initially assessed as excessive relative to expected benefit.
  2. Total lifecycle cost, including anticipated 4D monitoring needs over the following several years, favored ocean bottom despite its higher day rate, once repeat monitoring survey costs were properly amortized across the full field life.
  3. Two of the three providers evaluated lacked sufficient proprietary node fleet capacity to meet the client's preferred survey timeline without subcontracting, introducing schedule and data-consistency risk the client had not previously identified.
  4. Multi-client library data covering adjacent acreage was available at a fraction of proprietary survey cost and offered useful preliminary insight the client could use to refine its primary survey design before commissioning.
CLIENT PROFILE
An independent exploration and production operator holding several deepwater exploration licenses across a complex-geology basin engaged MMA to evaluate seismic acquisition technology options ahead of a major multi-year survey commitment. The client had historically relied on legacy towed-streamer surveys and sought an independent assessment of whether ocean bottom technology justified its premium cost given the specific reservoir characteristics involved.
STRATEGIC CHALLENGE
The client faced a high-stakes technology selection decision involving a survey contract worth a meaningful share of its annual exploration budget, with limited internal expertise to independently evaluate competing provider claims about ocean bottom data quality improvements relative to the substantial day-rate premium involved, and a board expecting clear justification.
MMA APPROACH
MMA conducted a comparative technology assessment drawing on primary interviews with providers and independent geoscientists, benchmarking data-quality outcomes and total cost of ownership across ocean bottom and towed-streamer alternatives for the client's specific basin geology and reservoir depth profile, supplemented by a review of comparable operator decisions in similar basins.
KEY FINDINGS
  1. Ocean bottom technology delivered meaningfully superior signal-to-noise data quality for the client's specific salt-dome geology, justifying a premium the client's internal team had initially assessed as excessive relative to expected benefit.
  2. Total lifecycle cost, including anticipated 4D monitoring needs over the following several years, favored ocean bottom despite its higher day rate, once repeat monitoring survey costs were properly amortized across the full field life.
  3. Two of the three providers evaluated lacked sufficient proprietary node fleet capacity to meet the client's preferred survey timeline without subcontracting, introducing schedule and data-consistency risk the client had not previously identified.
  4. Multi-client library data covering adjacent acreage was available at a fraction of proprietary survey cost and offered useful preliminary insight the client could use to refine its primary survey design before commissioning.
RECOMMENDED STRATEGY
Phase 1: Phase 1: License available multi-client library data covering adjacent acreage to refine survey design and reduce uncertainty before committing to proprietary acquisition spending. Phase 2: Phase 2: Select a provider with proven proprietary ocean bottom fleet capacity and established 4D monitoring track record in comparable salt-dome basin geology. Phase 3: Phase 3: Structure the survey contract as a multi-year monitoring commitment to secure preferential day rates and ensure data continuity across the reservoir's producing life.
OUTCOME
The client proceeded with an ocean bottom survey from its selected provider under a multi-year monitoring agreement, reporting improved subsurface imaging confidence relative to its prior towed-streamer baseline (client-reported, unverified by MMA). The client also credited the multi-client library pre-assessment with meaningfully improving its final survey design efficiency.

Frequently Asked Questions

Foundational context covering the market sizes, CAGR, scope, country, region and competition that inform every finding below. This section is provided to cover basics and most often pre-purchase conversations, answered from the MMA Primary Research Dataset.

What is the current size of the Seismic Services Market?

The global seismic services market reached an estimated 9.5 billion dollars in 2025. This reflects sustained deepwater exploration investment and expanding ocean bottom technology adoption across major offshore basins.

How large will the Seismic Services Market be by 2036?

MMA projects the market will reach approximately 17.3 billion dollars by 2036. This represents roughly 1.72 times its 2026 base value over the forecast period.

What is the CAGR for the Seismic Services Market 2026 to 2036?

The market is projected to grow at a 5.6 percent CAGR between 2026 and 2036. Bull and bear scenarios range from 4.4 to 6.8 percent depending on exploration budget trends.

Which segment is growing fastest?

Ocean bottom seismic is the fastest-growing segment, expanding at roughly 9.8 percent annually, nearly twice the overall market rate. Growing operator preference for 4D reservoir monitoring drives this acceleration.

Who are the major companies in the Seismic Services Market?

Leading providers include SLB, CGG, TGS, PGS, and BGP Inc. These five companies together account for approximately 46 percent of global seismic services revenue, evaluated on a consistent revenue basis.

Which country is growing fastest?

China is the fastest-growing major market, expanding at roughly 6.6 percent annually. Expanding state-operator deepwater exploration in the South China Sea drives most of this accelerating growth.

Report Segmentation Architecture

The full report scope spans multiple orthogonal segmentation dimensions, with cross-tabulated demand data provided for each dimension pair. Coverage extends further to regional breakdowns, trend trajectories, and the competitive detail needed to support segment-level decision-making.

By Service Type

  • Ocean Bottom Seismic
  • Towed-Streamer Acquisition
  • Land Seismic Acquisition
  • Seismic Data Processing and Interpretation
  • 4D Reservoir Monitoring
  • Multi-Client Data Licensing

By End-Use Industry

  • Deepwater Exploration
  • Onshore Unconventional
  • Offshore Wind Site Characterization
  • Gas Import Infrastructure Planning
  • National Oil Company Programs

By Commercial Dimension

  • Proprietary Single-Client Survey
  • Multi-Client Data Licensing
  • Multi-Year Monitoring Agreement
  • Technology Licensing Partnership

By Region

  • North America
  • Western Europe
  • East Asia
  • South Asia and Pacific
  • Latin America
  • Middle East and Africa
  • Eastern Europe

Scope, Methodology, and Coverage

Every figure in this report is reproducible from documented input assumptions. The scope below maps the historical period, the forecast horizon, the segmentation dimensions, and the countries covered, alongside the underlying primary and qualitative methodology.
Historical Period
2020 to 2025
Forecast Period
2026 to 2036
Base Year
2025 (USD billions; MMA Primary Research Dataset, September 2026)
Market Definition
This report covers seismic acquisition, processing, and reservoir monitoring services purchased by exploration and production operators across land, shallow-water, and deepwater basins. It excludes seismic equipment manufacturing revenue and downstream reservoir engineering software not tied directly to seismic data interpretation.
Quantitative Units
USD billions (current prices); vessel-days and square kilometers surveyed where applicable
Segmentation Dimensions
By Service Type; By End-Use Industry; By Commercial Dimension; By Region
Regions Covered
North America, Western Europe, East Asia, South Asia and Pacific, Latin America, Middle East and Africa, Eastern Europe
Countries Covered
USA, China, Germany, France, UK, Japan, South Korea, India, Australia, Canada, Brazil, Mexico, Indonesia, Vietnam, Thailand, Malaysia, UAE, Saudi Arabia, South Africa, Nigeria, Turkey, Poland, Netherlands, Italy, Spain, Sweden, Switzerland, Argentina, Colombia, Singapore, and additional markets relevant to this sector
Key Companies Profiled
SLB, CGG, TGS, PGS, BGP Inc, Shearwater GeoServices, Magseis Fairfield, SAExploration, Geokinetics, Dawson Geophysical, ARKeX, RXT, China Oilfield Services, Sinopec Geophysical, Halliburton, DUG Technology, Foster Findlay Associates, Geotrace Technologies, Petroleum Geo-Data Management, ExploGeo
Quantitative Methodology
Primary survey, n=3,800 respondents, Q4 2025, six countries; demand-side model with trade association cross-validation
Qualitative Methodology
47 expert interviews, Q4 2025; applied to validate demand model assumptions, identify emerging dynamics, and assess competitive positioning
Report Format
PDF and XLSX data workbook (Word format preview document)
Publisher
Market Minds Advisory
Report Code
MMA-2026-ENE-732
Published
September 2026
Contact
sales@marketmindsadvisory.com | www.marketmindsadvisory.com

Purchase the full Seismic Services Market Report (2026 to 2036).

This report provides comprehensive analysis of the global seismic services market, covering acquisition technology, data processing, and reservoir monitoring services across all major offshore and onshore basins worldwide. It includes detailed segmentation by service type, end-use industry, and commercial dimension. Regional analysis spans seven geographies, alongside competitive profiling of the twenty largest global providers active in the market today. The report draws on primary survey data from 3,800 respondents and 47 expert interviews conducted in the fourth quarter of 2025, supplemented by company disclosures and government energy statistics.
Ten-year global market sizing and forecast
Seven-region demand share and pricing analysis
Twenty-company competitive benchmarking and profiling assessment
Segment-level growth rate and margin data
Input cost and supply chain risk assessment
Case study with recommended provider strategy

Built For The People Who Decide

From boardroom strategy to bench-side execution, this report is read cover-to-cover by leaders shaping the next decade of their industry, turning demand scenarios, market dynamics and valuation benchmarks into decisions.
CXOs/ Presidents/ VPs/ Managers
M&A and Corporate Development
Strategy Teams and R&D Heads
Procurement and Product Directors
Regulatory and Compliance Leaders
Investor Relations and Equity Analysts