Market Minds Advisory
Seed Coating Material Market

Seed Coating Material Market: Dust-Off Regulation, Treatment Recipe Qualification and Biological Payload Delivery

Dust-off limits imposed after pollinator losses rewrote coating chemistry across two continents, while biological payload delivery turned the seed itself into the cheapest application platform any agricultural input has ever had.

Lead Analyst

Lisa Gevelber

Published

September 2026

Make Smarter Decisions with Customized Research Insights

Request a free sample report and evaluate market opportunities, growth trends, and competitive dynamics relevant to your business needs.

2025 MARKET VALUE$2.6BMarket Size 2025
2036 FORECAST VALUE$5.2BBase Case , 2026 to 2036
CAGR 2026 TO 20366.6 %Bull 7.8% / Bear 5.4%
INCREMENTAL OPPORTUNITY$2.5BNet 10- year value creation
EXPANSION MULTIPLE1.89x2036 value over 2026 base
Strategic Levers
M&A Pipeline
Regional Outlook
Country Rankings
Competitive Intelligence
Segmental Deep-dive
Call-Us : 91 93563 13602

Executive Snapshot and Market Trajectory

Regulators worried about pollinators are the reason this market looks the way it does. Dust-off limits forced a chemistry change across two continents, and polymer coating was the only practical answer formulators could reach for at the time. Agronomy had very little to do with it at all.
Polymer film coatings carry the growth because they hold the payload, control release and cut dust, which is three jobs from one material. Biological coatings grow nearly as fast on the argument that seed application uses a fraction of the material broadcast soil treatment needs. North America holds the largest share on treated acreage and on seed company concentration that puts qualification decisions in very few hands.
Concentration reads at 54% for the top five, and it reflects how few companies can supply a qualified coating system with the regulatory documentation seed companies require. Qualification into a treatment recipe takes eighteen months and is rarely revisited, which makes incumbency unusually durable here and makes the growth in biological payloads the main opening any challenger has. Regional formulators are also building capability at price points European supply cannot reach.
Market Definition
This market covers materials applied to seed surfaces to bind, protect and deliver treatments, spanning polymer film coatings, colourants and pigments, binders and adhesives, pellet and encrustment fillers, and biological carrier systems. Crop protection active ingredients, fertiliser products applied to soil, seed genetics and traits, and seed treatment application equipment are excluded from the sizing.
Base Year Value
$2.6B in 2025 (MMA Primary Research Dataset, August 2026)
Forecast Period
2026 to 2036, eleven discrete annual values
CAGR
6.6% base case. Bull 7.8%. Bear 5.4%.
Fastest Growth Segment
Polymer Film Coatings: 9.9% CAGR
Fastest Growth Country
Brazil: 9.4% CAGR
Fastest Growth Region
South Asia and Pacific: 8.8% CAGR
Largest Region
North America: 29% of 2025 global value
Market Leaders
BASF, Bayer, Croda International, Clariant and Germains Seed Technology lead on seed coating material revenue. Source: MMA Primary Research Dataset, July 2026.
Primary Survey
n=3,800 procurement and R&D decision-makers, Q4 2025, six countries
Methodology
Demand-side build-up, cross-validated against public data, 47 expert interviews

Seed Coating Material Market Forecast Scenarios

seed-coating-material-market-report-size-forecast-scenario-1787335799927
Growth ran at 5.7% annually between 2020 and 2025, and regulation set the pace throughout rather than agriculture doing it. Dust-off limits following pollinator concerns forced reformulation across European and North American treatment recipes, and every reformulation was an opportunity for a coating supplier. Commodity price swings moved treated acreage year to year, but the chemistry change ran underneath all of it.
The base case at 6.6% rests on three mechanisms. Polymer coating adoption continues spreading into crops and regions where seed treatment was previously minimal, particularly across South America. Biological payload delivery expands as shelf life problems get solved and as European policy pushes reduced synthetic input use. And seed company consolidation raises treatment sophistication, since larger operations run treatment recipes their smaller predecessors never had the capability to apply. Each is already visible in current order books.
The bull case at 7.8% turns on European biological input policy tightening further and accelerating the shift from broadcast application onto the seed. The bear case at 5.4% reflects sustained low grain prices cutting treated acreage, since coating is among the first inputs a grower drops when margins compress and the decision is made crop by crop.

Regulation Rewrote This Chemistry, Not Agronomy

Nothing about agronomy explains this market's recent history. Regulators concerned about neonicotinoid dust reaching pollinators imposed hard limits on particle release during seed handling, and every treatment recipe in Europe and North America had to be reformulated to meet them. Polymer film coating was the only practical answer, and demand followed the rule rather than any grower preference.
TOP FIVE CONCENTRATION54%High, reflecting how few suppliers carry full regulatory documentation
COATING COST PER HECTARE$4.20Typical coating material outlay across treated commercial row crop
TREATED SEED PENETRATION63%Share of commercial row crop seed receiving any coating
QUALIFICATION CYCLE18 monthsTypical time to qualify a coating into a treatment recipe
POLYMER COST SHARE37% of COGSPolymer resin contribution to finished coating manufactured cost
DUST-OFF LIMIT0.75 g per 100kgRegulatory ceiling on particle release during seed handling
Qualification is what makes the resulting positions valuable. A coating system enters a seed company's treatment recipe after roughly eighteen months of compatibility work, dust testing, flowability trials and regulatory documentation, and once it is in nobody revisits it without a reason. The seed company gains nothing from switching and carries real risk if a new system behaves differently in a planter. Incumbency here is unusually durable.
Biological payload delivery is where the next argument sits. Applying rhizobia or mycorrhizal fungi to the seed uses a small fraction of the material that broadcast soil application consumes, which matters enormously at current biological pricing. The constraint has always been keeping living organisms viable through storage and handling rather than proving they work, and polymer and osmoprotectant systems have improved that considerably.
"This is a chemistry business that a pollinator study reorganised. The suppliers who read that regulatory direction early are inside treatment recipes today, and the ones who waited are still explaining why their dust numbers are fine."
Director, Agricultural Inputs and Crop Science Practice · MMA Agricultural Inputs Practice · August 2026

Market Trends

Dust-Off Regulation Forced Polymer Chemistry Across Treatment Recipes

Particle release during seed handling was implicated in pollinator exposure, and European and North American regulators responded with hard limits rather than guidance. Every affected treatment recipe required reformulation, and polymer film coating was the only practical route to compliance available to formulators at the time. That single rule change created more coating demand than a decade of agronomic argument had managed. Suppliers who anticipated the direction sit inside qualified recipes today, while those who waited are still competing to be evaluated at all. That single rule did what agronomy never could.
Market Impact: Brazil grows at 9.4% annually

Seed Becomes The Cheapest Biological Application Platform Available

Broadcast soil application of biologicals consumes material in quantities that make the economics difficult at current pricing, while seed application uses a small fraction of it and places the organism precisely where the root will develop. The technical obstacle was never efficacy but survival through storage, handling and planting, and polymer and osmoprotectant systems have extended viability considerably. Biological carrier coatings now grow at 8.4% annually. European policy pushing reduced synthetic input use adds a tailwind few agricultural inputs currently enjoy. Cold chain arrangements now cover the highest value biological products.
Market Impact: Qualification runs 18 months typically

Market Opportunities and Growth Drivers

South American Treated Acreage Expands Faster Than Anywhere

Brazilian soybean and maize acreage keeps expanding while treatment sophistication rises from a base well below North American practice, which produces growth near 9.4% annually and makes this the most commercially interesting region in the market. Double cropping raises the number of seed treatment events per hectare per year, which most acreage comparisons miss entirely. Argentine and Paraguayan demand follows similar patterns. Local coating formulation capacity is also developing, which shortens supply chains that previously ran from Europe. Seed companies there increasingly expect local technical support rather than remote formulation advice.
Market Impact: Volume falls 14% in weak years

Seed Company Consolidation Raises Treatment Recipe Sophistication

Treatment decisions now sit with a small number of large seed companies running centralised recipe development rather than with the many regional operations that preceded them. Those organisations apply more sophisticated multi-component recipes, demand full regulatory documentation from suppliers, and qualify materials through processes taking roughly 18 months. That concentrates the customer base considerably and raises the barrier for any new coating supplier. It also means a single qualification decision now covers far more acreage than it did a decade ago. The regional teams making pragmatic local decisions have largely disappeared.
Market Impact: Viability drops 30% within 6 months

Market Restraints and Challenges

Grain Price Weakness Cuts Treated Acreage Immediately

Coating is among the first inputs a grower drops when crop margins compress, because the decision is made crop by crop and the saving is immediate and visible. The root cause is that coating benefits are probabilistic and preventive while the cost is certain and upfront, which is a difficult argument in a poor year. Commercially this makes volume considerably more cyclical than the underlying acreage suggests. Participants are responding with tiered product ranges, with seed company contracts covering multiple seasons, and by weighting toward crops where treatment is effectively mandatory.
Market Impact: Limits set at 0.75 grams

Biological Payload Shelf Life Limits Commercial Deployment

Living organisms applied to seed must remain viable through storage, distribution, handling and planting, and shelf life rather than efficacy has always been the limiting factor. The root cause is that seed sits in warehouses through variable temperature and humidity for months before it reaches a planter. Commercially this restricts biological coatings to shorter supply chains and narrows the addressable acreage considerably. Participants are responding with osmoprotectant systems, encapsulation chemistry, and cold chain arrangements for the higher value biological products where the economics justify it. Cold chain economics only work above a price threshold.
Market Impact: Uses 5% of broadcast material volume
3 additional market trends, 4 additional growth drivers, and 2 additional restraints and challenges are covered in the full report. Contact sales@marketmindsadvisory.com to access the complete intelligence.

Segment CAGR and Growth Architecture

Five material families divide this market on what the coating component actually is rather than on the crop it ends up serving. That choice is deliberate, because crop-based cuts obscure the commercial reality: a polymer supplier and a colourant supplier compete in entirely different ways and face completely different qualification barriers. The barriers differ more than the chemistry does.
seed-coating-material-market-report-market-share-analysis-1787335800481

Polymer Film Coatings

Growing at 9.9% and the fastest part of this market. Polymer coatings are what hold everything else onto the seed, and they have moved well beyond that basic function into controlled release, moisture management and dust reduction. Regulatory pressure did most of the work here: European and North American authorities forced dust-off limits after neonicotinoid particles were implicated in pollinator losses, and polymer chemistry was the only practical answer available to formulators. Film-forming acrylics and polyvinyl systems dominate the volume. What makes this segment commercially attractive is that polymer choice is qualified into a seed company's treatment recipe and rarely revisited afterwards, which gives incumbents a position competitors find genuinely difficult to displace.
CAGR 9.9%

Biological Carrier Coatings

Growing at 8.4% on biological coatings carrying rhizobia, mycorrhizal fungi, phosphate-solubilising bacteria and biostimulant actives applied to the seed rather than to the soil. Seed application uses a fraction of the material that broadcast soil treatment requires, which is the entire commercial argument and a genuinely strong one at current biological pricing. The technical problem is survival: living organisms must remain viable on a seed through storage, handling and planting, and shelf life has historically been the limiting factor rather than efficacy. Polymer and osmoprotectant systems have improved that considerably. European regulatory support for reduced synthetic input use adds a policy tailwind that few agricultural inputs currently enjoy. Policy support is genuine here.
CAGR 8.4%
Full segment breakdown across 5 segments available in the complete report.

Regional Architecture and Country Demand Map

North America holds 29% of global value on treated acreage penetration and seed company concentration that places qualification decisions in very few hands. East Asia follows at 24% on Chinese rice and maize volume, while Latin America grows fastest on Brazilian acreage expansion and double cropping intensity.

North America

Treated seed penetration is higher here than anywhere and the seed company base is concentrated enough that qualification decisions sit with a handful of technical teams. That makes winning a position slow and losing one rare. Maize and soybean acreage dominates volume, with cotton and sugar beet contributing disproportionately high value per hectare because their treatment recipes are considerably more complex. Environmental Protection Agency attention to dust-off drove the polymer chemistry change that reshaped the market. Distribution runs through seed companies and treatment facilities rather than reaching growers directly. Canadian canola treatment is a genuine specialty position, with recipes built around a crop that behaves unlike anything grown further south.
Share: 29% | CAGR: 6.0% (2026 to 2036)

East Asia

Chinese rice and maize acreage supplies most of the volume here, though treatment penetration sits well below North American levels and the gap is where the growth comes from. Government programmes promoting seed quality and standardised treatment have raised adoption steadily, and domestic coating formulators have scaled to serve it. Hybrid rice seed carries higher value coating recipes because seed cost per hectare justifies the treatment investment. Japanese and Korean demand is smaller, technically demanding and weighted toward vegetable and specialty seed where pelleting and encrustment matter more than film coating. Regional quality expectations have risen sharply over the past five years. Domestic formulators now supply most of the volume at prices imports cannot match.
Share: 24% | CAGR: 7.6% (2026 to 2036)
Regional intelligence for 5 additional markets available in the complete report: Western Europe, South Asia and Pacific, Latin America, Middle East and Africa, Eastern Europe. Contact sales@marketmindsadvisory.com.
seed-coating-material-market-report-country-cagr-analysis-1787335801011

Where Coating Suppliers Actually Earn Returns

Four positions separate suppliers earning durable returns from those quoting against tender on price per kilogram: qualifying into treatment recipes before competitors are evaluated, carrying full regulatory documentation, solving biological viability, and building formulation capacity inside South America where acreage growth actually sits. Only the third of those remains a genuinely open contest today.

Qualify Into Treatment Recipes Before Competitors Are Evaluated

A coating system enters a seed company recipe after roughly 18 months of compatibility work, dust testing, flowability trials and documentation, and once inside nobody revisits it without a reason to. The seed company gains nothing from switching and carries genuine planter risk if a new system behaves differently. Suppliers holding qualified positions realise 22% to 28% higher pricing than those quoting against tender, on volumes predictable enough to plan production against. Technical service capability is what wins these, not price. Price is what unqualified suppliers are left arguing about.
Market Impact: Realises 28% higher pricing on qualified recipe volume

Carry Full Regulatory Documentation As Entry Requirement

Large seed companies will not evaluate a coating material without complete registration dossiers, safety data and dust-off testing across the jurisdictions they plant in, and that requirement has removed a great many smaller formulators from consideration entirely. Building the capability costs roughly 6% of revenue annually for a mid-sized supplier and takes years to assemble. What it buys is access to the only customers whose qualification decisions cover meaningful acreage, which is the whole commercial game here. Smaller formulators frequently discover this only after being excluded from an evaluation entirely.
Market Impact: Registration capability costs roughly 6% of annual revenue

Solve Biological Viability Through Storage And Handling

Seed application uses roughly 5% of the material that broadcast soil treatment consumes, which is a decisive economic argument at current biological pricing. The obstacle has never been efficacy but viability through months of warehouse storage at variable temperature. Osmoprotectant and encapsulation systems that extend viability materially open acreage no biological product can currently reach. Suppliers solving it hold a position competitors cannot copy from a datasheet, because the formulation work is specific to each organism and each carrier system. Partnership rather than internal build is the faster route for most.
Market Impact: Opens acreage using only 5% of broadcast material

Build Formulation Capacity Inside South American Markets

Brazilian acreage grows at 9.4% annually with double cropping raising treatment events per hectare beyond what acreage figures suggest, and supply chains running from European plants carry both freight cost and currency exposure that local formulation removes entirely. On-farm treatment is also common there, which requires simpler and more forgiving systems developed close to the customer. Local blending capacity typically cuts delivered cost by 12% to 18% while shortening lead times that seed companies increasingly treat as a selection criterion. The capital must precede the volume, which is the difficult half.
Market Impact: Cuts delivered cost by up to 18% regionally

Who Controls the Margin Pool

Concentration reads at 54% for the top five measured on seed coating material revenue, the basis used throughout this section, and it reflects documentation capability more than manufacturing scale. BASF and Bayer supply coating systems alongside the crop protection actives those systems carry. Croda and Clariant bring specialty chemistry. Germains built a position on seed technology services that neither chemical group replicates easily.
Competition runs on three fronts. Recipe qualification is the first and by far the most decisive, since a qualified supplier is difficult to displace and an unqualified one is not really competing at all. Regulatory documentation is the second, and it has become an entry requirement rather than a differentiator. Biological carrier capability is the third and the only genuinely open contest in the market.

Pressure arrives from two directions. Seed company consolidation puts qualification decisions with fewer, more demanding technical teams that expect full documentation and multi-jurisdiction registration. Separately, regional formulators in Brazil, India and China are building capability at price points European supply cannot reach. Rankings will shift toward suppliers holding biological viability solutions and local formulation capacity in growth regions.
seed-coating-material-market-report-company-positioning-matrix-1787335801725

Competitive Moat and Risk Dimensions

BASF

Moat: Coating and active together

Supplying coating systems alongside the crop protection actives those coatings carry lets the group develop both together and present seed companies with a validated combination rather than components requiring compatibility work. Registration capability across every major jurisdiction also meets documentation requirements that have removed smaller formulators from consideration entirely at large seed companies.
BASF

Risk: Active ingredient regulatory exposure

Coating demand tied to crop protection actives inherits the regulatory risk attached to those actives, and European restrictions have already removed several from the market entirely. Biological payload growth also favours specialists with organism-specific formulation experience over broad chemical capability, which is not where a large chemical group's advantage naturally sits.
CRODA INTERNATIONAL

Moat: Specialty polymer formulation depth

Deep formulation capability in film-forming polymers and surface chemistry supports the dust-off performance regulators now require, and that expertise transfers directly into biological carrier systems where surface conditions determine organism survival. Qualified positions inside treatment recipes built over many years give the business volume predictability that spot suppliers never achieve.
CRODA INTERNATIONAL

Risk: Limited crop protection integration

Without crop protection actives of its own the business supplies coating components into recipes designed around somebody else's chemistry, which puts it a step further from the seed company decision than integrated competitors sit. Petrochemical feedstock exposure also moves polymer input cost in ways contracts cannot fully absorb.

Players Tracked

Prominent Players

BASF
Bayer
Croda International
Clariant
Germains Seed Technology

Other Key Players

Syngenta
Corteva Agriscience
Sumitomo Chemical
Nufarm
Solvay
Milliken
Sensient Technologies
Precision Laboratories
Centor Group
Chromatech Incorporated
Bejo Zaden
Incotec
Rotam
UPL Limited
Volkschem

Recent Developments

MARCH 2025

Extended viability biological carrier system launched commercially

A coating supplier launched an osmoprotectant carrier system extending rhizobia viability on treated seed well beyond conventional shelf life, addressing the storage constraint that had restricted biological coatings to short supply chains and limited addressable acreage considerably. Field trials across two seasons supported the claim.
Signal: Viability rather than efficacy has always been the commercial barrier for biological seed application at commercial scale
JUNE 2025

Brazilian formulation plant commissioned for regional coating supply

A specialty coating producer commissioned a formulation and blending facility in Brazil, shortening a supply chain that previously ran from European plants and removing the freight cost and currency exposure that made imported coating pricing difficult to hold steady. Capacity serves regional demand from 2026.
Signal: Local formulation is becoming a selection criterion as seed companies weigh lead time alongside delivered material cost
SEPTEMBER 2025

Dust-off testing protocol harmonised across member state authorities

European authorities harmonised dust-off measurement protocols across member states, replacing the varying national methods that had forced suppliers to document the same coating system several times over and delayed qualification into multi-country treatment recipes. Several suppliers had delayed multi-country submissions until the harmonisation was confirmed.
Signal: Harmonised testing lowers documentation cost for suppliers already carrying full registration capability across multiple European jurisdictions

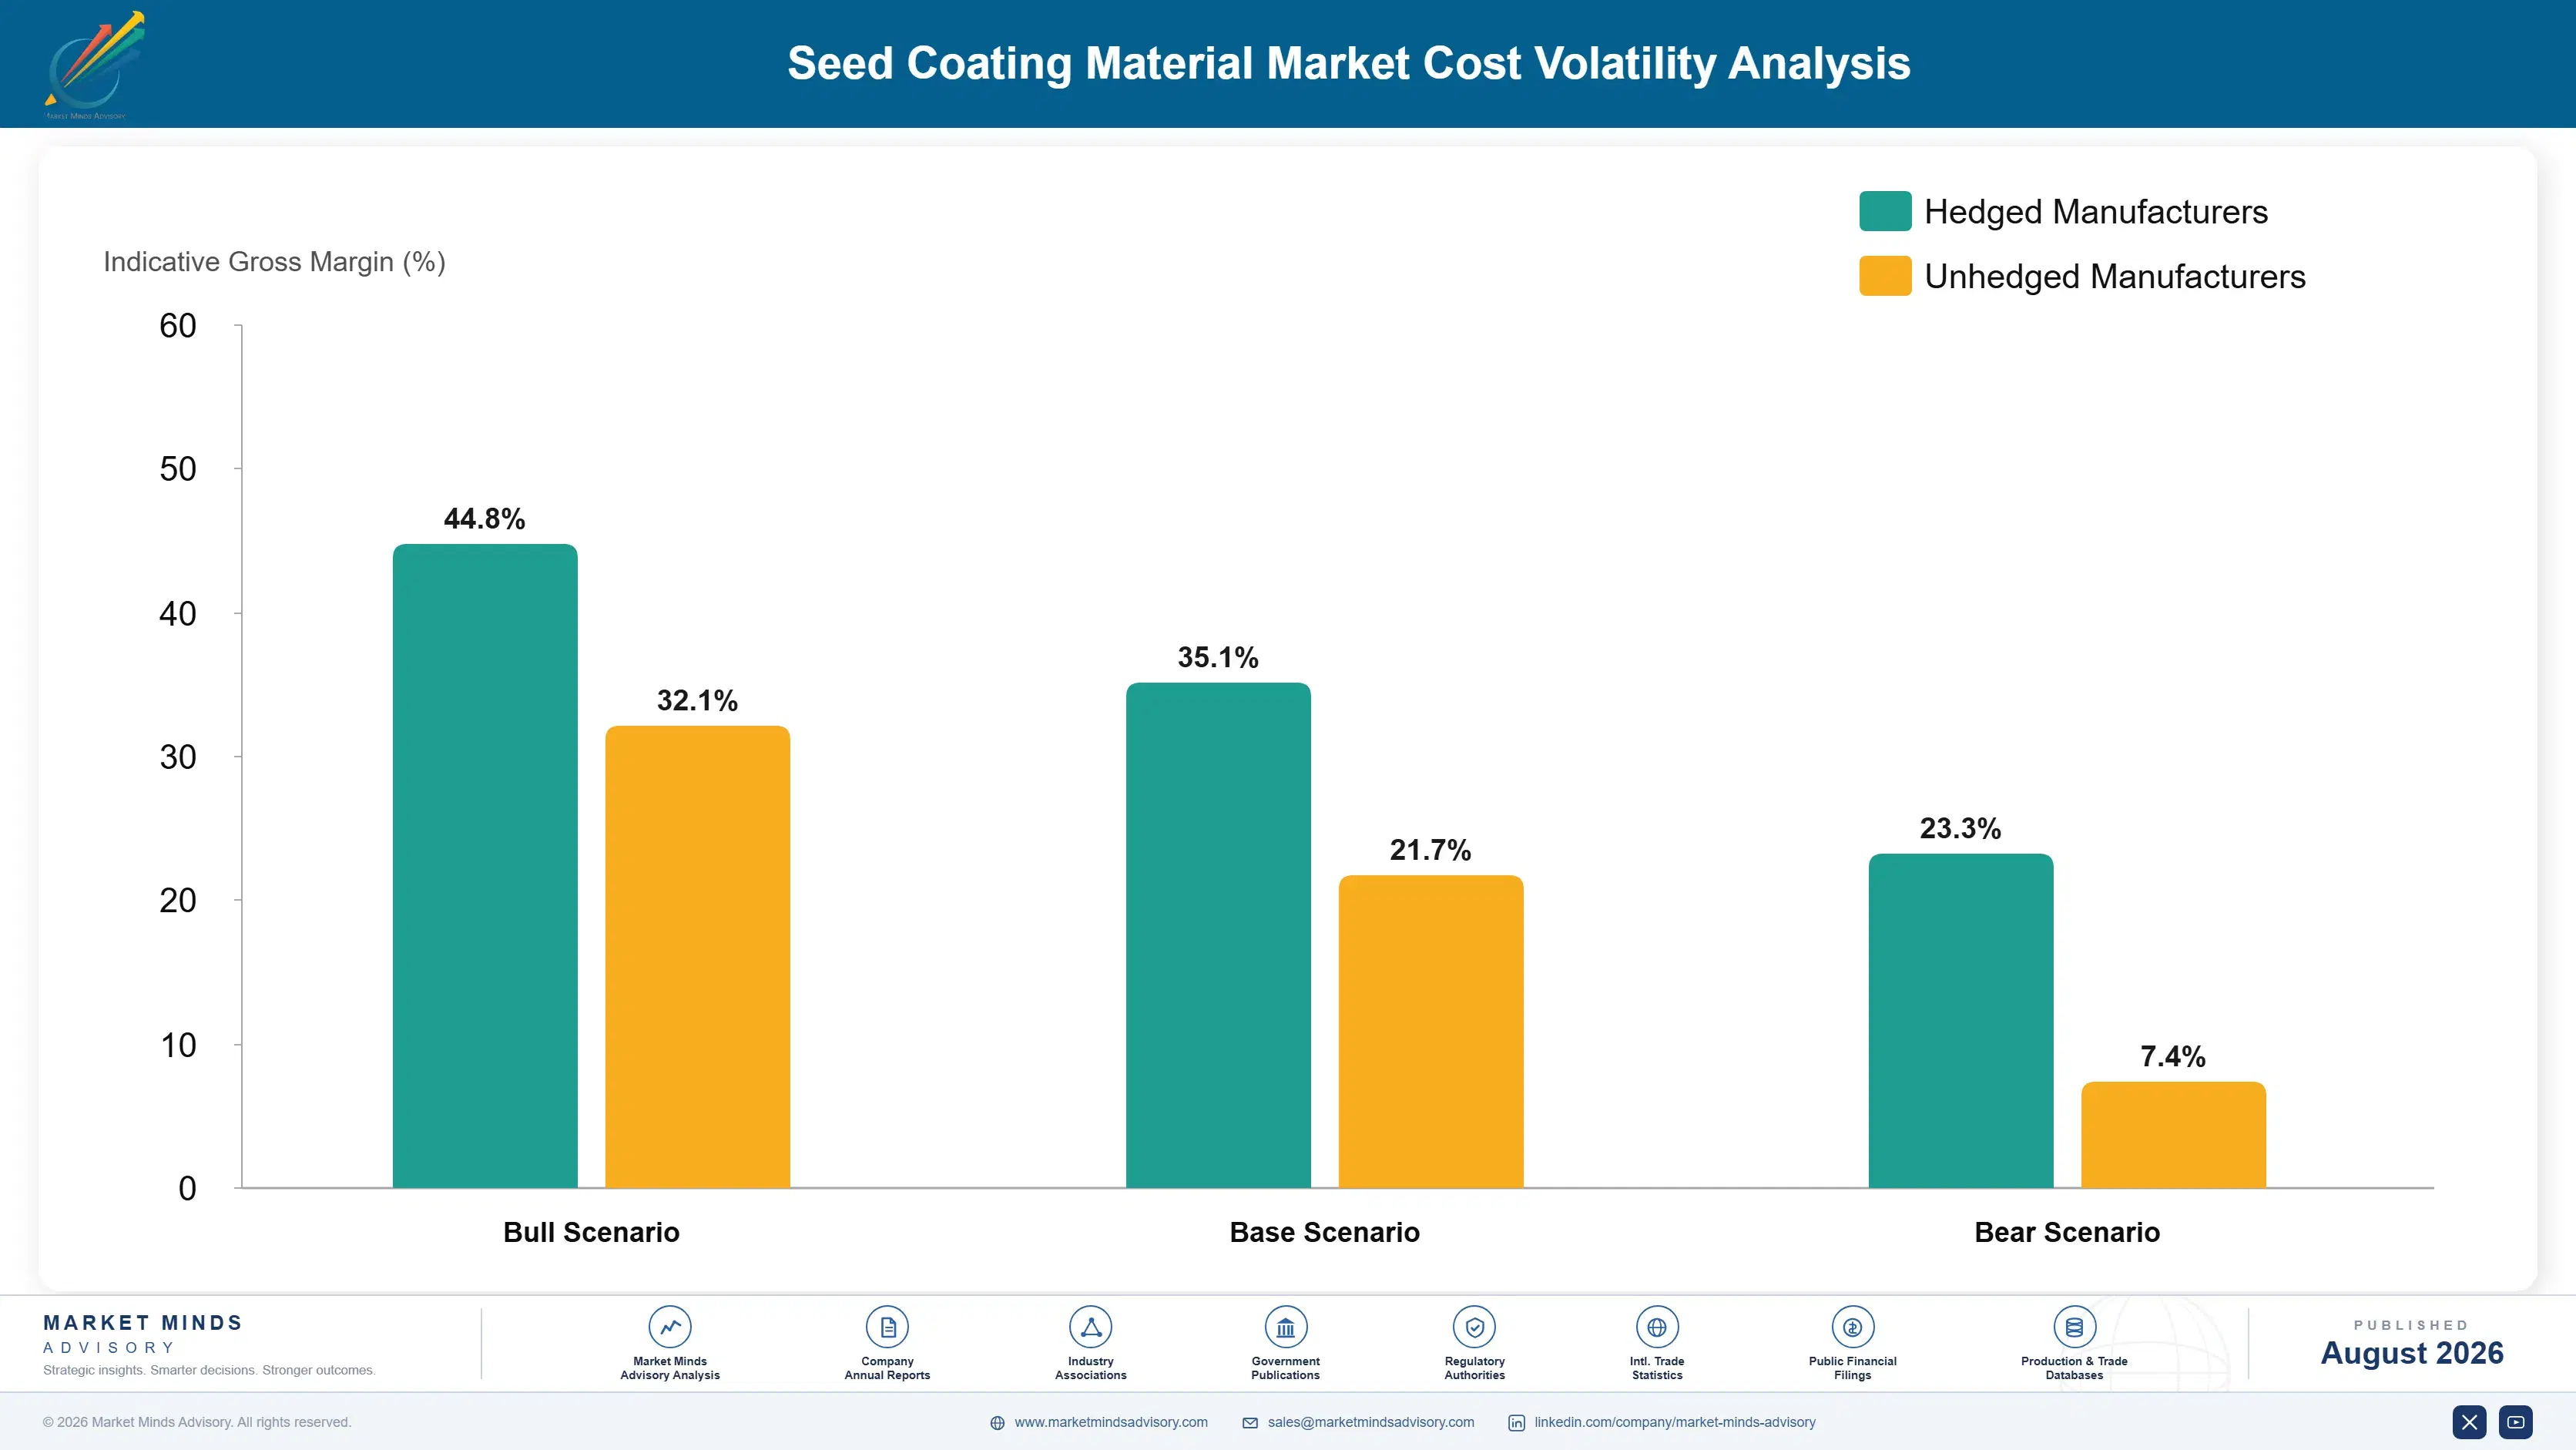
What Drives Coating Material Cost

Polymer resin accounts for roughly 37% of manufactured cost, drawn from petrochemical feedstock chains that price independently of anything happening in agriculture. Pigments and colourants add around 16%, with titanium dioxide and organic pigment supply concentrated among few producers. Specialty additives and surfactants contribute about 14%, packaging and logistics roughly 12%, and registration, testing and regulatory maintenance close to 9% across a typical product line.
European petrochemical feedstock pricing rose sharply through 2022 and has remained above the previous decade's baseline since, according to International Energy Agency energy market data, which fed directly into acrylic and polyvinyl resin costs. Titanium dioxide pricing moved separately on producer capacity decisions. Coating suppliers passed most of it through as annual seed company contracts renewed, though with a lag that compressed margins across two seasons.

The disadvantage mechanism is registration cost spread across volume, and it falls hardest on smaller formulators. Maintaining dossiers across multiple jurisdictions costs roughly 6% of revenue for a mid-sized supplier and considerably more as a share for a small one, which is why documentation requirements have removed so many from consideration. Exposure also varies by geography, since regional formulators serving single markets carry a fraction of the registration burden.
seed-coating-material-market-report-cost-volatility-analysis-1787335802062

Contract polymer resin volume on annual committed terms

Resin represents over a third of manufactured cost and prices on petrochemical chains that move independently of agricultural demand, which makes spot exposure genuinely uncomfortable across a season. Annual contracted volume secures predictable cost against seed company contracts that are themselves annual. The commitment carries volume risk when treated acreage falls, which happens quickly whenever grain prices weaken.

Spread registration cost across a wider product portfolio

Dossier maintenance across jurisdictions costs roughly 6% of revenue for a mid-sized supplier, and much of that cost is fixed per jurisdiction rather than per product. Widening the qualified portfolio spreads it across more revenue without proportionally raising the burden. The requirement is products worth registering, which means formulation development running ahead of the regulatory work rather than behind it.

Formulate regionally to cut freight and currency exposure

Shipping finished coating from European plants into South American and Asian markets carries freight cost and currency exposure that local blending removes, typically cutting delivered cost by 12% to 18%. It also shortens lead times that seed companies increasingly weigh as a selection criterion. Regional capacity requires capital and quality systems, and volume must justify it beforehand.

Portfolio Architecture for Margin Defence

Portfolio economics here divide on qualification status rather than on chemistry. Unqualified material quoted against tender competes purely on price per kilogram, and since the seed company has no switching incentive the quote usually exists to discipline the incumbent rather than to win anything at all. That is an uncomfortable position on which to build any business at all.
The middle tier is qualified polymer systems inside named treatment recipes. Eighteen months of compatibility work, dust testing and documentation produce a position rarely revisited, with realised pricing 22% to 28% above tender material and volumes predictable enough to plan production against. Margins reach the low thirties and hold across contract cycles because displacement is rare. Displacement happens rarely and usually for a supply reason.

Above both sits biological carrier systems with proven viability. Seed application uses roughly 5% of the material broadcast treatment consumes, the formulation work is organism-specific and cannot be copied from a datasheet, and margins reach the mid forties. The position requires viability science and cold chain understanding that chemical formulation capability alone does not supply, which is why it remains the most open contest in this market.

Volume / Commodity-Adjacent

Unqualified coating material quoted against tender on price per kilogram. The range reflects resin feedstock cost rather than anything the supplier controls commercially, and the quote often exists only to discipline an incumbent.
Gross Margin: 14 to 21%

Premium / Certified

Qualified polymer systems inside named treatment recipes with full documentation. The range reflects how deep the technical relationship runs and whether a second source sits qualified alongside in the same recipe.
Gross Margin: 28 to 36%

Sustainability / Regulatory / Next-Generation

Biological carrier systems with demonstrated viability through storage and handling. The wide range reflects whether viability is genuinely solved for the organism concerned or merely improved against conventional carriers. Few suppliers hold it.
Gross Margin: 39 to 49%
seed-coating-material-market-report-portfolio-architecture-1787335802725

High-value Sub-segments and Strategic Watch-out

Biological Carrier Systems

High value and high growth together. Seed application uses roughly 5% of broadcast material and the formulation work is organism-specific rather than copyable. The wide range reflects whether viability is genuinely solved or merely improved against conventional carriers. Partnership rather than internal build is the common route in.
Gross Margin: 39 to 49%

Qualified Polymer Film Systems

High value on steady growth and the most defensible ordinary position here. Eighteen months of qualification produces a recipe place rarely revisited. The range reflects technical relationship depth and whether a competing second source is qualified alongside. Displacement is genuinely rare once a treatment recipe is set.
Gross Margin: 28 to 36%

Colourant And Pelleting Volume

The volume core of this market and where most tonnage sits. Pigment and filler supply is competitive but qualification still applies to the recipe. The range reflects pigment input cost and whether specialty pelleting expertise accompanies the supply. Pigment concentration limits how far pricing can move.
Gross Margin: 20 to 27%

Tender Quoted Commodity Material

The strategic watch-out. Volumes look real on a tender document but conversion is poor, the incumbent usually holds, and pricing discipline sits entirely with the buyer. The range reflects resin feedstock cost rather than any commercial decision. Winning here usually means the incumbent chose to lose.
Gross Margin: 14 to 21%

How Coating Demand Actually Repeats

Qualified recipe positions behave like annuities and almost nothing else here does. Once a coating system sits inside a seed company treatment recipe it repeats every season the recipe is run, which is typically years, because the seed company gains nothing from switching and carries planter risk if a new system flows differently. Unqualified supply repeats only when a tender happens to go the right way.
Stickiness varies sharply by crop. Sugar beet and vegetable pelleting hold best, since recipes are complex, value per hectare is high and reformulation risk is unacceptable to seed companies. Cotton and canola hold well for similar reasons. Maize and soybean volume is stickier than its commodity character suggests once qualified, though it is also the volume most exposed when grain prices weaken and growers cut treatment.

The buyer profile has changed considerably. Coating decisions once sat with many regional seed operations making them locally and pragmatically. They now sit with a small number of centralised technical teams inside consolidated seed companies, applying formal qualification processes and demanding multi-jurisdiction documentation. That raises the barrier for new suppliers while making each individual qualification decision cover far more acreage than before.
seed-coating-material-market-report-end-use-penetration-index-1787335803250

Where To Compete And Why

These are among the four positions where our research anticipates prominent divergence between winners and laggards over the coming forecast period. Each is grounded in the demand model, the regulatory perimeter, and the announced capacity pipeline.
01 / RECIPE QUALIFICATION DISCIPLINE

Eighteen months buys years of volume

A coating system enters a seed company treatment recipe after roughly 18 months of compatibility work, dust testing, flowability trials and documentation, and once inside nobody revisits it without a specific reason to do so. The seed company gains nothing from switching and carries genuine planter risk if a new system behaves differently in the field. Qualified suppliers realise 22% to 28% higher pricing than tender material, on volumes predictable enough to plan production against properly, and technical service rather than price is what wins them.
02 / REGISTRATION CAPABILITY BUILDING

Documentation is the entry requirement

Large seed companies will not evaluate coating material without complete registration dossiers, safety data and dust-off testing across every jurisdiction they plant in, which has removed a great many smaller formulators from consideration entirely. Maintaining that capability costs roughly 6% of revenue annually for a mid-sized supplier and takes years to assemble properly. What it buys is access to the only customers whose qualification decisions cover meaningful acreage anywhere in this market, which is effectively the whole commercial game and always has been.
03 / BIOLOGICAL VIABILITY SOLVING

Storage kills organisms, not efficacy

Seed application uses roughly 5% of the material that broadcast soil treatment consumes, which is a decisive argument at current biological pricing and always has been. The obstacle was never efficacy but viability through months of warehouse storage at variable temperature and humidity before planting. Osmoprotectant and encapsulation work is organism-specific and cannot be copied from a datasheet, which makes it the most defensible position available in this market and gives whoever solves it something competitors cannot simply buy from a catalogue.
04 / REGIONAL FORMULATION POSITIONING

Brazil grows, European freight does not

Brazilian acreage grows at 9.4% annually with double cropping raising treatment events per hectare well beyond what simple acreage comparisons capture, and supply chains running from European plants carry freight and currency exposure that local blending removes entirely. Regional formulation typically cuts delivered cost by 12% to 18% while shortening lead times seed companies now weigh as a selection criterion. The capital commitment must precede the volume it serves, which is the genuinely difficult part of the whole decision to make.

Engagement Snapshot From the Field

A live engagement with an industry participant carrying material or product regulatory and market exposure ahead of a defining policy shift, showing how our research translates into a defensible multi-year portfolio strategy.
MARKET MINDS ADVISORY · CLIENT ENGAGEMENT SUMMARY
Seed Coating Material Producer Strategic Portfolio Review and Transition Roadmap 2026·Investment Scenario on Seed Coating Material Exposure Evaluation 2025-26
CLIENT PROFILE
A European specialty seed coating formulator with annual revenue near $84 million (client-reported, unverified by MMA), roughly 78% of it from polymer film coatings and colourants supplied into European treatment recipes. The business held strong formulation capability and several qualified positions, but almost no presence in South America and no biological carrier products at all.
STRATEGIC CHALLENGE
European acreage was flat while Brazilian demand grew rapidly, and the client's delivered pricing in South America was uncompetitive against locally formulated material once freight and currency were counted. Management needed to decide between defending European positions, building Brazilian formulation capacity, or developing biological carrier systems where the technical contest remained open.
MMA APPROACH
MMA modelled realised margin by qualification status across four years of the client's own sales data, benchmarked delivered cost into Brazil against locally formulated competitors, and assessed the biological viability development requirement. Twenty-one expert interviews with seed company technical leads, treatment facility managers and biological developers tested how qualification decisions are genuinely made.
KEY FINDINGS
  1. Qualified recipe positions delivered realised margins roughly 19 percentage points above tender-quoted material and had survived an average of more than six years without any seed company revisiting them.
  2. Delivered cost into Brazil ran 21% above locally formulated competitors once freight and currency were counted properly, which no amount of technical argument was going to overcome commercially.
  3. Every seed company technical lead interviewed treated registration documentation as a precondition for evaluation, and several had removed suppliers from consideration for incomplete dossiers alone.
  4. Biological carrier development was assessed as within the client's formulation capability, but required viability testing infrastructure and organism handling experience the business did not currently have.
CLIENT PROFILE
A European specialty seed coating formulator with annual revenue near $84 million (client-reported, unverified by MMA), roughly 78% of it from polymer film coatings and colourants supplied into European treatment recipes. The business held strong formulation capability and several qualified positions, but almost no presence in South America and no biological carrier products at all.
STRATEGIC CHALLENGE
European acreage was flat while Brazilian demand grew rapidly, and the client's delivered pricing in South America was uncompetitive against locally formulated material once freight and currency were counted. Management needed to decide between defending European positions, building Brazilian formulation capacity, or developing biological carrier systems where the technical contest remained open.
MMA APPROACH
MMA modelled realised margin by qualification status across four years of the client's own sales data, benchmarked delivered cost into Brazil against locally formulated competitors, and assessed the biological viability development requirement. Twenty-one expert interviews with seed company technical leads, treatment facility managers and biological developers tested how qualification decisions are genuinely made.
KEY FINDINGS
  1. Qualified recipe positions delivered realised margins roughly 19 percentage points above tender-quoted material and had survived an average of more than six years without any seed company revisiting them.
  2. Delivered cost into Brazil ran 21% above locally formulated competitors once freight and currency were counted properly, which no amount of technical argument was going to overcome commercially.
  3. Every seed company technical lead interviewed treated registration documentation as a precondition for evaluation, and several had removed suppliers from consideration for incomplete dossiers alone.
  4. Biological carrier development was assessed as within the client's formulation capability, but required viability testing infrastructure and organism handling experience the business did not currently have.
RECOMMENDED STRATEGY
Phase 1: Phase one: widen the qualified European portfolio to spread fixed registration cost across more revenue, since the dossier burden is largely per jurisdiction rather than per product. Phase 2: Phase two: establish Brazilian blending capacity to close the delivered cost gap, accepting the capital commitment ahead of the volume it serves. Phase 3: Phase three: partner rather than build for biological viability testing, acquiring organism handling experience and testing capability without funding the specialist infrastructure alone.
OUTCOME
The client added five qualified positions across two seasons and commissioned Brazilian blending capacity that cut delivered cost by roughly 17% (client-reported, unverified by MMA). South American revenue reached $11 million in the first full year, blended gross margin improved by about five points, and a biological carrier partnership was signed in early 2026.

Frequently Asked Questions

Foundational context covering the market sizes, CAGR, scope, country, region and competition that inform every finding below. This section is provided to cover basics and most often pre-purchase conversations, answered from the MMA Primary Research Dataset.

What is the current size of the Seed Coating Material Market?

The global seed coating material market was valued at $2.60 billion in 2025, reaching an estimated $2.77 billion in 2026. That covers polymers, colourants, binders, fillers and biological carriers applied to seed.

How large will the Seed Coating Material Market be by 2036?

MMA forecasts the market reaching $5.25 billion by 2036, an increase of $2.48 billion over the 2026 base. That represents an expansion multiple of 1.89 times across the forecast period.

What is the CAGR for the Seed Coating Material Market 2026 to 2036?

The base case compound annual growth rate is 6.6%, with a bull case of 7.8% and a bear case of 5.4%. Historical growth between 2020 and 2025 ran at 5.7% annually.

Which segment is growing fastest?

Polymer film coatings grow at 9.9%, a full 1.50 times the market rate, driven by dust-off regulation that forced reformulation across treatment recipes. Biological carrier coatings follow at 8.4% annually.

Who are the major companies in the Seed Coating Material Market?

BASF, Bayer, Croda International, Clariant and Germains Seed Technology lead on seed coating material revenue. Together they account for roughly 54% of global value, which is high for specialty chemistry.

Which country is growing fastest?

Brazil grows fastest at 9.4% annually, driven by expanding soybean and maize acreage and double cropping that raises treatment events per hectare each year. India follows closely behind.

Report Segmentation Architecture

The full report scope spans multiple orthogonal segmentation dimensions, with cross-tabulated demand data provided for each dimension pair. Coverage extends further to regional breakdowns, trend trajectories, and the competitive detail needed to support segment-level decision-making.

By Material Type

  • Polymer Film Coatings
  • Colourants and Pigments
  • Binders and Adhesives
  • Pellet and Encrustment Fillers
  • Biological Carrier Coatings

By End-Use Industry

  • Maize and Soybean Row Crop
  • Cereals and Small Grains
  • Cotton and Fibre Crops
  • Sugar Beet and Root Crops
  • Vegetable and Horticultural Seed
  • Oilseeds and Sunflower

By Commercial Dimension

  • Direct Supply to Seed Companies
  • Commercial Seed Treatment Facilities
  • Distributor and Dealer Channel
  • On-Farm Treatment Supply
  • Contract Formulation and Toll Blending

By Region

  • North America
  • Western Europe
  • East Asia
  • South Asia and Pacific
  • Latin America
  • Middle East and Africa
  • Eastern Europe

Scope, Methodology, and Coverage

Every figure in this report is reproducible from documented input assumptions. The scope below maps the historical period, the forecast horizon, the segmentation dimensions, and the countries covered, alongside the underlying primary and qualitative methodology.
Historical Period
2020 to 2025
Forecast Period
2026 to 2036
Base Year
2025 (USD billions; MMA Primary Research Dataset, August 2026)
Market Definition
This report covers materials applied to seed surfaces to bind, protect, identify and deliver treatments, spanning polymer film coatings, colourants and pigments, binders and adhesives, pellet and encrustment fillers, and biological carrier coatings, across direct seed company supply, commercial treatment facilities, distribution and on-farm application. Crop protection active ingredients themselves, soil-applied fertiliser and biological products, seed genetics and traits, seed treatment application equipment, and seed conditioning services are excluded from the sizing.
Quantitative Units
USD billions at supplier realised value; volume in thousand tonnes; coating cost in USD per hectare treated.
Segmentation Dimensions
By material type; by end-use industry; by commercial dimension; by region.
Regions Covered
North America, Western Europe, East Asia, South Asia and Pacific, Latin America, Middle East and Africa, Eastern Europe
Countries Covered
United States, Canada, Brazil, Argentina, Mexico, France, Germany, Netherlands, Italy, Spain, Poland, Ukraine, Turkey, China, Japan, India, Australia, Thailand, Egypt, South Africa.
Key Companies Profiled
BASF, Bayer, Croda International, Clariant, Germains Seed Technology, Syngenta, Corteva Agriscience, Sumitomo Chemical, Nufarm, Solvay, Milliken, Sensient Technologies, Incotec, UPL Limited and others.
Quantitative Methodology
Primary survey, n=3,800 respondents, Q4 2025, six countries; demand-side model with trade association cross-validation
Qualitative Methodology
47 expert interviews, Q4 2025; applied to validate demand model assumptions, identify emerging dynamics, and assess competitive positioning
Report Format
PDF and XLSX data workbook (Word format preview document)
Publisher
Market Minds Advisory
Report Code
MMA-2026-AGR-082
Published
August 2026
Contact
sales@marketmindsadvisory.com | www.marketmindsadvisory.com

Purchase the full Seed Coating Material Market Report (2026 to 2036).

The full report sizes the seed coating material market across five material types, six crop categories and seven regions, with tonnage and cost per hectare detail behind every value estimate. It profiles twenty companies on qualification position, registration capability and biological carrier readiness. Regional chapters cover treated acreage, dust-off regulation and seed company structure by market. Cost analysis quantifies resin, pigment and registration exposure by supplier scale. Regulatory analysis maps dust-off limits and biological input policy across the major jurisdictions, with testing protocol detail included.
Tonnage and cost per hectare by material type
Dust-off regulation and testing protocols across jurisdictions
Qualification cycle benchmarking across coating suppliers
Treated acreage and penetration rates by crop
Competitive position assessments across twenty companies
Biological carrier viability and shelf life analysis

Built For The People Who Decide

From boardroom strategy to bench-side execution, this report is read cover-to-cover by leaders shaping the next decade of their industry, turning demand scenarios, market dynamics and valuation benchmarks into decisions.
CXOs/ Presidents/ VPs/ Managers
M&A and Corporate Development
Strategy Teams and R&D Heads
Procurement and Product Directors
Regulatory and Compliance Leaders
Investor Relations and Equity Analysts