Market Minds Advisory
Security Screening Market

Security Screening Market: Security Screening: Throughput Economics, Labour Cost and the Venue Market That False Alarms Will Decide

Staffing absorbs roughly 72% of screening operating cost, so equipment is bought to move people faster rather than to detect better. Detection is assumed; throughput is what actually gets funded and measured.

Lead Analyst

Published

September 2026

Make Smarter Decisions with Customized Research Insights

Request a free sample report and evaluate market opportunities, growth trends, and competitive dynamics relevant to your business needs.

2025 MARKET VALUE$9.8BMarket Size 2025
2036 FORECAST VALUE$21.9BBase Case , 2026 to 2036
CAGR 2026 TO 20367.6 %Bull 8.8% / Bear 6.4%
INCREMENTAL OPPORTUNITY$11.4BNet 10- year value creation
EXPANSION MULTIPLE2.08x2036 value over 2026 base
Strategic Levers
M&A Pipeline
Regional Outlook
Country Rankings
Competitive Intelligence
Segmental Deep-dive
Call-Us : 91 93563 13602

Executive Snapshot and Market Trajectory.

Screening equipment is not bought to detect better. Detection is assumed and regulated. It is bought because staffing absorbs roughly 72% of operating cost, and anything that moves more people through a lane with fewer hands attached pays for itself quickly. Nobody funds a machine on detection alone.
Walkthrough weapons detection grows at 11.4%, half again the market rate of 7.6%, because venues can screen without asking anybody to empty their pockets, which changed stadium and school economics entirely. Checkpoint computed tomography follows at 10.2%, raising lane throughput around 31% by letting electronics and liquids stay in bags. North America takes 34% of value on venue deployment and checkpoint replacement together. Aviation replacement of equipment reaching 11 years continues underneath both.
Concentration sits near 52% across the top five on measured equipment and service revenue, protected by certification approvals running about 26 months. The venue segment is the one to watch and the one most likely to disappoint: false alarm rates near 8% destroy the throughput advantage that justified the purchase, and several deployments have already been reversed. Buyers are facility managers, and they measure what they bought.
Market Definition
This market covers equipment and associated services used to screen people, baggage, cargo and vehicles for prohibited items, spanning checkpoint computed tomography systems, hold baggage screening systems, walkthrough weapons detection systems, body scanning and personnel screening, explosive and narcotics trace detection, and cargo and vehicle inspection systems. Revenue is measured as equipment, software and attributable service value at supplier level. Screening personnel services, video surveillance, access control systems, perimeter intrusion detection, and laboratory analytical instrumentation are excluded.
Base Year Value
$9.8B in 2025 (MMA Primary Research Dataset, September 2026)
Forecast Period
2026 to 2036, eleven discrete annual values
CAGR
7.6% base case. Bull 8.8%. Bear 6.4%.
Fastest Growth Segment
Walkthrough Weapons Detection Systems: 11.4% CAGR
Fastest Growth Country
India: 11.6% CAGR
Fastest Growth Region
South Asia and Pacific: 9.8% CAGR
Largest Region
North America: 34% of 2025 global value
Market Leaders
Smiths Detection, Leidos, OSI Systems, Nuctech and Analogic lead on measured screening equipment and service revenue. Source: MMA Primary Research Dataset, July 2026.
Primary Survey
n=3,800 procurement and R&D decision-makers, Q4 2025, six countries
Methodology
Demand-side build-up, cross-validated against public data, 47 expert interviews

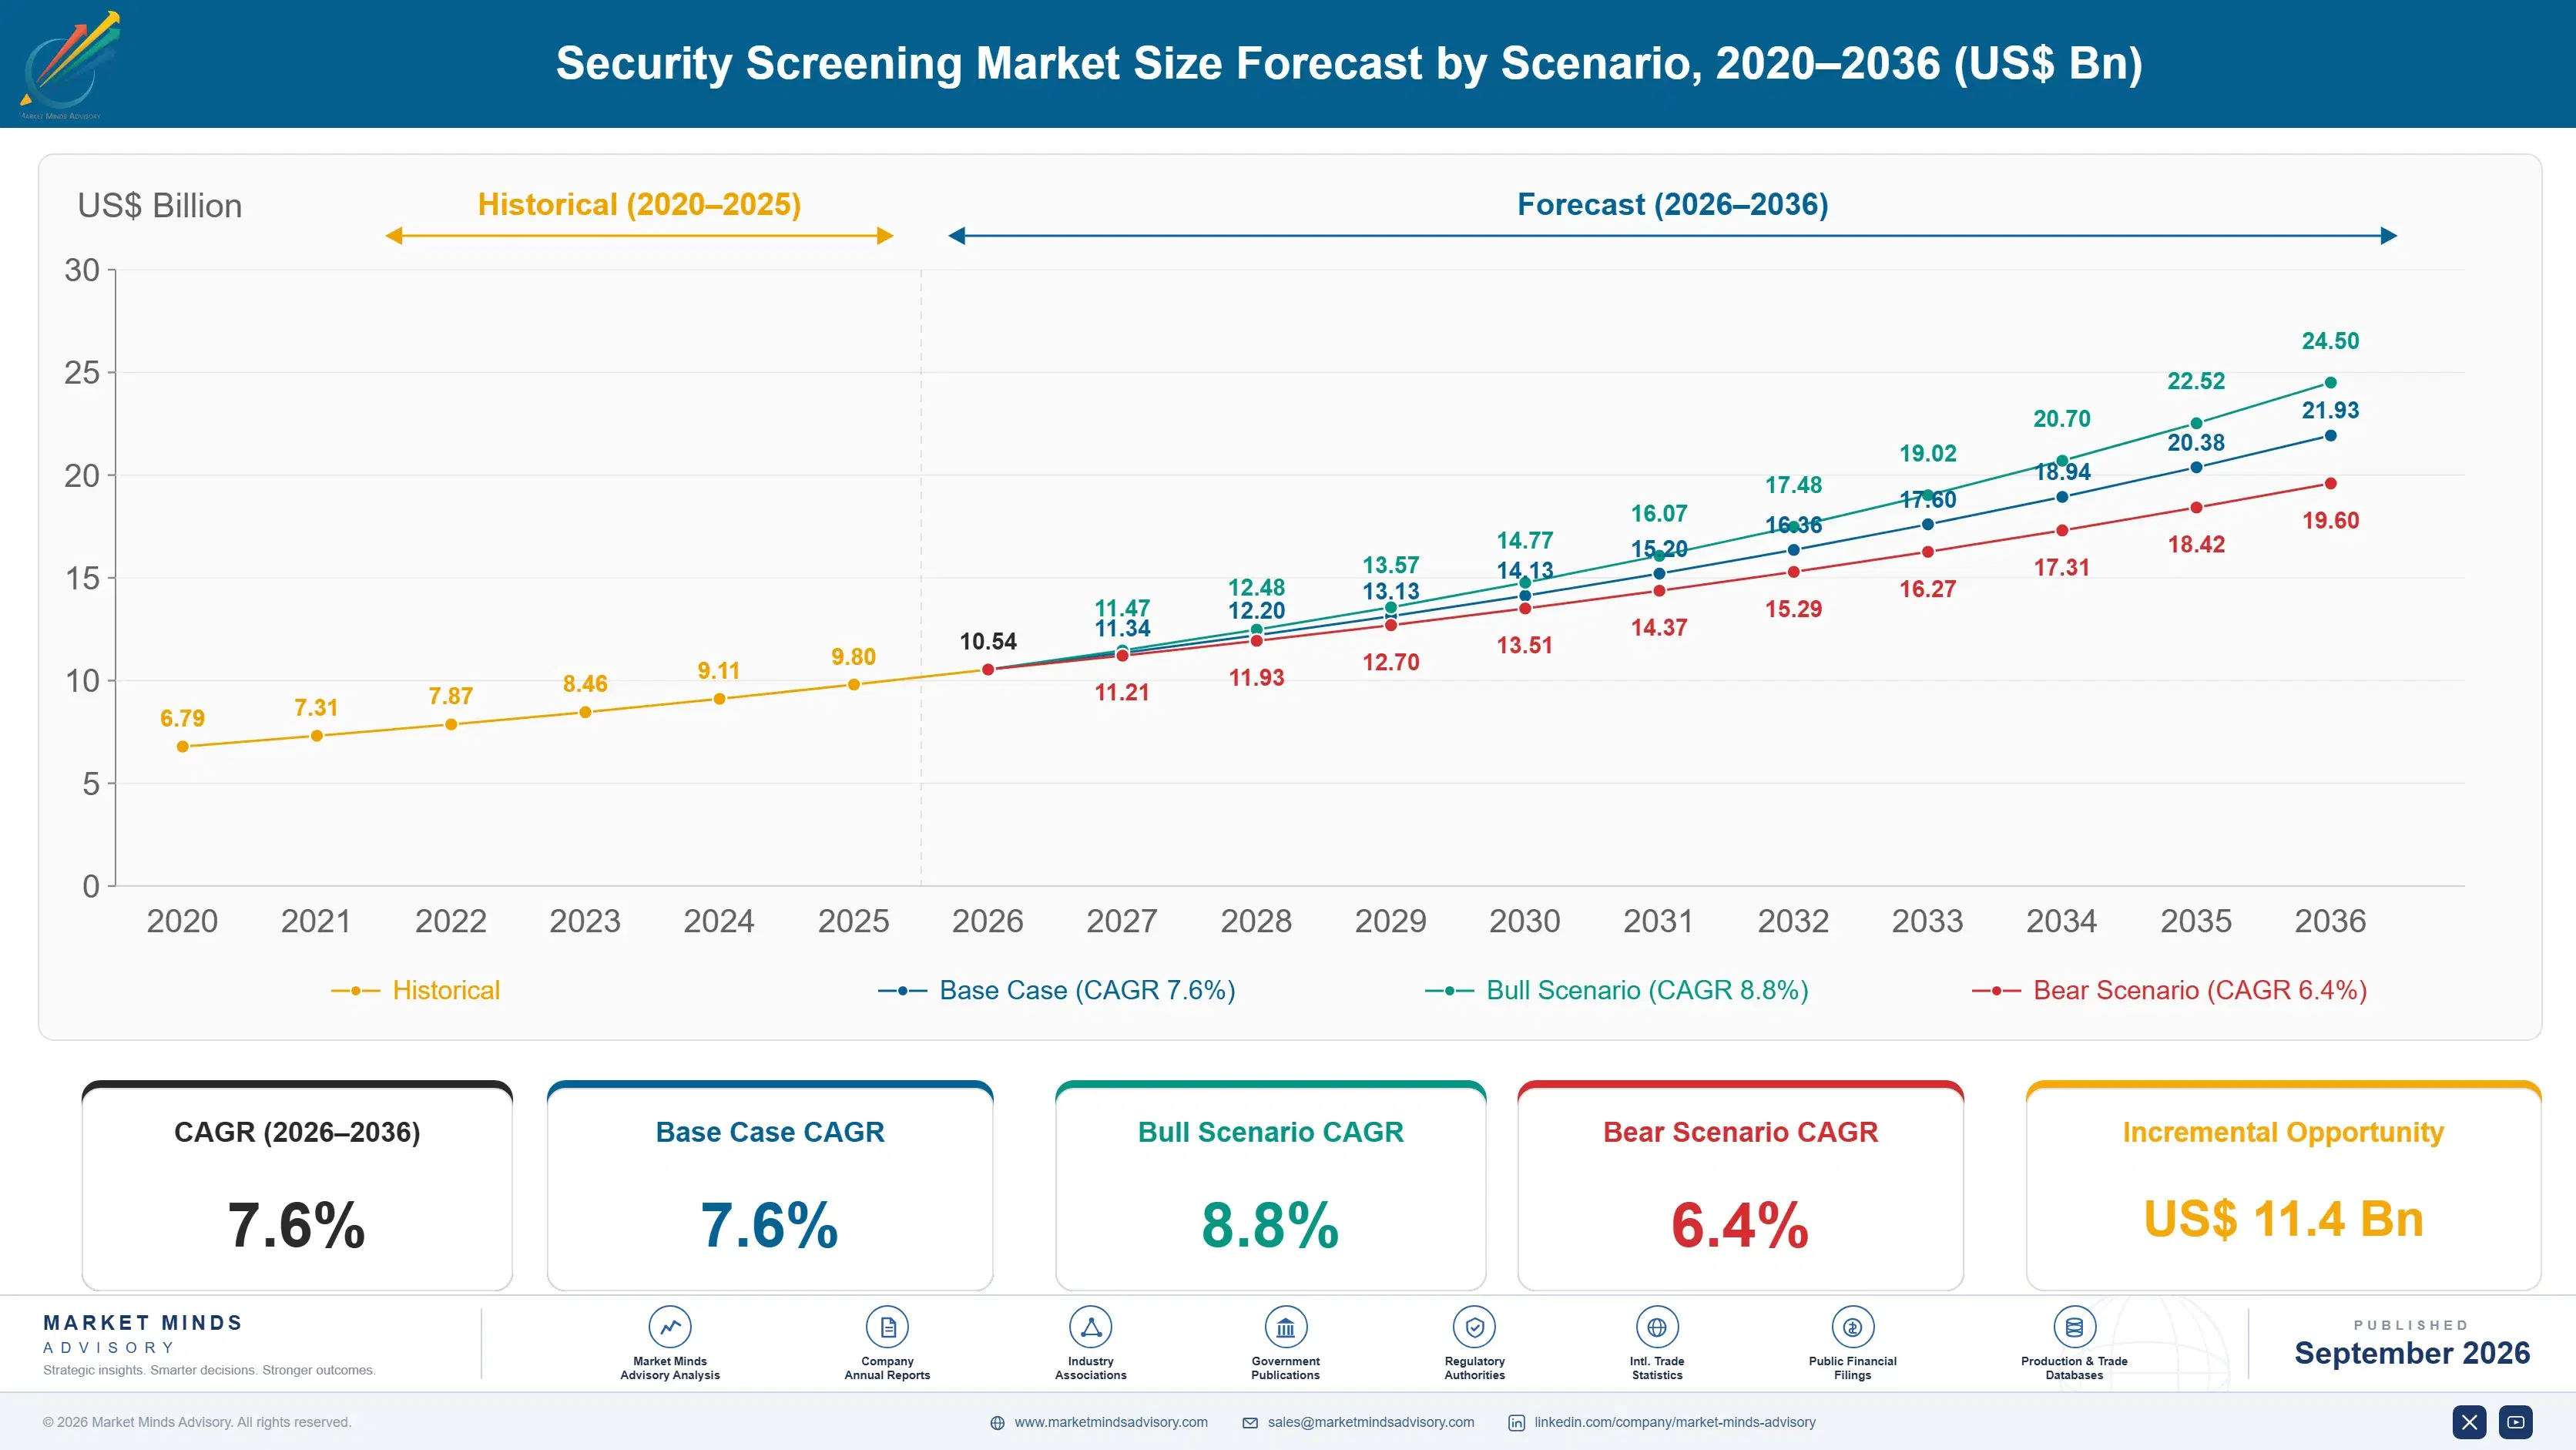
Security Screening Market Forecast Scenarios

security-screening-market-size-forecast-scenario-1788425267777
Growth ran at 6.4% from 2020 to 2025, held back at first by an aviation collapse that stopped procurement, then released as passenger volumes recovered faster than operators had planned. Checkpoint computed tomography programmes resumed across North America and Europe from 2022. What genuinely changed the market was walkthrough weapons detection reaching venues, which opened a buyer group that had never purchased screening equipment before.
The base case at 7.6% rests on three mechanisms. Labour at roughly 72% of screening operating cost makes throughput improvement the argument that reliably secures funding, and computed tomography delivers around 31% more passengers per lane. Venue screening expands beyond aviation into stadiums, schools, hospitals and transit, buying on visitor experience rather than on threat assessment. Third, equipment approaching the end of an 11 year service life across major aviation markets requires replacement regardless.
The bull case at 8.8% assumes venue adoption continues without a public failure, and that regulators approve remote and centralised screening allowing one operator to cover several lanes. The bear case at 6.4% is that venue false alarm rates near 8% produce enough visible rollbacks to stall the segment, leaving growth dependent on aviation replacement cycles that are predictable and slower.

Throughput Is the Product

Detection performance is a regulatory threshold rather than a competitive dimension. Equipment either meets the standard or cannot be sold, and once several do the buyer stops comparing detection. What the buyer compares is people. Staffing absorbs roughly 72% of screening operating cost, so a machine raising lane throughput 31% removes headcount from a budget line that dwarfs its own capital cost.
TOP FIVE CONCENTRATION52%Concentrated among established detection equipment manufacturers operating globally
CHECKPOINT THROUGHPUT GAIN31%Passengers processed per lane after computed tomography deployment
SCREENING LABOUR COST SHARE72%Operating expense attributable to staffing rather than to equipment
VENUE FALSE ALARM RATE8%Visitors requiring secondary inspection at typical venue deployments
EQUIPMENT SERVICE LIFE11 yearsTypical operating period before certified equipment requires replacement
CERTIFICATION APPROVAL TIME26 monthsDuration for regulatory approval of new screening equipment
That is why checkpoint computed tomography spread. Letting passengers keep electronics and liquids in bags removes the divest and re-pack steps that consumed most of the lane time. The image quality argument was real and secondary. Airports funded the programmes on queue length and staffing, and the regulators who approved the technology were pushing on a door the operators had already opened themselves.
Venue screening is the genuinely new thing and carries the clearest risk. Walkthrough systems letting visitors pass without emptying pockets transformed stadium and school entry economics, which is why the segment grows at 11.4%. False alarm rates near 8% are the problem. A system alarming on laptops, umbrellas and water bottles pushes visitors into secondary inspection and destroys the throughput it was bought to deliver. Several operators have removed equipment for that reason.
"The venue market was sold on the promise that nobody has to stop. When 8% of visitors are pulled aside anyway, you have built a slower queue with more equipment in it. The suppliers who survive this segment will be the ones who published honest alarm rates before a customer measured them."
Director, Detection Systems and Public Infrastructure Practice · MMA Technology Practice · September 2026

Market Trends

Venue Screening Opens a Buyer Group That Never Existed

Stadiums, schools, hospitals and transit operators are purchasing screening equipment for the first time, because walkthrough systems allow visitors to pass without emptying pockets or bags and therefore without the queue that made screening impossible at those entrances. The segment grows at 11.4%, faster than anything else here, and the purchase is justified on visitor experience and liability rather than on any threat assessment. Buyers are facility managers rather than security professionals. That changes the sales process, the specification and the expectations completely. Aviation suppliers built for government tendering find that sales process genuinely unfamiliar.
Market Impact: Absorbs 72% of operating cost
Remote Screening Separates the Operator From the Lane

Image analysis performed away from the checkpoint lets one operator review output from several lanes rather than standing at one, which attacks the 72% of operating cost that staffing represents more directly than any throughput improvement does. Regulatory approval is the constraint rather than the technology, since screening rules across most jurisdictions assume an operator physically present at the machine. Several European and Asian authorities have approved trials. Where it is permitted, operators report staffing reductions that make the equipment decision straightforward. Approval frameworks written before this was possible are the only obstacle left.
Market Impact: Raises throughput around 31%

Market Opportunities and Growth Drivers

Staffing Dominates Screening Operating Cost Everywhere

Labour absorbs roughly 72% of screening operating expense at a typical aviation checkpoint, which means equipment capital cost is a secondary consideration in almost every purchase decision that gets approved. A system raising throughput 31% per lane either processes more passengers with the same staff or the same passengers with fewer, and both outcomes reach the budget in the same place. Screening staff turnover is high and recruitment is difficult across most developed markets. That makes headcount reduction attractive independently of its cost saving. Equipment cost barely registers against the roster it displaces.
Market Impact: Alarms on 8% of visitors

Computed Tomography Removes the Divest Step

Allowing electronics and liquids to remain inside bags eliminates the divest and re-pack sequence that consumed most of the lane time and most of the passenger irritation at aviation checkpoints. Throughput rises around 31% per lane, and the improvement comes from process rather than from image processing speed. European approval frameworks and North American deployment programmes have both been running for several years now. The segment grows at 10.2% and its expansion is limited by capital budgets rather than by any remaining question about whether it works. Nobody argues about whether it works any more.
Market Impact: Requires 26 months for approval

Market Restraints and Challenges

Venue False Alarms Undo the Advantage They Were Sold On

Walkthrough systems at venues alarm on roughly 8% of visitors, frequently on laptops, umbrellas, spectacles cases and drink containers rather than on anything resembling a threat. The root cause is that detecting a concealed weapon without asking anybody to divest requires discriminating between metal objects on physics alone, which is genuinely hard. Commercially this pushes visitors into secondary inspection and rebuilds the queue the purchase was meant to remove. Suppliers mitigate through algorithm tuning and site-specific configuration, which helps and does not eliminate the underlying difficulty. Measurement usually arrives about a month after commissioning.
Market Impact: Fastest segment at 11.4% growth

Certification Timelines Freeze Entire Product Cycles

Regulatory approval for new screening equipment runs about 26 months across major aviation authorities, and approvals are jurisdiction-specific so a product cleared in one market must repeat much of the process elsewhere. The root cause is that approval requires physical testing against classified threat sets that only authorities hold. Commercially this makes product development slow, expensive and impossible to accelerate with additional spending. Suppliers mitigate by designing platforms that accommodate detection updates within an approved envelope, which preserves the approval while allowing genuine improvement. Product cycles here run considerably longer than in adjacent electronics.
Market Impact: Attacks 72% of operating cost
3 additional market trends, 4 additional growth drivers, and 2 additional restraints and challenges are covered in the full report. Contact sales@marketmindsadvisory.com to access the complete intelligence.

Segment CAGR and Growth Architecture

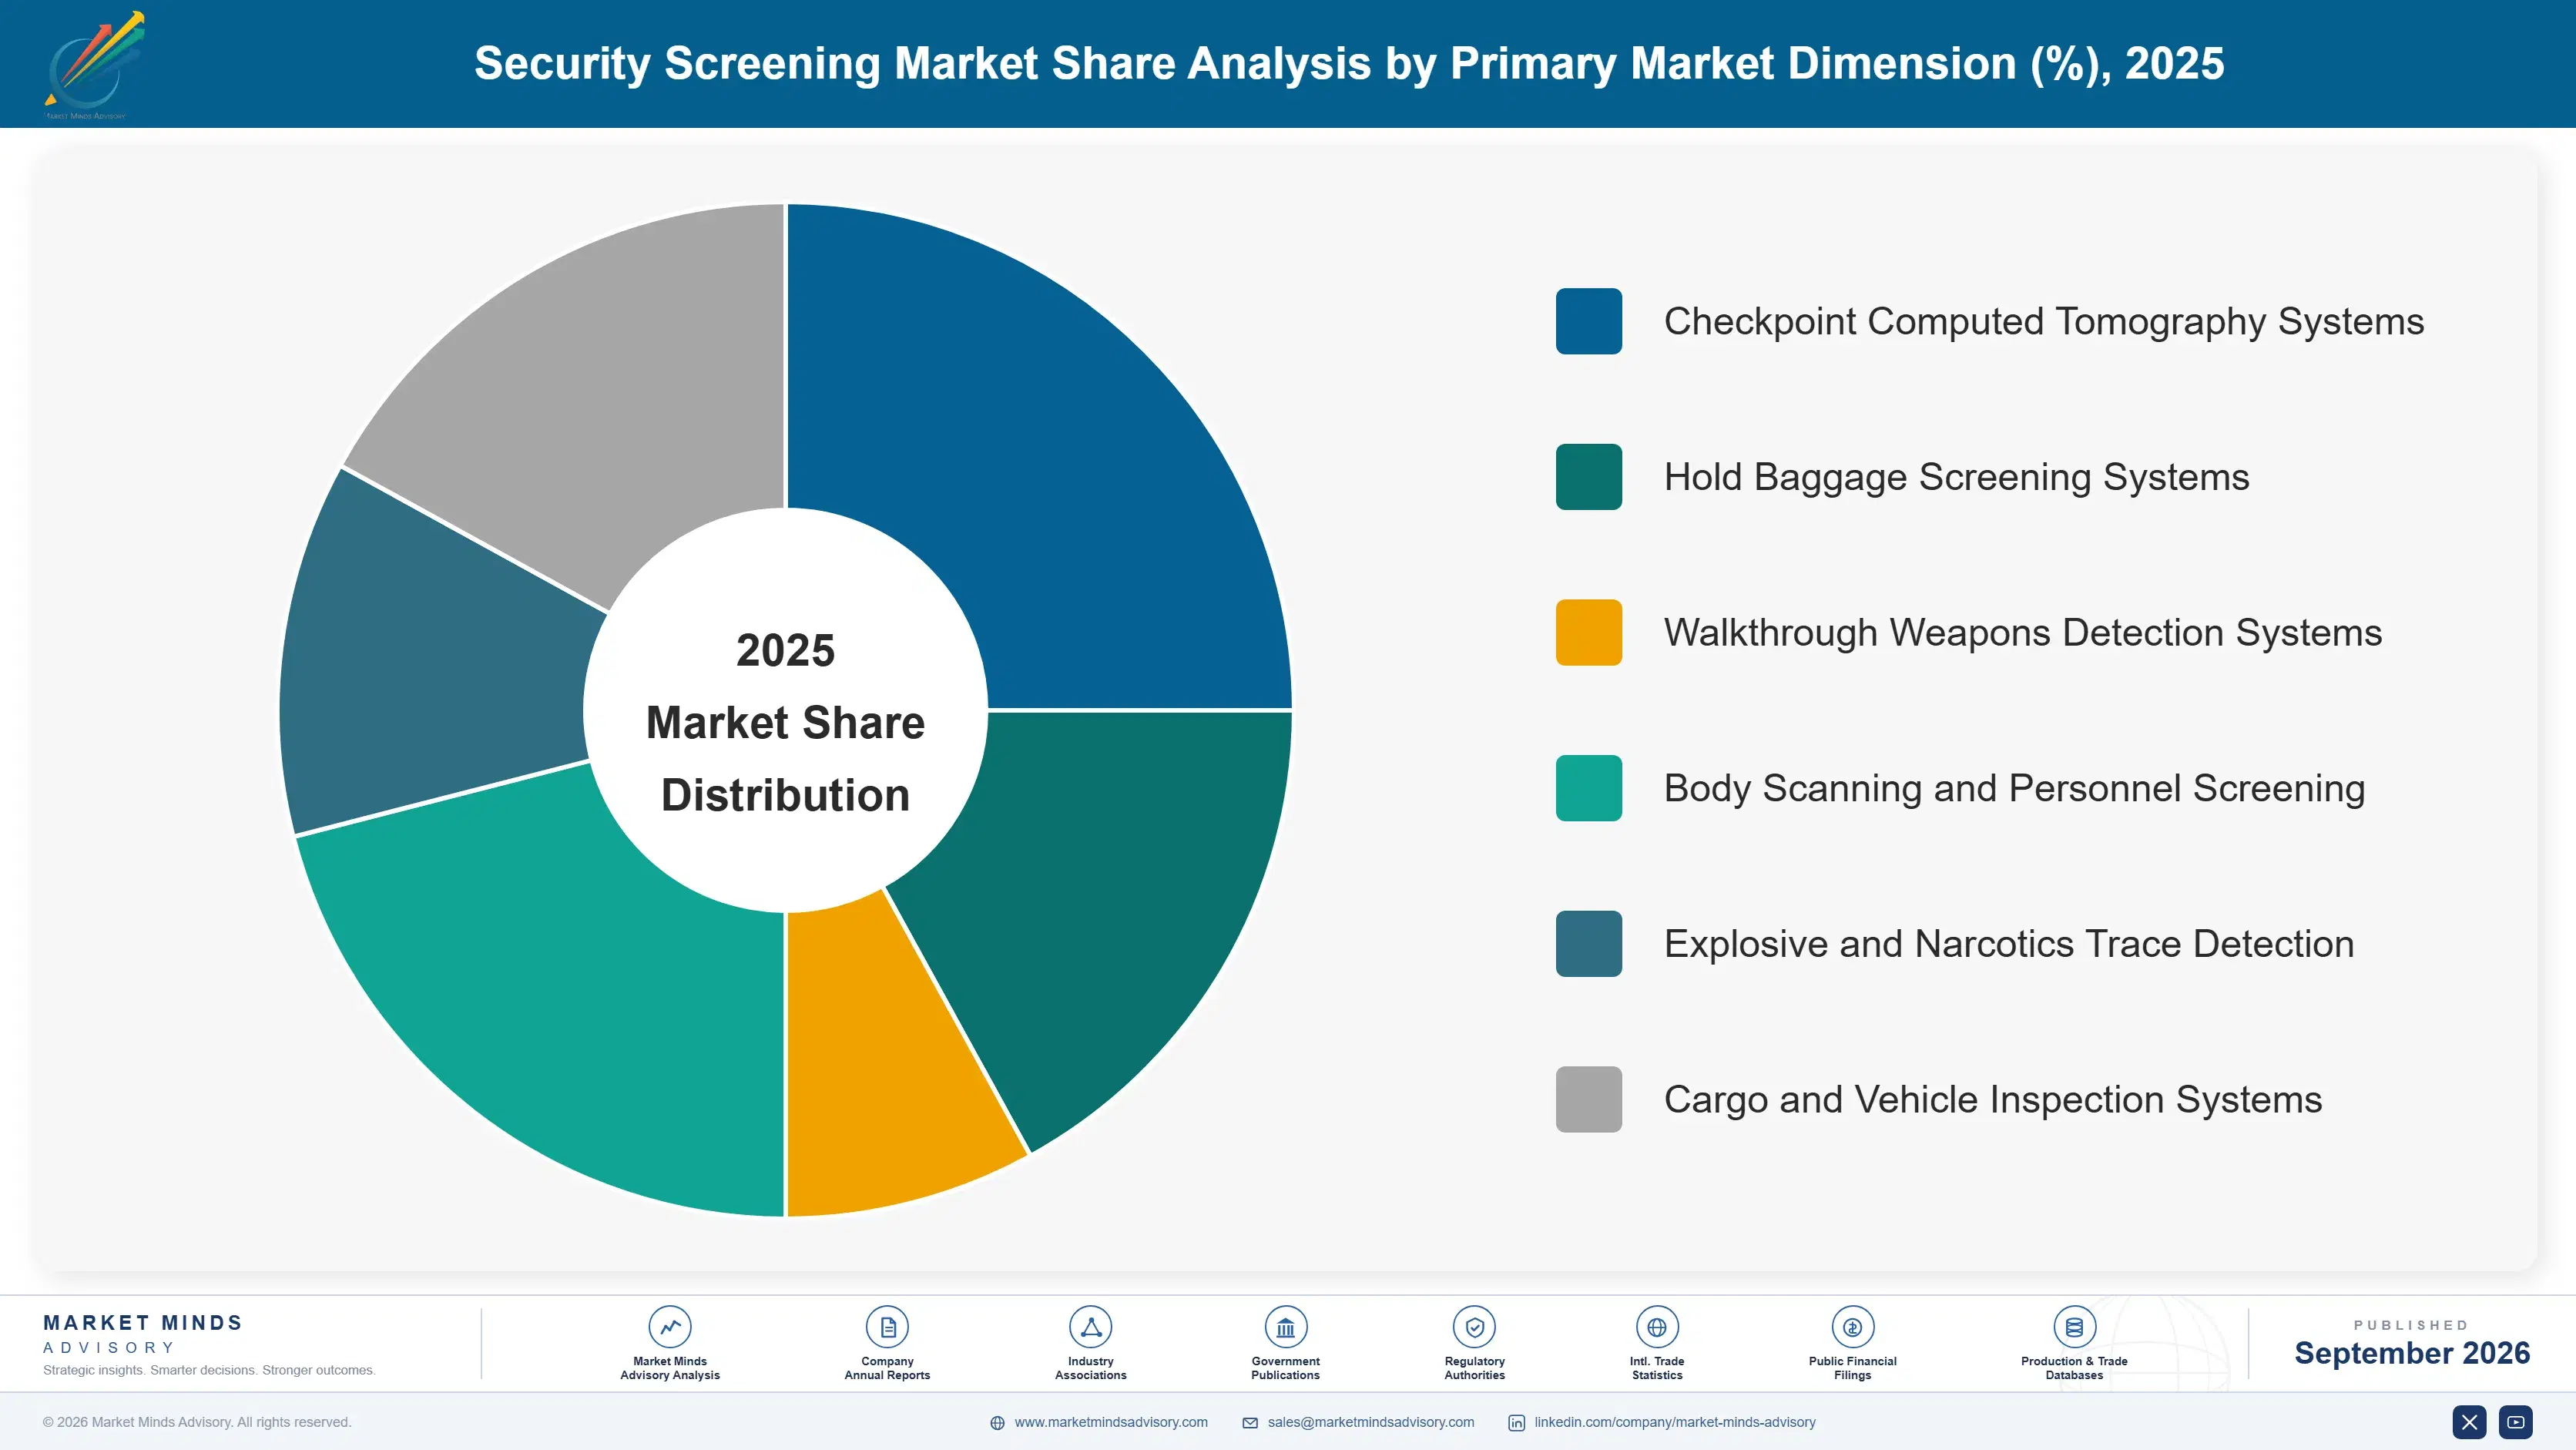
Segmentation follows the screening modality, because each one answers a different question about what is being examined and how much cooperation the subject will offer. Aviation checkpoint equipment assumes a compliant passenger with time. Venue equipment assumes somebody walking through without stopping, and that single difference drives everything about the design and the economics.
security-screening-market-market-share-analysis-1788425268310

Walkthrough Weapons Detection Systems

Walkthrough weapons detection grows at 11.4%, half again the market rate of 7.6%, and it created a buyer group that had never purchased screening equipment because conventional systems required a queue no stadium or school entrance could accommodate. Visitors pass without emptying pockets, which is the whole commercial proposition. The segment's risk is equally clear: alarm rates near 8% send a substantial share of visitors to secondary inspection and rebuild the delay the system was bought to remove. Buyers are facility managers rather than security professionals, so specifications are written around visitor flow and several early deployments have been reversed after measurement. Five year installed base outcomes in this segment are genuinely uncertain.
CAGR 11.4%

Checkpoint Computed Tomography Systems

Checkpoint computed tomography grows at 10.2% because letting electronics and liquids stay inside bags removes the divest and re-pack sequence that consumed most of the lane time, raising throughput around 31% per lane. Regulatory approval frameworks in Europe and deployment programmes in North America have both been running for years, so the technology question is settled and capital budget is the constraint. Replacement of equipment reaching 11 years of service generally favours computed tomography rather than like-for-like substitution. Unit prices are high enough that airports phase deployment across terminals, which spreads supplier revenue over long and predictable programmes. Approval breadth across jurisdictions decides which suppliers can even bid for these programmes.
CAGR 10.2%
Full segment breakdown across 6 segments available in the complete report.

Regional Architecture and Country Demand Map

Demand follows aviation passenger volume and the local appetite for screening outside aviation, which vary independently. Regions building airports buy checkpoint equipment; regions worried about weapons at public venues buy something else entirely, and few buy both. Aviation and venue demand rarely appear in the same budget.

North America

North America holds 34%, above the regional band, because it is the only market buying heavily in both aviation checkpoint replacement and venue screening at the same time. Checkpoint computed tomography deployment has run as a sustained federal programme for several years across a large airport network. Venue demand is the genuinely distinctive part, driven by school district, stadium and hospital purchasing that responds to weapons incidents rather than to aviation regulation. That buyer group is fragmented across thousands of independent purchasers, which suits suppliers with channel reach rather than those built for government tenders. Aviation and venue purchasing sit in entirely different organisations here, so suppliers effectively run two commercial operations against one geography.
Share: 34% | CAGR: 8.4% (2026 to 2036)

Western Europe

European demand rests on aviation standards administered across member states, where equipment approvals and liquid screening requirements are harmonised enough that a single certification serves many markets. Checkpoint computed tomography deployment is well advanced at major hubs and continues at regional airports on slower capital cycles. Venue screening adoption is limited, since weapons incidents at public venues are rarer and public tolerance for entrance screening is lower. Growth at 6.0% is the slowest anywhere, reflecting a mature installed base and deployment programmes that are largely complete at the largest airports. Remote image review trials have progressed further here than in most regions, which matters because staffing cost is as dominant a concern as anywhere.
Share: 22% | CAGR: 6.0% (2026 to 2036)
Regional intelligence for 5 additional markets available in the complete report: East Asia, South Asia and Pacific, Middle East and Africa, Latin America, Eastern Europe. Contact sales@marketmindsadvisory.com.
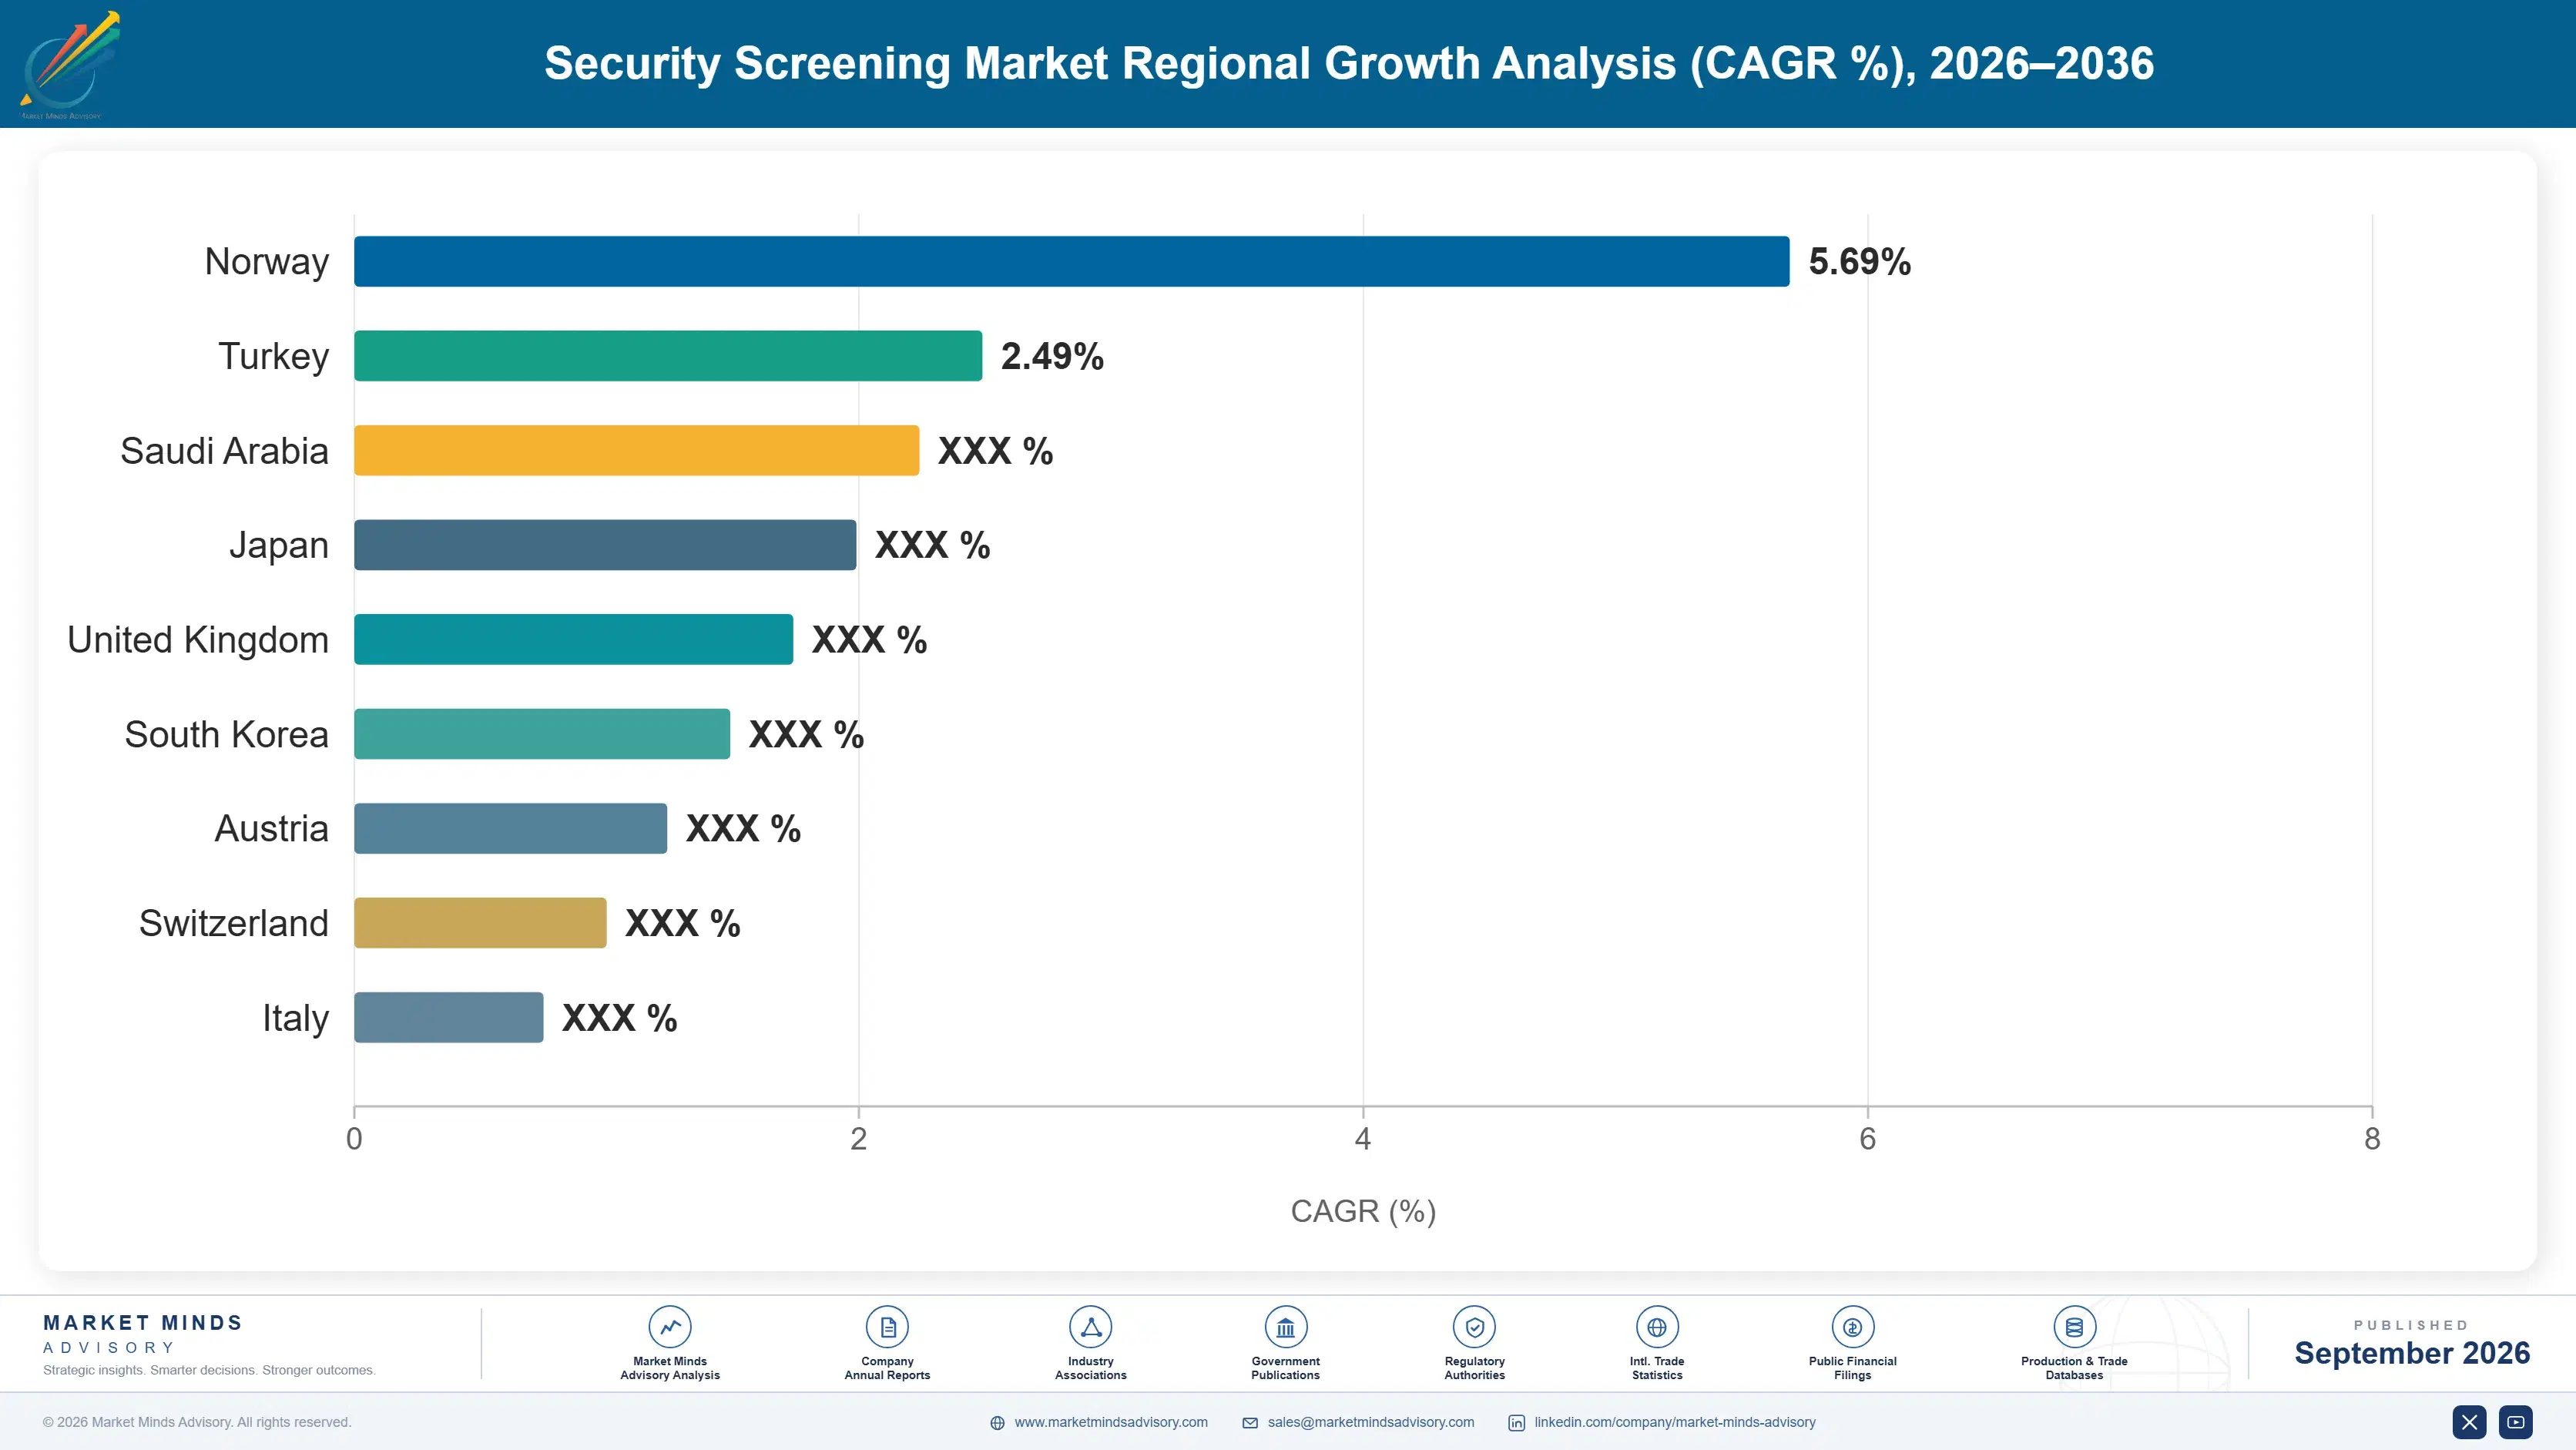
security-screening-market-country-cagr-analysis-1788425268850

Selling Lanes Rather Than Detection

Detection is a threshold every approved product clears, so competing on it wastes the meeting. Everything that moves in this market moves on staffing, throughput and, in the venue segment, on whether the alarm rate is honest enough that a customer measuring it afterwards stays a customer. Nothing else in a proposal changes the answer.

Quantify Staffing Reduction in Every Proposal

Labour represents roughly 72% of screening operating cost and equipment capital is a fraction of that, yet most proposals lead with detection specification because that is what engineering teams are proud of. Quantifying the headcount effect of a 31% throughput improvement converts a capital request into an operating saving that finance approves considerably faster. Buyers who see the staffing arithmetic approve at roughly twice the rate of those shown only detection performance. It requires understanding the customer's roster, which suppliers rarely bother to ask about. Roster arithmetic is the conversation that closes these deals.
Market Impact: Approves at roughly 2 times the usual rate

Publish Venue Alarm Rates Before Customers Measure Them

Venue systems alarm on roughly 8% of visitors and every buyer discovers that figure within a month of going live, at which point an undisclosed number becomes a credibility problem rather than a technical one. Suppliers publishing honest rates with site-specific configuration guidance retain customers through the disappointment, and several who did not have seen equipment removed. Retention across the venue segment differs by around 25 percentage points on this alone. Honesty here is commercial strategy rather than virtue. Buyers measure within a month regardless, so the only question is whether the supplier told them first.
Market Impact: Shifts venue segment retention by 25 percentage points

Pursue Remote Screening Approval as a Position

Reviewing images away from the lane lets one operator cover several checkpoints, which attacks the 72% staffing cost more directly than any throughput gain. Regulatory approval rather than technology is the obstacle, since screening rules in most jurisdictions assume an operator standing at the machine. Suppliers engaging authorities early shape the approval framework and reach the market first, and approval takes about 26 months regardless of when it starts. Those waiting for rules to settle will find they were written around somebody else's architecture. Approval frameworks tend to reflect whoever engaged the regulator first.
Market Impact: Approval consumes about 26 months whenever it begins

Design Platforms That Absorb Detection Updates

Certification runs about 26 months and must largely be repeated per jurisdiction, which makes each approved product a fixed asset rather than a refreshable line. Platforms architected so detection algorithms update within the approved envelope preserve certification while allowing genuine improvement, extending commercial life by roughly 4 years against conventional designs. It constrains the architecture from the outset and engineering teams resist it. The vendors who accepted the constraint are shipping improvements while competitors are still in testing. Certification is the expensive part of this business and treating it as a one-time cost per generation is a design decision.
Market Impact: Extends commercial product life by roughly 4 years

Who Controls the Margin Pool

Concentration sits near 52% across the top five on measured equipment and service revenue, held in place by certification approvals running about 26 months per jurisdiction rather than by technology that any competent manufacturer could not build. The leaders are established detection companies with aviation authority relationships measured in decades. Venue screening has admitted entrants who would never have cleared aviation certification, because that segment requires no equivalent approval at all.
Competition runs on three dimensions. Certification breadth across jurisdictions is first, since it determines which tenders a supplier can enter. Second is service network density, because certified equipment failing at a checkpoint stops an airport and response time commitments are contractual. Third is channel reach into the fragmented venue market, where thousands of independent buyers require a completely different sales organisation from government tendering.

Two pressures will move positions. Venue screening has created a segment where reputation is being established now and where a visible failure would reset it, which favours suppliers publishing honest performance over those winning on promises. Meanwhile Chinese manufacturers hold a protected domestic base at scale and compete aggressively across Asia, Africa and parts of Latin America where procurement restrictions do not apply to them.
security-screening-market-company-positioning-matrix-1788425269380

Competitive Moat and Risk Dimensions

SMITHS DETECTION

Moat: Certification and service breadth

Smiths Detection holds approvals across most major aviation jurisdictions simultaneously, which lets it enter tenders that competitors with narrower certification cannot bid at all. Its service network supports contractual response times at airports where equipment failure stops operations immediately. Aviation authority relationships built over decades give it early visibility into standards changes that shape product planning several years ahead.
SMITHS DETECTION

Risk: Venue channel mismatch

The fastest-growing segment at 11.4% sells to thousands of facility managers through channels that look nothing like aviation tendering, and an organisation built for government procurement adapts slowly. Entrants without aviation heritage moved first and hold position. Aviation replacement demand is predictable and slow, so ceding the venue segment means ceding most of the market's growth over this period.
OSI SYSTEMS

Moat: Cargo and aviation combination

OSI Systems spans aviation checkpoint, hold baggage and cargo and vehicle inspection, which spreads exposure across buyer groups whose capital cycles do not move together. Cargo and border inspection carries government relationships distinct from aviation authorities and renews on separate programmes. Manufacturing scale across several product families supports a cost position narrower specialists cannot reach.
OSI SYSTEMS

Risk: Chinese competitive pressure

Chinese manufacturers compete aggressively in cargo and vehicle inspection across Asia, Africa and parts of Latin America, at prices Western suppliers cannot approach on comparable specifications. Procurement restrictions protect some Western markets and not the growth markets. The company's cargo exposure, which diversifies it against aviation cycles, is also the portion most directly contested on price rather than on capability.

Players Tracked

Prominent Players

Smiths Detection
Leidos
OSI Systems
Nuctech
Analogic

Other Key Players

CEIA
Evolv Technology
Xtract One Technologies
Astrophysics
Autoclear
Adani Systems
VOTI Detection
Westminster Group
Liberty Defense
Bruker
Teledyne ICM
Garrett Metal Detectors
Metrasens
Vanderlande
Gilardoni

Recent Developments

MARCH 2025

School districts and stadiums reverse walkthrough screening deployments

Several venue operators removed walkthrough weapons detection equipment after measuring alarm rates that pushed a substantial share of visitors into secondary inspection, which rebuilt the entry queue the systems had been purchased to eliminate. Configuration adjustments had not resolved the issue. Capital had already been committed elsewhere.
Signal: Undisclosed alarm rates are becoming a retention problem, and honest published figures are now a commercial advantage.
JULY 2025

Aviation authorities approve remote image review trials at several hubs

European and Asian civil aviation authorities permitted trials in which screening images are reviewed away from the checkpoint lane, allowing one operator to cover several lanes. Approval frameworks had previously assumed an operator physically present at each machine during operation. Staffing rather than detection was the stated motivation.
Signal: Regulatory architecture rather than technology determines when the largest screening cost can actually be reduced at all.
OCTOBER 2025

Airport operators phase computed tomography across terminals on capital cycles

Major airports continued deploying checkpoint computed tomography terminal by terminal rather than in single programmes, spreading capital across multiple budget years while replacing equipment reaching the end of its certified service life. Throughput gains were the stated justification throughout. Certified service life rather than new capacity set the pace.
Signal: Phased deployment turns checkpoint replacement into predictable multi-year supplier revenue rather than a sequence of lumpy tender wins.

What Certified Equipment Costs

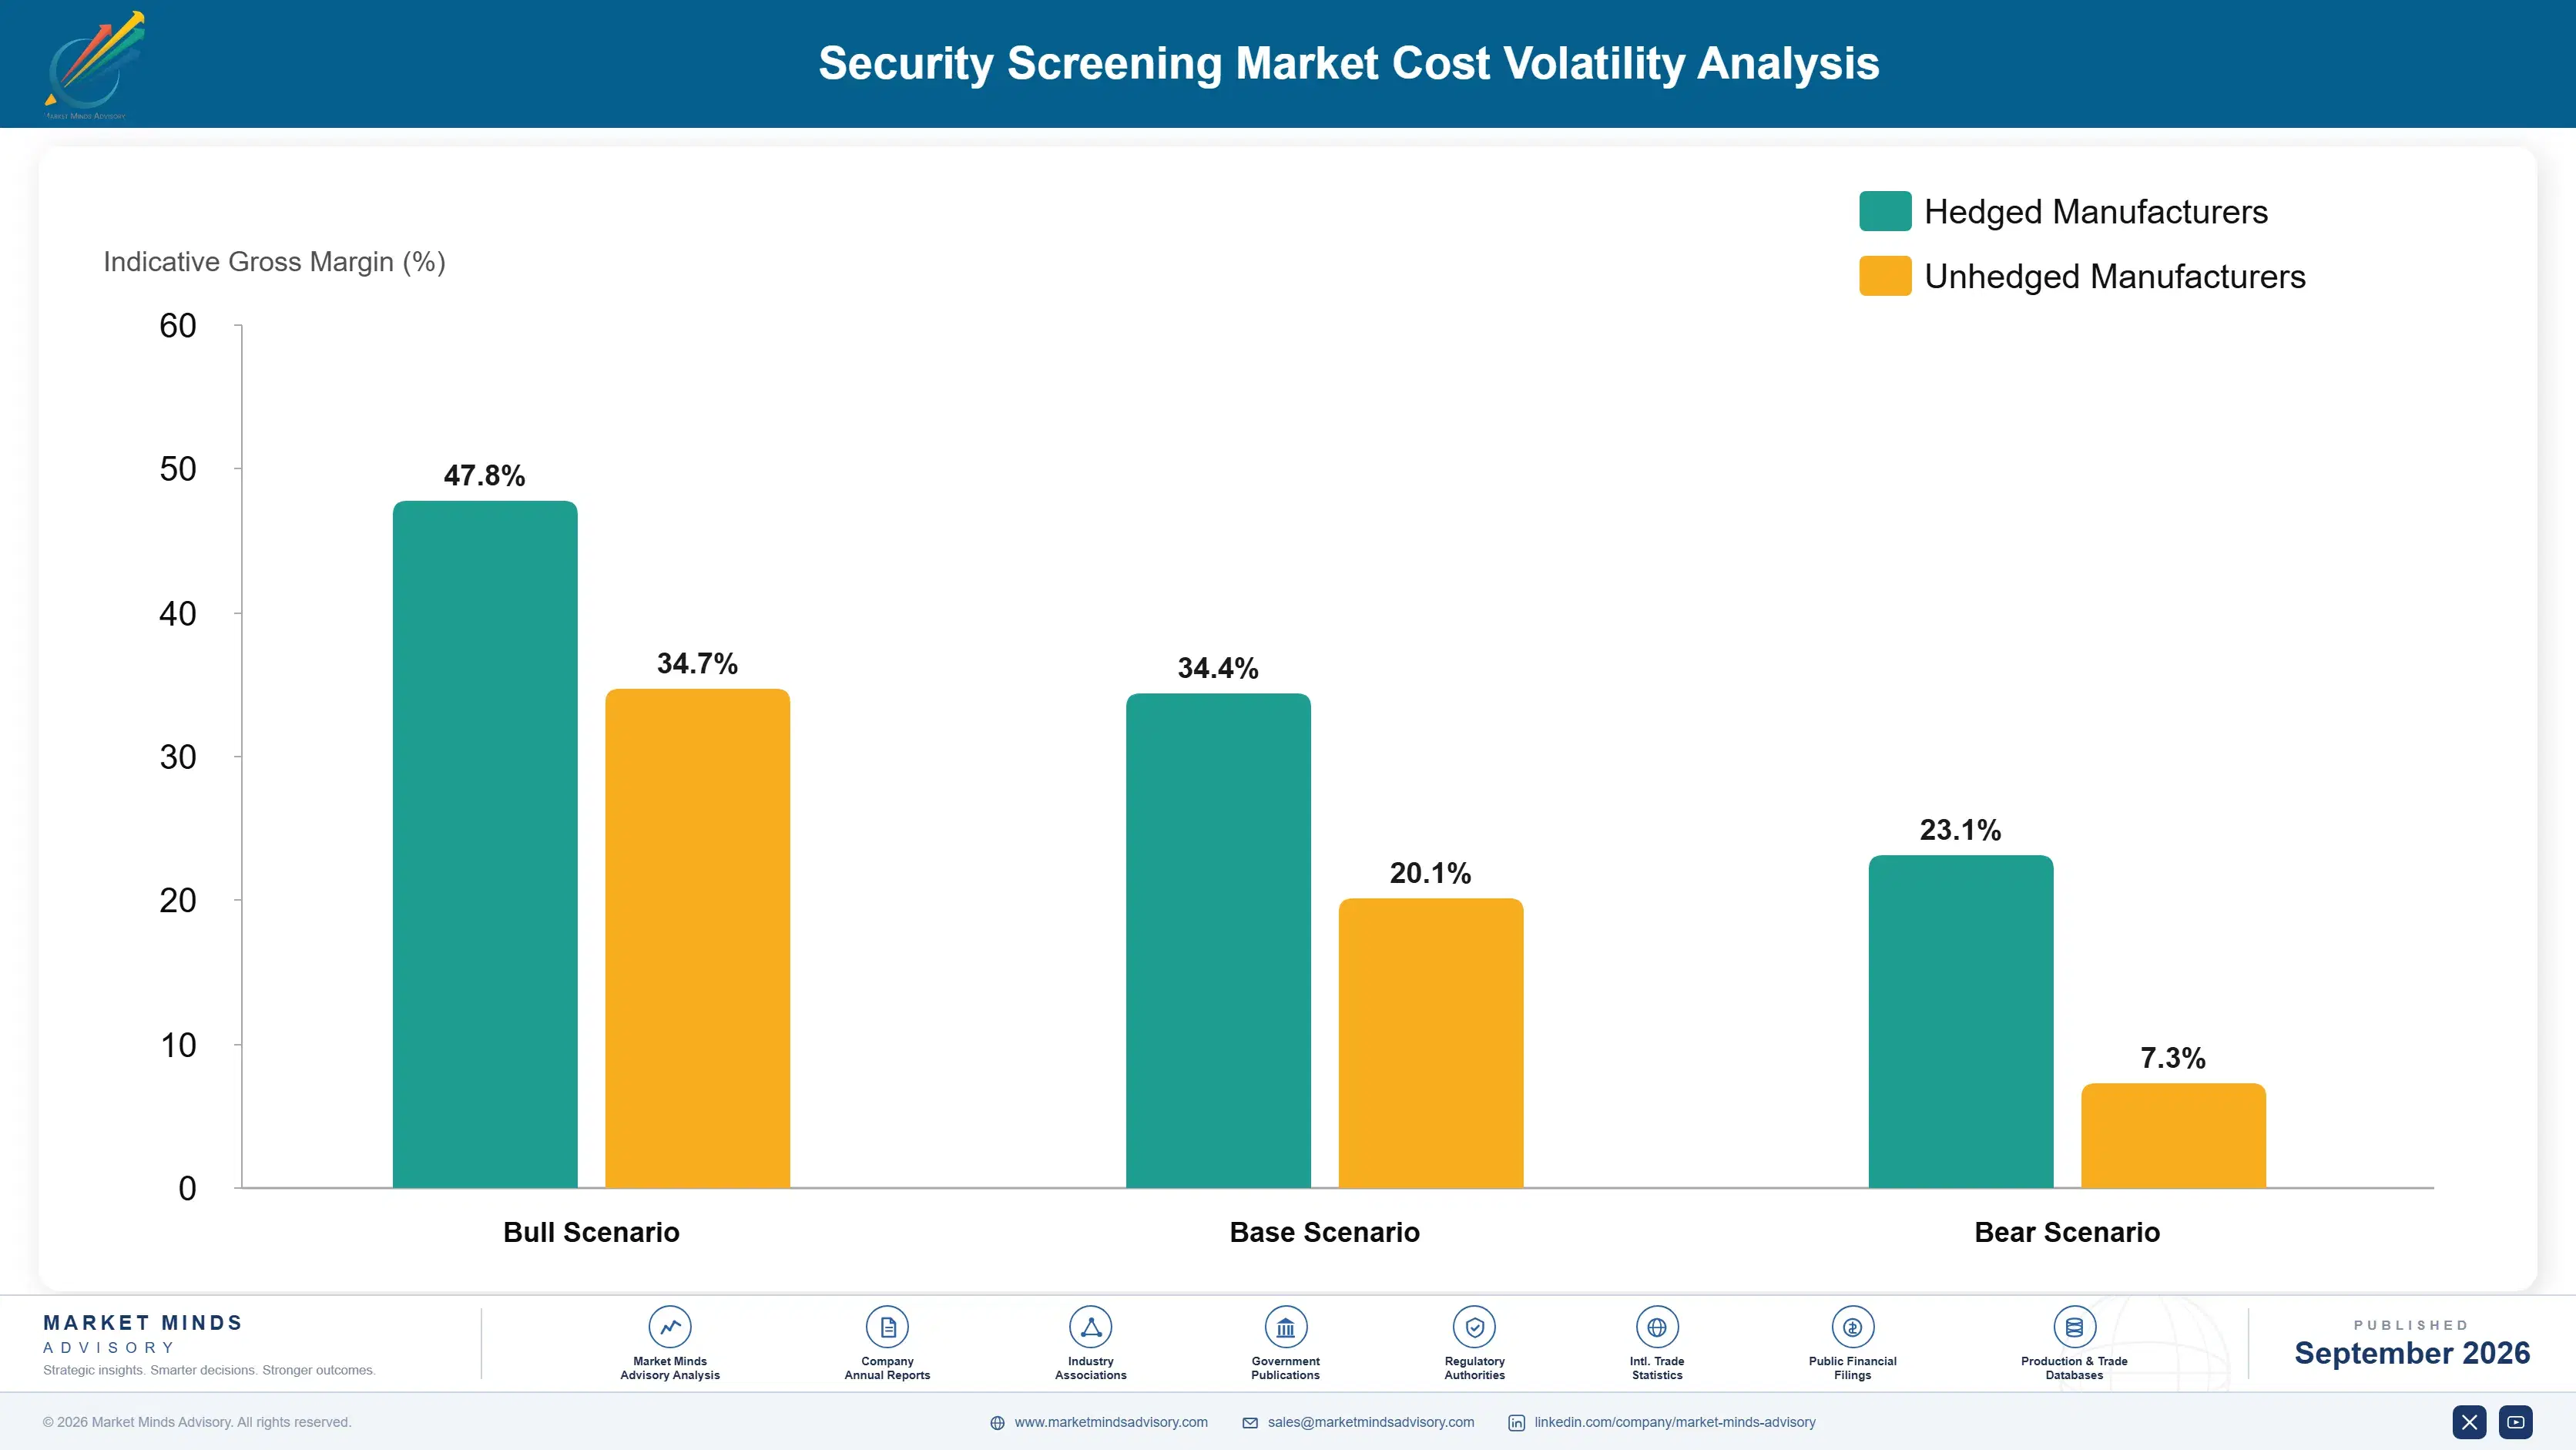
Cost structure splits between hardware and approval. Detectors, X-ray tubes, computed tomography gantries, precision mechanics and radiation shielding together account for roughly 47% of manufactured cost, and certification, threat testing and compliance engineering absorb a further block behaving like fixed cost per approved product. Service network cost is carried continuously against contracts rather than against sales, which distorts margin comparison between suppliers.
Detector and X-ray tube supply has been the sharpest pressure. Both come from a narrow supplier group also serving medical imaging, which orders in far larger volumes and holds priority when capacity tightens, and lead times extended through 2024 and 2025. Smiths Detection and OSI Systems both referenced supply chain and component cost conditions in recent annual reporting. Suppliers absorbed most of it, since certified equipment cannot substitute detectors without repeating approval testing.

Exposure varies by installed base age rather than by manufacturing scale. Suppliers with large mature installed bases carry service networks that consume cost while generating predictable revenue. Those growing quickly in venue screening carry network build-out ahead of the revenue supporting it. Manufacturers with several approved platforms can shift volume when components tighten; single-platform suppliers cannot substitute anything without restarting a 26 month approval.
security-screening-market-cost-volatility-analysis-1788425269578

Qualify alternate detectors inside the original approval

Substituting a detector or X-ray tube in certified equipment triggers approval testing running about 26 months, which turns a component shortage into a commercial emergency. Qualifying alternates during original certification costs additional testing and removes the exposure for the platform's life. It has to happen before approval completes, which is precisely when it reads as unnecessary expense.

Price service contracts against installed base age honestly

Service network cost accrues continuously while revenue arrives against contracts written years earlier, so an ageing installed base quietly consumes margin that headline equipment pricing appears to earn. Pricing renewals against actual failure rates and parts consumption by equipment age restores the relationship. Customers resist, so the discipline usually arrives after somebody measures what the oldest installations cost.

Share detector volume with medical imaging suppliers

Detectors and X-ray tubes come from suppliers whose medical imaging customers order far larger volumes and consequently hold allocation priority whenever capacity tightens. Specifying components already produced at medical imaging volumes, rather than security-specific variants, improves both availability and unit cost considerably. It constrains design choices and is worth accepting, since a component nobody else buys is never prioritised.

Portfolio Architecture for Margin Defence

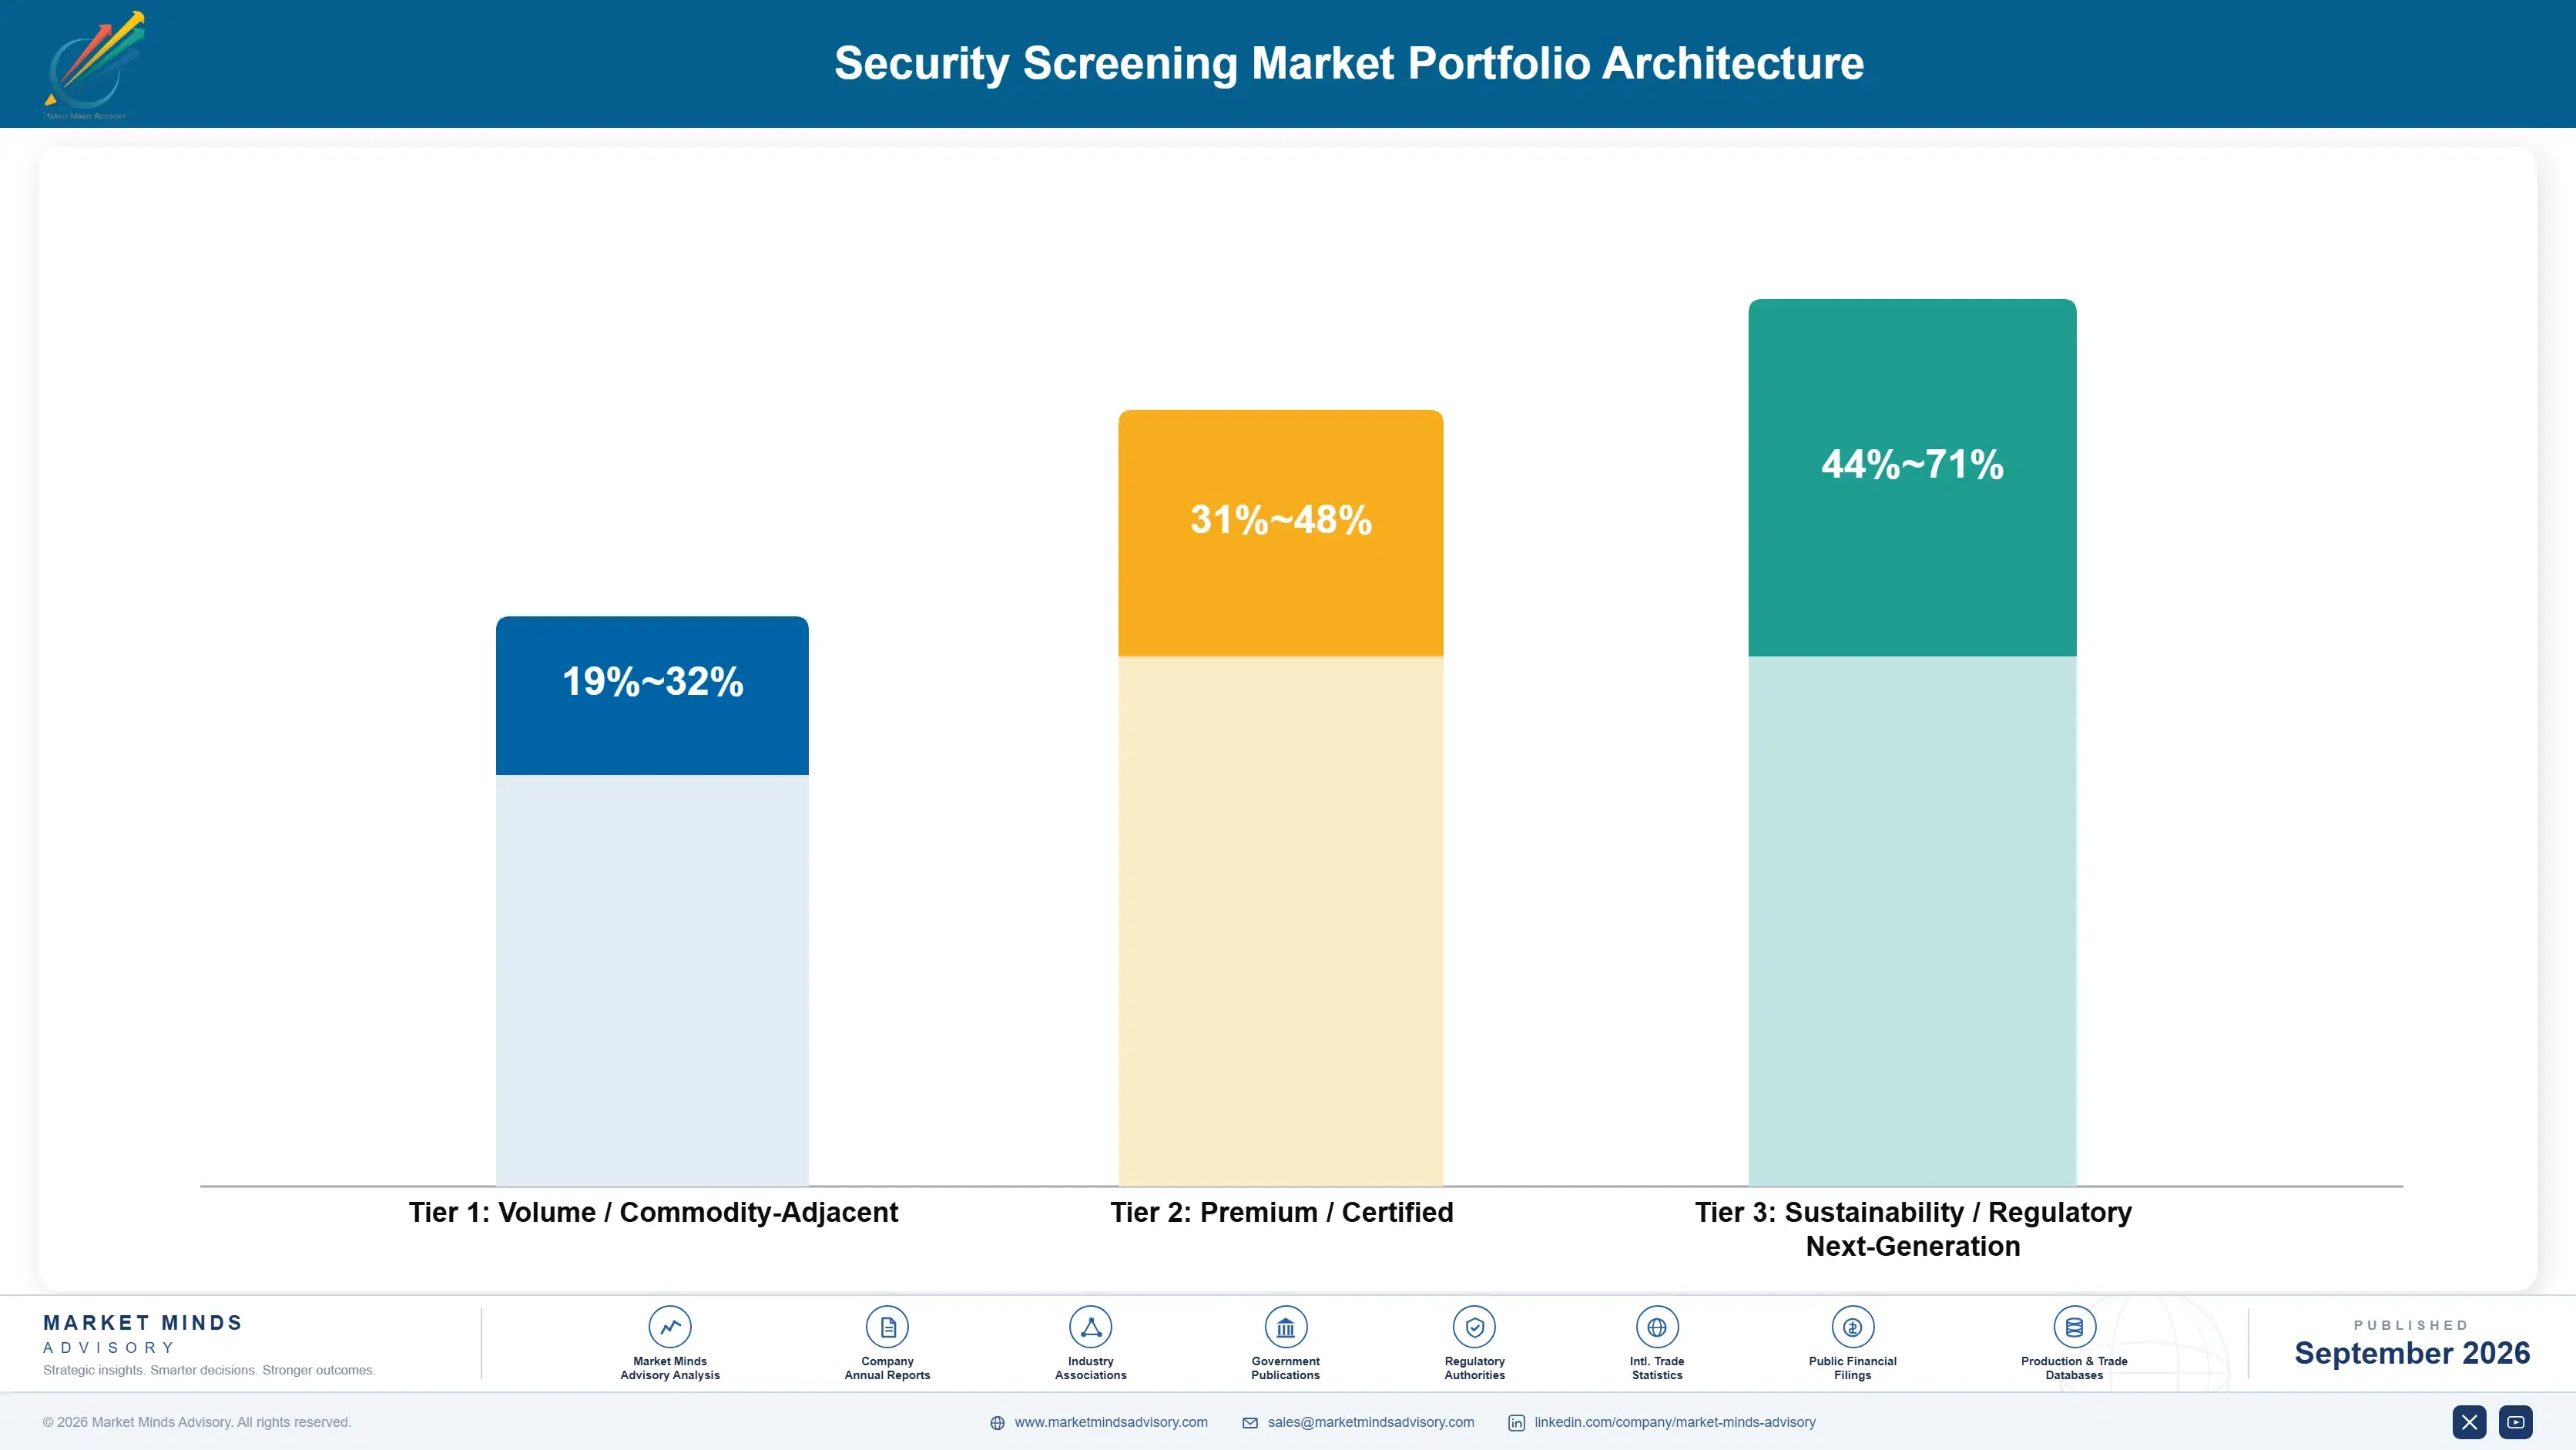
Margin architecture separates on certification content and service attachment rather than on hardware complexity. Hold baggage systems are large, capital-intensive and sold into competitive tenders where price dominates. Checkpoint computed tomography earns more because approvals restrict the supplier list and throughput arguments support the price. Service contracts across the installed base earn most consistently, though they consume network cost that headline margins rarely reflect properly.
The tension runs between aviation predictability and venue growth. Aviation replacement is forecastable years ahead, protected by certification and slow, delivering the revenue that funds everything. Venue screening grows at 11.4% and sells through channels aviation organisations are not built for, to buyers who measure alarm rates and act on what they find. Suppliers weighted to aviation are secure and slow; those weighted to venue grow quickly and face a segment that has already seen reversals.

High-value revenue concentrates in service and in checkpoint computed tomography. Service recurs across an 11 year equipment life and is defended by response time commitments competitors would need a network to match. Computed tomography carries approval protection and a throughput argument buyers accept. Venue equipment carries the growth and the least certainty about the installed base in five years.

Volume / Commodity-Adjacent

Hold baggage systems, conventional X-ray and metal detection sold into competitive tenders where price leads. The range separates suppliers with manufacturing scale from those building to order. Integration and installation content varies enough to move the figure considerably by project.
Gross Margin: 19-32%

Premium / Certified

Checkpoint computed tomography, body scanning and trace detection where jurisdiction approvals restrict the supplier list. Margin reflects approval breadth and the throughput argument supporting the price. Replacement of equipment reaching service life sustains demand independently of new capacity.
Gross Margin: 31-48%

Sustainability / Regulatory / Next-Generation

Service contracts, detection software updates, remote screening capability and venue systems. The widest range in the portfolio, reflecting service network cost against installed base age and the untested economics of venue deployments. Highest margin and least uniform.
Gross Margin: 44-71%
security-screening-market-portfolio-architecture-1788425270084

High-value Sub-segments and Strategic Watch-out

Installed Base Service Contracts

High value with steady growth, recurring across an 11 year equipment life and defended by contractual response times that competitors need a physical network to match. The range reflects installed base age, since older equipment consumes parts and attention disproportionately. It is the most reliable revenue anywhere here.
Gross Margin: 48-71%

Walkthrough Venue Systems

High value with the fastest growth at 11.4%, selling to facility managers through channels aviation suppliers do not operate. The range reflects direct against channel delivery. Alarm rates near 8% make this the segment where five year installed base outcomes are genuinely uncertain rather than merely hard to forecast.
Gross Margin: 42-62%

Checkpoint Computed Tomography

The volume core in value terms, protected by jurisdiction approvals and justified on throughput gains around 31% per lane. The range reflects approval breadth and deployment scale by customer. Phased terminal-by-terminal rollout makes the revenue predictable across multiple budget years. That predictability suits everyone involved here.
Gross Margin: 33-49%

Hold Baggage Tenders

The strategic watch-out, where large capital projects are decided on price between suppliers whose equipment all meets the same regulatory threshold. Integration content carries the margin when there is any. Several suppliers bid these to hold factory volume and discover the service attachment does not compensate.
Gross Margin: 0-24%

How Screening Demand Repeats

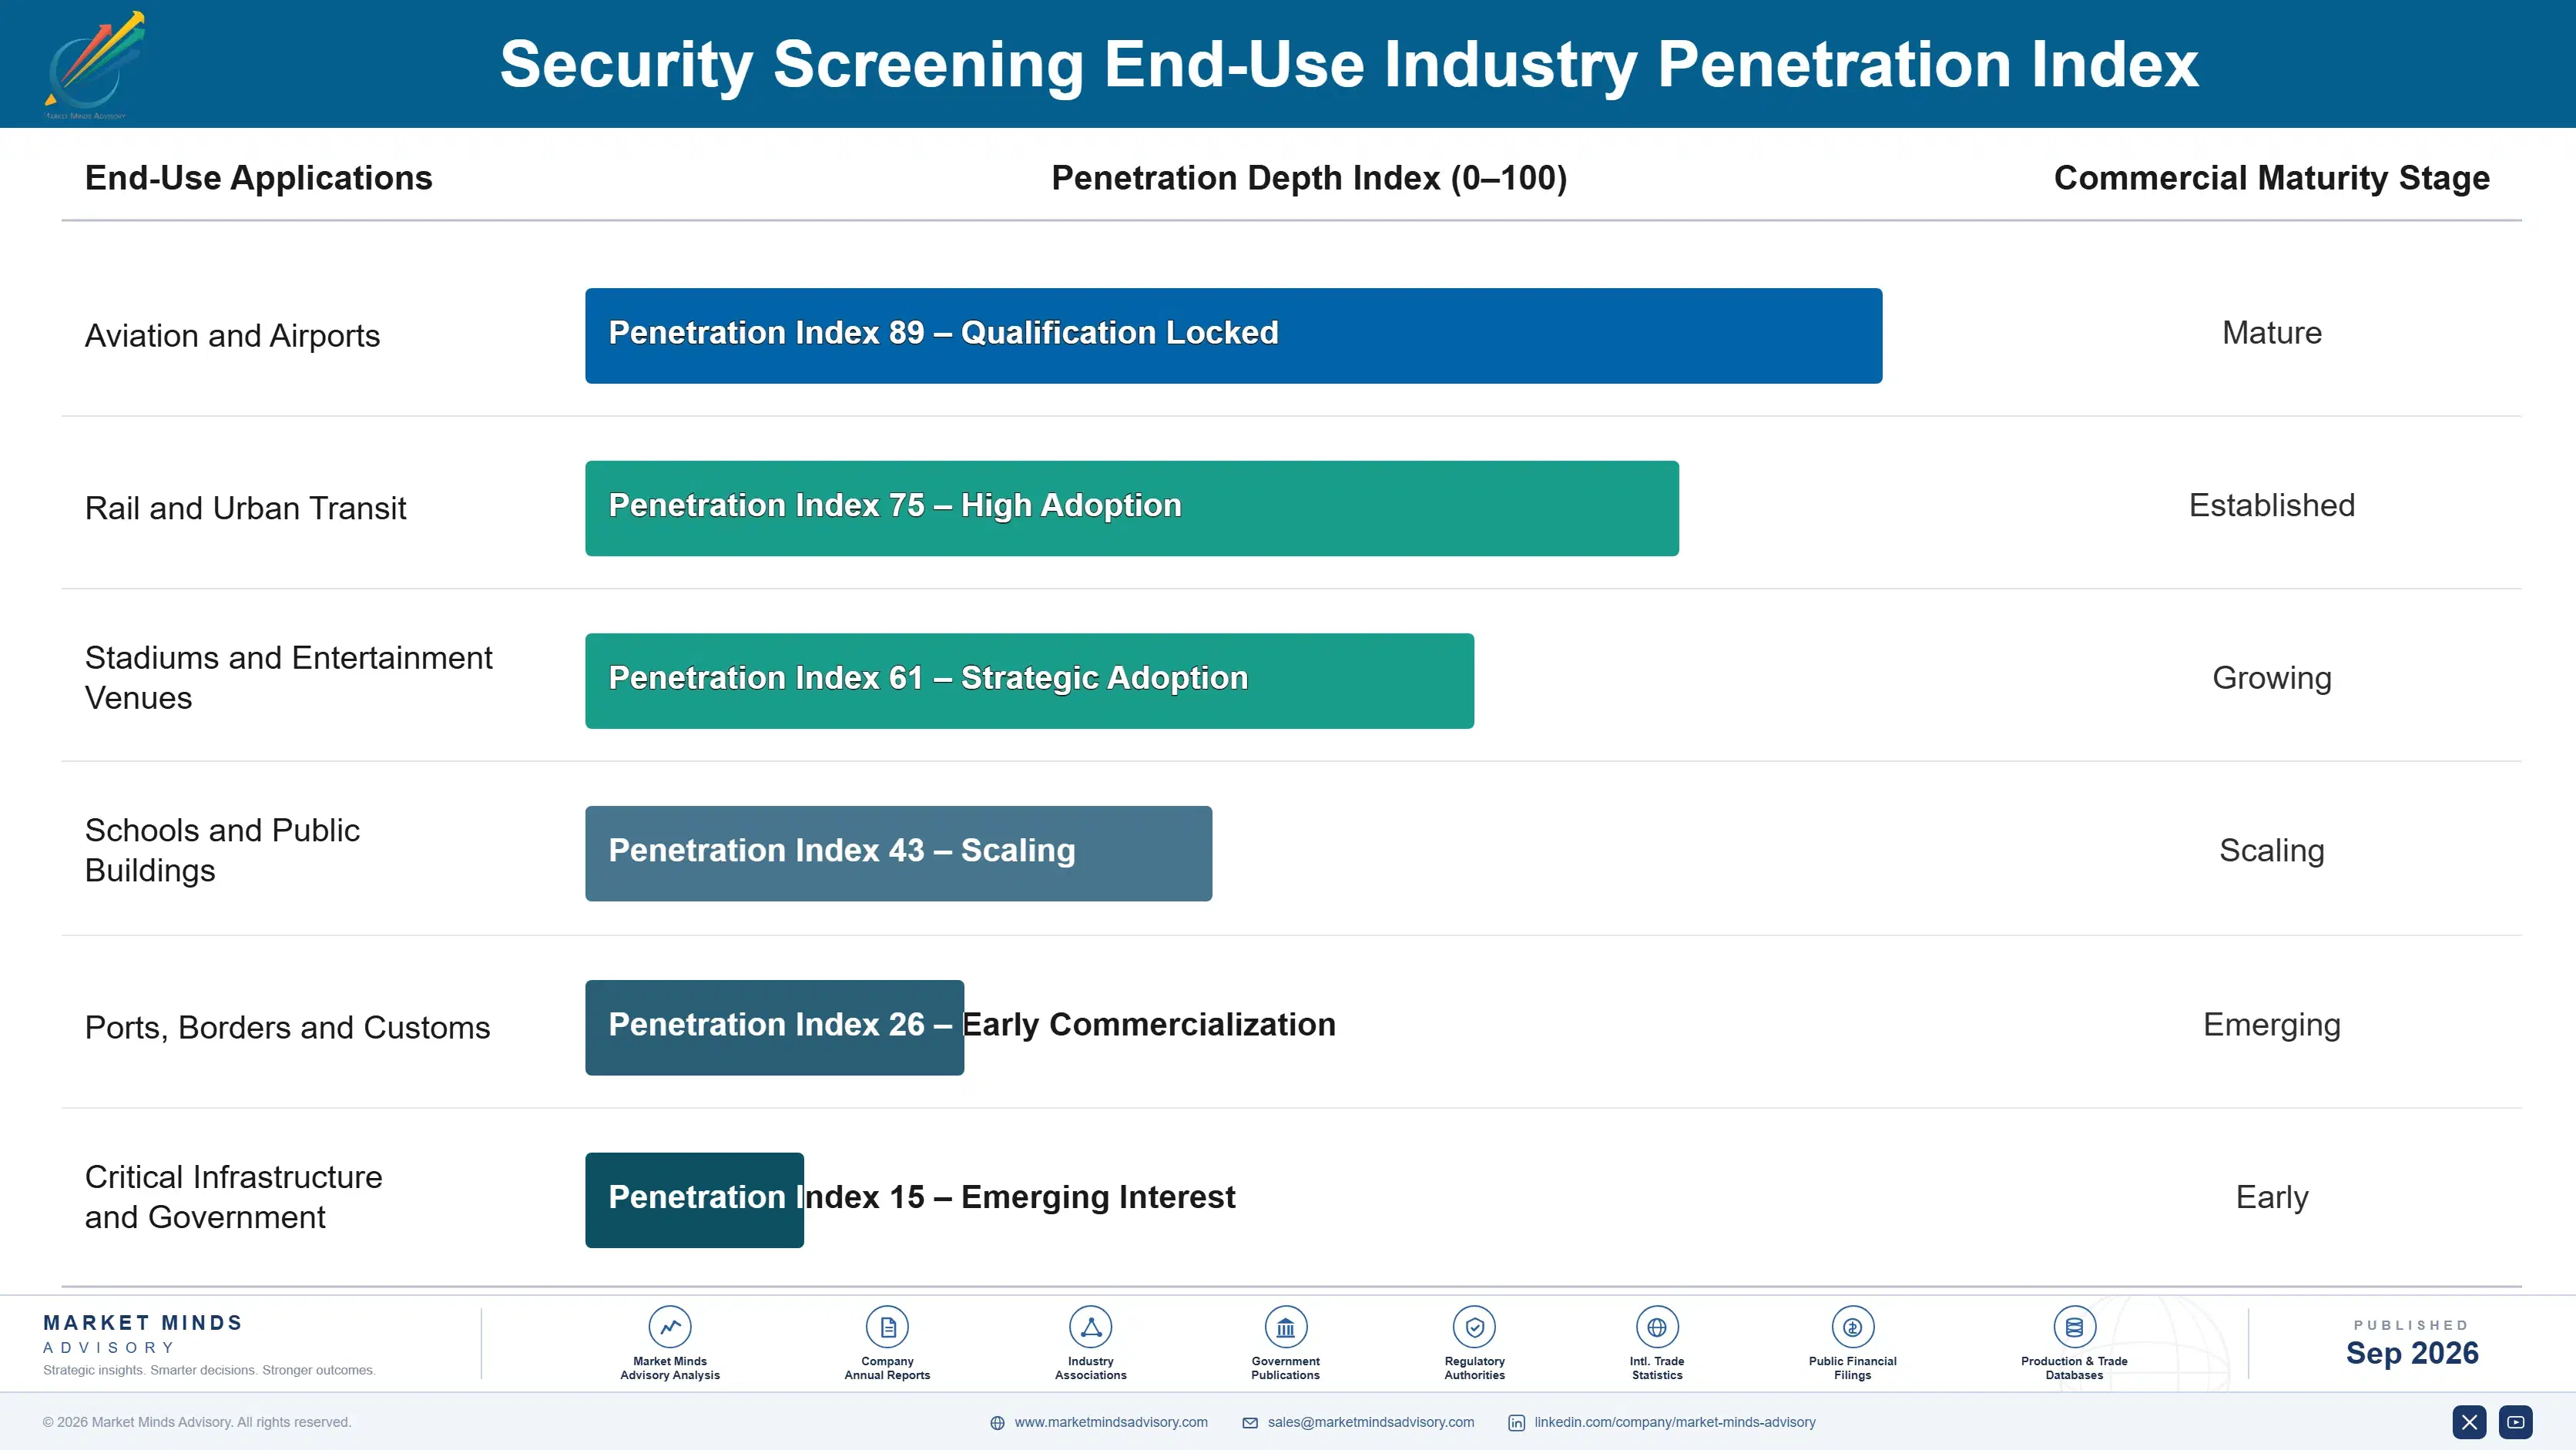
Recurrence works through equipment life and service rather than through consumption. Certified equipment operates for around 11 years, which makes each installation a decade-long position and each loss a decade-long absence. Service contracts recur annually across that period and represent the steadiest revenue in the market. Trace detection consumables recur continuously and at modest value. Venue equipment has no established replacement pattern, since the installed base is too young.
Adoption depth varies with regulatory obligation. Aviation operators integrate screening into terminal design, passenger flow modelling and staffing rosters, so equipment change means operational change and switching is genuinely disruptive. Venue operators install at entrances and can remove equipment over a weekend, which several have done. Cargo and border operators sit between the two, with integration into customs processes that makes change slow without making it impossible.

The buyer differs completely by segment rather than having evolved. Aviation equipment is specified by security directors against regulatory approval lists and bought through formal tender. Venue equipment is chosen by facility and operations managers against visitor experience, frequently without competitive tender at all. Suppliers organised around one buyer type address part of a market that now requires two separate commercial organisations.
security-screening-market-end-use-penetration-index-1788425270572

What This Market Rewards

These are among the four positions where our research anticipates prominent divergence between winners and laggards over the coming forecast period. Each is grounded in the demand model, the regulatory perimeter, and the announced capacity pipeline.
01 / STAFFING COST ARGUMENT

Sell headcount reduction rather than detection performance

Labour absorbs roughly 72% of screening operating expense while equipment capital is a fraction of it, yet most proposals still lead with detection specification because that is what engineering organisations take pride in. Quantifying what a 31% throughput improvement does to a staffing roster converts a capital request into an operating saving that finance approves at roughly twice the rate detection-led proposals achieve. It requires understanding the customer's shift patterns, which suppliers almost never take the trouble to ask about properly.
02 / VENUE ALARM HONESTY

Publish the alarm rate before the customer measures it

Venue systems alarm on roughly 8% of visitors and every operator establishes that figure within a month or so of going live, at which point an undisclosed number becomes a credibility failure rather than a technical limitation anybody can fix. Suppliers publishing honest rates alongside site configuration guidance retain customers through the disappointment, and retention across this segment differs by around 25 percentage points on that alone. Several suppliers who promised otherwise have watched their equipment removed and reported publicly afterwards.
03 / REMOTE APPROVAL POSITIONING

Shape remote screening rules rather than awaiting them

Reviewing images away from the lane lets one operator cover several checkpoints, which attacks the 72% staffing cost far more directly than any throughput improvement can deliver on its own. Regulatory approval rather than technology is the obstacle, and it takes about 26 months whenever it begins, so engaging authorities early both shapes the framework and reaches the market first with a compliant product. Suppliers waiting for the rules to settle will find they were written around a competitor's architecture entirely.
04 / APPROVAL ENVELOPE DESIGN

Architect platforms so detection updates preserve certification

Certification runs about 26 months and must largely repeat per jurisdiction, which turns each approved product into a fixed asset rather than a line a supplier can refresh whenever competitors move ahead. Platforms designed so detection algorithms update inside the approved envelope extend commercial life by roughly 4 years against conventional architectures. The constraint has to be accepted at the outset and engineering teams resist it, which is exactly why the suppliers who imposed it are shipping while others test.

Engagement Snapshot From the Field

A live engagement with an industry participant carrying material or product regulatory and market exposure ahead of a defining policy shift, showing how our research translates into a defensible multi-year portfolio strategy.
MARKET MINDS ADVISORY · CLIENT ENGAGEMENT SUMMARY
Security Screening Producer Strategic Portfolio Review and Transition Roadmap 2026·Investment Scenario on Security Screening Exposure Evaluation 2025-26
CLIENT PROFILE
A stadium and arena operator running screening at eleven venues with combined annual attendance around 9.4 million visitors (client-reported, unverified by MMA). Walkthrough weapons detection had been installed at six venues over two years, purchased on a promise that visitors would pass without divesting and that entry times would fall materially against bag search. It had not.
STRATEGIC CHALLENGE
Measured alarm rates at the six venues ranged between 9% and 14%, which pushed enough visitors into secondary inspection that entry times had improved far less than projected. Two venue managers wanted the equipment removed. The operator had approximately USD 7.1 million committed to the remaining five venues (client-reported, unverified by MMA) and no basis for the decision.
MMA APPROACH
MMA measured alarm causes rather than alarm rates, categorising every secondary inspection across a four-week period at three representative venues. We reviewed entry configuration, staffing deployment and visitor flow, and interviewed 21 venue and security staff plus two equipment suppliers. Options were assessed against entry time achieved rather than against equipment specification.
KEY FINDINGS
  1. Roughly 61% of alarms were caused by laptops, umbrellas and metal drink containers rather than by anything the system was intended to detect.
  2. Entry configuration at four venues placed the walkthrough units too close to ticket scanning, which concentrated arrivals and magnified the queueing effect of every secondary inspection.
  3. Staffing had been reduced at installation on the projected alarm rate, leaving secondary inspection under-resourced precisely where the actual rate was highest across the estate.
  4. Two venues achieving alarm rates near 6% had configured units and visitor guidance differently, and nobody had compared practice across the eleven sites.
CLIENT PROFILE
A stadium and arena operator running screening at eleven venues with combined annual attendance around 9.4 million visitors (client-reported, unverified by MMA). Walkthrough weapons detection had been installed at six venues over two years, purchased on a promise that visitors would pass without divesting and that entry times would fall materially against bag search. It had not.
STRATEGIC CHALLENGE
Measured alarm rates at the six venues ranged between 9% and 14%, which pushed enough visitors into secondary inspection that entry times had improved far less than projected. Two venue managers wanted the equipment removed. The operator had approximately USD 7.1 million committed to the remaining five venues (client-reported, unverified by MMA) and no basis for the decision.
MMA APPROACH
MMA measured alarm causes rather than alarm rates, categorising every secondary inspection across a four-week period at three representative venues. We reviewed entry configuration, staffing deployment and visitor flow, and interviewed 21 venue and security staff plus two equipment suppliers. Options were assessed against entry time achieved rather than against equipment specification.
KEY FINDINGS
  1. Roughly 61% of alarms were caused by laptops, umbrellas and metal drink containers rather than by anything the system was intended to detect.
  2. Entry configuration at four venues placed the walkthrough units too close to ticket scanning, which concentrated arrivals and magnified the queueing effect of every secondary inspection.
  3. Staffing had been reduced at installation on the projected alarm rate, leaving secondary inspection under-resourced precisely where the actual rate was highest across the estate.
  4. Two venues achieving alarm rates near 6% had configured units and visitor guidance differently, and nobody had compared practice across the eleven sites.
RECOMMENDED STRATEGY
Phase 1: Adopt the configuration and visitor guidance used at the two better-performing venues across the whole estate before committing further capital anywhere. Phase 2: Restore secondary inspection staffing to match measured alarm rates rather than the projected figures used in the original business case. Phase 3: Defer the remaining five installations until measured entry times at reconfigured venues confirm the improvement that justified the programme originally.
OUTCOME
Alarm rates across reconfigured venues fell to between 6% and 8% and average entry time improved by roughly 40% against the pre-programme baseline (client-reported, unverified by MMA). Three of the five deferred venues proceeded six months later on measured evidence, and the remaining two were cancelled.

Frequently Asked Questions

Foundational context covering the market sizes, CAGR, scope, country, region and competition that inform every finding below. This section is provided to cover basics and most often pre-purchase conversations, answered from the MMA Primary Research Dataset.

What is the current size of the Security Screening Market?

The market was worth USD 9.8 billion in 2025 and reaches USD 10.54 billion in 2026. Staffing absorbs roughly 72% of screening operating cost across typical aviation checkpoints.

How large will the Security Screening Market be by 2036?

MMA forecasts USD 21.93 billion by 2036, an expansion of 2.08 times over the forecast period. That represents USD 11.39 billion of incremental annual revenue against 2026.

What is the CAGR for the Security Screening Market 2026 to 2036?

The base case is 7.6% compound annual growth, with a bull case at 8.8% and a bear case at 6.4%. Venue segment durability separates the scenarios most clearly.

Which segment is growing fastest?

Walkthrough weapons detection grows at 11.4%, half again the market rate of 7.6%. Visitors pass without emptying pockets, which made screening viable at stadium and school entrances.

Who are the major companies in the Security Screening Market?

Smiths Detection, Leidos, OSI Systems, Nuctech and Analogic lead on measured equipment and service revenue. Together they hold roughly 52%, protected by lengthy certification approvals.

Which country is growing fastest?

India grows fastest at 11.6%, on an airport construction and expansion programme larger than any other worldwide, with new terminals requiring complete screening installations from the start.

Report Segmentation Architecture

The full report scope spans multiple orthogonal segmentation dimensions, with cross-tabulated demand data provided for each dimension pair. Coverage extends further to regional breakdowns, trend trajectories, and the competitive detail needed to support segment-level decision-making.

By Primary Market Dimension

  • Checkpoint Computed Tomography Systems
  • Hold Baggage Screening Systems
  • Walkthrough Weapons Detection Systems
  • Body Scanning and Personnel Screening
  • Explosive and Narcotics Trace Detection
  • Cargo and Vehicle Inspection Systems

By End-Use Industry

  • Aviation and Airports
  • Rail and Urban Transit
  • Stadiums and Entertainment Venues
  • Schools and Public Buildings
  • Ports, Borders and Customs
  • Critical Infrastructure and Government

By Commercial Dimension

  • Government Tender Procurement
  • Airport Operator Direct Purchase
  • Facility Manager Channel Sales
  • Service and Maintenance Contracts
  • Systems Integrator Partnerships
  • Equipment Leasing Arrangements

By Region

  • North America
  • Western Europe
  • East Asia
  • South Asia and Pacific
  • Middle East and Africa
  • Latin America
  • Eastern Europe

Scope, Methodology, and Coverage

Every figure in this report is reproducible from documented input assumptions. The scope below maps the historical period, the forecast horizon, the segmentation dimensions, and the countries covered, alongside the underlying primary and qualitative methodology.
Historical Period
2020 to 2025
Forecast Period
2026 to 2036
Base Year
2025 (USD billions; MMA Primary Research Dataset, September 2026)
Market Definition
This market covers equipment, detection software and associated services used to screen people, baggage, cargo and vehicles for weapons, explosives and other prohibited items, spanning checkpoint computed tomography systems, hold baggage screening systems, walkthrough weapons detection systems, body scanning and personnel screening, explosive and narcotics trace detection, and cargo and vehicle inspection systems. Revenue is measured as equipment, software and attributable service and maintenance value at supplier level. Screening personnel and guarding services, video surveillance systems, access control and credentialing, perimeter intrusion detection, and laboratory analytical instrumentation are excluded from scope.
Quantitative Units
USD billions, equipment, software and attributable service revenue at supplier level
Segmentation Dimensions
Screening modality, end-use setting, commercial channel, region
Regions Covered
North America, Western Europe, East Asia, South Asia and Pacific, Middle East and Africa, Latin America, Eastern Europe
Countries Covered
United States, Canada, Mexico, Brazil, Chile, Colombia, United Kingdom, Germany, France, Netherlands, Spain, Italy, Sweden, Poland, Romania, Czechia, China, Japan, South Korea, Taiwan, Singapore, India, Australia, Indonesia, Vietnam, Philippines, Saudi Arabia, United Arab Emirates, Qatar, Kenya, South Africa
Key Companies Profiled
Smiths Detection, Leidos, OSI Systems, Nuctech, Analogic, CEIA, Evolv Technology, Xtract One Technologies, Astrophysics, Autoclear, Adani Systems, VOTI Detection, Westminster Group, Liberty Defense, Bruker, Teledyne ICM, Garrett Metal Detectors, Metrasens, Vanderlande, Gilardoni
Quantitative Methodology
Primary survey, n=3,800 respondents, Q4 2025, six countries; demand-side model with trade association cross-validation
Qualitative Methodology
47 expert interviews, Q4 2025; applied to validate demand model assumptions, identify emerging dynamics, and assess competitive positioning
Report Format
PDF and XLSX data workbook (Word format preview document)
Publisher
Market Minds Advisory
Report Code
MMA-2026-TEC-971
Published
September 2026
Contact
sales@marketmindsadvisory.com | www.marketmindsadvisory.com

Purchase the full Security Screening Market Report (2026 to 2036).

The full MMA report treats screening as a throughput and staffing market rather than a detection one, and examines whether venue screening survives the alarm rates its buyers are now measuring. It sizes the market to 2036 across six screening modalities, seven regions and 31 countries, with segment growth rates and regional demand mechanisms set out throughout. Competitive analysis covers 20 suppliers assessed on measured equipment and service revenue, with moat and risk assessment for the two leaders. The report quantifies component and certification cost structure, service network economics and margin architecture across three portfolio tiers. It closes with four strategic verdicts and an anonymised stadium operator engagement.
Six screening modalities sized through 2036
Seven regions with demand mechanism analysis
Twenty suppliers on consistent revenue basis
Throughput, alarm rate and certification benchmarks
Margin architecture across three portfolio tiers
Anonymised stadium entrance screening programme engagement

Built For The People Who Decide

From boardroom strategy to bench-side execution, this report is read cover-to-cover by leaders shaping the next decade of their industry, turning demand scenarios, market dynamics and valuation benchmarks into decisions.
CXOs/ Presidents/ VPs/ Managers
M&A and Corporate Development
Strategy Teams and R&D Heads
Procurement and Product Directors
Regulatory and Compliance Leaders
Investor Relations and Equity Analysts