Market Minds Advisory
Security and Vulnerability Management Market

Security and Vulnerability Management Market: Security and Vulnerability Management Market. Trends and Forecast 2026 to 2036

Enterprises facing escalating ransomware and supply chain attacks are deploying AI-powered autonomous remediation platforms that patch and contain threats without waiting for human analyst response, forcing legacy scanning vendors to defend contracts.

Lead Analyst

Published

September 2026

Make Smarter Decisions with Customized Research Insights

Request a free sample report and evaluate market opportunities, growth trends, and competitive dynamics relevant to your business needs.

2025 MARKET VALUE$15.8BMarket Size 2025
2036 FORECAST VALUE$47.4BBase Case , 2026 to 2036
CAGR 2026 TO 203610.5 %Bull 11.8% / Bear 9.2%
INCREMENTAL OPPORTUNITY$29.9BNet 10- year value creation
EXPANSION MULTIPLE2.71x2036 value over 2026 base
Strategic Levers
M&A Pipeline
Regional Outlook
Country Rankings
Competitive Intelligence
Segmental Deep-dive
Call-Us : 91 93563 13602

Executive Snapshot and Market Trajectory.

Security and vulnerability management platforms are moving from periodic scanning and manual patch prioritization toward continuous, AI-driven systems that detect, prioritize, and increasingly remediate vulnerabilities autonomously across enterprise environments, technology stacks, and hybrid infrastructure deployments worldwide, reshaping how security teams allocate their limited time, resources, and attention across the organization.
Financial services and critical infrastructure enterprises drive the largest share of near-term platform adoption, valuing vulnerability management systems that reduce exposure windows across increasingly complex hybrid cloud environments, distributed workforces, and remote access architectures worldwide today. AI-powered autonomous threat remediation platforms are growing fastest as enterprises seek systems capable of closing vulnerabilities faster than human security teams can manually triage and patch every identified exposure across their entire technology footprint.
Competitive intensity centers on established vulnerability scanning vendors defending share against cloud-native security platforms built specifically around automated remediation and continuous exposure management across multiple enterprise environments and industries today and across most geographic markets. Integration depth with existing enterprise security infrastructure and proven detection accuracy increasingly determine which vendors win larger multi-year platform contracts over point scanning tools lacking comparable automation capability and engineering depth.
Market Definition
This report covers security and vulnerability management platforms that scan, detect, prioritize, and remediate security vulnerabilities across enterprise IT infrastructure, applications, and cloud environments. It excludes standalone antivirus and endpoint protection software not integrated with vulnerability scanning capability and general network monitoring tools without dedicated vulnerability assessment functionality.
Base Year Value
$15.8B in 2025 (MMA Primary Research Dataset, September 2026)
Forecast Period
2026 to 2036, eleven discrete annual values
CAGR
10.5% base case. Bull 11.8%. Bear 9.2%.
Fastest Growth Segment
AI-Powered Autonomous Threat Remediation Platforms: 17.0% CAGR
Fastest Growth Country
India: 14.5% CAGR
Fastest Growth Region
South Asia and Pacific: 12.5% CAGR
Largest Region
North America: 31% of 2025 global value
Market Leaders
Leading participants include Tenable, Qualys, Rapid7, CrowdStrike, and Palo Alto Networks.
Primary Survey
n=3,800 procurement and R&D decision-makers, Q4 2025, six countries
Methodology
Demand-side build-up, cross-validated against public data, 47 expert interviews

Security and Vulnerability Management Market Forecast Scenarios

security-and-vulnerability-management-market-size-forecast-scenario-1788503605921
Security and vulnerability management demand between 2020 and 2025 grew steadily as enterprises accelerated cloud migration and faced escalating ransomware and supply chain attack frequency across increasingly distributed IT environments worldwide. Adoption concentrated initially in financial services and technology sectors, with healthcare and critical infrastructure following as regulatory scrutiny expanded considerably across most industries and geographic markets.
The base case assumes continued growth driven by three mechanisms: expanding hybrid cloud and multi-cloud infrastructure complexity requiring continuous vulnerability visibility across dynamic environments, growing adoption of AI-driven autonomous remediation reducing dependence on manual patch prioritization, and rising regulatory and cyber insurance requirements mandating comprehensive vulnerability management programs across most enterprise sectors and industry verticals. Platform and analytics subscription revenue grows meaningfully faster than point tool licensing industry-wide over the coming years.
The bull case centers on enterprises standardizing on unified security platforms that autonomously remediate an increasing share of identified vulnerabilities across their entire technology stack and infrastructure footprint. The bear case involves cloud hyperscalers bundling comparable vulnerability management capability directly into their existing infrastructure offerings, commoditizing the standalone platform category considerably within a handful of years.

Where Detection Becomes Autonomous Remediation

The security and vulnerability management market has moved past its early periodic scanning phase into a period defined by continuous, AI-driven exposure management that autonomously prioritizes and increasingly remediates vulnerabilities without waiting for human analyst intervention. Enterprises increasingly evaluate vendors on remediation automation depth and detection accuracy rather than basic scanning frequency alone, since exposure windows directly correlate with breach risk.
MARKET CONCENTRATION34%Top five vendors hold combined global platform revenue share
AVERAGE CONTRACT VALUE$420,000Typical annual subscription for a large enterprise deployment
FINANCIAL SERVICES SHARE29%Share of total platform revenue from financial services customers
EXPOSURE WINDOW REDUCTION54%Typical improvement in vulnerability remediation cycle time nationwide
CONTRACT RENEWAL CYCLE3 yearsTypical multi-year enterprise subscription contract length nationwide today
AUTONOMOUS REMEDIATION SHARE31%Share of identified vulnerabilities remediated without human review
Financial services and critical infrastructure enterprises drive the largest share of platform revenue, though healthcare and technology sectors are adopting comparable automation density fastest given rising regulatory scrutiny. AI-powered autonomous remediation capability is capturing growing share of new enterprise contracts as organizations confront vulnerability volume that exceeds human security team review capacity. Enterprises increasingly treat this capability as a baseline expectation rather than a differentiating premium feature worth extra spend.
Vendor differentiation increasingly centers on AI-driven remediation automation and integration breadth rather than basic scanning functionality alone, with vendors investing in autonomous patch orchestration becoming the primary competitive battleground. Enterprise customers increasingly favor vendors demonstrating proven detection accuracy and remediation success rates across multiple infrastructure environments. Vendors unable to demonstrate this automation depth increasingly struggle to win larger multi-year enterprise contracts.
"A vulnerability scanner used to be a report generator. Now customers expect it to fix the thing before the analyst even reads the alert."
Senior Analyst, Cybersecurity and Threat Management Practice · MMA Technology Practice · September 2026

Market Trends

Autonomous Remediation Replaces Manual Patch Prioritization

Security platforms are integrating AI models capable of automatically prioritizing, testing, and deploying patches for identified vulnerabilities without requiring manual security analyst review for lower-risk, well-understood exposure categories, substantially compressing the time between vulnerability discovery and remediation compared to traditional manual triage workflows. This automation capability lets security teams handle substantially higher vulnerability volume without proportional headcount growth, a shift that has become increasingly critical as enterprise attack surfaces expand faster than security staffing budgets across most industries. Vendors expect this to become standard within a decade. Growth continues steadily.
Market Impact: Cloud infrastructure complexity grew 52%
Continuous Exposure Management Replaces Periodic Scanning

Vendors are shifting from scheduled periodic vulnerability scans toward continuous, always-on monitoring that detects new exposures the moment they appear across dynamic cloud and hybrid infrastructure environments, addressing the fundamental limitation of point-in-time scanning that misses vulnerabilities introduced between scheduled scan cycles. This technical evolution improves detection speed considerably for genuinely new threats while giving security teams real-time visibility into their actual current exposure rather than a snapshot that may already be outdated by the time it reaches review. Vendors investing in real-time detection infrastructure increasingly capture disproportionate share of new enterprise contracts across most industries.
Market Impact: Unpatched-flaw breaches rose 37%

Market Opportunities and Growth Drivers

Cloud Infrastructure Complexity Outpaces Manual Security Review

Enterprise cloud and hybrid infrastructure complexity continues expanding substantially faster than the security staff available to manually review and remediate every identified vulnerability individually, creating an operational gap that automated platforms are increasingly necessary to close across most large enterprise environments. Organizations that previously managed a few hundred servers through manual security review now oversee thousands of dynamic cloud instances and containers, a scale transition that makes automated vulnerability management an operational necessity rather than a discretionary technology investment for security leadership. This scale transition shows no sign of slowing as enterprises continue expanding cloud infrastructure footprint.
Market Impact: Accuracy concerns limited automation in 29%

Ransomware Frequency Pushes Faster Remediation Investment

Ransomware and supply chain attack frequency continues rising across most industries, pushing enterprises toward vulnerability management systems that close exposure windows faster than manual remediation processes historically allowed given the speed at which attackers exploit newly disclosed vulnerabilities. This attack frequency pressure increasingly pushes organizations toward automated remediation even in applications where manual review might technically suffice, since the cost differential is small relative to the breach cost exposure a single successful attack creates for the organization. This attack frequency pressure shows no sign of easing across most industries facing comparable exposure risk.
Market Impact: Integration delays added 24% to timelines

Market Restraints and Challenges

Autonomous Remediation Accuracy Concerns Limit Trust

Enterprises remain hesitant to fully automate remediation for high-stakes production systems, given persistent concerns about automated patches causing unintended system disruption or downtime that manual review would have caught before deployment. The root cause lies in the inherent complexity of predicting every possible interaction between a patch and an enterprise's specific, often highly customized production environment configuration. Vendors are responding with staged rollout capabilities and rollback automation that reduce the risk of automated remediation causing unintended production disruption. This trust-building process remains incomplete across much of the highest-stakes production system category segment.
Market Impact: Autonomous remediation cut exposure windows 54%

Legacy System Integration Complicates Platform Deployment

Enterprises with substantial legacy IT infrastructure predating modern API-based integration standards face significant deployment challenges when implementing vulnerability management platforms that require comprehensive visibility across the entire technology stack to generate reliable risk prioritization. The root cause traces to decades of accumulated legacy systems built independently without consideration of future security platform integration requirements. Vendors are responding with legacy system compatibility modules and phased integration approaches that reduce upfront deployment complexity for enterprises. This modular approach gradually reduces the integration burden for enterprises with fragmented legacy IT infrastructure. today. nationwide.
Market Impact: Continuous monitoring improved detection speed 46%
3 additional market trends, 4 additional growth drivers, and 2 additional restraints and challenges are covered in the full report. Contact sales@marketmindsadvisory.com to access the complete intelligence.

Segment CAGR and Growth Architecture

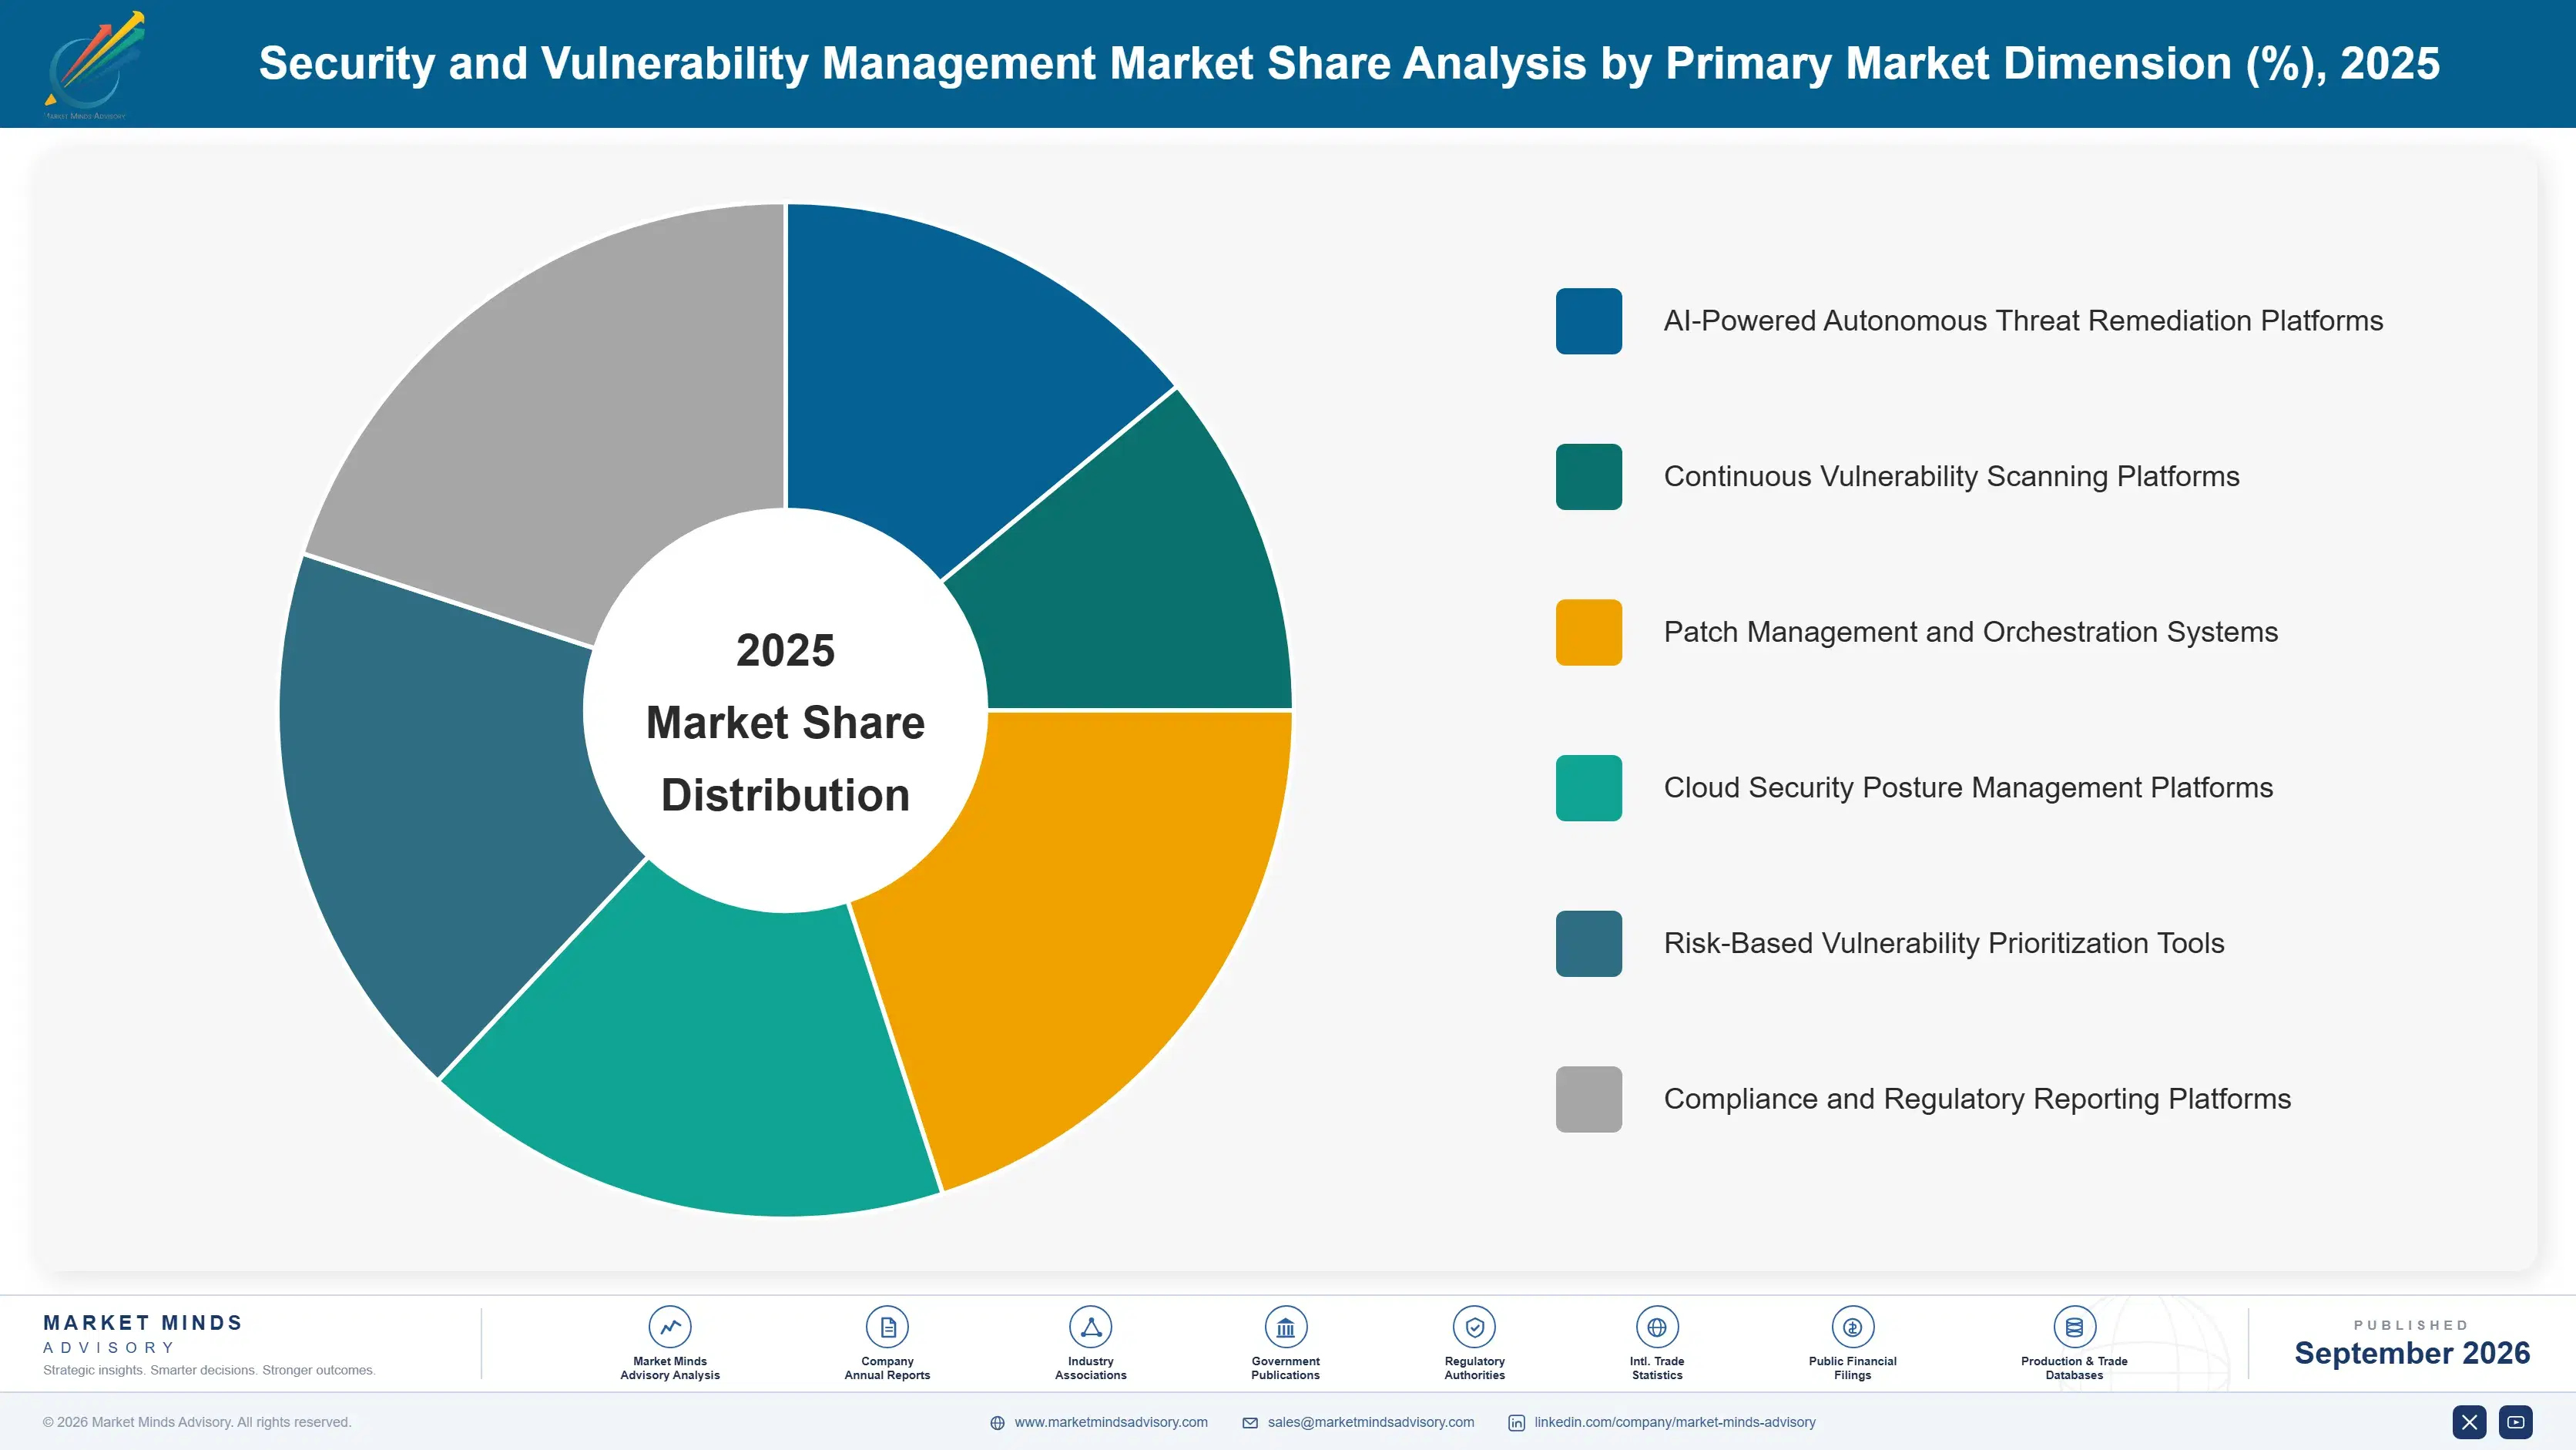
The security and vulnerability management market segments by remediation capability rather than by industry vertical, since the same detection, prioritization, and patching architecture serves financial services, healthcare, and technology customers with comparable technical requirements across most deployment scales. This dimension captures the functional distinction driving vendor investment priorities and pricing strategy across the industry.
security-and-vulnerability-management-market-market-share-analysis-1788503606516

AI-Powered Autonomous Threat Remediation Platforms

AI-powered autonomous threat remediation platforms use machine learning models to automatically prioritize, test, and deploy patches for identified vulnerabilities without requiring manual security analyst review for lower-risk exposure categories, addressing the fundamental limitation of manual triage that cannot scale with expanding attack surfaces. This segment commands the fastest growth in the entire market, driven by enterprises seeking measurable exposure window reduction that manual remediation processes cannot deliver reliably at meaningful scale. Adoption concentrates initially among larger enterprises with sufficient historical vulnerability data to train meaningful automation models, though smaller organizations are beginning to adopt shared industry threat intelligence that lowers the data threshold required for meaningful adoption. Vendors expect this to become standard.
CAGR 17.0%

Cloud Security Posture Management Platforms

Cloud security posture management platforms provide continuous visibility into misconfigurations and vulnerabilities across dynamic multi-cloud environments, addressing the fundamental limitation of periodic scanning that cannot keep pace with rapidly changing cloud infrastructure configurations and deployment patterns across the entire enterprise organization today and tomorrow. This segment grows faster than traditional on-premises vulnerability scanning as enterprises increasingly migrate workloads to hybrid and multi-cloud architectures requiring continuous configuration monitoring and compliance validation across every environment and workload. Vendors with proven multi-cloud integration capability capture disproportionate share of this segment's expanding demand relative to vendors still relying on periodic, on-premises-focused scanning approaches lacking comparable cloud-native architecture and engineering depth built over many years nationwide.
CAGR 13.5%
Full segment breakdown across 6 segments available in the complete report.

Regional Architecture and Country Demand Map

North America leads as the largest regional market given concentrated cybersecurity vendor headquarters and early enterprise adoption across major industry sectors, while South Asia and Pacific grows fastest on rapid enterprise digitization and cloud migration. Regional shares reflect vendor concentration, cyber threat exposure, and regulatory requirements worldwide.

North America

North America's leading regional share reflects concentrated cybersecurity vendor headquarters and specialized AI development talent across the United States, where major cloud platforms and cybersecurity companies compete for large enterprise contracts. American financial services and technology enterprises drive the largest share of near-term platform spend, valuing measurable exposure window reduction across increasingly complex hybrid cloud environments. Canadian enterprises follow comparable adoption patterns at a smaller scale, often through the same North American vendors serving US customers. Growth here trails the fastest-expanding Asian markets given already-substantial existing platform penetration across most large enterprise segments and industry verticals. This dominant position appears durable given the depth of enterprise relationships and specialized AI talent concentrated across the region's technology hubs.
Share: 31% | CAGR: 11.0% (2026 to 2036)

Western Europe

Western Europe combines mature enterprise security adoption in Germany, the United Kingdom, and France with growing vulnerability management investment responding to stringent European Union regulatory requirements across major national industries. Regional growth trails North America and East Asia given already-established security platform baselines across major enterprise customers and comparatively slower generative AI automation adoption relative to US counterparts given data governance considerations. German and British vendors increasingly compete for the same multinational enterprise accounts, keeping regional pricing more standardized than the fragmented US market currently exhibits across comparable enterprise segments. This dynamic keeps competitive intensity concentrated among a smaller set of established vendors serving comparable multinational enterprise accounts consistently. today.
Share: 22% | CAGR: 9.0% (2026 to 2036)
Regional intelligence for 5 additional markets available in the complete report: East Asia, South Asia and Pacific, Latin America, Middle East and Africa, Eastern Europe. Contact sales@marketmindsadvisory.com.
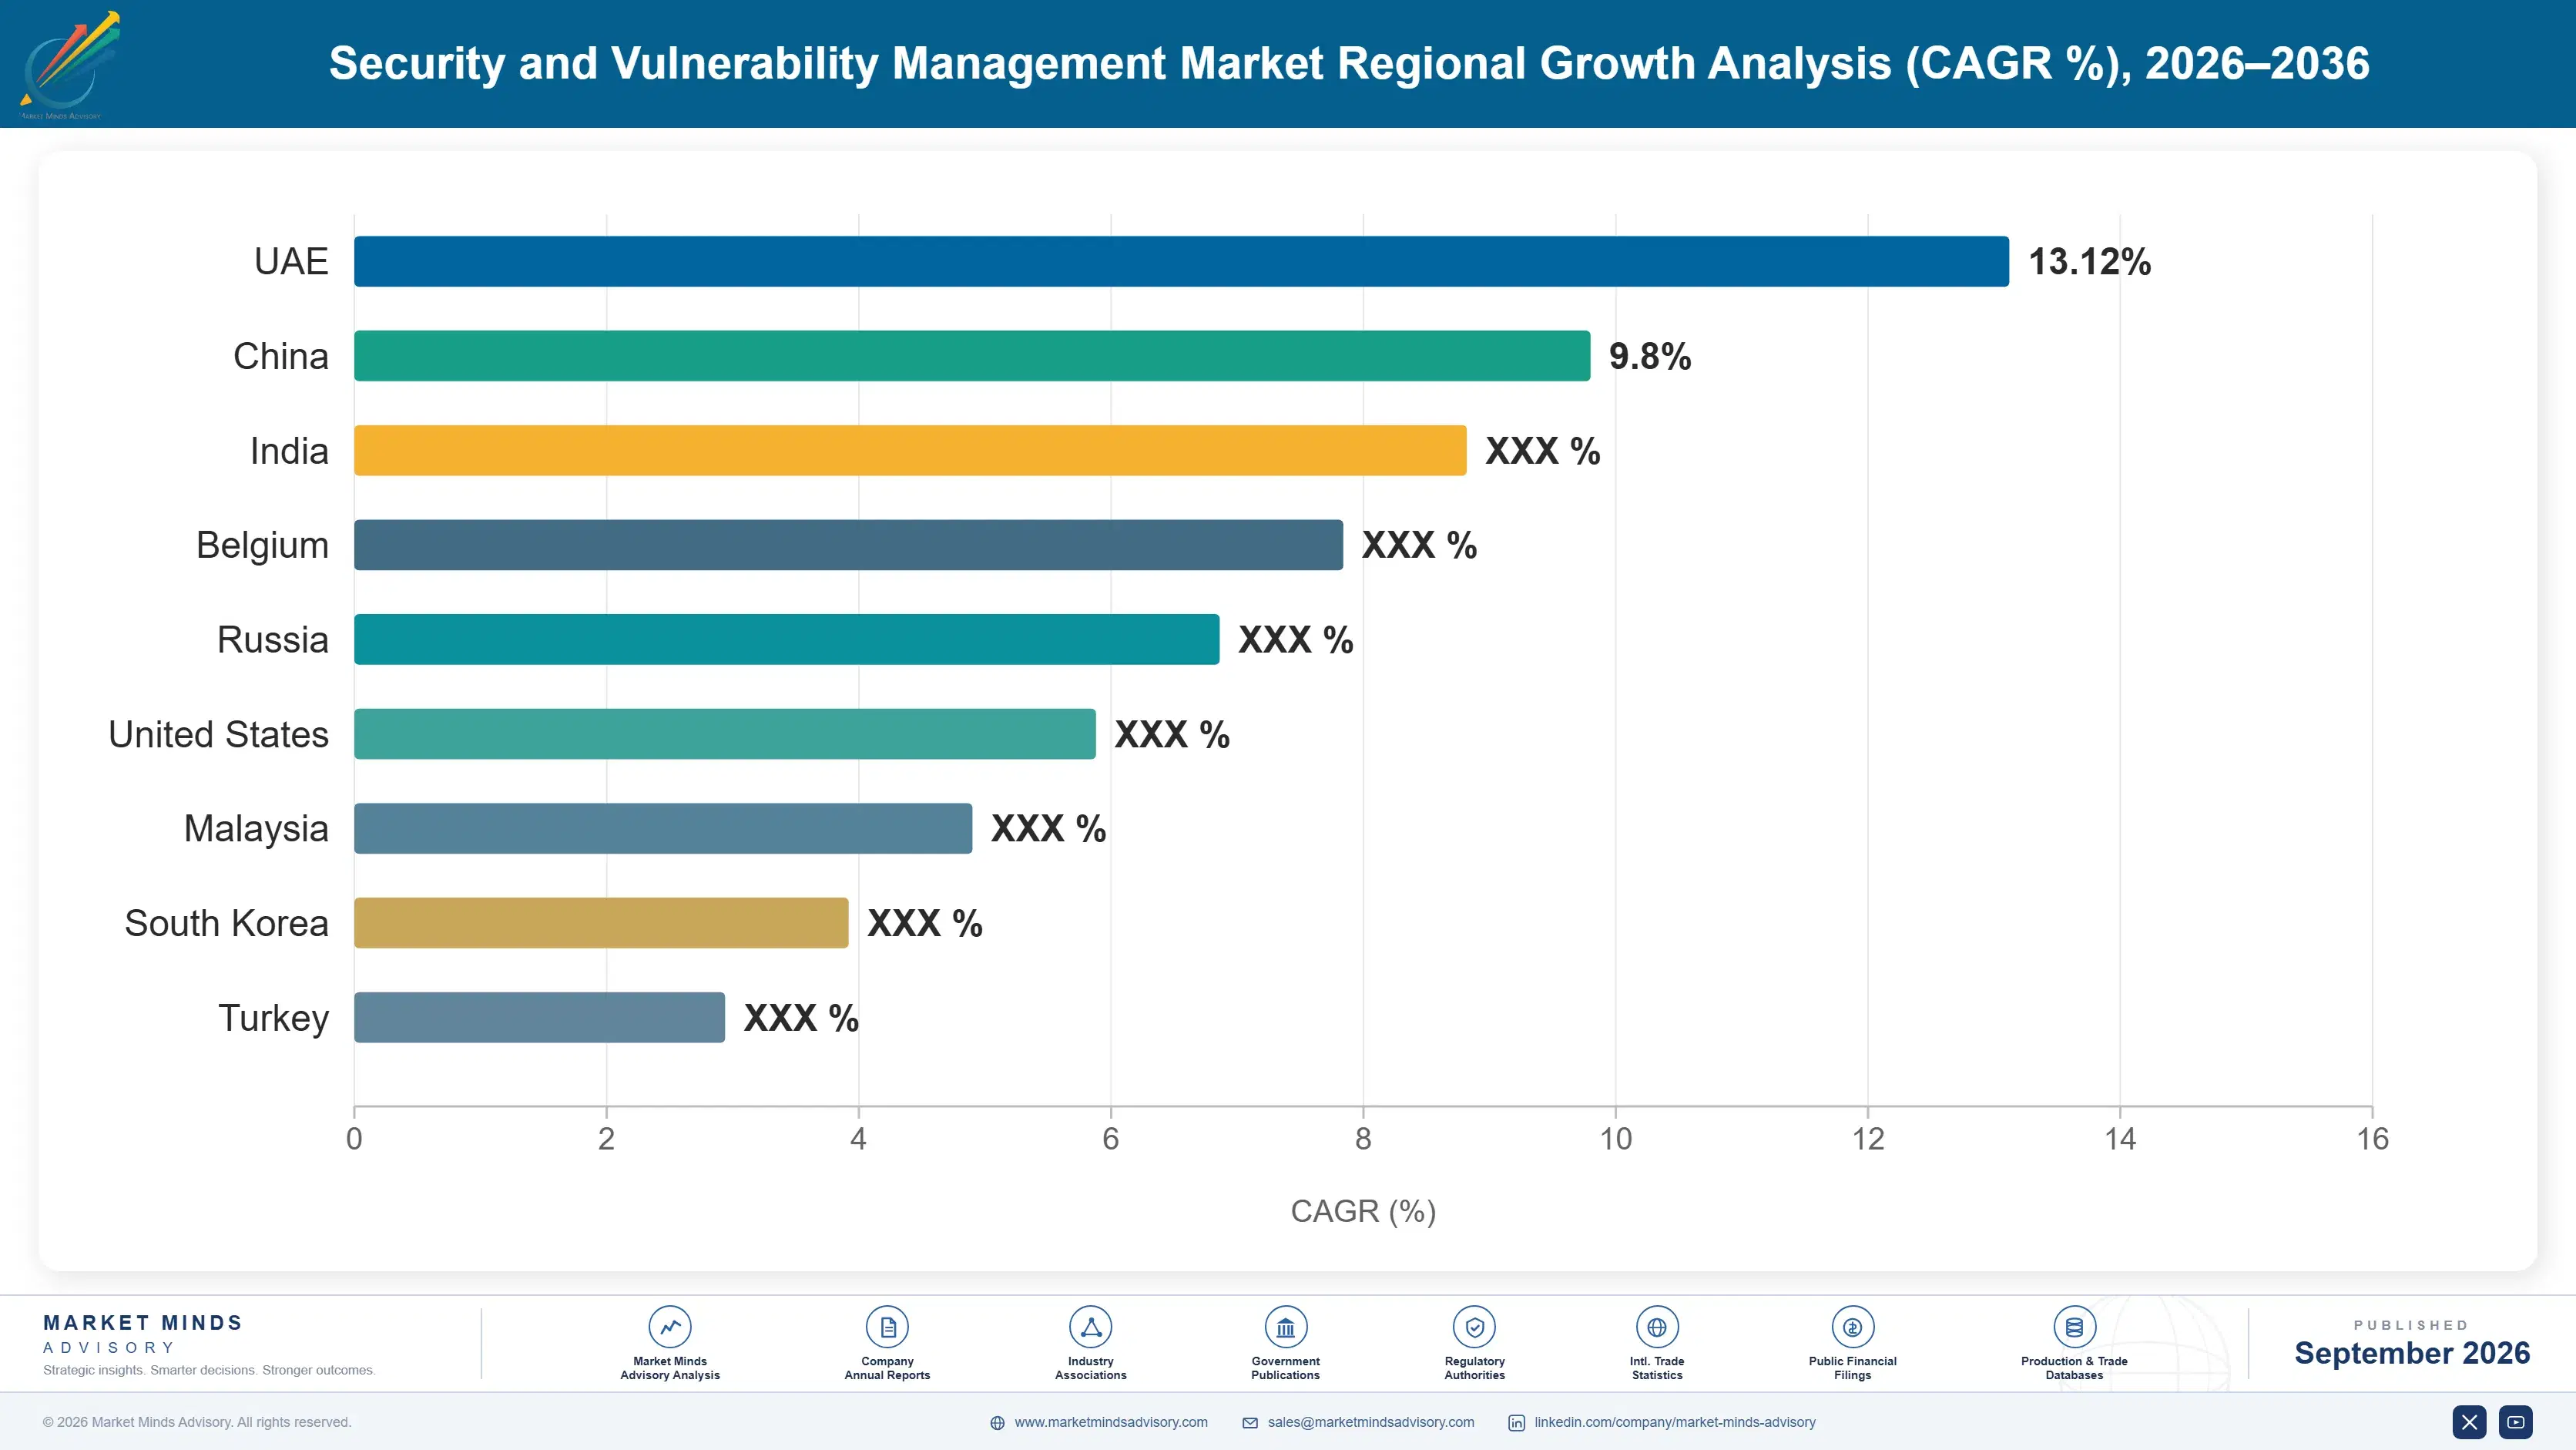
security-and-vulnerability-management-market-country-cagr-analysis-1788503607041

How Vendors Grow Enterprise Contract Value

Security and vulnerability management vendors are moving well beyond one-time platform licensing toward layered commercial relationships that capture recurring revenue across an enterprise's full security operations lifecycle, from initial deployment through years of subsequent threat intelligence, consulting, and licensing services spanning the entire enterprise relationship nationwide and across every single international market currently served.

Bundle Threat Intelligence Subscriptions with Core Scanning

Vendors are attaching proprietary threat intelligence subscriptions directly to core vulnerability scanning platform sales, capturing recurring revenue while giving enterprises continuously updated exploit intelligence beyond raw vulnerability data alone. This shift has lifted average enterprise contract value by roughly 33% compared to scanning-only subscriptions, since intelligence subscriptions continue generating revenue across the full multi-year platform relationship regardless of vulnerability volume changes. Enterprises increasingly negotiate this bundle upfront rather than adding intelligence as a later procurement amendment across their deployment. This creates a durable moat competitors selling standalone scanning without comparable intelligence cannot easily replicate.
Market Impact: Intelligence bundling lifts contract value by roughly 33%

Offer Incident Response Consulting Alongside Remediation

Vendors with deep security operations expertise are expanding into paid incident response consulting services, helping enterprises respond to active breaches and integrate lessons learned into their broader vulnerability management program before committing to expanded platform deployment. This higher-margin services layer commands premium consulting rates well above standard platform licensing, and vendors report win rates for expanded platform contracts rising by roughly 27% when consulting engagements precede the sale. Enterprises value this sequencing since it reduces uncertainty before committing to broader platform expansion investment. Vendors report meaningfully stronger long-term account relationships when consulting precedes platform negotiation.
Market Impact: Consulting-first engagements lift win rates by roughly 27%

Expand into Cloud Security Posture Management Contracts

Vendors with established on-premises vulnerability scanning relationships are cross-selling cloud security posture management capability covering an enterprise's entire multi-cloud footprint rather than isolated on-premises scanning negotiated separately, capturing additional wallet share without incurring new customer acquisition cost. This uses existing trust and technical credibility to capture a broader infrastructure footprint, lifting per-enterprise revenue by an estimated 24% where cross-selling succeeds. Enterprises welcome this consolidation since it simplifies vendor management across their entire security technology stack. Vendors report enterprises rarely resist this expansion once initial deployment proves technically reliable and trusted.
Market Impact: Cloud posture cross-selling lifts revenue by roughly 24%

License Detection Algorithms to Smaller Security Vendors

Vendors with proven AI-driven vulnerability detection algorithms are licensing this technology directly to smaller regional security vendors rather than only deploying it within their own branded platform, an asset-light model that expands addressable revenue considerably beyond direct enterprise sales capacity. This lets algorithm developers capture licensing revenue across a far broader vendor base than their own sales organization could reach, with licensing fees typically representing 10% to 15% of the licensee's platform revenue. This model scales efficiently since marginal support costs stay low across each additional licensee relationship. Licensing arrangements also strengthen technical relationships valuable for future collaboration.
Market Impact: Licensing fees capture 10-15% of the licensee's revenue

Who Controls the Margin Pool

Concentration among the top five security and vulnerability management vendors sits near thirty-four percent of global platform revenue, reflecting a genuinely fragmented market where established scanning vendors and endpoint security giants compete across different enterprise segments. Tenable and Qualys lead on vulnerability scanning heritage and enterprise relationship depth respectively, with a meaningful gap separating them from Rapid7, CrowdStrike, and Palo Alto Networks, each building distinct positioning around incident response integration, endpoint detection, or comprehensive security platform breadth respectively.
Current competitive activity centers on integrating AI-driven autonomous remediation and continuous exposure management into standard platform offerings, alongside expanding cloud security posture management capability addressing multi-cloud infrastructure complexity. Vendors are also pursuing partnerships with cloud hyperscalers to secure infrastructure integration ahead of large enterprise deployments rather than competing purely on scanning specifications after platform decisions are finalized.

Rankings could shift meaningfully as cloud-native security platforms building genuine autonomous remediation capability win larger enterprise contracts previously distributed across a more fragmented scanning vendor base. Established vendors slow to develop dedicated automation and cloud-native capability risk ceding the fastest-growing segment of the market to challengers built specifically around next-generation continuous exposure management requirements.
security-and-vulnerability-management-market-company-positioning-matrix-1788503607589

Competitive Moat and Risk Dimensions

TENABLE

Moat: Vulnerability Scanning Heritage Depth

Tenable's decades of vulnerability scanning experience and established enterprise relationships give it deployment scale and technical credibility that newer entrants cannot replicate quickly, letting it win large multi-year contracts bundling scanning with broader exposure management capability. This installed base advantage is difficult for newer entrants to replicate given the long sales cycles and switching costs involved.
TENABLE

Risk: Legacy Architecture Slower to Modernize

Tenable's scanning-centric development heritage has made it comparatively slower to integrate AI-driven autonomous remediation than venture-backed specialists, risking share loss in the fastest-growing segment if this development gap persists over time. Competitors built natively around autonomous automation increasingly outpace this legacy development approach in feature releases and speed.
QUALYS

Moat: Enterprise Cloud Platform Scale

Qualys's cloud-native platform architecture built over many years gives it scalability advantages and comprehensive asset visibility that on-premises-focused competitors struggle to match, supporting premium pricing for enterprises requiring consistent scanning across global, distributed infrastructure footprints. This scalability advantage remains difficult for smaller competitors lacking comparable cloud infrastructure investment to replicate quickly.
QUALYS

Risk: Premium Pricing Faces New Competition

Qualys's premium pricing tied to its comprehensive platform depth faces growing competitive pressure from cloud-native startups achieving comparable capability at lower cost structures, potentially ceding price-sensitive enterprise segments to newer competitors over time. This gap could widen further as cloud-native startups continue expanding comparable platform capability at scale and speed.

Players Tracked

Prominent Players

Tenable
Qualys
Rapid7
CrowdStrike
Palo Alto Networks

Other Key Players

Microsoft Defender
IBM Security
Fortinet
Check Point Software
Trend Micro
Cisco Security
SentinelOne
Wiz
Orca Security
Lacework
Snyk
Veracode
Checkmarx
Aqua Security
Armis

Recent Developments

AUGUST 2025

Tenable acquired an autonomous remediation startup in August 2025 to accelerate AI-driven patch orchestration integration into its vulnerability scanning platform, strengthening its position against cloud-native challengers already offering comparable automation to enterprise customers currently evaluating platform upgrades across regulated industries this year. Analysts expect similar consolidation moves from peer vendors.
Signal: Signals established scanning vendors racing to close the automation capability gap through targeted acquisition rather than internal development
NOVEMBER 2025

Qualys entered a strategic partnership with a leading cloud hyperscaler in November 2025 to co-develop native cloud security posture modules optimized for multi-cloud environments, securing preferred infrastructure access ahead of upcoming enterprise migration cycles across multiple industry verticals. Analysts view this as a preview of broader hyperscaler alignment.
Signal: Signals vendors pursuing preferred cloud infrastructure access to secure design-in positions ahead of enterprise migration cycles
FEBRUARY 2026

Rapid7 launched an expanded continuous exposure management platform in February 2026, enabling enterprises to monitor and prioritize vulnerabilities across on-premises and cloud infrastructure simultaneously, addressing growing demand for unified visibility across complex hybrid technology environments. Analysts see this as a direct response to enterprise pressure.
Signal: Signals vendors building unified hybrid infrastructure visibility to address growing enterprise demand for comprehensive exposure management

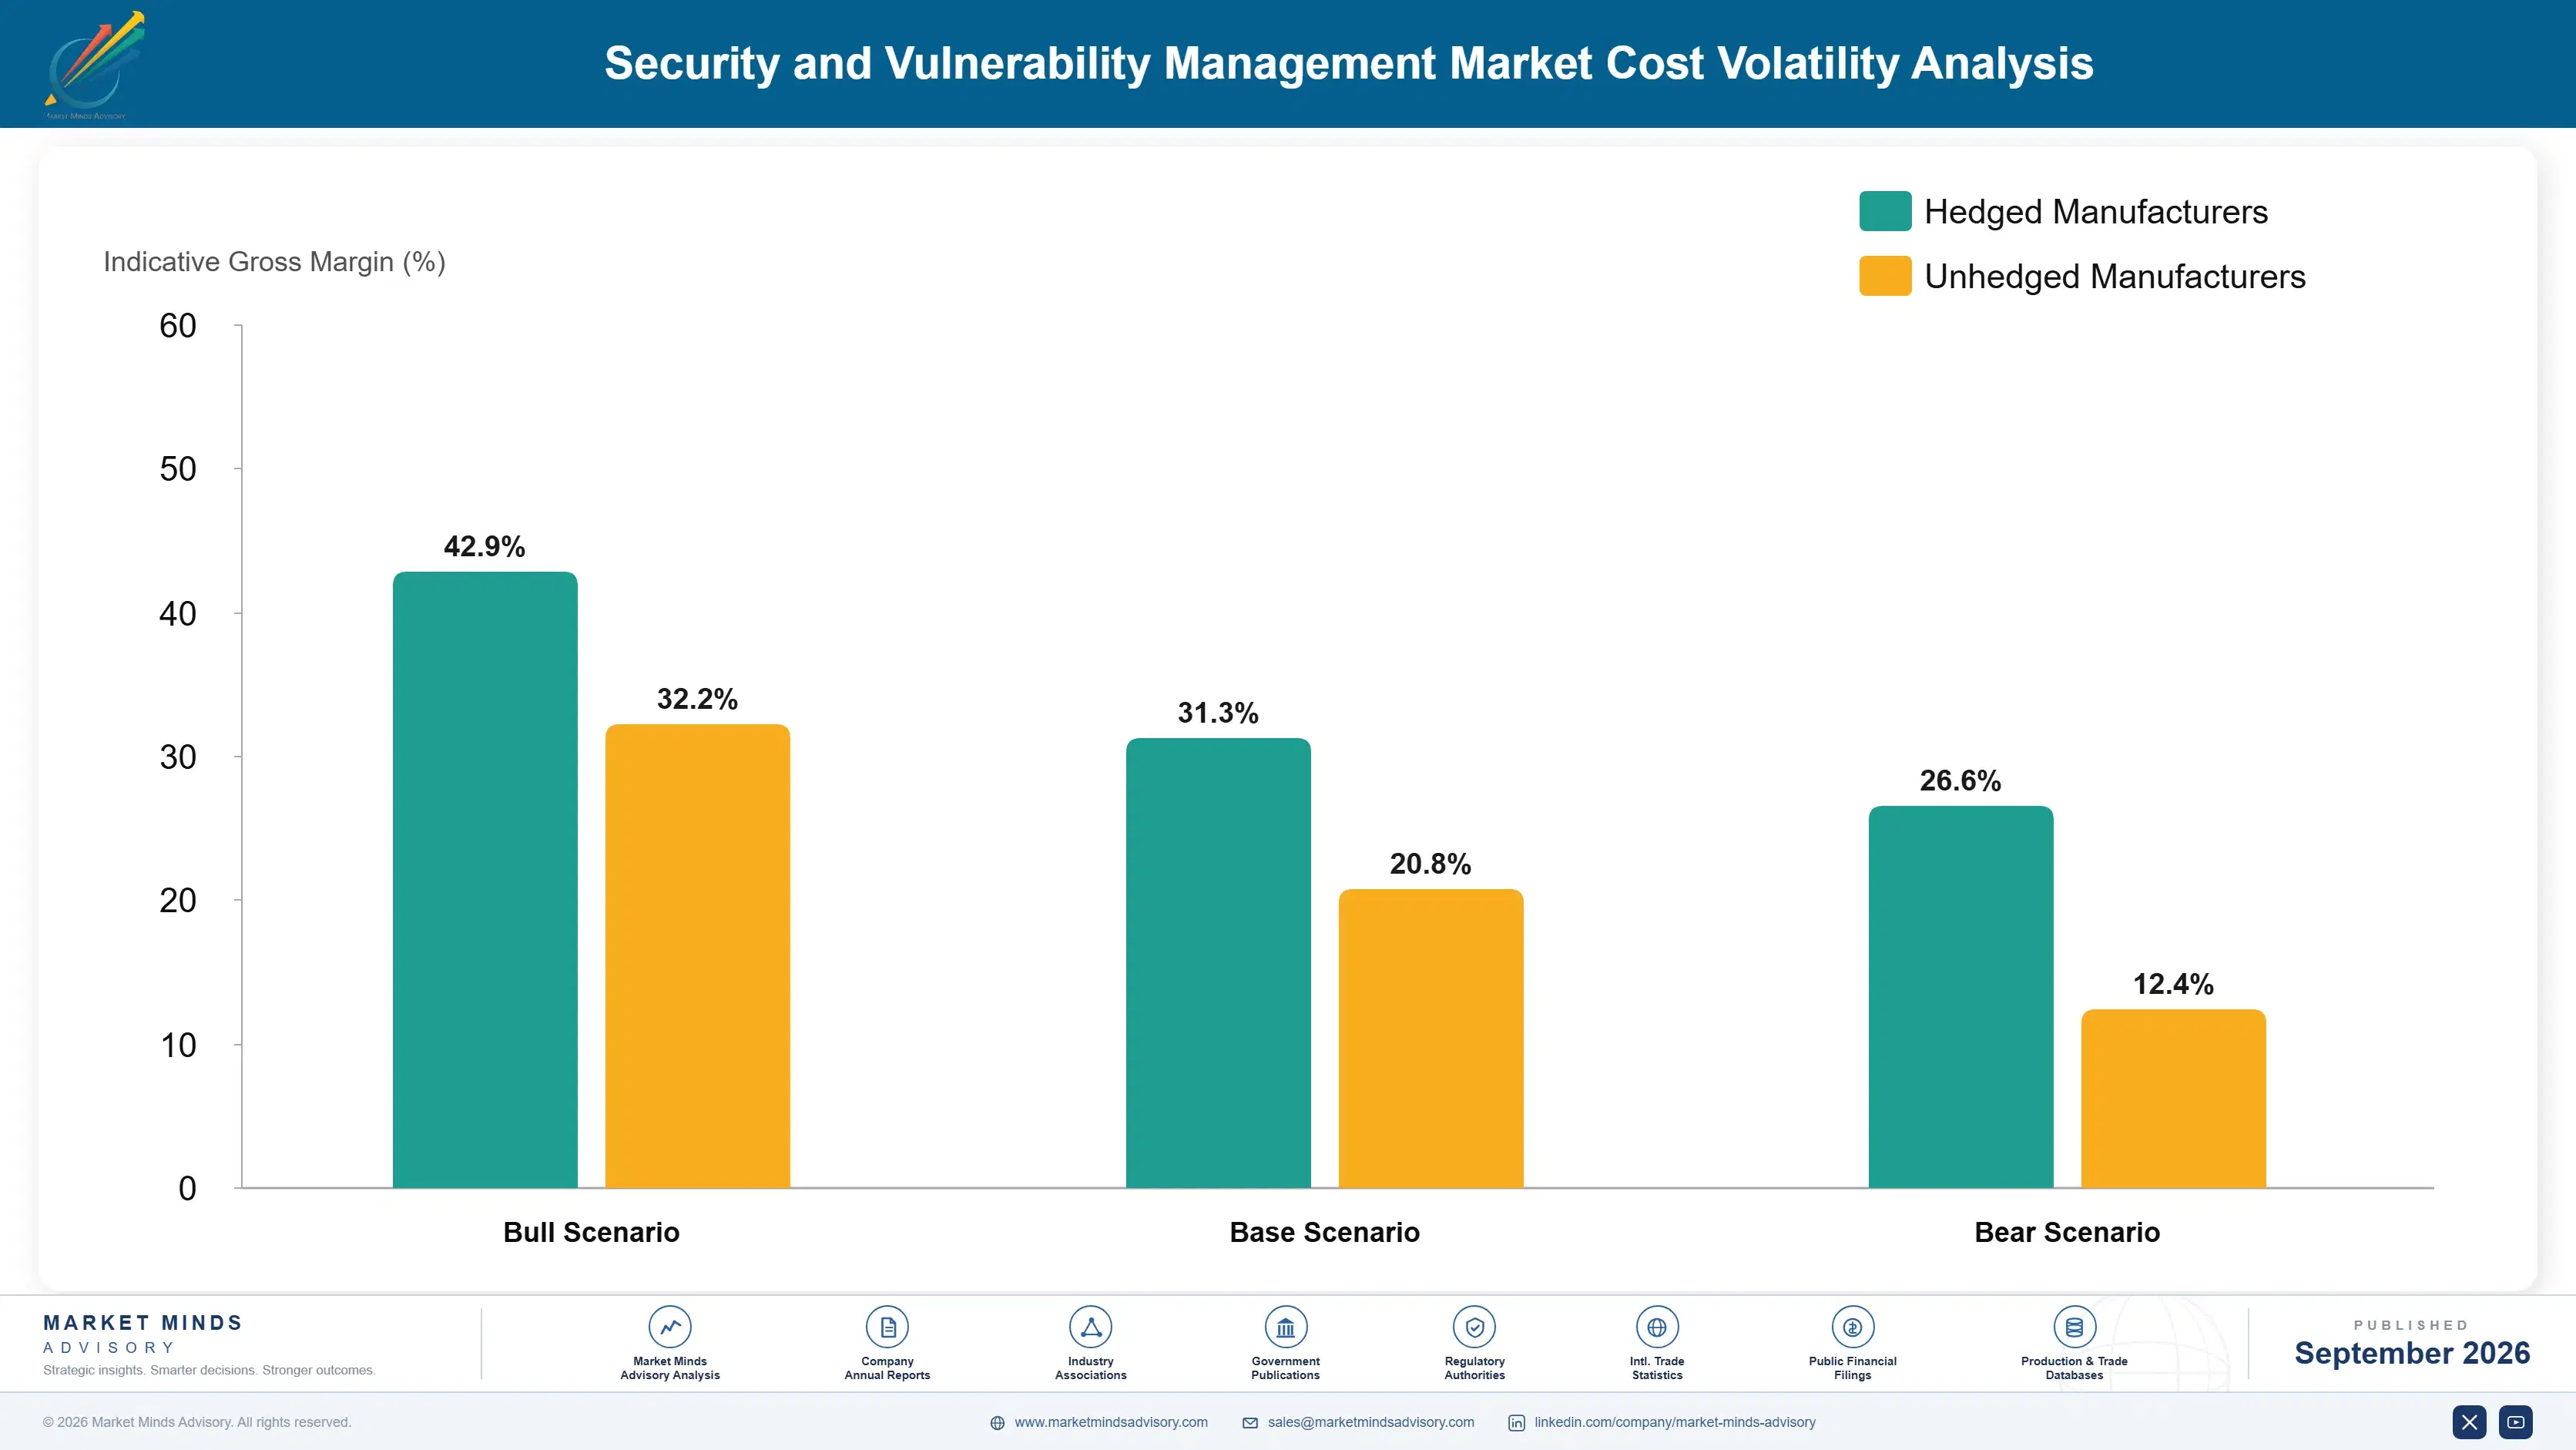
Compute and Talent Costs Squeeze Margins

Cloud compute and GPU infrastructure account for roughly 30 to 38% of vendor cost of goods sold as AI-driven remediation and continuous scanning workloads scale, sourced predominantly from Amazon Web Services, Microsoft Azure, and Google Cloud data centers. Skilled security engineering talent, concentrated in North America and Western Europe, adds another meaningful share of platform delivery expense.
NVIDIA's fiscal 2025 annual report noted sustained data center GPU demand outpacing available supply, lifting accelerator pricing across cloud providers passing costs downstream. Security vendors running large language model based threat analysis absorbed compute cost increases of roughly 18 to 25% through 2025, compressing gross margins for smaller vendors lacking negotiated hyperscaler capacity commitments and reserved instance pricing agreements already secured by larger competitors. Cost pressure has persisted into 2026.

Vendors without long-term reserved compute contracts face a genuine cost disadvantage against hyperscaler-affiliated competitors who secure preferential GPU allocation and volume discounts unavailable to smaller entrants. This exposure concentrates among challenger vendors in Asia Pacific markets where local cloud capacity remains constrained, while established North American and European vendors maintain negotiated capacity buffers that smooth quarterly cost volatility. The gap is widening each quarter.
security-and-vulnerability-management-market-cost-volatility-analysis-1788503607791

Secure Multi-Year Reserved Compute Capacity Agreements

Vendors are negotiating multi-year reserved GPU and compute capacity agreements directly with hyperscalers to lock in pricing ahead of anticipated demand growth. These agreements shield gross margins from spot pricing volatility and guarantee the compute availability autonomous remediation workloads require during peak enterprise deployment cycles nationwide. Several vendors have already signed multi-year commitments to secure pricing certainty.

Diversify Talent Sourcing Through Distributed Engineering Hubs

Vendors are expanding engineering hubs into India, Poland, and Eastern Europe to reduce dependence on costlier North American and Western European talent pools. This distributed sourcing approach lowers blended delivery cost while maintaining access to specialized security engineering skill required for advanced remediation platform development work. Several vendors report meaningful reductions in average blended engineering cost after expansion.

Portfolio Architecture for Margin Defence

Vendor economics split cleanly along three tiers. Commodity-adjacent scanning tools compete on price and licensing volume, delivering gross margins in the 55 to 62% range on thin per-seat contracts. Certified enterprise platforms carrying compliance attestations command 68 to 75% gross margins, reflecting the switching cost buyers face once a platform is embedded in audit workflows and regulatory reporting cycles. Contract renewal cycles run twelve to twenty-four months, and buyers often multi-source to preserve negotiating leverage.
Autonomous remediation and AI-driven platforms occupy the premium tier, with margins reaching 78 to 84% where vendors have achieved genuine differentiation through proprietary detection models. Volume contracts remain necessary for market share and reference customers, but the highest-value pools concentrate where enterprises pay for outcome guarantees rather than raw scanning throughput alone. Enterprises at this tier consolidate point tools into a single contract for measurable reduction in remediation time.

This tension between volume and premium positioning defines vendor strategy today. Enterprises increasingly bundle scanning, prioritization, and remediation into single contracts, pushing value capture toward platforms that can demonstrate measurable exposure reduction rather than feature count. Vendors that fail to demonstrate quantified outcome improvement risk being displaced at renewal even where detection technology remains competitive.

Basic vulnerability scanning sold on per-asset licensing with thin differentiation, competing primarily on price and scan coverage breadth across enterprise IT estates. Renewal cycles run twelve to twenty-four months, and procurement teams frequently multi-source to preserve negotiating leverage at each cycle.
Gross Margin

Compliance-attested platforms embedded in audit and regulatory reporting workflows, commanding higher retention and pricing power once procurement teams standardize on a single vendor. Expansion revenue accrues steadily as compliance obligations widen across additional business units and geographic subsidiaries over successive contract years.
Gross Margin

AI-powered autonomous remediation and continuous exposure management platforms addressing emerging regulatory disclosure requirements and evolving cyber insurance underwriting standards for enterprises. Pricing power here remains strongest among vendors demonstrating measurable exposure reduction outcomes rather than feature breadth alone.
Gross Margin
security-and-vulnerability-management-market-portfolio-architecture-1788503608293

High-value Sub-segments and Strategic Watch-out

AI-Powered Autonomous Threat Remediation Platforms

Highest growth and highest value pool as enterprises shift budget toward platforms that remediate rather than merely detect, commanding premium pricing and the strongest retention across the competitive set today. Vendors here increasingly price on outcome guarantees, and buyers report willingness to pay a premium for verified speed.

Cloud Security Posture Management Platforms

Strong growth and healthy margins as multi-cloud enterprise adoption accelerates, though competitive intensity is rising quickly as hyperscalers bundle comparable native capability into their own infrastructure offerings. Vendors that differentiate through proprietary multi-cloud correlation capability retain pricing power even as hyperscaler bundling pressure intensifies across the broader category.

Continuous Vulnerability Scanning Platforms

The volume core generating the bulk of installed base revenue, characterized by mature technology, thinner margins, and intense price competition among a large field of established vendors. Consolidation among smaller vendors is likely as larger platforms absorb scanning functionality into broader bundled security suites over the coming several years.

Compliance and Regulatory Reporting Platforms

A strategic watch-out segment where growth trails the broader market, but regulatory tightening around cyber disclosure could rapidly expand demand and reshape vendor priority within eighteen months. Vendors positioned early around emerging disclosure mandates could capture disproportionate share if regulatory timelines accelerate faster than currently anticipated by most market participants.

Recurring Contracts Anchor Vendor Economics

Security and vulnerability management runs almost entirely on annual subscription contracts rather than one-time deployments, giving vendors highly predictable revenue once a platform is embedded in an enterprise's security operations workflow. Net revenue retention above 115% is common among the leading five vendors, driven by seat expansion and add-on module attachment rather than price increases alone. This annuity quality supports valuation multiples well above one-time software licensing businesses.
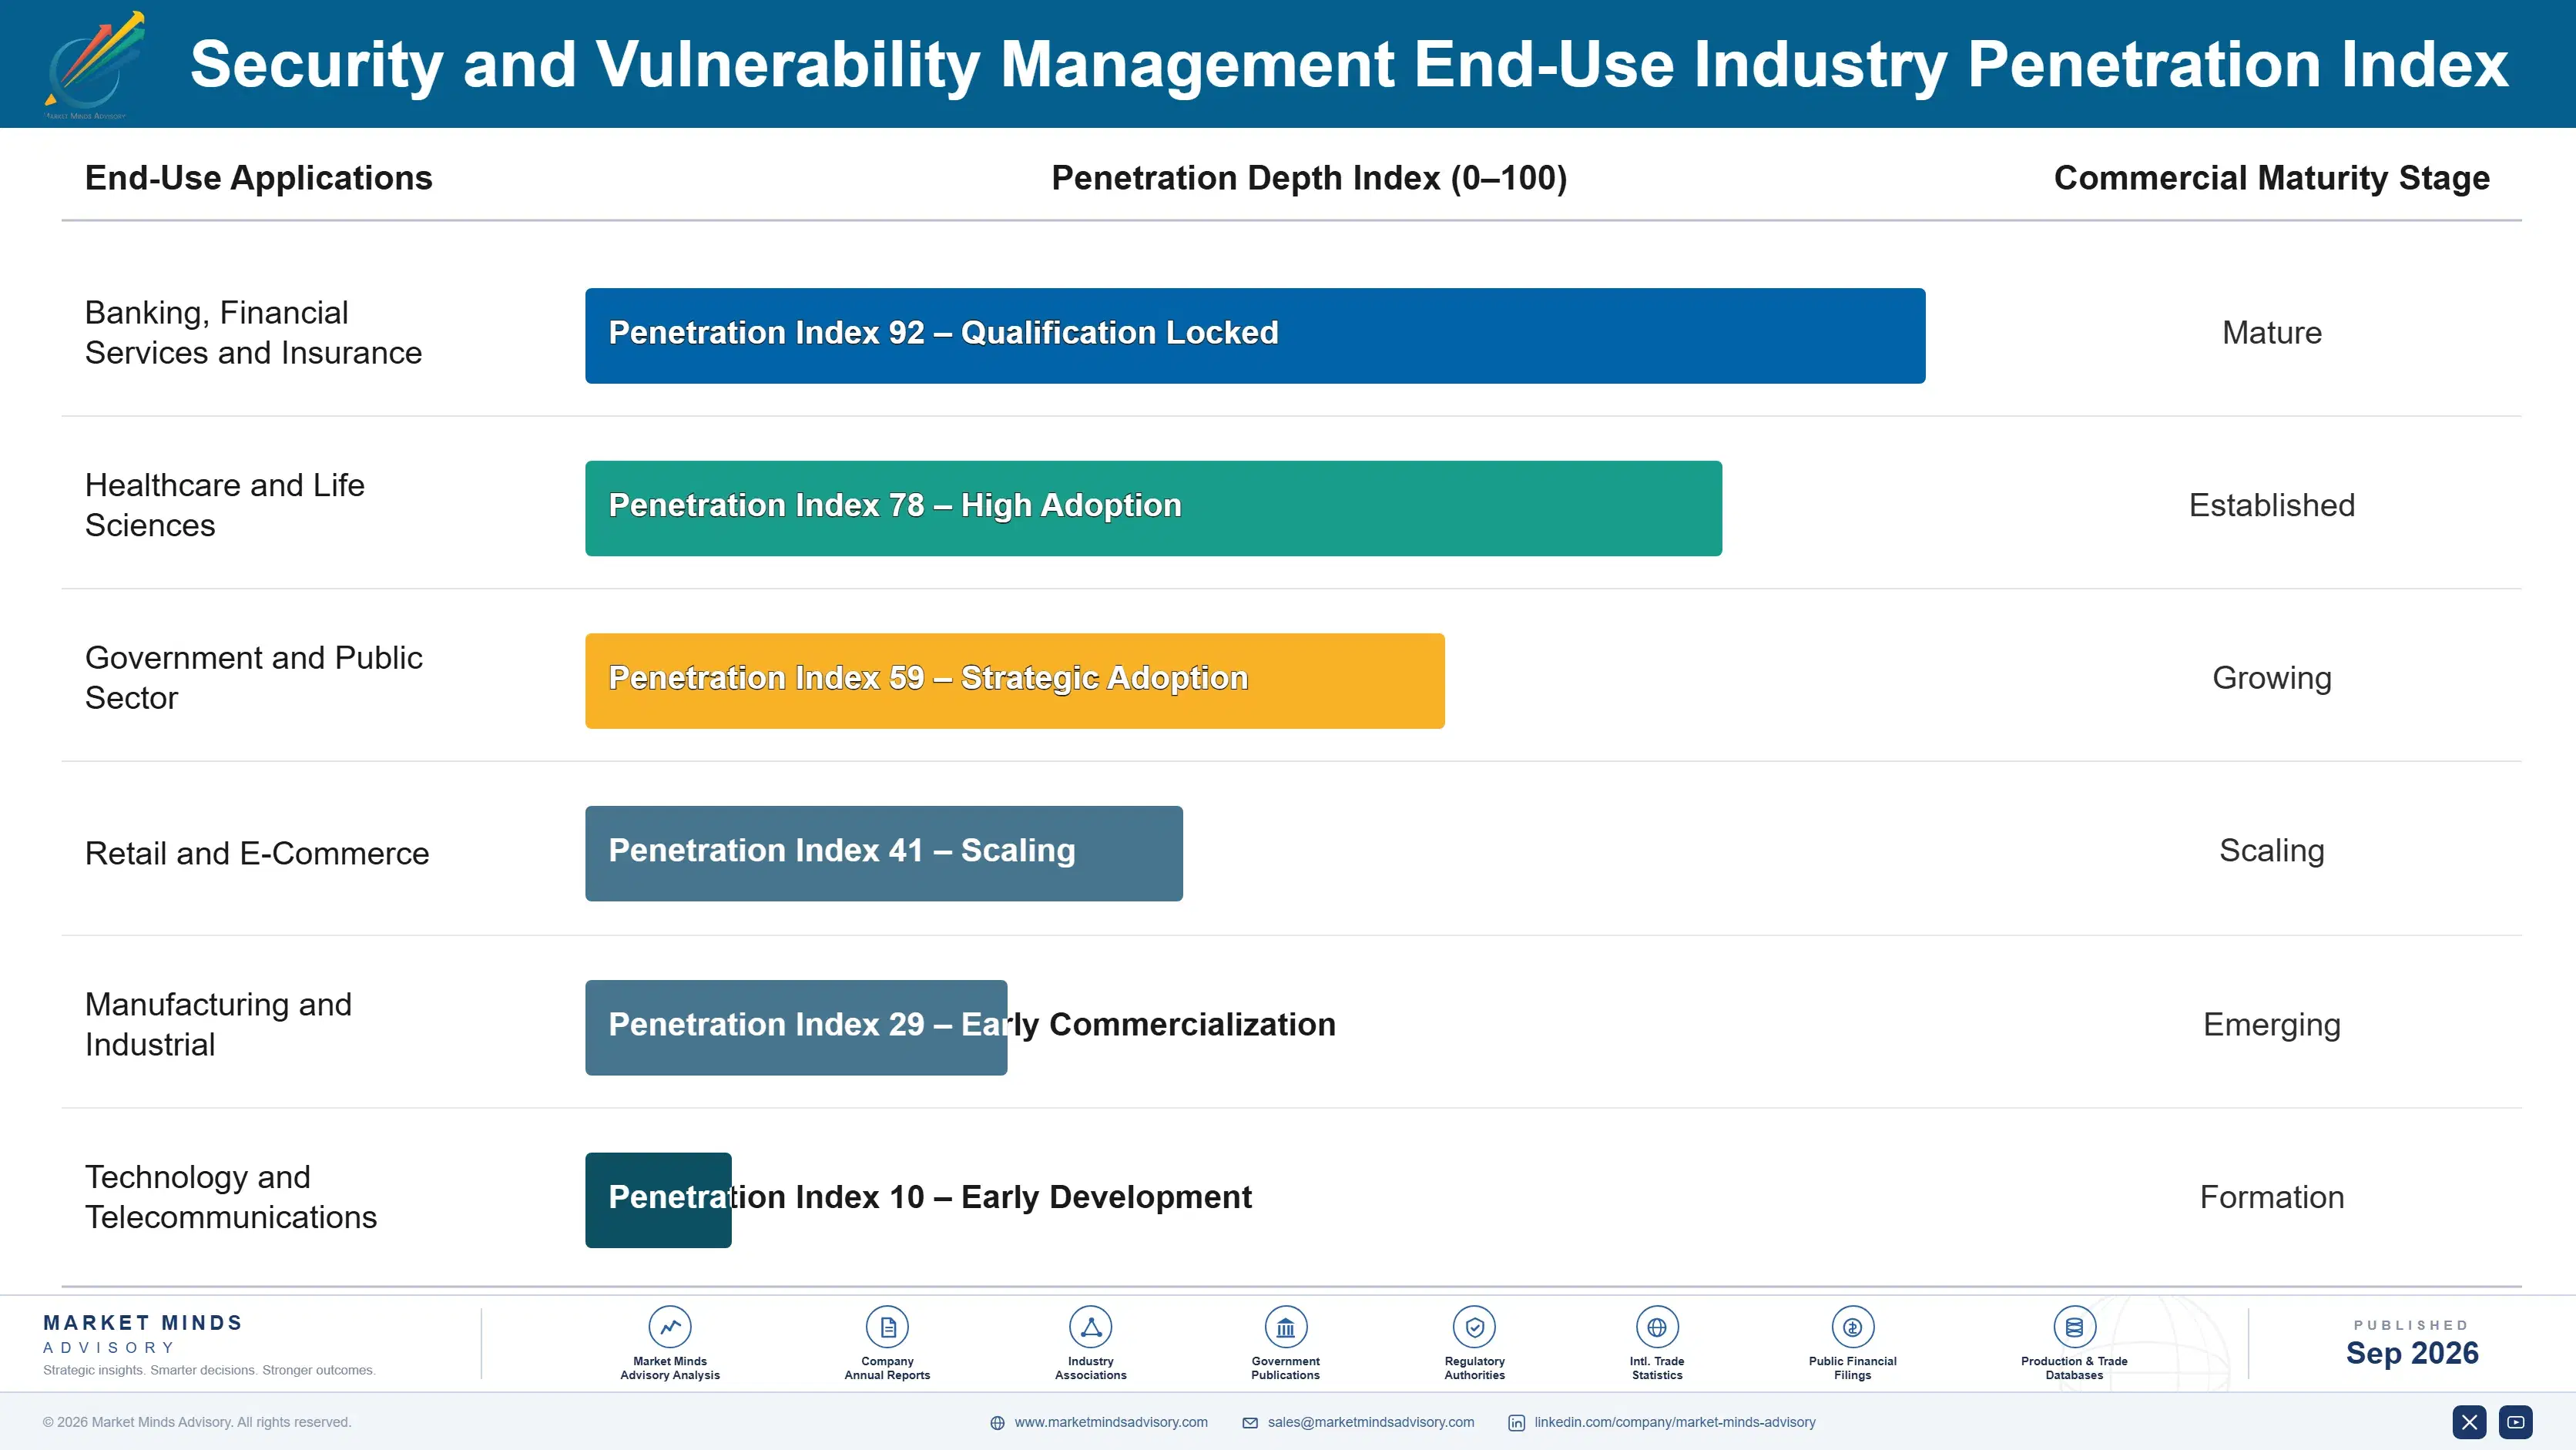
Adoption depth varies sharply by end-use vertical. Financial services and healthcare enterprises embed these platforms deeply into compliance and audit workflows, producing switching costs that keep churn below 5% annually. Retail and manufacturing buyers adopt more selectively, running point solutions for specific asset classes rather than full platform standardization. Healthcare buyers tie renewal decisions directly to audit outcomes, making displacement a board-level risk few security leaders accept.

Buyer profiles are shifting generationally as chief information security officers increasingly report directly to boards rather than IT leadership, elevating remediation speed and quantified risk reduction over feature checklists in procurement decisions. Younger security leaders favor consumption-based pricing and platform consolidation over the multi-vendor point-tool approach their predecessors built. This shift is reshaping vendor roadmaps toward outcome-based reporting built for board-level audiences.
security-and-vulnerability-management-market-end-use-penetration-index-1788503608778

Where MMA Sees the Advantage

These are among the four positions where our research anticipates prominent divergence between winners and laggards over the coming forecast period. Each is grounded in the demand model, the regulatory perimeter, and the announced capacity pipeline.
01 / PLATFORM CONSOLIDATION STRATEGY

Bundle scanning, prioritization, and remediation into one contract

Enterprises are actively reducing the number of point security tools they manage today, favoring vendors who can cover more of the workflow. Bundling continuous scanning, risk prioritization, and automated remediation into a single contract lets a vendor capture a disproportionate share of this consolidation-driven budget over the next several years. Standalone scanning vendors without a credible remediation roadmap risk being displaced entirely at renewal, particularly once a competitor demonstrates a faster, fully bundled alternative to a procurement team already weighing consolidation as its top priority for the coming budget cycle.
02 / AUTONOMOUS REMEDIATION INVESTMENT

Prioritize AI-driven remediation over incremental scanning improvements

The fastest growing segment by a wide margin is autonomous remediation, not incremental scanning accuracy, and research budget should follow that signal. Vendors optimizing detection precision alone are polishing a capability that is already maturing across the competitive field. Remediation automation instead captures the premium pricing tier where enterprises pay for verified outcomes, and this gap will widen further as buyer expectations shift toward autonomous response across every enterprise segment MMA tracks, not just the largest accounts that historically set purchasing patterns for the rest of the category.
03 / VERTICAL COMPLIANCE DEPTH

Deepen compliance workflow integration in regulated verticals

Financial services and healthcare buyers exhibit the lowest churn in the category because platforms are embedded directly into audit and regulatory reporting workflows across their organizations. Vendors should prioritize deeper vertical-specific compliance integration over horizontal feature breadth as a result. This approach builds switching costs that generic platforms cannot easily replicate, protecting recurring revenue against new entrant pressure over the coming several years even as pricing competition intensifies across the broader scanning category and smaller vendors chase share with steep introductory discounts.
04 / COMPUTE COST DISCIPLINE

Lock in reserved compute capacity ahead of AI workload scaling

Rising GPU and cloud compute costs are compressing margins for vendors running large-scale AI threat analysis without negotiated reserved capacity in place. Vendors that secure multi-year reserved compute agreements now will protect gross margin as autonomous remediation workloads continue scaling through the forecast period. Competitors without this discipline face a lasting cost disadvantage relative to hyperscaler-affiliated rivals with negotiated pricing already secured, a gap MMA expects to widen through 2028 as AI-driven workloads make up a growing share of total platform compute demand.

Engagement Snapshot From the Field

A live engagement with an industry participant carrying material or product regulatory and market exposure ahead of a defining policy shift, showing how our research translates into a defensible multi-year portfolio strategy.
MARKET MINDS ADVISORY · CLIENT ENGAGEMENT SUMMARY
Security and Vulnerability Management Producer Strategic Portfolio Review and Transition Roadmap 2026·Investment Scenario on Security and Vulnerability Management Exposure Evaluation 2025-26
CLIENT PROFILE
The client is a global financial services firm with operations across fifteen countries and a security operations team managing several thousand endpoints and cloud workloads. The firm had accumulated six separate vulnerability and scanning tools over a decade of decentralized regional procurement decisions, creating fragmented visibility into its true exposure surface across business units and legacy acquired subsidiaries.
STRATEGIC CHALLENGE
The firm's board demanded a single consolidated view of enterprise-wide vulnerability exposure ahead of an upcoming regulatory examination, but existing tools reported inconsistent risk scores and could not be reconciled into one prioritized remediation queue. Leadership needed an independent assessment of which platform architecture could actually deliver that consolidation. No internal team owned reconciling these conflicting scores.
MMA APPROACH
MMA conducted structured interviews with the firm's security leadership and benchmarked five leading platforms against the firm's specific compliance and multi-cloud requirements. The engagement combined primary survey data with direct vendor capability testing to produce a weighted scoring framework tailored to the firm's regulatory exposure profile. Findings were validated against the firm's own historical incident data before final recommendations were delivered to the board.
KEY FINDINGS
  1. Three of the six existing tools reported materially different severity scores for the same underlying vulnerabilities, undermining board confidence entirely. This inconsistency directly delayed remediation prioritization decisions.
  2. Consolidating onto a single autonomous remediation platform was projected to reduce mean time to remediation by approximately 40% (client-reported, unverified by MMA).
  3. Annual licensing cost across six fragmented tools exceeded the cost of one consolidated enterprise contract by roughly $2.1 million (client-reported, unverified by MMA).
  4. Regional procurement autonomy, not technology limitation, was the primary root cause of the firm's fragmented exposure visibility across business units. Consolidating procurement authority resolved most of the underlying inconsistency.
CLIENT PROFILE
The client is a global financial services firm with operations across fifteen countries and a security operations team managing several thousand endpoints and cloud workloads. The firm had accumulated six separate vulnerability and scanning tools over a decade of decentralized regional procurement decisions, creating fragmented visibility into its true exposure surface across business units and legacy acquired subsidiaries.
STRATEGIC CHALLENGE
The firm's board demanded a single consolidated view of enterprise-wide vulnerability exposure ahead of an upcoming regulatory examination, but existing tools reported inconsistent risk scores and could not be reconciled into one prioritized remediation queue. Leadership needed an independent assessment of which platform architecture could actually deliver that consolidation. No internal team owned reconciling these conflicting scores.
MMA APPROACH
MMA conducted structured interviews with the firm's security leadership and benchmarked five leading platforms against the firm's specific compliance and multi-cloud requirements. The engagement combined primary survey data with direct vendor capability testing to produce a weighted scoring framework tailored to the firm's regulatory exposure profile. Findings were validated against the firm's own historical incident data before final recommendations were delivered to the board.
KEY FINDINGS
  1. Three of the six existing tools reported materially different severity scores for the same underlying vulnerabilities, undermining board confidence entirely. This inconsistency directly delayed remediation prioritization decisions.
  2. Consolidating onto a single autonomous remediation platform was projected to reduce mean time to remediation by approximately 40% (client-reported, unverified by MMA).
  3. Annual licensing cost across six fragmented tools exceeded the cost of one consolidated enterprise contract by roughly $2.1 million (client-reported, unverified by MMA).
  4. Regional procurement autonomy, not technology limitation, was the primary root cause of the firm's fragmented exposure visibility across business units. Consolidating procurement authority resolved most of the underlying inconsistency.
RECOMMENDED STRATEGY
Phase 1: Phase one: consolidate reporting onto a single platform for the three highest-risk business units within two quarters. These units carried the highest concentration of unresolved critical vulnerabilities. Phase 2: Phase two: migrate remaining regional tools onto the consolidated platform over twelve months, retiring legacy contracts as they expire. This phased approach minimized workflow disruption for regional teams. Phase 3: Phase three: standardize board-level exposure reporting quarterly, tying remediation metrics directly to audit committee review cycles. This cadence gave the audit committee continuous visibility into progress.
OUTCOME
The firm selected a single autonomous remediation platform and completed migration of its three highest-risk business units within the first two quarters. Board-level exposure reporting became standardized ahead of the regulatory examination, and the firm reported meaningfully improved audit committee confidence in its consolidated risk posture (client-reported, unverified by MMA).

Frequently Asked Questions

Foundational context covering the market sizes, CAGR, scope, country, region and competition that inform every finding below. This section is provided to cover basics and most often pre-purchase conversations, answered from the MMA Primary Research Dataset.

What is the current size of the Security and Vulnerability Management Market?

The market was valued at approximately $15.8 billion in 2025. Growth is being driven by rising ransomware activity and enterprise adoption of AI-powered remediation platforms.

How large will the Security and Vulnerability Management Market be by 2036?

MMA projects the market will reach approximately $47.4 billion by 2036. This reflects sustained enterprise investment in autonomous remediation and continuous exposure management platforms across every major industry vertical.

What is the CAGR for the Security and Vulnerability Management Market 2026 to 2036?

The market is projected to grow at a compound annual growth rate of 10.5% between 2026 and 2036. This rate reflects both scanning platform maturity and remediation automation upside.

Which segment is growing fastest?

AI-Powered Autonomous Threat Remediation Platforms is the fastest growing segment, expanding at 17.0% annually, roughly 1.62x the overall market rate. Enterprise demand for automated response is driving this outsized growth.

Who are the major companies in the Security and Vulnerability Management Market?

Leading companies include Tenable, Qualys, Rapid7, CrowdStrike, and Palo Alto Networks. These five vendors hold the strongest installed base across enterprise scanning and remediation deployments.

Which country is growing fastest?

India is the fastest growing country market, expanding at approximately 14.5% annually. Rapid enterprise cloud adoption and rising cyber regulation are driving this acceleration across the country's largest metropolitan technology hubs.

Report Segmentation Architecture

The full report scope spans multiple orthogonal segmentation dimensions, with cross-tabulated demand data provided for each dimension pair. Coverage extends further to regional breakdowns, trend trajectories, and the competitive detail needed to support segment-level decision-making.

By Primary Market Dimension

  • AI-Powered Autonomous Threat Remediation Platforms
  • Continuous Vulnerability Scanning Platforms
  • Patch Management and Orchestration Systems
  • Cloud Security Posture Management Platforms
  • Risk-Based Vulnerability Prioritization Tools
  • Compliance and Regulatory Reporting Platforms

By End-Use Industry

  • Banking, Financial Services and Insurance
  • Healthcare and Life Sciences
  • Government and Public Sector
  • Retail and E-Commerce
  • Manufacturing and Industrial
  • Technology and Telecommunications

By Commercial Dimension

  • Large Enterprise
  • Small and Medium Business
  • Managed Security Service Providers
  • Direct Sales
  • Channel Partner and Reseller

By Region

  • North America
  • Western Europe
  • East Asia
  • South Asia and Pacific
  • Latin America
  • Middle East and Africa
  • Eastern Europe

Scope, Methodology, and Coverage

Every figure in this report is reproducible from documented input assumptions. The scope below maps the historical period, the forecast horizon, the segmentation dimensions, and the countries covered, alongside the underlying primary and qualitative methodology.
Historical Period
2020 to 2025
Forecast Period
2026 to 2036
Base Year
2025 (USD billions; MMA Primary Research Dataset, September 2026)
Market Definition
This report covers security and vulnerability management platforms that scan, detect, prioritize, and remediate security vulnerabilities across enterprise IT infrastructure, applications, and cloud environments. It excludes standalone antivirus and endpoint protection software not integrated with vulnerability scanning capability and general network monitoring tools without dedicated vulnerability assessment functionality.
Quantitative Units
USD Billion, CAGR (%), 2020-2036
Segmentation Dimensions
By Primary Market Dimension, By End-Use Industry, By Commercial Dimension, By Region
Regions Covered
North America, Western Europe, East Asia, South Asia and Pacific, Latin America, Middle East and Africa, Eastern Europe
Countries Covered
United States, Canada, United Kingdom, Germany, France, China, Japan, India, South Korea, Brazil, Mexico, Saudi Arabia, UAE, South Africa, Poland
Key Companies Profiled
Tenable, Qualys, Rapid7, CrowdStrike, Palo Alto Networks, Microsoft Defender, IBM Security, Fortinet, Check Point Software, Trend Micro, Cisco Security, SentinelOne, Wiz, Orca Security, Lacework, Snyk, Veracode, Checkmarx, Aqua Security, Armis
Quantitative Methodology
Primary survey, n=3,800 respondents, Q4 2025, six countries; demand-side model with trade association cross-validation
Qualitative Methodology
47 expert interviews, Q4 2025; applied to validate demand model assumptions, identify emerging dynamics, and assess competitive positioning
Report Format
PDF and XLSX data workbook (Word format preview document)
Publisher
Market Minds Advisory
Report Code
MMA-2026-TEC-705
Published
September 2026
Contact
sales@marketmindsadvisory.com | www.marketmindsadvisory.com

Purchase the full Security and Vulnerability Management Market Report (2026 to 2036).

This report provides a comprehensive assessment of the global Security and Vulnerability Management Market, covering historical performance from 2020 to 2025 and a detailed forecast through 2036. It examines segmentation across primary market dimensions, end-use industries, and commercial models, alongside regional demand dynamics across all seven world regions. The competitive landscape section profiles twenty companies and benchmarks the five leading vendors on a revenue basis. Analysis includes input cost exposure, portfolio margin economics, and strategic recommendations for market participants. The report also includes an anonymized client case study demonstrating practical application of this analysis in a real enterprise consolidation engagement.
Ten-year market sizing and forecast model
Six-segment MECE market segmentation framework analysis
All seven world regional markets profiled fully
Twenty-company competitive benchmarking dataset included here
Input cost and margin exposure analysis
Anonymized client case study with strategy

Built For The People Who Decide

From boardroom strategy to bench-side execution, this report is read cover-to-cover by leaders shaping the next decade of their industry, turning demand scenarios, market dynamics and valuation benchmarks into decisions.
CXOs/ Presidents/ VPs/ Managers
M&A and Corporate Development
Strategy Teams and R&D Heads
Procurement and Product Directors
Regulatory and Compliance Leaders
Investor Relations and Equity Analysts