Market Minds Advisory
Second-hand Homeware Market

Second-hand Homeware Market: Second-hand Homeware Market. Resale Platform Growth and Sustainability Preference Reshape Home Furnishing Purchase Behavior

Online resale platforms are turning secondhand furniture and homeware into a mainstream first purchase choice rather than a budget fallback, reshaping category economics as sustainability preference and marketplace trust both continue rising steadily nationwide

Lead Analyst

Published

September 2026

Make Smarter Decisions with Customized Research Insights

Request a free sample report and evaluate market opportunities, growth trends, and competitive dynamics relevant to your business needs.

2025 MARKET VALUE$34.5BMarket Size 2025
2036 FORECAST VALUE$84.6BBase Case , 2026 to 2036
CAGR 2026 TO 20368.5 %Bull 9.8% / Bear 7.2%
INCREMENTAL OPPORTUNITY$47.2BNet 10- year value creation
EXPANSION MULTIPLE2.26x2036 value over 2026 base
Strategic Levers
M&A Pipeline
Regional Outlook
Country Rankings
Competitive Intelligence
Segmental Deep-dive
Call-Us : 91 93563 13602

Executive Snapshot and Market Trajectory.

Secondhand homeware has shifted from thrift-store necessity to a deliberate, sustainability-driven purchase choice, with resale platforms now rivaling traditional retail for furniture and decor discovery among younger, budget-conscious urban households nationwide. Verified authenticity badges and condition photography now shape buyer decisions as much as price does for many categories.
Furniture and small appliances drive the bulk of resale volume, with North America and East Asia together accounting for the largest share of platform transactions as marketplace trust and verified condition grading both continue improving steadily. Delivery logistics for bulky furniture remain the single largest friction point limiting faster category expansion across most regional markets. Retailers increasingly view resale not as cannibalization but as a customer acquisition channel feeding future new-purchase demand down the line.
Competition is fragmenting across dedicated resale marketplaces, consignment furniture chains, and traditional retailers launching trade-in programs, while extended producer responsibility rules in several markets increasingly favor certified refurbishment and circular business models. Authentication and condition-grading technology is becoming the primary basis on which platforms differentiate themselves from lower-trust peer-to-peer alternatives. Smaller regional consignment chains face growing pressure to digitize inventory listings or risk losing customers to larger, better-funded national platforms entirely.
Market Definition
The Second-hand Homeware Market covers resold and pre-owned furniture, kitchenware, decor, lighting, and small appliances transacted through online marketplaces, consignment stores, and physical resale outlets. It excludes new-manufactured goods and donation-only charitable exchanges with no commercial transaction.
Base Year Value
$34.5B in 2025 (MMA Primary Research Dataset, September 2026)
Forecast Period
2026 to 2036, eleven discrete annual values
CAGR
8.5% base case. Bull 9.8%. Bear 7.2%.
Fastest Growth Segment
Small Appliances: 14.0% CAGR
Fastest Growth Country
India: 11.5% CAGR
Fastest Growth Region
South Asia and Pacific: 10.5% CAGR
Largest Region
North America: 28% of 2025 global value
Market Leaders
Leading players: ThredUp, Chairish, AptDeco, 1stDibs, Facebook Marketplace. Source: MMA Primary Research Dataset, July 2026.
Primary Survey
n=3,800 procurement and R&D decision-makers, Q4 2025, six countries
Methodology
Demand-side build-up, cross-validated against public data, 47 expert interviews

Second-hand Homeware Market Forecast Scenarios

second-hand-homeware-market-size-forecast-scenario-1790022026277
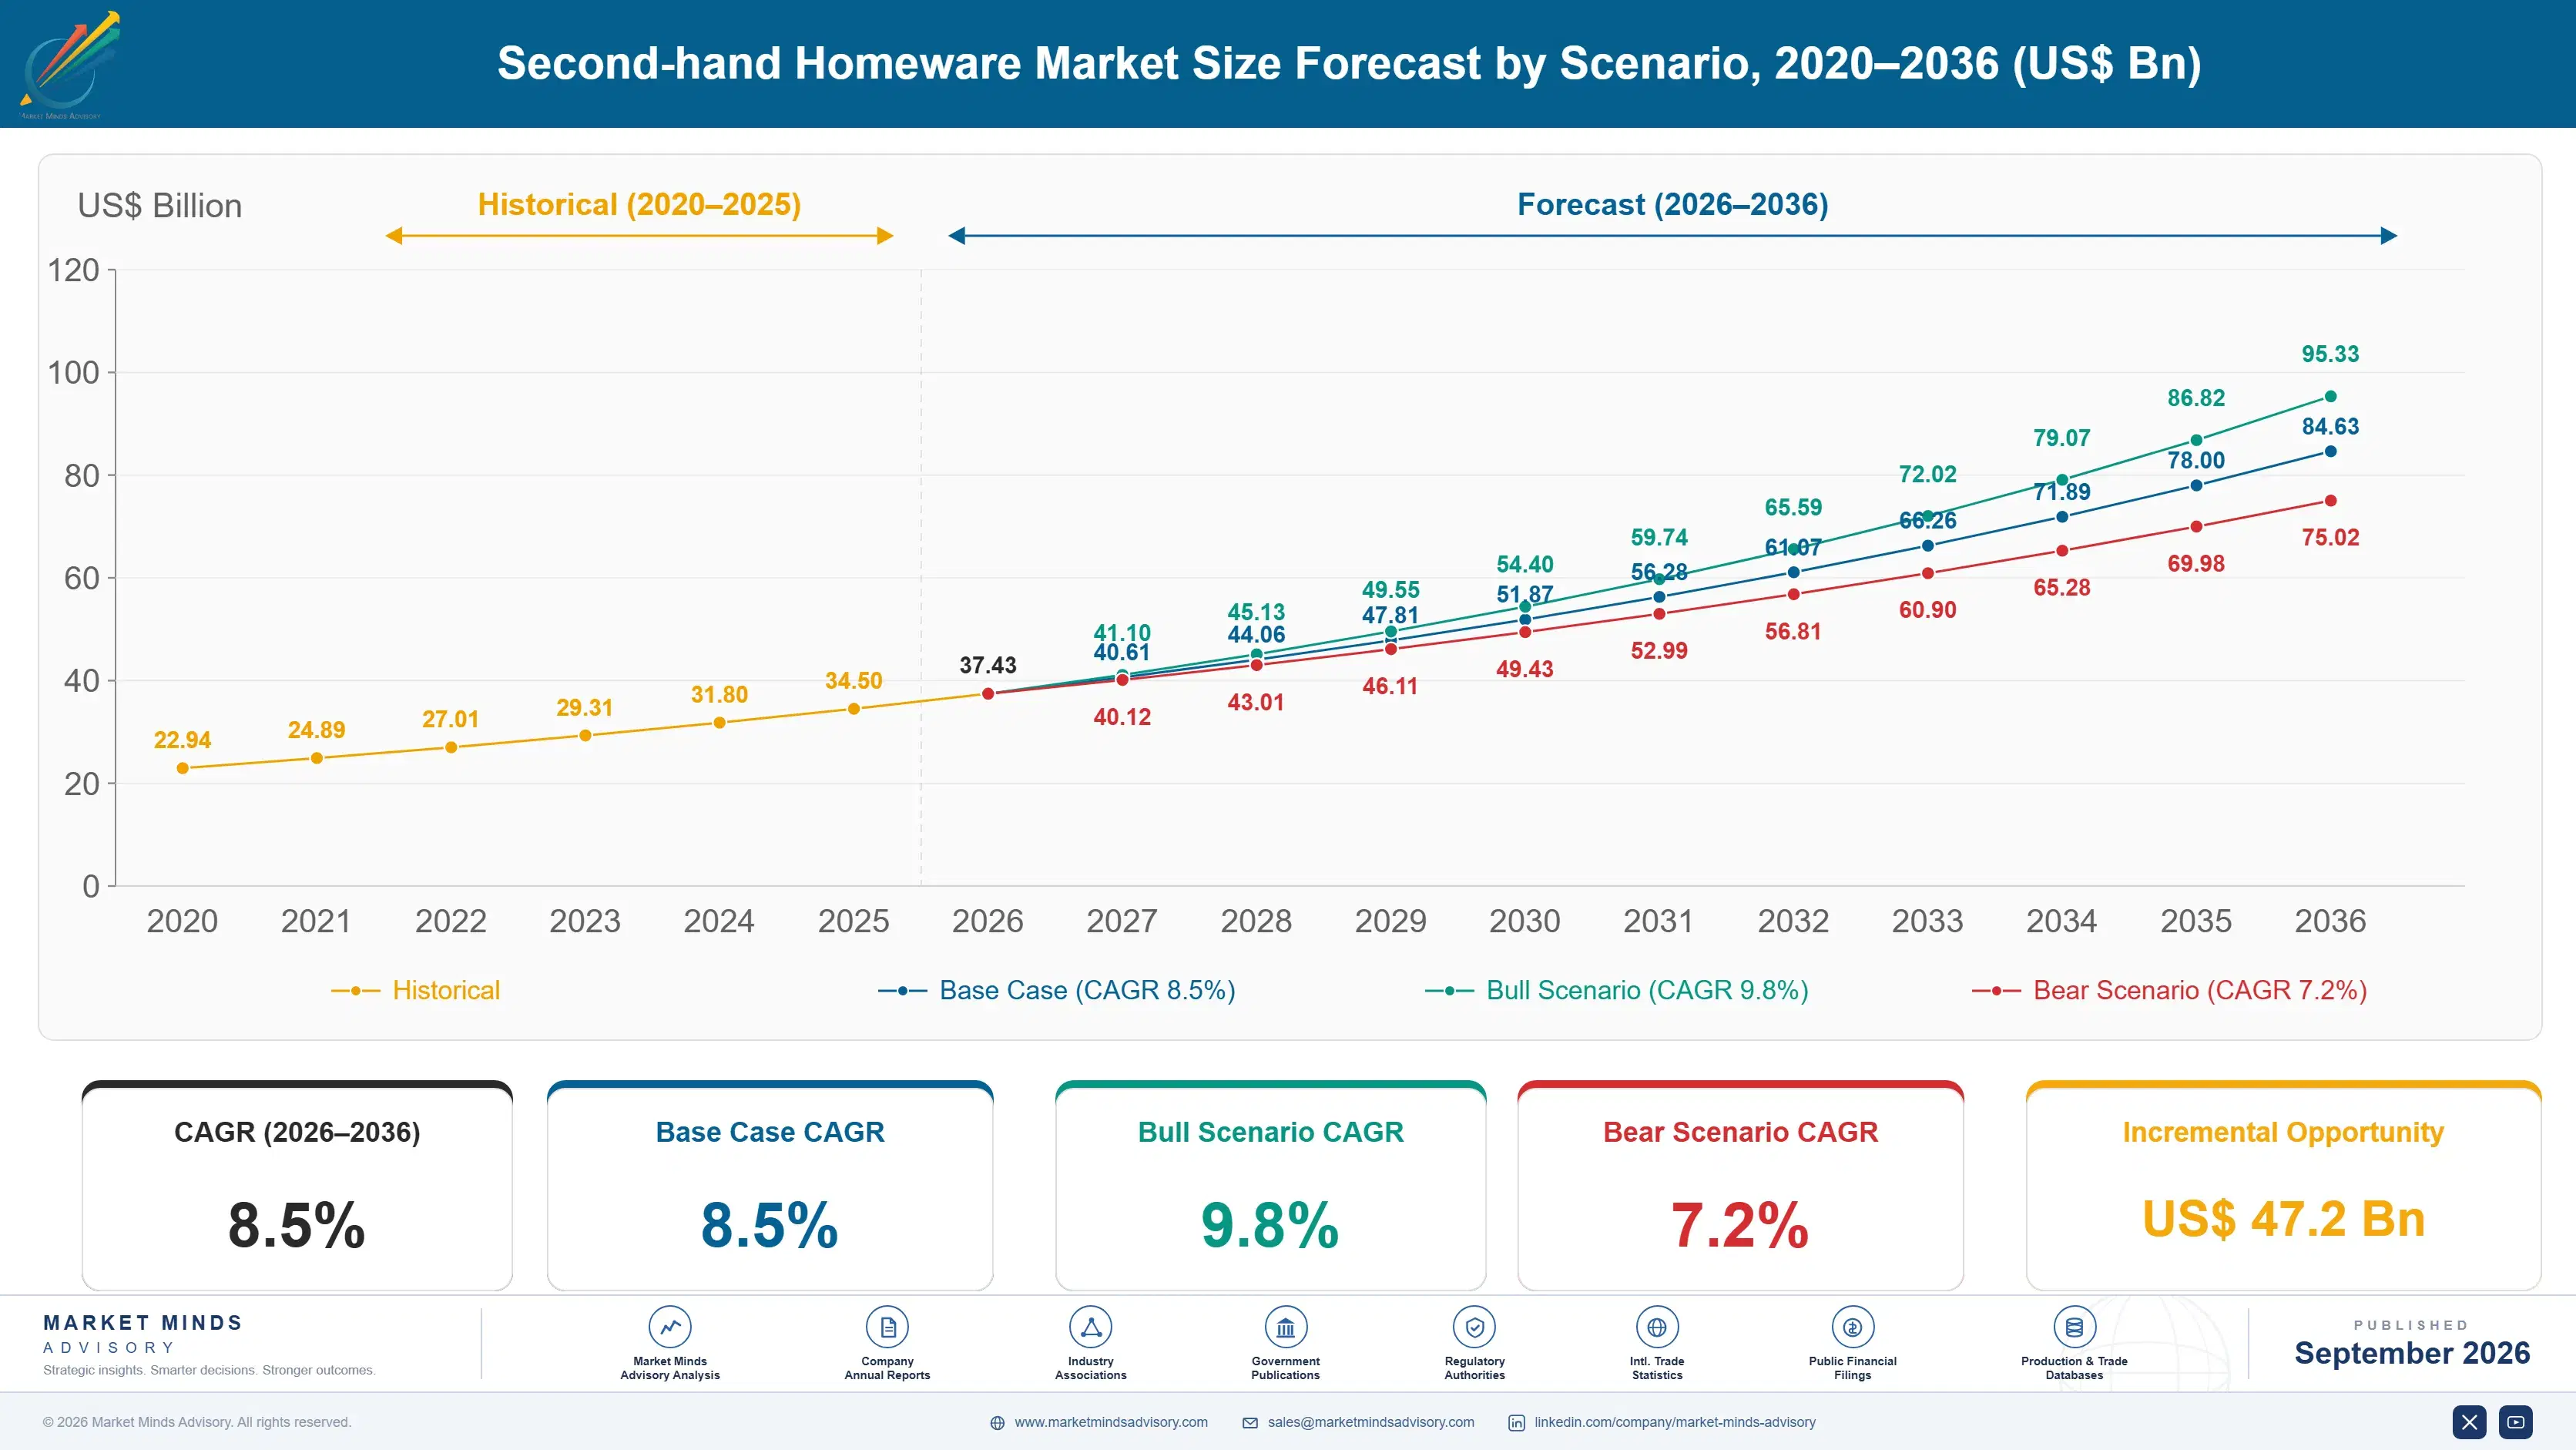
Resale volume grew steadily between 2020 and 2025 as marketplace apps matured and verified condition grading reduced buyer hesitation around pre-owned furniture and appliances significantly. Historical growth of 7.5 percent annually reflected gradual mainstream acceptance rather than a single breakthrough event across the period. Mobile-first listing tools and integrated payment escrow services removed much of the friction that once discouraged casual sellers from participating.
The base case assumes continued platform trust-building, expanding trade-in partnerships between retailers and resale operators, and rising landfill diversion regulation that together sustain double-digit category growth across most major regions through the decade. Improved logistics for bulky furniture delivery, broader condition-grading standardization, and growing younger-generation preference for pre-owned goods over new purchases all reinforce this trajectory. Retailers embracing this shift early lock in relationships competitors will find difficult to dislodge.
A bull scenario assumes rapid extended producer responsibility rollout across additional states accelerates certified refurbishment volume well beyond current expectations, pushing growth toward the upper end of the forecast range. A bear scenario assumes persistent counterfeit listings and misrepresented condition erode buyer trust faster than platforms can meaningfully address. through moderation alone. Both scenarios hinge substantially on how fast regulation and platform trust-building move.

Trust Infrastructure Now Defines Category Leadership

Trust infrastructure, not inventory scale, increasingly separates category leaders from smaller peers. Platforms investing in verified condition grading, authentication, and buyer protection guarantees are capturing disproportionate volume as consumers grow more comfortable purchasing bulky, higher-value items sight unseen. Third-party authentication services are emerging as a distinct revenue line for platforms rather than a pure cost center, further reinforcing this shift toward trust as the primary competitive battleground.
MARKET CONCENTRATIONCR5 22%Fragmented competitive field spanning both niche and general platforms
AVERAGE SELLING PRICE$85Blended average across furniture and smaller decor item categories
TOP SOURCING COUNTRYUS 34% shareLargest share of listing volume among all countries tracked
PLATFORM TAKE RATE18%Commission percentage charged on completed marketplace transaction value
RETURN AND DISPUTE RATE6%Share of buyer disputes over item condition or authenticity
AVERAGE LISTING TURNAROUND14 daysTypical time span from initial listing to completed sale
Furniture dominates gross merchandise value despite lower unit counts than smaller decor items, reflecting higher average price points and the logistics complexity that keeps competition thinner than in easier-to-ship categories. Platforms that build dedicated furniture logistics networks, including white-glove delivery and assembly partnerships, are converting this complexity into a durable competitive moat against smaller general-category rivals.
Retailer trade-in programs are emerging as a meaningful new sourcing channel, feeding certified refurbished inventory into resale platforms while simultaneously driving new-purchase traffic back toward the retailers themselves. This dual-purpose model is proving attractive enough that several major furniture retailers have launched or acquired dedicated resale operations over the past two years. Category boundaries between new and resale retail are consequently blurring faster than most traditional retailers anticipated even two years ago.
"The winners here aren't the platforms with the most listings. They're the ones buyers trust enough to purchase a sofa without seeing it in person first."
Practice Lead, Circular Commerce and Resale Markets · MMA Resold and Pre-Owned Furniture Practice · September 2026

Market Trends

Verified Condition Grading Becomes Standard Platform Feature

Leading resale platforms now employ standardized condition grading scales, often backed by third-party inspection partnerships, to reduce buyer uncertainty around item quality before purchase. This shift addresses the single largest historical barrier to secondhand furniture adoption: the inability to assess wear, structural soundness, and finish quality from photographs alone. Platforms offering verified grading report meaningfully higher conversion rates than those relying solely on seller self-description. Buyer protection guarantees tied to grading accuracy are becoming a standard expectation rather than a differentiator, pushing smaller platforms to adopt comparable systems or risk losing volume to better-resourced competitors.
Market Impact: Expands buyer base 25 percent
Retailer Trade-In Programs Expand Sourcing Pipelines

Major furniture and homeware retailers increasingly operate branded trade-in programs, accepting used items as partial payment toward new purchases and feeding certified inventory directly into resale channels. This arrangement gives retailers a new revenue stream while addressing consumer demand for responsible disposal options at the point of upgrade. Programs launched over the past two years have already contributed a meaningful share of certified refurbished inventory entering resale platforms. Retailers view this model as complementary rather than cannibalistic, since trade-in customers frequently return for future new purchases within a relatively short window afterward.
Market Impact: Adds 18 percent supply volume

Market Opportunities and Growth Drivers

Sustainability Preference Drives First-Purchase Resale Choice

Younger buyers increasingly treat resale as a default first option rather than a fallback after failing to find new items at acceptable prices. Landfill diversion messaging and carbon footprint calculators embedded directly into platform checkout flows are reinforcing this behavioral shift among environmentally conscious consumers across most major urban markets today. Furniture disposal regulations in several cities now actively discourage curbside discard, pushing more supply toward resale channels rather than landfills. Retailers report that resale-first buyers frequently convert into repeat customers across multiple purchase categories once trust in the platform's grading system is established.
Market Impact: Raises delivery cost by 30 percent

Extended Producer Responsibility Rules Favor Certified Refurbishment

Several jurisdictions have introduced or expanded extended producer responsibility requirements covering furniture and appliance disposal, creating regulatory pressure that favors certified refurbishment and resale over landfill disposal. Manufacturers facing disposal fees increasingly partner with resale platforms to offset compliance costs while capturing residual value from returned or trade-in inventory. This regulatory tailwind is expected to intensify as additional states and countries adopt similar frameworks over the coming several years. Platforms with established refurbishment partnerships are best positioned to capture this expanding compliance-driven supply pipeline ahead of less-prepared competitors. Compliance costs are expected to rise further.
Market Impact: Drives 6 percent dispute rate industrywide

Market Restraints and Challenges

Bulky Item Delivery Logistics Constrain Category Growth

Furniture and large appliance delivery remains costly and operationally complex compared with shipping smaller decor items, limiting how quickly platforms can scale volume across less densely populated regions. The root cause is a shortage of specialized white-glove delivery and assembly providers willing to partner with resale platforms at volumes that justify dedicated route investment. This constraint disproportionately affects rural and suburban markets where delivery density is lower and per-item logistics cost runs correspondingly higher than urban centers. Several platforms are piloting regional delivery hub networks and partnerships with existing furniture retailers' logistics fleets to gradually address this bottleneck over time.
Market Impact: Lifts conversion rates 20 percent

Counterfeit and Misrepresented Condition Listings Erode Trust

A persistent minority of sellers misrepresent item condition or, in premium decor and designer furniture categories, list counterfeit goods as authentic, creating recurring buyer disputes that damage platform reputation. The root cause is inconsistent seller verification combined with the practical difficulty of authenticating items remotely without physical inspection. Buyer disputes over misrepresented condition remain a leading cause of platform abandonment among first-time users testing resale for the first time. Platforms are responding with expanded authentication partnerships, stricter seller verification requirements, and money-back guarantees, though these measures add cost and friction that smaller operators struggle to absorb profitably.
Market Impact: Supplies 15 percent of inventory
3 additional market trends, 4 additional growth drivers, and 2 additional restraints and challenges are covered in the full report. Contact sales@marketmindsadvisory.com to access the complete intelligence.

Segment CAGR and Growth Architecture

Secondhand homeware spans six product categories with distinct resale economics, ranging from high-turnover kitchenware to logistics-heavy furniture. Small appliances and home decor and textiles are expanding fastest as platforms solve authentication and functional-testing challenges specific to these categories. Furniture remains the largest revenue contributor despite lower unit turnover, while kitchenware and storage categories provide steady, lower-margin transaction volume.
second-hand-homeware-market-market-share-analysis-1790022026841

Small Appliances

Small appliances, spanning coffee makers, stand mixers, and vacuum cleaners, is expanding fastest among all segments as platforms develop functional-testing protocols that verify working condition before listing. Buyer hesitation around used electronics has historically centered on undisclosed mechanical faults, and third-party testing partnerships are directly addressing that concern. Manufacturers' extended warranty transferability programs are also making certified pre-owned appliances more attractive relative to new purchases at a fraction of the price. Resale volume in this category is growing fastest in urban markets where compact living spaces favor smaller appliance footprints over bulkier new alternatives sold at full retail price. Certified refurbishment partners increasingly offer bundled warranty coverage that further narrows the perceived risk gap against buying new appliances outright.
CAGR 14.0%

Home Decor and Textiles

Home decor and textiles, including rugs, artwork, and window treatments, benefits from lower shipping complexity than furniture while still commanding meaningful average selling prices among design-conscious buyers. Vintage and designer pieces in particular command premium resale pricing, sometimes exceeding original retail value for sought-after items from discontinued collections. Social media discovery, particularly through short-form video content showcasing before-and-after room transformations, is driving substantial new buyer acquisition into this category. Platforms specializing in curated vintage decor are capturing disproportionate share relative to general marketplaces lacking dedicated design curation expertise and community features. Average holding periods before resale are shortening as sellers respond to viral design trends, further accelerating category turnover relative to more utilitarian homeware segments.
CAGR 11.5%
Full segment breakdown across 6 segments available in the complete report.

Regional Architecture and Country Demand Map

North America leads global resale volume through mature marketplace infrastructure and strong sustainability preference, while South Asia and Pacific accelerates fastest as urban middle-class households adopt platform-based furnishing for the first time. Western Europe and East Asia together add two-fifths more. Established retail chains are also entering directly.

North America

The United States anchors North American demand through the earliest and most mature resale marketplace infrastructure globally, with platforms like Facebook Marketplace, Chairish, and AptDeco each serving distinct segments of the furniture and decor resale market. Suburban households with larger living spaces generate disproportionate furniture listing volume compared with denser urban markets. Canada contributes a smaller but steadily growing share, particularly within sustainability-certified consignment chains expanding across major metropolitan areas. Mexico's manufacturing corridor increasingly supplies refurbishment parts to platforms serving the broader North American continent efficiently. Established buyer protection guarantees and insured shipping options further differentiate leading American platforms from newer international entrants still building comparable trust infrastructure. Consumer trust here remains highest globally.
Share: 28% | CAGR: 8.0% (2026 to 2036)

Western Europe

Germany and the United Kingdom lead Western European demand, supported by long-established consignment and vintage furniture retail traditions that predate online marketplace platforms by decades. France contributes strong demand within designer and vintage decor categories specifically. Growth trails the global average as circular economy behaviors are already comparatively mature relative to faster-adopting emerging regions still building initial platform trust. Scandinavian countries have moved fastest toward integrating resale directly into new-furniture retailer storefronts, setting a template other markets are gradually following. Regulatory pressure around furniture disposal is accelerating retailer participation in take-back and resale schemes across multiple national markets simultaneously. Vintage furniture fairs remain culturally significant sourcing events across several major cities, feeding inventory into online channels increasingly.
Share: 22% | CAGR: 6.8% (2026 to 2036)
Regional intelligence for 5 additional markets available in the complete report: East Asia, South Asia and Pacific, Latin America, Middle East and Africa, Eastern Europe. Contact sales@marketmindsadvisory.com.
second-hand-homeware-market-country-cagr-analysis-1790022027357

Capturing Margin in the Resale Transition

Platform economics reward operators who move beyond simple listing marketplaces into trust infrastructure, logistics solutions, and retailer partnerships where authentication depth and delivery reliability each command durable commission premiums over unmanaged peer-to-peer alternatives. The four levers below concentrate margin gains among operators willing to invest in trust and logistics infrastructure ahead of pure listing-volume competitors.

Verified Condition Grading as Premium Service Tier

Platforms offering paid verified condition grading and professional photography services capture higher commission rates, often 22 percent above standard listing fees, from sellers seeking faster sale conversion. This service tier also reduces post-sale disputes meaningfully, lowering the operational cost of buyer protection claims that erode margin on ungraded listings. Sellers increasingly view grading fees as a worthwhile investment given the measurable lift in sale price and speed. Platforms that scale this service efficiently are building a durable fee-based revenue stream distinct from pure transaction commissions. This dynamic strengthens further as buyers increasingly filter search results specifically toward graded listings.
Market Impact: Captures 22 percent higher commission per listing overall

White-Glove Furniture Delivery Partnership Network Building

Platforms that build or partner with dedicated white-glove delivery and assembly networks capture the furniture category's highest average selling prices while charging delivery fees roughly 30 percent above standard shipping costs. This logistics capability also opens previously inaccessible rural and suburban markets where delivery density has historically been too low to justify standard courier partnerships. Retailers increasingly view this delivery capability as the deciding factor when selecting a resale partner for trade-in programs. Platforms without this infrastructure face growing disadvantage as buyer expectations around delivery reliability continue rising steadily. Buyer expectations continue rising as delivery reliability becomes table stakes.
Market Impact: Adds 30 percent margin on furniture delivery category-wide

Retailer Trade-In Program Exclusive Partnership Access

Platforms securing exclusive trade-in partnerships with major furniture and appliance retailers gain preferential access to certified refurbished inventory at below-market acquisition cost, improving overall unit economics by roughly 15 percent. These partnerships also drive meaningful new user acquisition, since retailers actively direct customers toward the resale platform at the point of trade-in. Exclusivity terms increasingly extend three to five years, giving early movers a durable inventory sourcing advantage over competitors. Retailers benefit through reduced disposal costs and continued brand engagement even after the original purchase relationship formally ends. This dynamic compounds further as retailer partnerships mature over successive renewal cycles.
Market Impact: Cuts inventory acquisition cost by 15 percent per unit

Authentication Services for Designer and Vintage Goods

Platforms offering paid third-party authentication for designer furniture and vintage decor items capture premium commission rates on high-value transactions where counterfeit risk otherwise suppresses buyer willingness to pay. Authentication fees typically run 3 to 5 percent of item value but enable substantially higher close rates on items exceeding standard price thresholds. This service also attracts a distinct, higher-spending buyer segment less price-sensitive than typical resale shoppers seeking everyday furnishing. Platforms building recognized authentication brands are increasingly able to charge premium commissions across their entire designer and vintage category inventory. Recognized authentication brands become a durable competitive moat.
Market Impact: Lifts designer category commission by 12 percent category-wide

Who Controls the Margin Pool

Secondhand homeware competition remains highly fragmented, with the top five platforms holding roughly 22 percent of transaction volume evaluated on a consistent gross merchandise value basis across categories. ThredUp and Facebook Marketplace lead through scale and reach, while the gap to specialized challengers has widened as authentication and logistics investment increasingly separate serious platforms from casual listing sites. Mid-tier specialists increasingly compete on category depth rather than broad reach.
Current competitive activity centers on verified condition grading rollout, white-glove furniture logistics partnerships, and exclusive retailer trade-in agreements, evaluated here consistently on gross merchandise value across all participants. Chairish and 1stDibs continue investing in designer and vintage authentication, while AptDeco has pursued deeper metro-market logistics density in its core furniture category. Established leaders are responding with targeted acquisitions of exactly these logistics specialists.

Emerging pressure comes from retailer-owned resale programs launched directly by major furniture chains, whose trade-in inventory access threatens to disintermediate independent platforms over time. Specialized appliance resale challengers focused on functional-testing certification are also gaining share, positioning them to climb the rankings as buyer trust in refurbished electronics continues building steadily. Established platforms are watching this shift closely as consolidation pressure builds.
second-hand-homeware-market-company-positioning-matrix-1790022027879

Competitive Moat and Risk Dimensions

THREDUP

Moat: Logistics Scale Advantage

ThredUp's processing infrastructure, originally built for apparel resale, gives it meaningful cost advantages as it expands into adjacent homeware categories requiring similar intake and grading workflows. Its established brand trust among resale-first consumers also accelerates adoption of new category launches faster than smaller specialized competitors typically achieve.
THREDUP

Risk: Category Expansion Complexity

Homeware, particularly bulky furniture, requires materially different logistics than ThredUp's core apparel business, and missteps in this expansion could dilute both margin and brand trust built over years. Specialized furniture-only competitors with purpose-built logistics may prove more efficient within this specific category. Its cost structure, optimized for smaller apparel shipments, may not translate efficiently to bulkier furniture logistics.
FACEBOOK MARKETPLACE

Moat: Unmatched Reach and Scale

Facebook Marketplace's massive existing user base gives it listing volume and local discovery advantages that dedicated resale platforms cannot match without comparable network effects. Zero listing fees also make it the default starting point for casual sellers testing the resale market for the first time.
FACEBOOK MARKETPLACE

Risk: Limited Trust Infrastructure

The platform lacks the verified condition grading, authentication, and buyer protection guarantees that dedicated resale platforms increasingly offer, leaving it vulnerable to losing higher-value transactions to more specialized, trust-focused competitors over time. Buyers seeking higher-value items increasingly migrate toward platforms offering these guarantees. over time

Players Tracked

Prominent Players

ThredUp
Facebook Marketplace
Chairish
1stDibs
AptDeco

Other Key Players

The RealReal
Kaiyo
Furnishly
Consignd
OfferUp
Craigslist
Poshmark
eBay
Decluttr
Everything But The House
Home Consignment Center
Trove
Etsy
Gone Wild Vintage
Circular

Recent Developments

FEBRUARY 2025

ThredUp Launches Verified Furniture Grading Pilot

ThredUp launched a pilot verified condition grading program for furniture listings in three major metropolitan markets, partnering with a third-party inspection service to reduce buyer disputes ahead of a planned national rollout later in the year. Early results showed measurably fewer post-sale disputes compared with ungraded listings.
Signal: Signals apparel-focused platforms actively pursuing homeware category expansion opportunities ahead of a broader national platform rollout
JUNE 2025

AptDeco Signs Regional Delivery Fleet Agreement

AptDeco signed a supply agreement with a regional logistics provider to expand white-glove furniture delivery capacity across additional metropolitan markets, addressing demand that had outpaced its existing in-house delivery fleet significantly during peak periods. The expansion reduces reliance on third-party couriers for oversized furniture shipments.
Signal: Reflects growing recognition that delivery capability increasingly determines platform competitiveness as logistics becomes the primary battleground
NOVEMBER 2025

Chairish Acquires Vintage Authentication Startup

Chairish completed an acquisition of a small vintage furniture authentication startup, integrating its expert network directly into the platform to strengthen designer and vintage category trust ahead of expanding into adjacent high-value decor categories next year. The deal follows a broader pattern of authentication capability consolidation across the sector.
Signal: Confirms authentication capability becoming a key acquisition target industrywide as trust becomes the primary differentiator going forward

Logistics and Authentication Cost Exposure

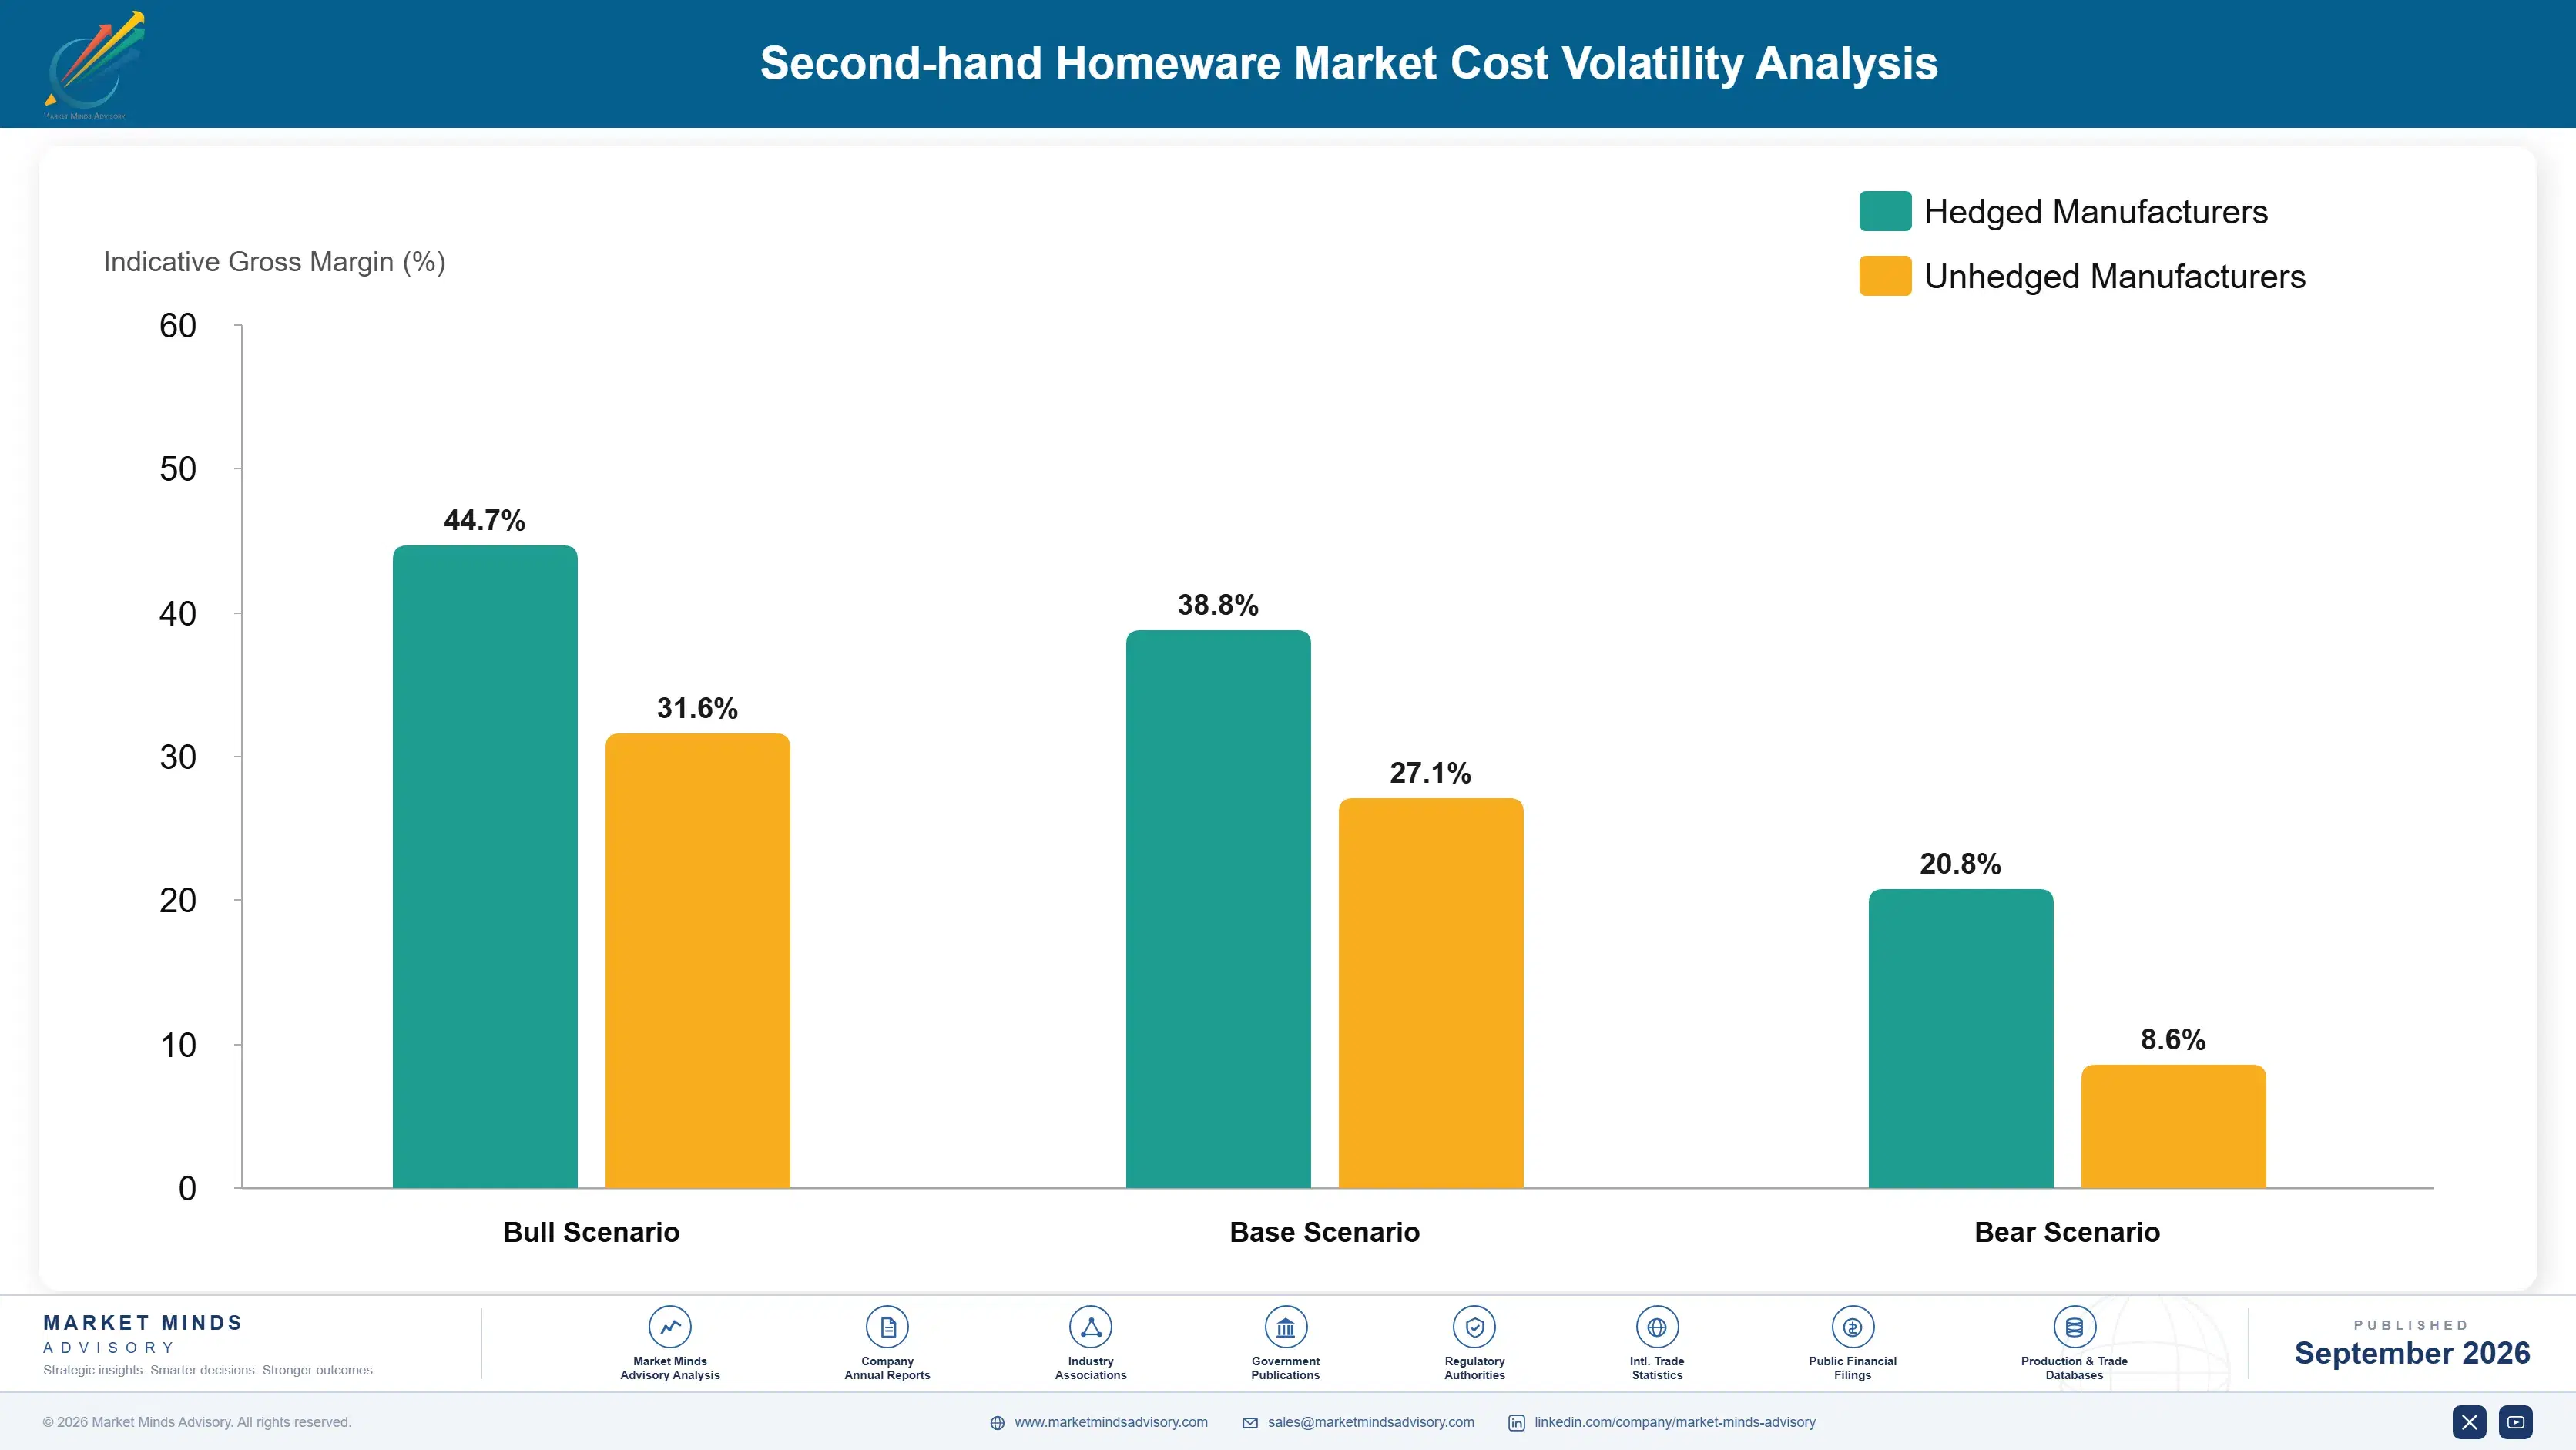
Logistics and delivery services account for roughly 40 percent of platform operating cost structures, sourced predominantly from third-party white-glove furniture delivery providers concentrated in major metropolitan freight corridors. Authentication and condition-grading services add a further meaningful share, while payment processing and support fill out the remainder. Payment processing and customer support fill out the remainder of typical cost allocations across most operating regions.
Fuel and freight costs spiked sharply during 2022 amid broader supply chain disruption, a pattern the US Census Bureau's transportation services data documented across furniture and household goods logistics specifically. Platforms absorbed several months of compressed delivery margin before renegotiating carrier contracts and adjusting delivery fee structures to restore more typical cost pass-through arrangements with sellers and buyers alike. Delivery pricing has since stabilized, but platforms report continued vigilance around fuel surcharge exposure heading into future peak shipping seasons.

Smaller regional platforms lacking scaled delivery partnerships face materially higher per-shipment cost than larger competitors with diversified logistics networks spanning multiple metropolitan corridors. This gap widens further for platforms concentrated in rural or lower-density markets, since they cannot spread fixed delivery infrastructure costs across comparable volume. Scaled platforms with vertically integrated regional hubs largely avoided this exposure.
second-hand-homeware-market-cost-volatility-analysis-1790022028075

Regional Delivery Hub Consolidation

Platforms increasingly consolidate delivery operations through regional hub networks to reduce per-shipment cost through improved route density and shared warehousing across nearby metropolitan markets. This approach has already delivered measurable margin improvement for several scaled operators. Several operators report measurable margin improvement from adopting this approach over the past two fiscal years. Consolidation continues expanding across additional metropolitan corridors.

Third-Party Authentication Partnership Scaling

Partnering with established authentication networks rather than building in-house expert teams reduces fixed cost while maintaining service quality across a broader range of designer and vintage categories. Adoption remains gradual as trust in third-party partners continues building industrywide. Several operators report measurable margin improvement from adopting this approach over the past two fiscal years.

Dynamic Delivery Fee Pricing Models

Platforms are shifting toward dynamic delivery fee pricing that reflects actual distance and route density rather than flat national rates, better aligning cost recovery with true fulfillment expense. This approach improves margin predictability across variable geographic markets. Several operators report measurable margin improvement from adopting this approach over the past two fiscal years. Adoption is expected to broaden further.

Portfolio Architecture for Margin Defence

Resale portfolios split across three distinct margin tiers, with volume-oriented general listings competing primarily on price and platform reach rather than authentication depth. Certified, condition-graded furniture and appliances occupy the middle tier, commanding higher take rates through buyer protection guarantees that justify commission premiums over ungraded peer-to-peer listings. Volume-tier revenue contribution keeps shrinking as buyers migrate toward graded alternatives.
Designer, vintage, and sustainability-certified formats sit at the top of the margin hierarchy, reflecting authentication investment and specialized expertise that smaller general platforms struggle to replicate profitably at scale. This tension between volume reach and premium curation defines portfolio strategy across nearly every major operator in the category. Operators unable to fund authentication and grading infrastructure risk being squeezed out of premium tiers entirely within the next several years, ceding ground to better-capitalized rivals.

High-value margin pools concentrate disproportionately in designer decor and certified furniture sold through curated platforms, where authentication and grading barriers limit direct commission competition. Operators increasingly allocate investment toward these tiers, recognizing that volume-tier growth alone cannot offset compressing commission margins on undifferentiated listings across most major markets. This trend is expected to accelerate further through the forecast period.

Volume / Commodity-Adjacent

General peer-to-peer listings across most categories, competing primarily on reach and low or zero listing fees against dedicated platforms. Operators compete primarily on user base scale and network effects rather than authentication depth, leaving commission margins persistently thin.
Gross Margin: 10-16%

Premium / Certified

Condition-graded furniture and appliances commanding higher commissions through buyer protection guarantees and verified authentication services. Buyer trust built through recognized grading standards supports continued commission premiums even as general platforms improve their own trust infrastructure.
Gross Margin: 22-28%

Sustainability / Regulatory / Next-Generation

Designer, vintage, and sustainability-certified formats capturing top-tier commission as authentication barriers limit near-term competition. Operators investing early in authentication expertise capture disproportionate margin as slower general platforms struggle to replicate specialized curation capability.
Gross Margin: 28-35%
second-hand-homeware-market-portfolio-architecture-1790022028574

High-value Sub-segments and Strategic Watch-out

Small Appliances

The fastest-growing, highest-value segment, combining functional-testing certification with strong sustainability appeal among space-constrained urban buyers seeking affordable alternatives. Manufacturers with established functional-testing partnerships are best positioned to capture this durable shift in household purchasing behavior over time. Sustained demand shows no sign of reverting to pre-pandemic norms anytime soon.
Gross Margin: 24-30%

Home Decor and Textiles

A high-value segment growing quickly as social media discovery drives new buyer acquisition into curated vintage and designer decor categories. Platforms with dedicated design curation expertise are winning disproportionate share against general marketplaces lacking comparable community features. Short-form video content continues driving substantial new buyer discovery into this expanding category.
Gross Margin: 26-32%

Furniture

The volume core of the category, defended through delivery logistics investment rather than pricing power against lower-cost peer-to-peer alternatives. Operators defend this segment through continuous investment in delivery reliability rather than aggressive commission discounting against smaller competitors. This defense strategy has proven durable across multiple competitive cycles industrywide.
Gross Margin: 16-22%

Kitchenware and Tableware

A strategic watch-out segment where low average selling prices and high shipping cost ratios compress margin as competition from general marketplaces intensifies. Operators increasingly bundle this segment with higher-margin categories to offset thin standalone commission economics over time. Bundling helps offset thin standalone economics as competition from general marketplaces intensifies.
Gross Margin: 12-18%

Trust-Based Repeat Engagement

Resale platform demand functions increasingly on repeat engagement economics rather than one-time transactions, since buyers who complete a successful first purchase return to furnish additional rooms or categories over subsequent months. This pattern gives scaled platforms meaningfully predictable transaction visibility, provided trust holds through the first-purchase experience. Platforms increasingly design onboarding flows specifically to maximize the odds of a successful, dispute-free first transaction.
Adoption depth varies considerably by end-use vertical. Furniture buyers show the deepest engagement once trust is established, often returning across multiple room categories over an extended furnishing timeline, while decor and textile buyers exhibit more frequent, lower-value repeat purchases driven by trend cycles. Appliance buyers show the least frequent repeat engagement.

Generational shifts are reshaping the buyer profile meaningfully. Younger buyers increasingly default to resale-first furnishing strategies rather than treating secondhand as a fallback, a behavior less common among older generations who defaulted to new retail purchases. This shift compresses the customer acquisition advantage traditional furniture retailers built over decades. Retailers responding fastest, through trade-in programs and owned resale channels, are capturing disproportionate engagement among younger household formation cohorts entering the market for the first time.
second-hand-homeware-market-end-use-penetration-index-1790022029065

Where Resale Operators Should Focus

These are among the four positions where our research anticipates prominent divergence between winners and laggards over the coming forecast period. Each is grounded in the demand model, the regulatory perimeter, and the announced capacity pipeline.
01 / TRUST INFRASTRUCTURE PRIORITY

Invest in verified grading ahead of competitors

Verified condition grading and authentication are becoming the primary basis on which buyers choose one platform over another, particularly for higher-value furniture and designer categories. Operators that delay this investment risk losing transaction volume to competitors who have already normalized buyer trust through third-party inspection partnerships and protection guarantees. Early movers are capturing measurably higher conversion rates that compound further as word of mouth reinforces platform reputation over time, giving early movers a durable pricing and volume advantage as the category matures further over the coming several years.
02 / FURNITURE LOGISTICS BUILDOUT

Build white-glove delivery capability before rivals scale

Furniture remains the highest-value category by average selling price, but delivery complexity keeps many general platforms from competing effectively against operators with dedicated logistics networks. Operators who build or partner for white-glove delivery capability open previously inaccessible rural and suburban markets while capturing higher delivery fee margin. This capability increasingly determines which platforms retailers select for exclusive trade-in partnership agreements going forward, and operators without this infrastructure face growing disadvantage as buyer expectations around delivery reliability continue rising steadily each year.
03 / RETAILER PARTNERSHIP DEPTH

Secure exclusive trade-in agreements with major retailers

Retailer trade-in programs are becoming a critical sourcing channel, feeding certified inventory into resale platforms while simultaneously driving new customer acquisition for the retailers themselves. Operators who secure exclusive, multi-year trade-in partnerships gain preferential access to certified inventory at favorable acquisition cost compared with rivals sourcing purely through open marketplace listings. This advantage compounds as partnerships mature and retailers deepen their commitment over successive renewal cycles, creating a durable sourcing advantage that becomes increasingly difficult for new entrants to replicate without comparable retailer relationships already in place.
04 / CATEGORY AUTHENTICATION DEPTH

Build authentication expertise in designer and vintage

Designer and vintage decor commands premium pricing that ungraded general marketplaces cannot capture due to persistent counterfeit and misrepresentation concerns among higher-spending buyers. Operators who build recognized authentication expertise and brand trust in these categories capture disproportionate commission revenue relative to transaction volume compared with undifferentiated general listings. This specialized positioning also attracts a distinct, higher-spending buyer segment that becomes increasingly loyal once trust is firmly established, reinforcing a durable commercial edge that strengthens further with every additional forecast year that passes across the category.

Engagement Snapshot From the Field

A live engagement with an industry participant carrying material or product regulatory and market exposure ahead of a defining policy shift, showing how our research translates into a defensible multi-year portfolio strategy.
MARKET MINDS ADVISORY · CLIENT ENGAGEMENT SUMMARY
Second-hand Homeware Producer Strategic Portfolio Review and Transition Roadmap 2026·Investment Scenario on Second-hand Homeware Exposure Evaluation 2025-26
CLIENT PROFILE
A mid-sized regional furniture retail chain operating dozens of showrooms sought to launch a branded trade-in program allowing customers to sell used furniture toward new purchases. Leadership viewed resale as both a customer acquisition tool and a defensive response to growing competition from dedicated resale platforms expanding into the retailer's core furniture categories. The chief marketing officer sponsored the engagement directly.
STRATEGIC CHALLENGE
The retailer lacked internal expertise to evaluate whether to build in-house resale capability or partner with an established platform for logistics, grading, and payment processing. Leadership also needed realistic projections of trade-in volume and margin impact before committing capital to store-level intake infrastructure across its showroom network. Store-level staff also needed clear training on intake procedures.
MMA APPROACH
MMA conducted a structured evaluation of four potential platform partners against logistics capability, grading standards, and commission economics, drawing on MMA's proprietary primary research dataset covering resale platform benchmarks. The engagement included a phased rollout recommendation sequencing pilot markets ahead of full network deployment based on projected trade-in volume by store location.
KEY FINDINGS
  1. Partnering with an established platform reduced projected launch timeline by roughly five months compared with building in-house grading and logistics capability from scratch.
  2. Trade-in customers converted to new purchases within six months at a rate 35 percent higher than non-trade-in customers (client-reported, unverified by MMA).
  3. Furniture categories with the highest resale value also drove the strongest new-purchase conversion, suggesting a durable link between trade-in engagement and premium upsell behavior.
  4. Pilot store locations in suburban markets generated meaningfully higher trade-in volume than urban locations, reflecting larger average furniture holdings among suburban households.
CLIENT PROFILE
A mid-sized regional furniture retail chain operating dozens of showrooms sought to launch a branded trade-in program allowing customers to sell used furniture toward new purchases. Leadership viewed resale as both a customer acquisition tool and a defensive response to growing competition from dedicated resale platforms expanding into the retailer's core furniture categories. The chief marketing officer sponsored the engagement directly.
STRATEGIC CHALLENGE
The retailer lacked internal expertise to evaluate whether to build in-house resale capability or partner with an established platform for logistics, grading, and payment processing. Leadership also needed realistic projections of trade-in volume and margin impact before committing capital to store-level intake infrastructure across its showroom network. Store-level staff also needed clear training on intake procedures.
MMA APPROACH
MMA conducted a structured evaluation of four potential platform partners against logistics capability, grading standards, and commission economics, drawing on MMA's proprietary primary research dataset covering resale platform benchmarks. The engagement included a phased rollout recommendation sequencing pilot markets ahead of full network deployment based on projected trade-in volume by store location.
KEY FINDINGS
  1. Partnering with an established platform reduced projected launch timeline by roughly five months compared with building in-house grading and logistics capability from scratch.
  2. Trade-in customers converted to new purchases within six months at a rate 35 percent higher than non-trade-in customers (client-reported, unverified by MMA).
  3. Furniture categories with the highest resale value also drove the strongest new-purchase conversion, suggesting a durable link between trade-in engagement and premium upsell behavior.
  4. Pilot store locations in suburban markets generated meaningfully higher trade-in volume than urban locations, reflecting larger average furniture holdings among suburban households.
RECOMMENDED STRATEGY
Phase 1: Phase one: launch trade-in pilot across five suburban showroom locations partnering with an established resale platform for logistics and grading. Phase 2: Phase two: expand to remaining showroom network within twelve months, incorporating pilot learnings on staffing, intake workflow design, and commission terms. Phase 3: Phase three: evaluate building proprietary grading capability once trade-in volume justifies the fixed infrastructure investment required across the full network.
OUTCOME
The retailer launched its trade-in pilot within the recommended timeline, reporting a 28 percent increase in repeat purchase rate among trade-in participants during the first two quarters following launch (client-reported, unverified by MMA). Leadership approved full network expansion ahead of schedule. within the first six months of operation.

Frequently Asked Questions

Foundational context covering the market sizes, CAGR, scope, country, region and competition that inform every finding below. This section is provided to cover basics and most often pre-purchase conversations, answered from the MMA Primary Research Dataset.

What is the current size of the Second-hand Homeware Market?

The Second-hand Homeware Market was valued at 34.5 billion dollars in 2025. This figure covers resold furniture, kitchenware, decor, and small appliances sold through online and physical resale channels globally.

How large will the Second-hand Homeware Market be by 2036?

The market is projected to reach 84.63 billion dollars by 2036. This reflects sustained platform trust-building and rising sustainability preference driving resale adoption across most major regions.

What is the CAGR for the Second-hand Homeware Market 2026 to 2036?

The market is projected to grow at a compound annual rate of 8.5 percent between 2026 and 2036. Bull and bear scenarios range from 7.2 to 9.8 percent depending on regulatory and trust outcomes.

Which segment is growing fastest?

Small Appliances is the fastest-growing segment, expanding at a 14.0 percent CAGR. This is 1.65 times the overall market rate, driven by functional-testing certification reducing buyer hesitation.

Who are the major companies in the Second-hand Homeware Market?

ThredUp, Facebook Marketplace, Chairish, 1stDibs, and AptDeco lead the market, together holding roughly 22 percent of global platform transaction volume across all tracked categories. Specialized challengers continue gaining share.

Which country is growing fastest?

India is the fastest-growing major market, expanding at roughly an 11.5 percent CAGR. Rising urban middle-class formation and expanding platform trust are driving first-time resale adoption across major cities.

Report Segmentation Architecture

The full report scope spans multiple orthogonal segmentation dimensions, with cross-tabulated demand data provided for each dimension pair. Coverage extends further to regional breakdowns, trend trajectories, and the competitive detail needed to support segment-level decision-making.

By Primary Market Dimension

  • Furniture
  • Kitchenware and Tableware
  • Home Decor and Textiles
  • Lighting and Fixtures
  • Small Appliances
  • Storage and Organization

By End-Use Industry

  • Residential Households
  • Hospitality and Short-Term Rental
  • Office and Commercial Space
  • Student and Shared Housing
  • Institutional Furnishing

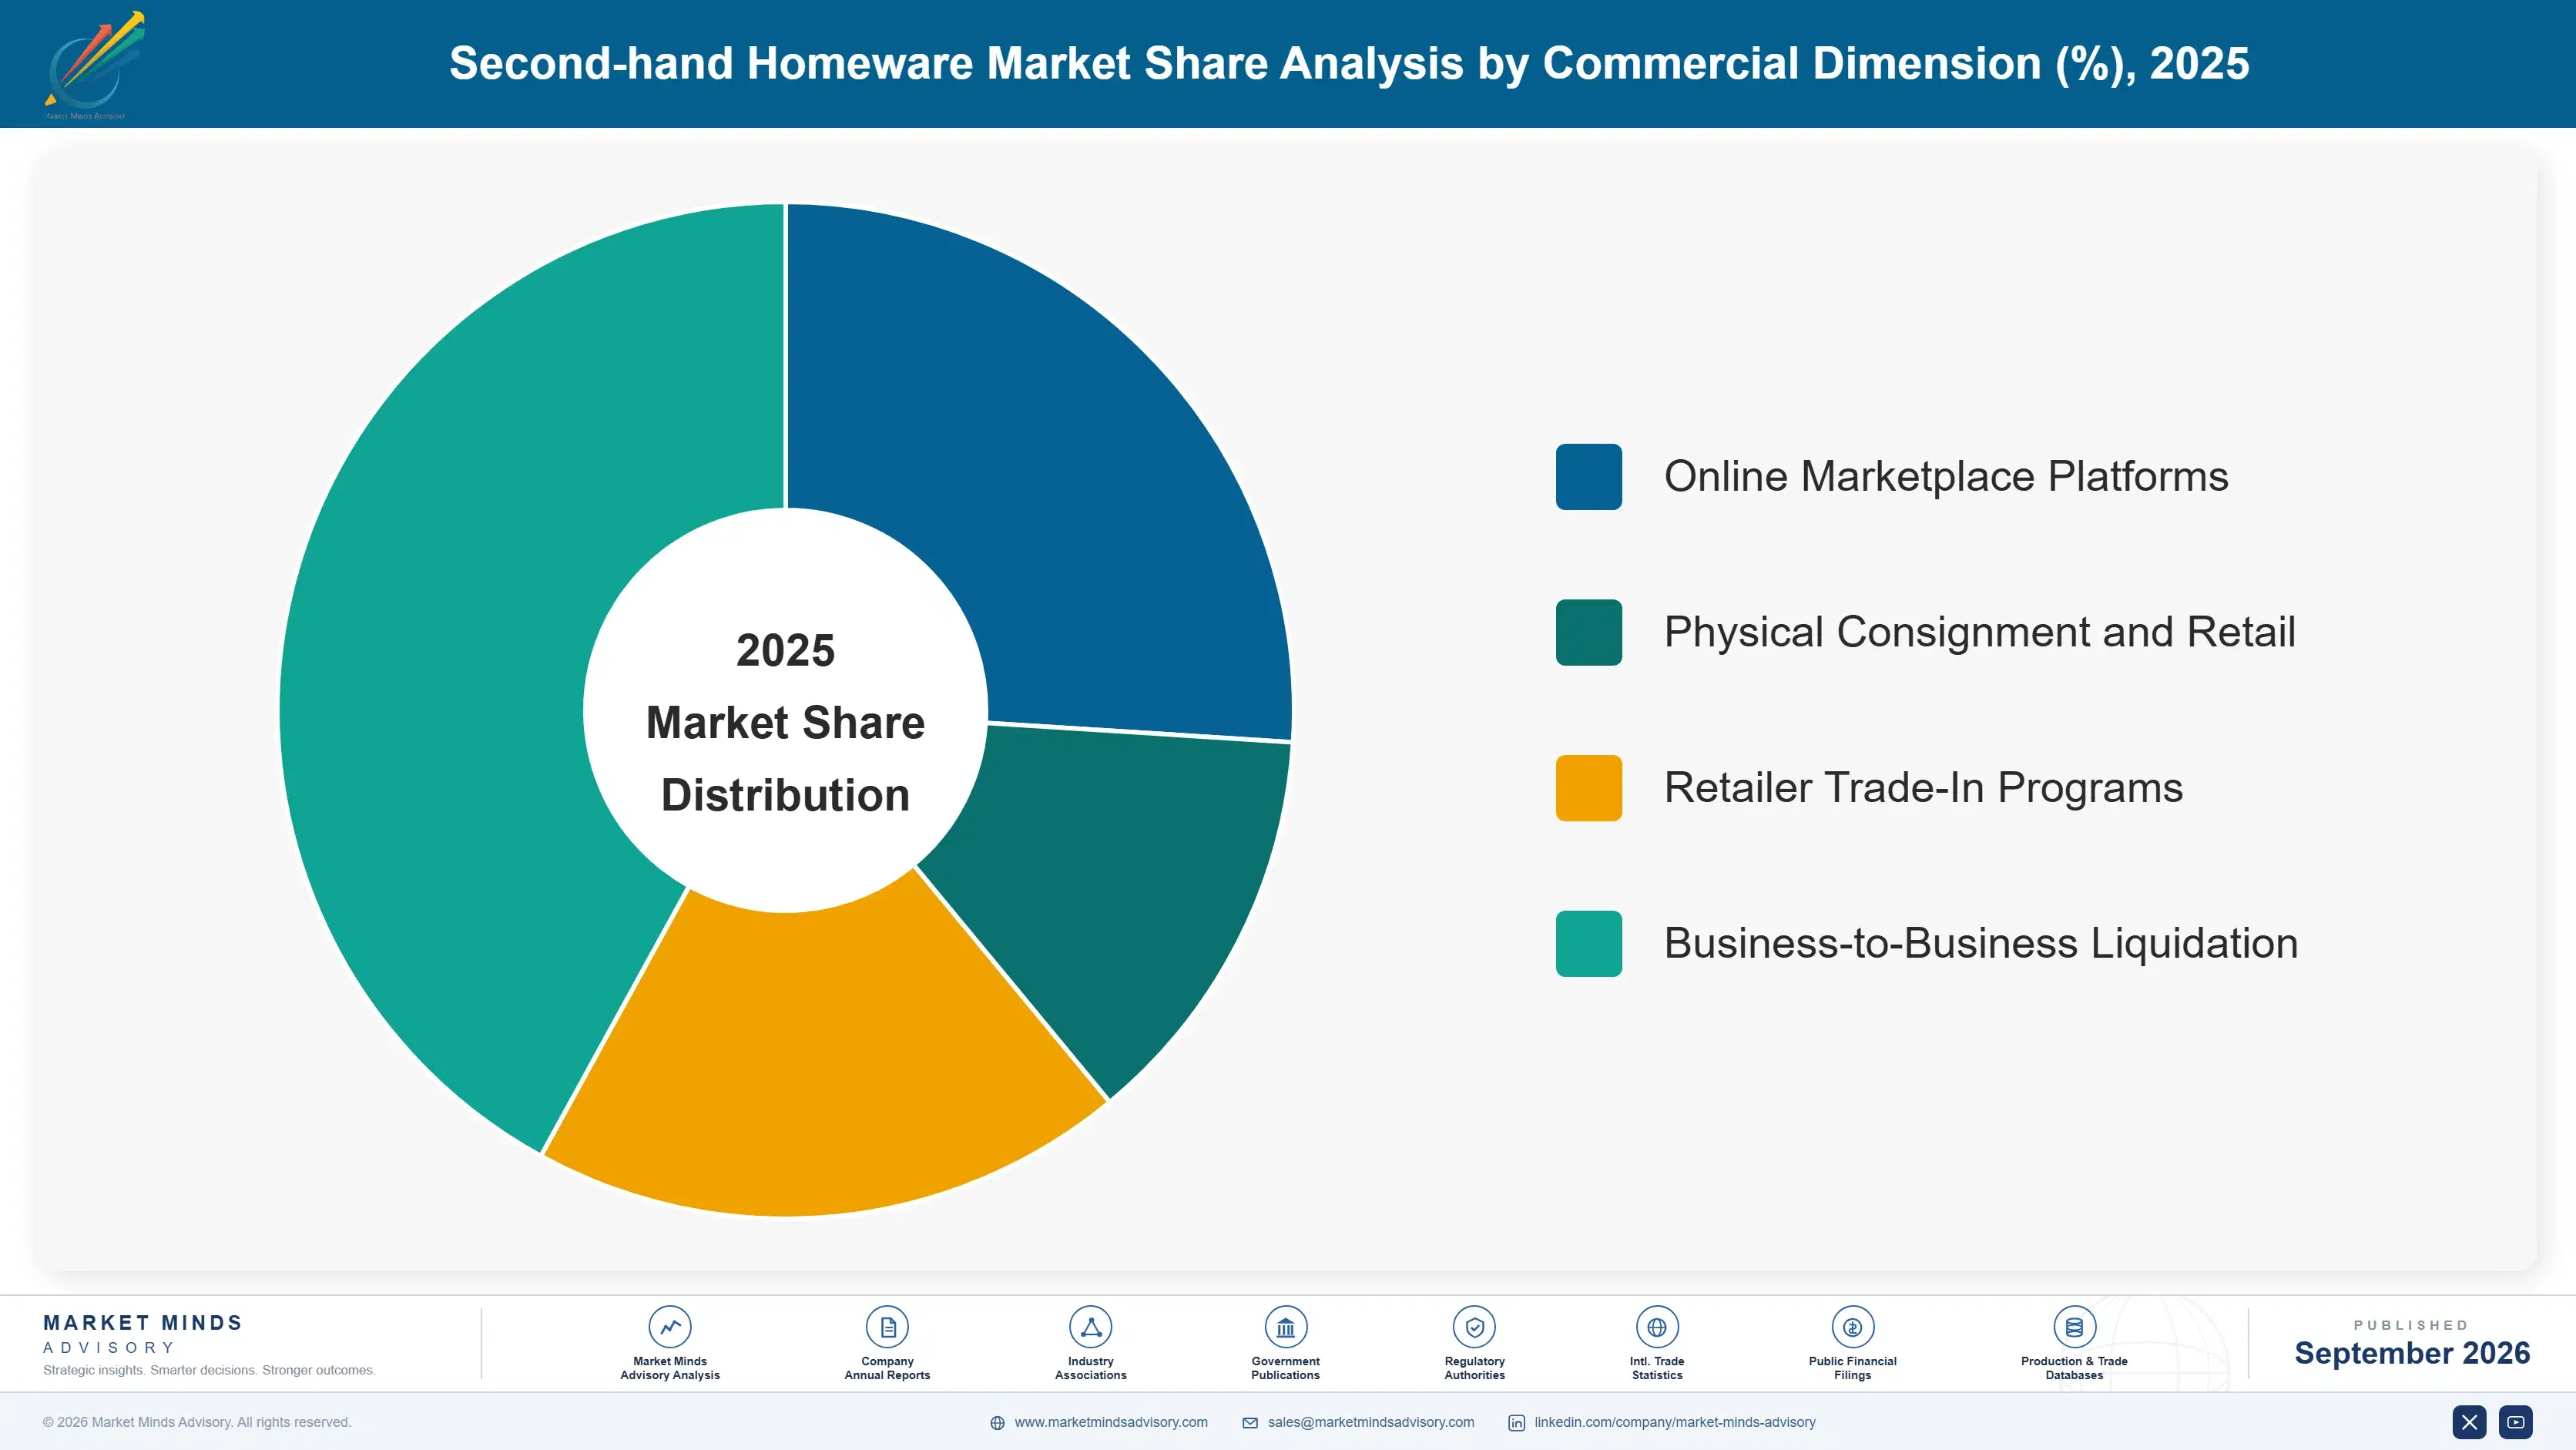
By Commercial Dimension

  • Online Marketplace Platforms
  • Physical Consignment and Retail
  • Retailer Trade-In Programs
  • Business-to-Business Liquidation

By Region

  • North America
  • Western Europe
  • East Asia
  • South Asia and Pacific
  • Latin America
  • Middle East and Africa
  • Eastern Europe

Scope, Methodology, and Coverage

Every figure in this report is reproducible from documented input assumptions. The scope below maps the historical period, the forecast horizon, the segmentation dimensions, and the countries covered, alongside the underlying primary and qualitative methodology.
Historical Period
2020 to 2025
Forecast Period
2026 to 2036
Base Year
2025 (USD billions; MMA Primary Research Dataset, September 2026)
Market Definition
The Second-hand Homeware Market covers resold and pre-owned furniture, kitchenware, decor, lighting, and small appliances transacted through online marketplaces, consignment stores, and retailer trade-in programs globally. It excludes new-manufactured goods, donation-only charitable exchanges, and unmonetized peer gifting.
Quantitative Units
USD billions, market share percentage, CAGR percentage
Segmentation Dimensions
Product type, end-use industry, commercial and distribution dimension
Regions Covered
North America, Western Europe, East Asia, South Asia and Pacific, Latin America, Middle East and Africa, Eastern Europe
Countries Covered
United States, Canada, Mexico, Germany, United Kingdom, France, China, Japan, South Korea, India, Australia, Indonesia, Vietnam, Brazil, Argentina, Colombia, United Arab Emirates, Saudi Arabia, South Africa, Poland, Czech Republic, Russia
Key Companies Profiled
ThredUp, Facebook Marketplace, Chairish, 1stDibs, AptDeco, The RealReal, Kaiyo, Furnishly, Consignd, OfferUp, Craigslist, Poshmark, eBay, Decluttr, Everything But The House, Home Consignment Center, Trove, Etsy, Gone Wild Vintage, Circular
Quantitative Methodology
Primary survey, n=3,800 respondents, Q4 2025, six countries; demand-side model with trade association cross-validation
Qualitative Methodology
47 expert interviews, Q4 2025; applied to validate demand model assumptions, identify emerging dynamics, and assess competitive positioning
Report Format
PDF and XLSX data workbook (Word format preview document)
Publisher
Market Minds Advisory
Report Code
MMA-2026-CON-478
Published
September 2026
Contact
sales@marketmindsadvisory.com | www.marketmindsadvisory.com

Purchase the full Second-hand Homeware Market Report (2026 to 2036).

This report delivers a complete analysis of the global Second-hand Homeware Market, covering historical performance from 2020 through 2025 and forecasts through 2036 across every major product category and region. It combines primary survey data from 3,800 respondents with 47 expert interviews to quantify segment growth, regional demand shifts, and competitive dynamics. Analysts detail logistics cost exposure, portfolio margin architecture, and trust infrastructure reshaping platform competition. The report is designed for strategy, retail partnership, and investment teams evaluating this category. Findings support sourcing, pricing, and portfolio decisions.
Ten-year historical and forecast data series
Seven-region demand and growth breakdown Detail
Competitive benchmarking of twenty companies Landscape
Segment-level CAGR and market share detail
Logistics cost and margin sensitivity analysis
Trust infrastructure and platform trend tracking

Built For The People Who Decide

From boardroom strategy to bench-side execution, this report is read cover-to-cover by leaders shaping the next decade of their industry, turning demand scenarios, market dynamics and valuation benchmarks into decisions.
CXOs/ Presidents/ VPs/ Managers
M&A and Corporate Development
Strategy Teams and R&D Heads
Procurement and Product Directors
Regulatory and Compliance Leaders
Investor Relations and Equity Analysts