Market Minds Advisory
Seafood Market

Seafood Market: Aquaculture Expansion and Sustainability Positioning Redraw Global Sourcing

Seafood processors across China, Norway, and Vietnam are qualifying expanded aquaculture and traceability capacity as sustainability certification demand and shifting consumer protein preferences converge faster than most producers anticipated across every major global market.

Lead Analyst

Lisa Gevelber

Published

September 2026

Make Smarter Decisions with Customized Research Insights

Request a free sample report and evaluate market opportunities, growth trends, and competitive dynamics relevant to your business needs.

2025 MARKET VALUE$265.0BMarket Size 2025
2036 FORECAST VALUE$434.6BBase Case , 2026 to 2036
CAGR 2026 TO 20364.6 %Bull 5.8% / Bear 3.4%
INCREMENTAL OPPORTUNITY$157.4BNet 10- year value creation
EXPANSION MULTIPLE1.57x2036 value over 2026 base
Strategic Levers
M&A Pipeline
Regional Outlook
Country Rankings
Competitive Intelligence
Segmental Deep-dive
Call-Us : 91 93563 13602

Executive Snapshot and Market Trajectory

Aquaculture expansion and sustainability certification have moved from a compliance afterthought into the primary sourcing decision at nearly every major seafood processor, as traceability demand and shifting consumer protein preferences converge considerably faster than most producers anticipated across every major regional market and distribution channel worldwide today.
East Asia anchors global demand, home to the deepest aquaculture production and seafood consumption base in the world, as Mowi ASA, Thai Union Group PCL, and Nissui Corporation compete for the same retail brand and foodservice accounts across an expanding farmed production base. Seaweed and algae-based seafood products are the fastest-growing category, smaller than finfish volume but preferred as sustainability positioning accelerates. Processors increasingly treat documented traceability claims as standard specification practice.
Five suppliers, Mowi ASA, Thai Union Group PCL, Nissui Corporation, Cermaq Group AS, and Maruha Nichiro Corporation, hold roughly 24 percent of global seafood revenue, a moderate concentration reflecting an industry still populated by numerous regional processors serving local retail and export relationships. Tightening sustainability certification expectations and expanding aquaculture volume are pulling sourcing specification forward across nearly every major processor roadmap worldwide today, reshaping supplier selection criteria.
Market Definition
The seafood market covers wild-caught and farmed seafood products including finfish, shrimp and prawns, crab and lobster, bivalve mollusks, cephalopods, and seaweed and algae-based seafood, sold in fresh, frozen, and processed forms through retail, foodservice, and export channels. It excludes ornamental and aquarium fish, fishmeal and fish oil sold purely as animal feed ingredients, and non-food marine byproducts.
Base Year Value
$265.0B in 2025 (MMA Primary Research Dataset, August 2026)
Forecast Period
2026 to 2036, eleven discrete annual values
CAGR
4.6% base case. Bull 5.8%. Bear 3.4%.
Fastest Growth Segment
Seaweed and Algae-Based Seafood Products: 8.6% CAGR
Fastest Growth Country
Vietnam: 7.8% CAGR
Fastest Growth Region
South Asia and Pacific: 6.6% CAGR
Largest Region
East Asia: 38% of 2025 global value
Market Leaders
Mowi ASA, Thai Union Group PCL, Nissui Corporation, Cermaq Group AS, Maruha Nichiro Corporation. Source: MMA Analysis based on company annual reports and investor filings.
Primary Survey
n=3,800 procurement and R&D decision-makers, Q4 2025, six countries
Methodology
Demand-side build-up, cross-validated against public data, 47 expert interviews

Seafood Market Forecast Scenarios

seafood-market-report-trends-forecasts-size-forecast-scenario-1787334874845
Seafood demand grew steadily from 2020 through 2025 as global protein consumption recovered from pandemic-era disruption and aquaculture production capacity expanded across major producing regions. The category grew at roughly a 4.1 percent historical compound rate as processors began qualifying expanded farmed production capacity. Growth accelerated meaningfully across the final two years of the period as export trade normalised.
MMA's base case assumes 4.6 percent compound growth through 2036, anchored in three mechanisms. First, expanding aquaculture production capacity is closing the supply gap left by stagnant wild-catch volumes across an increasing number of species categories. Second, tightening consumer expectations for documented sustainability certification are favouring certified traceable sourcing over unverified conventional supply on new retail contracts. Third, expanding seaweed and algae cultivation is extending supply into alternative protein categories that conventional finfish and shellfish alone cannot fully address.
A bull scenario near 5.8 percent follows if aquaculture and traceability capacity expansion accelerates ahead of scheduled certification timelines across major producing regions. The bear case near 3.4 percent materialises if producer capital budgets tighten enough that certified sustainable sourcing adoption is delayed, extending retail reliance on conventional wild-catch supply longer than current sustainability targets anticipate.

Aquaculture Expansion and Sustainability Positioning Redraw Global Sourcing

Seafood sourcing has moved from a cost-driven commodity purchase into a traceability-sensitive supply decision faster than most processors expected, reshaping how retail and foodservice buyers plan aquaculture and certification investment. Products that would have been supplied as standard wild-catch a decade ago are increasingly evaluated on documented sustainability and chain-of-custody data because retail buyers treat certified traceability as a procurement requirement rather than a discretionary preference.
MARKET CONCENTRATION24%Five suppliers hold a moderate combined global share
AVERAGE UNIT COST$8.40/kgReflects a standard farmed finfish wholesale price today
CHINA PRODUCTION SHARE32%Deepest aquaculture and wild-catch production base found worldwide
FEED COST SHARE37%Aquaculture feed and vessel fuel sourcing dominates total cost
CERTIFIED TRACEABILITY RATE28%Share of volume carrying certified sustainable sourcing documentation
COLD CHAIN REPLACEMENT CYCLE5-8 yearsTypical duration before a processor upgrades cold chain infrastructure
Commercial activity concentrates in finfish and shrimp production, where farmed sourcing scale and processing engineering give the five largest suppliers durable advantages on large retail brand and foodservice contracts across every major national market. Seaweed and algae-based products remain a smaller but fast-scaling category, increasingly specified directly by sustainability-focused brand teams. Bivalve mollusks round out demand across premium and regional specialty applications.
The next decade will be shaped less by incremental processing yield refinement than by how fast producers can qualify aquaculture and certification capacity at conventional-supply cost parity across every major producing region worldwide. Suppliers that can bundle certified traceable seafood with sustainability substantiation support capture a disproportionate share of new retail and foodservice contracts each year, reshaping supplier selection criteria.
"Seafood used to be bought mainly on species and price per pound. Now a retailer's sustainability scorecard can decide which supplier wins the shelf space."
Director, Seafood and Aquaculture Practice · MMA Wild-Caught and Farmed Seafood Products Practice · August 2026

Market Trends

Sustainability Certification Becomes Standard for Premium Retailers

Retail and foodservice buyers across major consumer markets increasingly specify certified traceable seafood as a replacement for unverified conventional wild-catch supply, making documented sustainability certification a growing default for premium product listings rather than a discretionary upgrade retailers can defer indefinitely across their categories. Suppliers with the broadest certification portfolios report that documented chain-of-custody and sustainability outcomes have become factors cited in new retail contract decisions, ahead of raw material cost considerations. Mowi ASA and Thai Union Group PCL both report that certified orders have grown faster than conventional orders across their major accounts.
Market Impact: Sustains a 42% aquaculture-linked supply base
Aquaculture Feed Innovation Accelerates Farmed Production Growth

Aquaculture producers across major farming regions continue to expand alternative feed adoption behind rising feed cost pressure that conventional fishmeal-based feed cannot satisfy under tightening sustainability certification expectations for farmed production across the category. Producers serving high-visibility premium retail accounts report that feed specification requirements are typically driven more by documented sustainability outcomes than by discretionary cost preferences, particularly across regulated aquaculture categories where enforcement has tightened. Cermaq Group AS and Nissui Corporation both report that alternative feed orders are a growing, steadily expanding share of their overall production business today, ahead of internal projections.
Market Impact: Adds 11pp to reporting-driven demand

Market Opportunities and Growth Drivers

Aquaculture Production Growth Sustains Baseline Supply Demand

Continued aquaculture production capacity expansion across major farming economies continues to sustain seafood supply demand regardless of broader wild-catch fluctuation cycles, since every new farmed production cycle entering the market represents committed supply tied to production protocol rather than discretionary catch variability across the industry. Processors managing high production volumes report that sourcing specification requirements are typically driven more by aquaculture capacity than by discretionary wild-catch preferences. This production-linked supply gives seafood suppliers unusually predictable baseline volume compared with wild-catch-dependent categories that depend more heavily on discretionary environmental variability cycles overall each season.
Market Impact: Raises feed cost volatility by 16%

Retail Sustainability Reporting Broadens Certified Sourcing

Continued retail sustainability reporting requirements across major grocery chains continue to expand demand for certified traceable seafood, and expanding reporting mandate coverage increasingly makes certified sourcing accessible and necessary for processors that historically relied exclusively on conventional wild-catch supply due to lower awareness of certified traceable alternatives previously available across their supplier base. Brands serving high-visibility grocery accounts report that sourcing specification decisions now weigh traceability documentation as heavily as upfront unit cost considerations. Suppliers serving these brands report considerably more reliable long-range volume forecasting as a direct result of that broader shift.
Market Impact: Limits scale-up pace by 10%

Market Restraints and Challenges

Feed and Fuel Cost Volatility Squeezes Producer Margins

Seafood producers face aquaculture feed and vessel fuel sourcing volatility that scale production does not fully eliminate, and the root cause of the margin pressure is a supply constraint: sustainable fishmeal alternative manufacturing capacity has not expanded fast enough to match rising certification compliance demand, leaving producers exposed to price spikes during tight feed market conditions. That constraint slows how quickly producers can hold wholesale pricing stable for large retail contracts, forcing producers to pass cost increases through to buyers mid-contract. Suppliers including Mowi ASA are mitigating the constraint by expanding long-term feed supply agreements.
Market Impact: Cuts uncertified conventional volume by 14%

Disease Outbreak Risk Limits Aquaculture Scale-Up Pace

Aquaculture producers face disease outbreak risk at higher farming densities that biosecurity engineering does not fully resolve, and the root cause of the constraint is a genuine production limitation: disease-resistant broodstock technology has not advanced fast enough to match the density levels that conventional wild-catch supply chains do not face at comparable scale. That constraint slows how quickly producers can expand farmed production capacity to meet retail demand, forcing producers to limit density expansion at existing sites longer than growth targets prefer. Suppliers including Cermaq Group AS are mitigating this by expanding biosecurity research investment.
Market Impact: Expands alternative feed adoption by 13pp
3 additional market trends, 4 additional growth drivers, and 2 additional restraints and challenges are covered in the full report. Contact sales@marketmindsadvisory.com to access the complete intelligence.

Segment CAGR and Growth Architecture

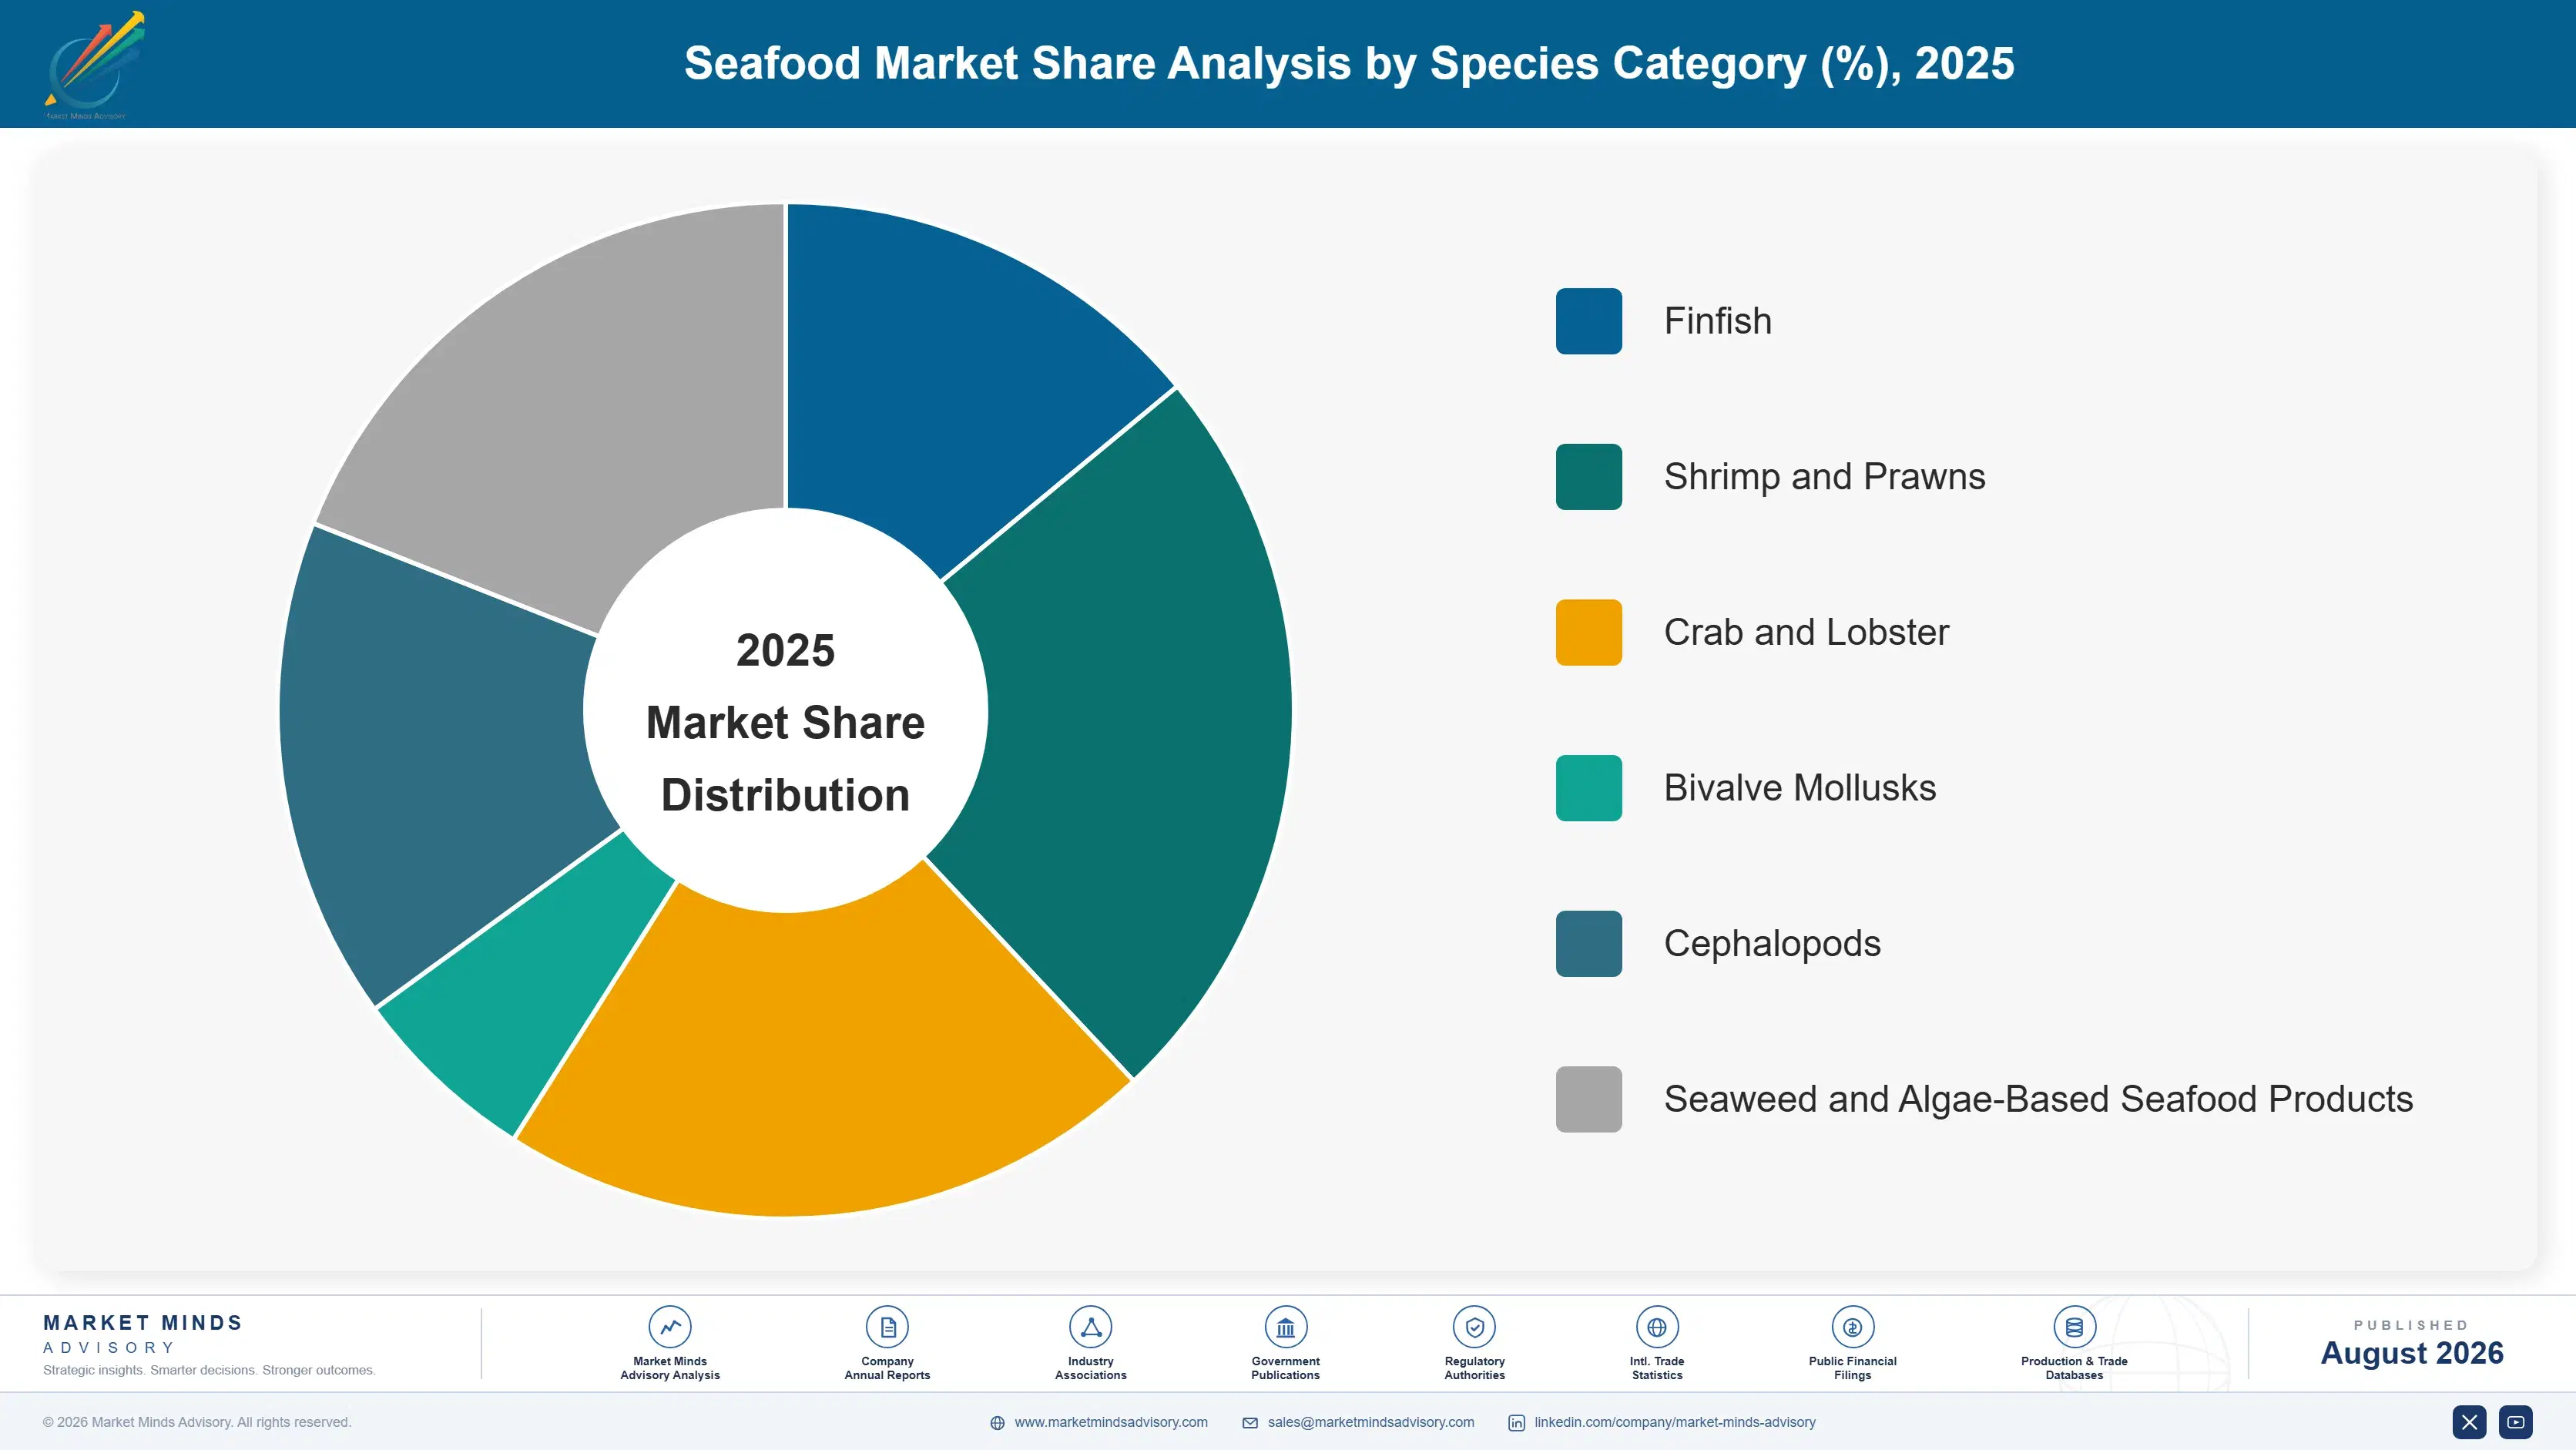
MMA segments the seafood market by species category, the classification retail buyers and foodservice operators actually specify and purchase against across every major global consumption application and export channel worldwide. Six categories cover the addressable market, spanning finfish, crustacean, mollusk, and algae-based formats, and MMA selects the two fastest-growing categories for detailed narrative treatment below.
seafood-market-report-trends-forecasts-market-share-analysis-1787334875378

Seaweed and Algae-Based Seafood Products

Seaweed and algae-based seafood products are growing fastest because they directly address the sustainability and alternative protein requirements that conventional finfish and shellfish cannot satisfy under expanding consumer environmental positioning demands. Thai Union Group PCL and Nissui Corporation both dominate this segment given their cultivation research investment and the retail brand relationships that newer entrants find difficult to replicate quickly at comparable sustainability documentation depth. Supply scaling gaps remain a consideration for high-volume applications, since cultivation technology differs meaningfully from conventional aquaculture performance. Growth here is expected to broaden as additional retailers finalize certified cultivation sourcing relationships, treating seaweed-based products as the general default rather than a niche option reserved for flagship sustainable product lines alone.
CAGR 8.6%

Shrimp and Prawns

Shrimp and prawns are the second-fastest-growing category as retail and foodservice buyers increasingly specify farmed formats that conventional wild-catch supply cannot match on production scale across export and domestic consumption applications worldwide. Charoen Pokphand Foods PCL and Minh Phu Seafood Corporation both dominate this segment given their aquaculture manufacturing scale and the export relationships that newer entrants find difficult to match at comparable production volume today. Smaller regional farmers without dedicated aquaculture capability face growing pressure to partner or cede this category to larger competitors with established production capacity and certification infrastructure in place. Growth here tracks closely with how fast producers convert legacy wild-catch supply chains to dedicated farmed production pathways.
CAGR 6.2%
Full segment breakdown across 6 segments available in the complete report.

Regional Architecture and Country Demand Map

East Asia leads global seafood demand, home to the deepest aquaculture production and consumption base found anywhere in the world today. South Asia and Pacific follows with the fastest regional growth, anchored by Vietnam's expanding aquaculture export sector. Eastern Europe trails given a smaller, landlocked-adjacent consumption base.

North America

The United States' expanding retail seafood category anchors North American demand, with premium grocery chains increasingly specifying documented certified traceable sourcing ahead of conventional wild-catch supply across major retail and foodservice distribution channels nationwide. Canada's growing wild-catch and aquaculture export sector adds steady incremental demand tied to expanding Pacific and Atlantic coast production and processing capacity. Mowi ASA and Cermaq Group AS's domestic distribution and processing infrastructure both give American retailers access to newly qualified certified aquaculture supply, even though overall market growth remains more gradual than in East Asia given a more mature, already-penetrated consumption base overall today. Mexico's growing aquaculture export sector adds a smaller layer of regional production capacity.
Share: 22% | CAGR: 3.8% (2026 to 2036)

Western Europe

Norway and the United Kingdom anchor Western European demand, both home to mature aquaculture and wild-catch processing sectors that pioneered modern salmon farming and increasingly specify certified sustainability for regulatory and brand positioning requirements. The European Union's fisheries and aquaculture regulatory framework gives suppliers with established European compliance infrastructure a large, relatively homogeneous certification market to serve compared with the more fragmented regulatory landscape found in other regions. Spain's advanced seafood processing sector, among the most developed globally, gives Spanish suppliers a demonstrated production advantage other markets increasingly reference. France's growing premium seafood retail investment is accelerating adoption behind updated national sustainability programmes. The Netherlands' expanding cold chain and distribution network rounds out the region's demand base.
Share: 18% | CAGR: 3.2% (2026 to 2036)
Regional intelligence for 5 additional markets available in the complete report: East Asia, South Asia and Pacific, Latin America, Middle East and Africa, Eastern Europe. Contact sales@marketmindsadvisory.com.
seafood-market-report-trends-forecasts-country-cagr-analysis-1787334875883

Traceability Depth and Retail Relationship Reach

Suppliers extract value less through raw seafood unit pricing than through building certification and traceability capability, deepening retail buyer and foodservice relationships, and bundling sustainability substantiation support into long-term supply agreements across every major market. The levers below describe how each part of the value chain captures its share of the traceability-driven transition underway across seafood production today.

Traceability Certification Investment Captures Retail Loyalty

Suppliers that build comprehensive chain-of-custody and sustainability certification capability fastest capture a disproportionate share of new retail relationships, since grocery buyers rarely switch seafood suppliers once a validated traceability protocol has been fully integrated into their category planning. Mowi ASA and Thai Union Group PCL both report that retailers adopting their certified sourcing earliest carry meaningfully higher repeat purchase rates, roughly 18 percent higher than retailers using competitor uncertified conventional sources. This first-mover dynamic makes traceability investment a strategic priority that can outweigh incremental unit price differences between competing suppliers.
Market Impact: Wins roughly 18% higher overall repeat purchase rates

Long-Term Feed Supply Agreements Anchor Cost Stability

Suppliers that build long-term aquaculture feed supply agreements capture years of predictable input cost stability that spot-market-dependent competitors cannot match, since every batch of contracted feed secured reduces exposure to price spikes tied to global fishmeal and alternative feed market cycles. Cermaq Group AS and Nissui Corporation have both prioritised long-term supply agreements because cost stability now represents a growing share of total margin protection, exceeding the benefit of incremental capacity expansion within roughly 3 years of investment. Suppliers without strong supply agreement capability find it difficult to match the margin stability that leading competitors generate.
Market Impact: Stabilizes input costs within roughly 3 years overall

Sustainability Substantiation Support Deepens Retail Relationships

Suppliers that build dedicated sustainability substantiation and chain-of-custody documentation capability into supply agreements capture deeper retail buyer relationships than product-only competitors, since grocery sustainability teams increasingly value integrated documentation for reducing their own internal compliance burden. Maruha Nichiro Corporation and Mowi ASA have both expanded substantiation integration capability specifically because bundled offerings raise average contract value by roughly 15 percent compared with product-only sales, giving suppliers a considerably stronger position during contract renewal negotiations. This bundling strategy requires sustained certification investment, but it creates switching costs that meaningfully raise retail retention above product-only competitors' typical account longevity.
Market Impact: Raises average contract value by roughly 15% overall

Shared Cold Chain Capacity Reduces Smaller Producer Risk

Suppliers that build shared cold chain and processing capacity access arrangements cut smaller producer adoption risk by roughly 16 percent compared with suppliers requiring fully independent cold chain investment, a difference that matters considerably to producers managing budget-constrained export transition timelines. Thai Union Group PCL and Nissui Corporation have both invested in expanding shared cold chain access capability specifically to capture this risk-sharing value, recognising that fully independent cold chain investment carries direct commercial cost for producers running lower-volume specialty export lines. Suppliers without comparable shared access capability find it difficult to compete for smaller regional export contracts today.
Market Impact: Cuts adoption risk by roughly 16% annually overall

Who Controls the Margin Pool

Five suppliers, Mowi ASA, Thai Union Group PCL, Nissui Corporation, Cermaq Group AS, and Maruha Nichiro Corporation, hold roughly 24 percent of global seafood revenue, a moderate concentration reflecting an industry still populated by numerous regional processors serving local retail and export relationships. The gap to challengers like Leroy Seafood Group ASA and SalMar ASA is narrower than the headline share suggests, since the remainder sits with regional processors rather than global rivals exclusively.
Current competitive activity centres on three fronts: building traceability certification capability to win retail loyalty, expanding long-term feed supply agreements, and bundling sustainability substantiation support into long-term supply agreements. Suppliers are expanding shared cold chain capacity access capability to reduce smaller producer risk and strengthen regional export contract positioning.

Emerging pressure comes from regional Southeast Asian and Vietnamese aquaculture producers expanding capability to serve narrower, higher-growth shrimp and seaweed applications rather than competing across the conventional finfish spectrum. Rankings are most likely to shift in shrimp and seaweed categories, where certification speed rather than raw production scale determine competitive position, leaving room for suppliers that move fastest on certification capability to gain share from legacy incumbents.
seafood-market-report-trends-forecasts-company-positioning-matrix-1787334876403

Competitive Moat and Risk Dimensions

MOWI ASA

Moat: Broadest Global Salmon Portfolio

Mowi ASA operates the world's largest salmon farming portfolio spanning more producing regions and applications than any single competitor, giving it cross-selling advantages that narrower regional processors cannot match. That portfolio breadth, built over decades of dedicated aquaculture investment, is difficult for newer entrants to replicate quickly at comparable scale.
MOWI ASA

Risk: Concentrated Species Exposure Risk

Mowi ASA's revenue concentration in salmon farming leaves it more exposed to species-specific disease outbreaks and feed cost cycles than competitors with broader species diversification like Thai Union Group PCL. A salmon-specific disruption would disproportionately affect Mowi ASA relative to more diversified global rivals with steadier multi-species revenue.
THAI UNION GROUP PCL

Moat: Deep Processing and Export Heritage

Thai Union Group PCL's decades-deep seafood processing and global export heritage gives it specification advantages that competitors without comparable large-scale processing infrastructure cannot match, letting it win specification decisions on supply reliability as much as raw price. That heritage, built over years of dedicated processing investment, gives Thai Union Group PCL a durable advantage.
THAI UNION GROUP PCL

Risk: Narrower Farmed Finfish Distribution

Thai Union Group PCL's farmed finfish distribution footprint remains narrower than competitors like Mowi ASA, leaving it more dependent on wild-catch and shrimp revenue than suppliers with broader aquaculture diversification. A slowdown in wild-catch supply would disproportionately affect Thai Union Group PCL relative to more diversified global rivals.

Players Tracked

Prominent Players

Mowi ASA
Thai Union Group PCL
Nissui Corporation
Cermaq Group AS
Maruha Nichiro Corporation

Other Key Players

Leroy Seafood Group ASA
SalMar ASA
Bakkafrost P/F
Cooke Inc
High Liner Foods Incorporated
American Seafoods Group LLC
Pacific Seafood Group
Austevoll Seafood ASA
Grieg Seafood ASA
Cargill Aqua Nutrition
Charoen Pokphand Foods PCL
Minh Phu Seafood Corporation
Nomad Foods Limited
Iglo Group
Trident Seafoods Corporation

Recent Developments

FEBRUARY 2026

Mowi ASA Launches Expanded Certified Traceability Programme

Mowi ASA launched an expanded blockchain-based traceability programme for its farmed salmon supply chain in February 2026, adding dedicated chain-of-custody documentation separate from its existing standard certification offerings. The launch addresses growing retail demand for certified sustainable sourcing ahead of expanding transparency requirements across several major markets.
Signal: Confirms that traceability certification capability has become a strategic priority for major seafood suppliers across the industry today.
SEPTEMBER 2025

Thai Union Group PCL Signs Major Retail Distribution Agreement

Thai Union Group PCL signed a multi-year certified seafood and traceability supply agreement with a major grocery retailer in September 2025, committing to provide certified sustainable seafood across the retailer's expanding wellness product line. The agreement covers multiple regional distribution centers and represents a major seafood supply commitment.
Signal: Signals that major grocery retailers are increasingly locking in certified sustainable seafood supply relationships years ahead of expansion.
APRIL 2025

Cermaq Group AS Expands Aquaculture Production Capacity

Cermaq Group AS commissioned expanded aquaculture production capacity in April 2025, adding dedicated farming sites serving growing demand from certified sustainable salmon conversion. The expansion positions Cermaq Group AS to capture growing demand from retailers converting legacy wild-catch specifications to certified compliant farmed sourcing nationwide.
Signal: Marks continued investment in aquaculture capacity as certified seafood demand accelerates steadily across the industry each year.

Aquaculture Feed and Vessel Fuel Cost

Aquaculture feed, including fishmeal, fish oil, and alternative protein blends, alongside vessel fuel for wild-catch operations, represent the largest cost inputs for seafood production, accounting for 37 percent of total producer cost, sourced from global fishmeal markets and alternative feed supply chains. Cold chain logistics and certification testing add a smaller cost category for producers expanding certified production.
Fishmeal prices spiked through 2022 as global aquaculture feed supply chains faced disruption amid competition for limited high-protein feed capacity affecting multiple aquaculture categories simultaneously, and Mowi ASA's fiscal year 2022 annual report cited elevated feed acquisition costs as a constraint on farming segment margins despite underlying demand strength. Producers responded by expanding long-term feed supply agreements and redesigning aquaculture feed formulations around more available alternative protein grades.

Vertically integrated producers with captive feed and hatchery sourcing capacity, including Mowi ASA and Cermaq Group AS, absorb material cost volatility more predictably than smaller regional farmers who compete for open-market feed at spot rates during periods of tight availability. That gap gives integrated producers a cost-stability advantage over smaller independent farmers, particularly during the raw material price cycles that squeeze margins across the specialty aquaculture manufacturing industry.
seafood-market-report-trends-forecasts-cost-volatility-analysis-1787334876598

Expanding Long-Term Feed Supply Agreements

Leading producers are expanding long-term aquaculture feed supply agreements across multiple sourcing regions to reduce reliance on single-source spot purchasing, converting a variable input cost exposure into a more predictable, diversified material base across their production network overall. This diversification strategy has proven valuable during periods of fishmeal shortage that squeeze non-diversified competitors hardest each cycle.

Redesigning Feed Around Available Protein Grades

Producers are redesigning aquaculture feed formulations around more readily available alternative protein grades to reduce exposure to single-specification shortages that have periodically delayed production schedules across the wider industry each year. This redesign investment requires sustained research resources but reduces long-term exposure to material scarcity that has repeatedly constrained output across the broader producer base.

Vertically Integrating Feed Sourcing Capacity

Larger producers are acquiring or expanding their own dedicated feed and hatchery sourcing capacity to reduce dependence on open-market material purchasing, trading some flexibility for supply certainty and cost predictability across their production network overall. Smaller regional farmers without comparable sourcing scale remain more exposed to material cost volatility during periods of tight global market availability.

Portfolio Architecture for Margin Defence

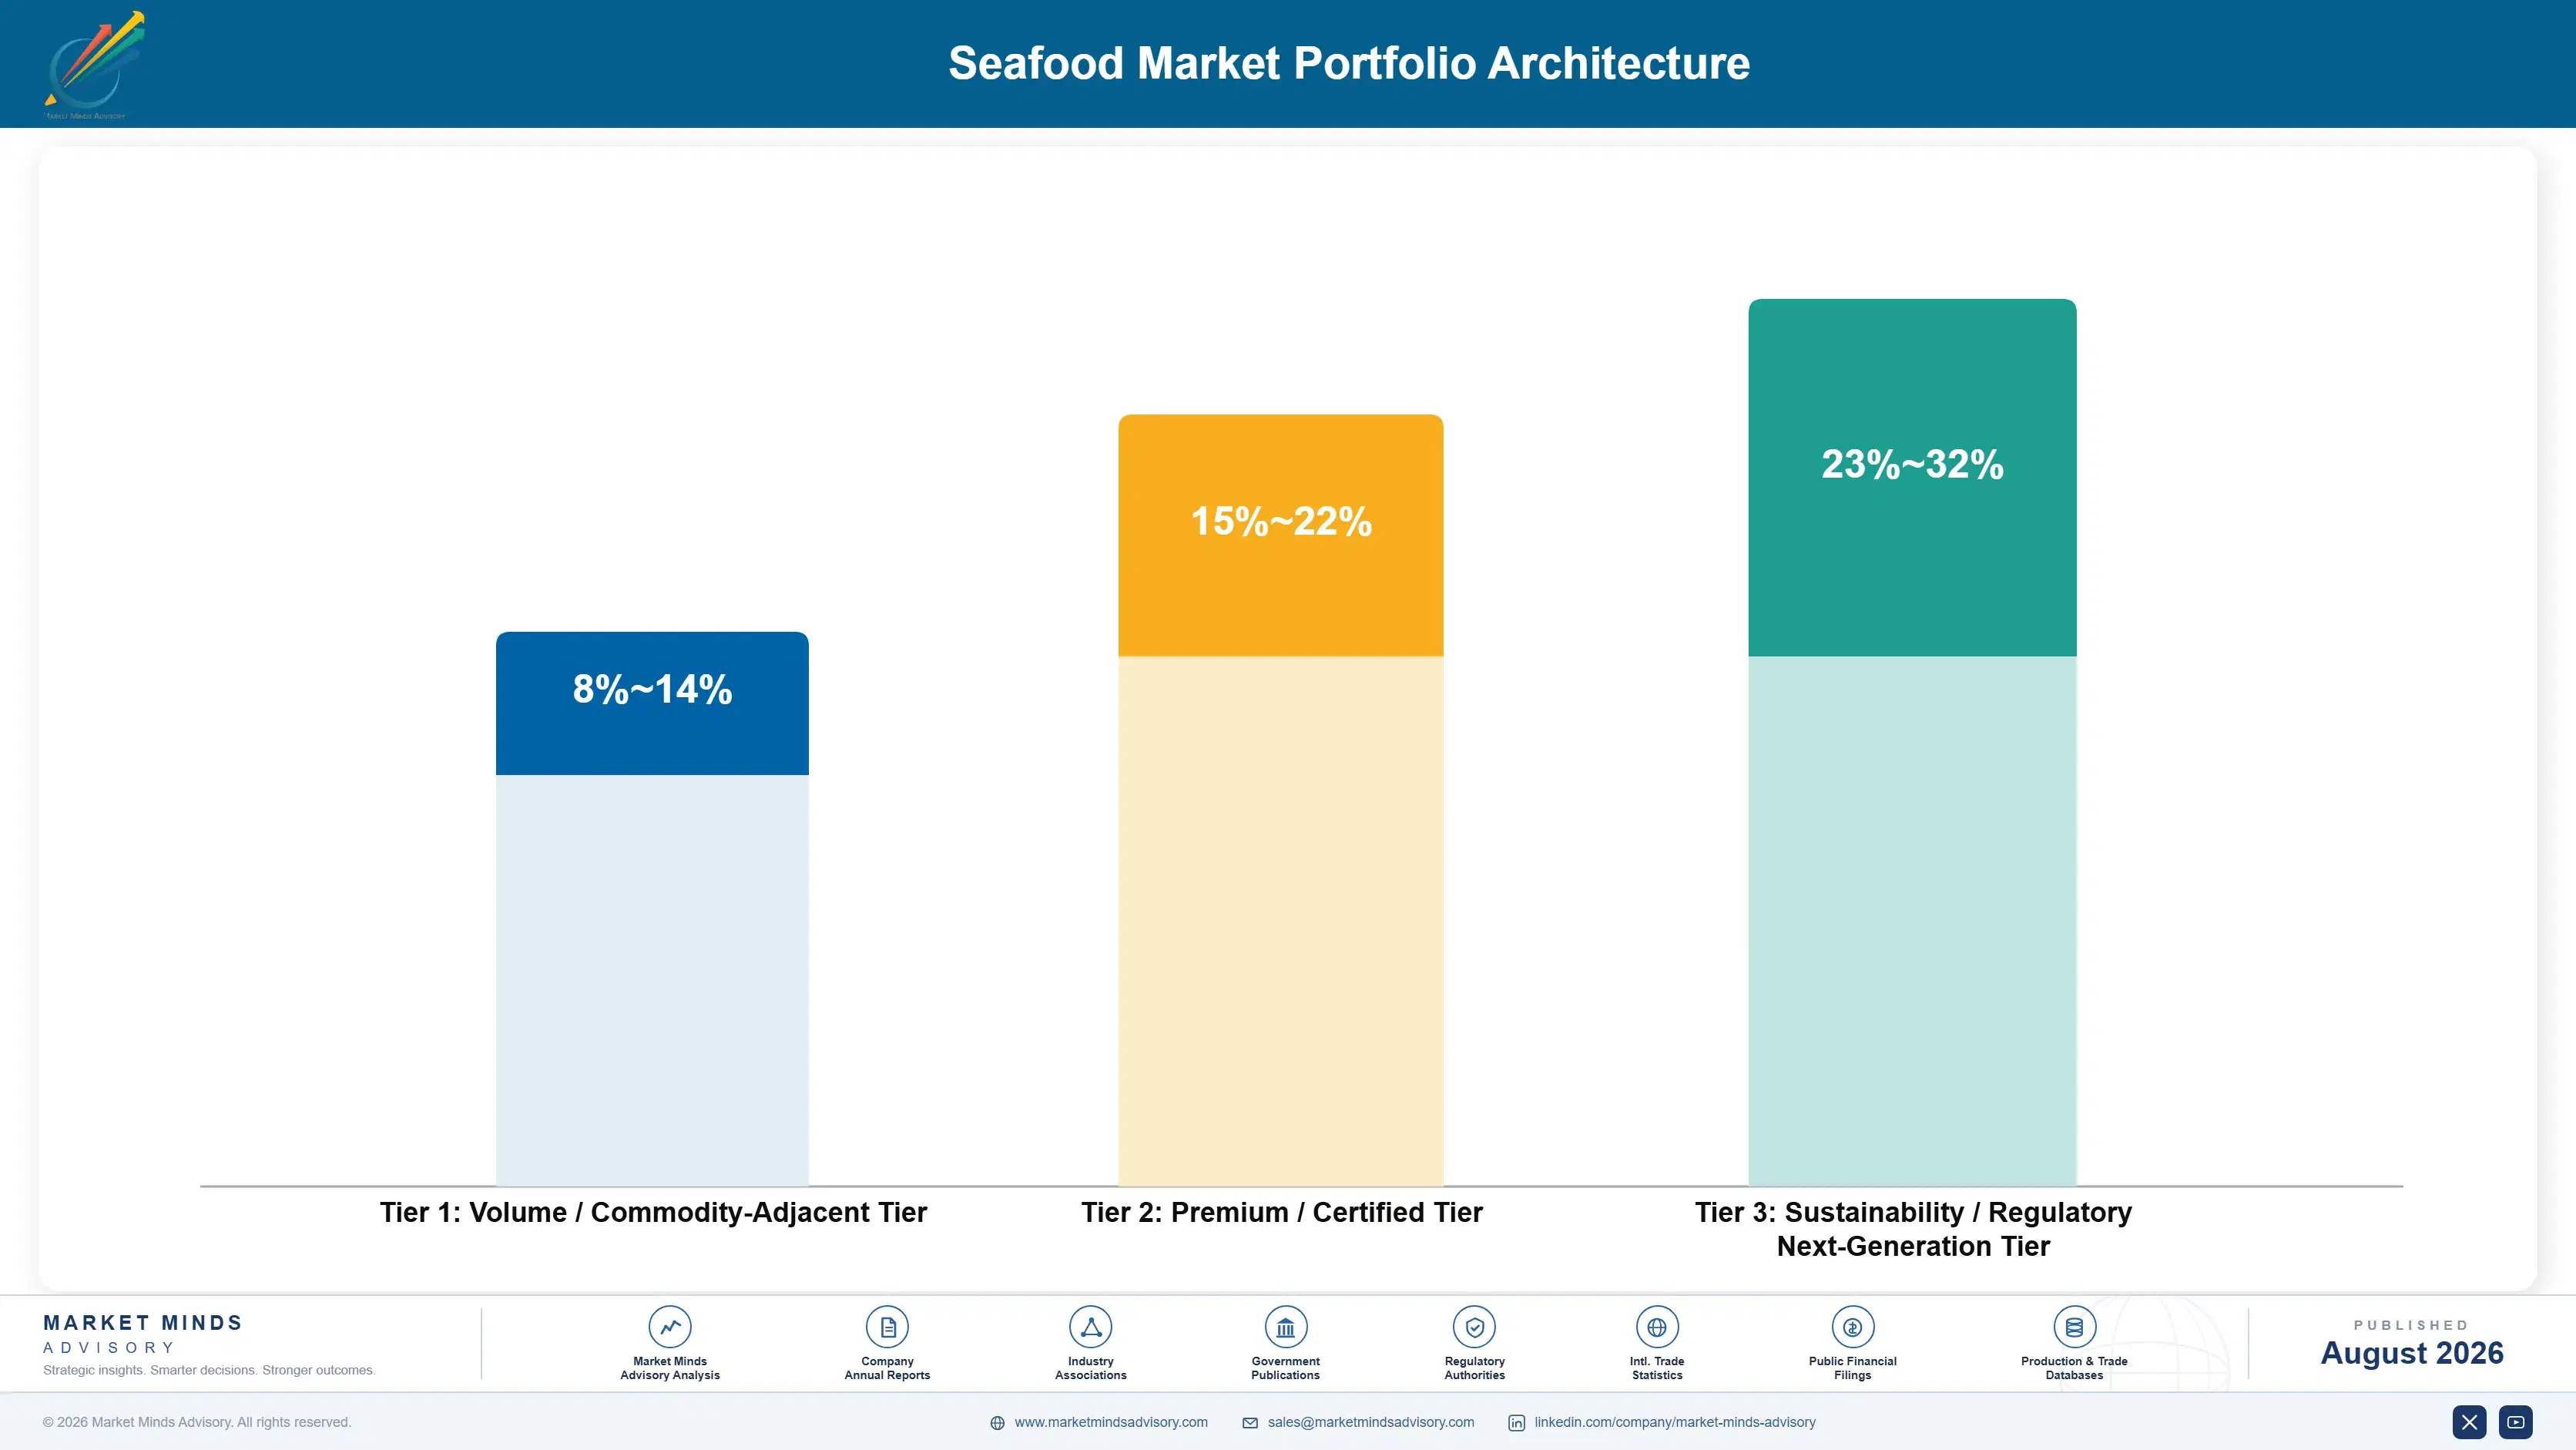
Seafood suppliers operate across three margin tiers built around species sophistication and certification depth rather than simple unit volume. Commodity-adjacent standard finfish and wild-catch formats sit at the volume base, certified aquaculture and premium shellfish systems occupy the middle at meaningfully firmer margins, and next-generation seaweed and specialty sustainable formats sit at the top, commanding premium pricing that few conventional suppliers can currently match. Most established suppliers participate across all three tiers, weighting investment toward whichever tier retail demand currently favours most.
The volume-premium tension plays out most visibly in how suppliers allocate scarce farming and R&D resources: every production cycle dedicated to a standard finfish format is a cycle not available for higher-margin seaweed and specialty development, so suppliers increasingly prioritise premium allocation even when it means directing standard customers toward longer lead times overall.

High-value margin pools concentrate in seaweed formats and certified premium shellfish systems, both of which command pricing closer to specialty sustainable food economics than to standard commodity seafood pricing. Suppliers that can move a retailer from conventional wild-catch supply into a certified aquaculture relationship capture meaningfully more of total account value across the life of the contract.

Volume / Commodity-Adjacent Tier

Standard finfish and wild-catch formats sold at scale into routine retail and foodservice applications, priced close to established commodity seafood benchmarks with limited technical differentiation between qualified suppliers competing mainly on service and delivery speed.
Gross Margin: 8-14%

Premium / Certified Tier

Certified aquaculture and premium shellfish systems requiring extensive traceability and quality validation investment, commanding a defensible premium given the technical investment behind each qualified system. Buyers weigh compliance documentation and sustainability performance heavily.
Gross Margin: 15-22%

Sustainability / Regulatory / Next-Generation Tier

Next-generation seaweed and specialty sustainable formats carrying the deepest cultivation and certification investment, sold primarily into retailers' highest-visibility premium product launches. Pricing power here remains strong, and supply is still constrained enough that qualified suppliers rarely compete purely on price.
Gross Margin: 23-32%
seafood-market-report-trends-forecasts-portfolio-architecture-1787334877101

High-value Sub-segments and Strategic Watch-out

Seaweed and Specialty Sustainable Formats

Seaweed and specialty sustainable formats carry the category's highest margins and fastest growth, driven by retail buyers seeking documented sustainability outcomes beyond what standard finfish can provide alone. Early movers here are capturing outsized specification share ahead of slower-moving generalist competitors industry-wide, and that lead looks increasingly durable.
Gross Margin: 23-32%

Sustainability Certification and Traceability Contracts

Sustainability certification and chain-of-custody documentation support service contracts carry strong margins and steady growth, anchored in multi-year relationships that renew predictably as retailers expand certified sourcing specification across additional product categories. Suppliers with proven certification platforms renew these agreements almost automatically over time each year.
Gross Margin: 15-22%

Standard Finfish and Wild-Catch Formats

Standard finfish and wild-catch formats remain the category's volume anchor, growing steadily with overall global protein demand but carrying commodity-level margins that make it a scale rather than profit driver for most suppliers. Suppliers defend this tier mainly to preserve distribution reach and long-term retail relationships worldwide.
Gross Margin: 8-14%

Regional Low-Cost Production Entrants

Specialized regional producers focused narrowly on standard finfish and wild-catch applications represent a long-term competitive threat to established diversified suppliers' pricing power, particularly as retail buyers increasingly favour lower-cost qualified regional producers over general-purpose multinational supply for large-scale commodity programmes worldwide, especially across price-sensitive categories.
Gross Margin: 6-12%

From Commodity Catch to Certified Asset

Seafood procurement is shifting from a fragmented commodity purchase toward a certification partnership that resembles an ongoing retail relationship more than a series of one-time transactions. Suppliers that embed traceability certification and sustainability substantiation support into standard supply agreements lock in renewal revenue, while retail procurement teams treat certified sustainable seafood as the starting assumption for new category planning rather than an alternative considered only after regulatory pressure forces the decision.
Adoption depth varies sharply by end-use vertical. Large premium grocery chains and sustainability-focused foodservice brands show the deepest reliance on certified aquaculture and seaweed formats, since claim consequences are most acute in categories facing direct sustainability reporting scrutiny. Standard mainstream retail applications show steadier, less certification-driven demand, since specification decisions there track cost and availability more than traceability documentation requirements specifically.

A generational shift among retail category managers is reinforcing the trend. Younger managers trained during the recent sustainability and traceability investment wave treat certified-first specification as standard practice, while veteran procurement staff accustomed to cost-driven commodity purchasing are adapting more slowly, defaulting to familiar wild-catch sourcing until forced by a competitive sustainability challenge or category relaunch cycle.
seafood-market-report-trends-forecasts-end-use-penetration-index-1787334877592

Where MMA Sees the Real Opportunity

These are among the four positions where our research anticipates prominent divergence between winners and laggards over the coming forecast period. Each is grounded in the demand model, the regulatory perimeter, and the announced capacity pipeline.
01 / TRACEABILITY CERTIFICATION INVESTMENT

Build certification capability ahead of demand

Suppliers that build comprehensive chain-of-custody and sustainability certification capability now are positioned to capture new retail relationships meaningfully faster than suppliers dependent entirely on unverified conventional formats competing for the same certification-driven purchasing decisions across every major consumer market. This positioning matters more than competing purely on unit pricing, since certification capability, not raw production scale alone, increasingly determines which supplier wins large retail contracts. MMA recommends prioritising certification investment over incremental conventional capacity expansion in the current three-year window.
02 / FEED SUPPLY DEVELOPMENT

Build feed supply capability ahead of demand

Suppliers that build integrated long-term aquaculture feed supply agreement capability ahead of confirmed demand capture a disproportionate share of the cost stability that follows every fishmeal price cycle, since retailers rarely switch suppliers once a stable-cost relationship is validated against a specific production programme. Suppliers still relying on open-market feed purchasing are ceding margin protection to competitors already investing in supply capability. MMA views feed supply investment as the highest-return near-term opportunity available within the category over the next three years.
03 / SUSTAINABILITY SUBSTANTIATION SERVICES

Bundle certification support into every retail sale

Suppliers that bundle sustainability substantiation and chain-of-custody documentation support into every retail sale capture deeper account penetration and higher switching costs than product-only competitors, providing a durable differentiation advantage that pure product suppliers cannot easily replicate. Suppliers concentrated purely in product sales face meaningfully more price-competitive dynamics than certification-focused competitors carrying broader account value and considerably stronger renewal terms overall. MMA recommends building or acquiring certification capability as a durable differentiation strategy for suppliers currently overexposed to product-only competition today.
04 / SHARED COLD CHAIN ACCESS

Build shared cold chain capacity access now

Regional producers managing budget-constrained expansion timelines increasingly require guaranteed cold chain and processing capacity access, and suppliers with established shared access capability face a genuinely lower-risk competitive position than competitors relying purely on fully independent cold chain investment requirements. Competitors that moved early on shared access investment are capturing differentiated, multi-year export contract advantages years ahead of suppliers still exposed to independent-investment adoption risk today. MMA recommends prioritising shared access investment as a durable, capital-efficient differentiation strategy available to suppliers of every size.

Engagement Snapshot From the Field

A live engagement with an industry participant carrying material or product regulatory and market exposure ahead of a defining policy shift, showing how our research translates into a defensible multi-year portfolio strategy.
MARKET MINDS ADVISORY · CLIENT ENGAGEMENT SUMMARY
Seafood Producer Strategic Portfolio Review and Transition Roadmap 2026·Investment Scenario on Seafood Exposure Evaluation 2025-26
CLIENT PROFILE
The client is a mid-sized regional premium grocery retail chain operating multiple seafood counters across a single national market, facing rising customer demand for certified sustainable seafood without a coordinated supplier transition strategy. The retailer reported annual seafood procurement spending in the low hundreds of millions of dollars (client-reported, unverified by MMA) and had relied predominantly on conventional wild-catch sourcing without a systematic traceability certification programme.
STRATEGIC CHALLENGE
The retailer faced growing customer pressure to convert seafood counters to certified sustainable sourcing across multiple species categories simultaneously, but limited procurement budget meant a phased supplier transition was unavoidable, requiring a defensible framework for prioritising which categories to convert first. Management needed a strategy that balanced customer sustainability expectations, conversion cost, and supply reliability across a multi-year sourcing modernization programme.
MMA APPROACH
MMA's engagement team benchmarked available seafood suppliers against the retailer's category-specific sales volumes and customer sustainability survey data, interviewed suppliers to assess certification track record, and modelled conversion cost and sustainability impact across three prioritisation scenarios. The team recommended a phased conversion that prioritised the retailer's highest-volume species categories first while securing supplier certification commitments ahead of the next seasonal relaunch.
KEY FINDINGS
  1. Two of the retailer's species categories accounted for a disproportionate share of total customer sustainability inquiries (client-reported, unverified by MMA), making them clear priorities for certification conversion investment.
  2. Suppliers offering integrated traceability support delivered meaningfully faster conversion timelines than suppliers expecting the retailer to manage chain-of-custody documentation independently during the transition process.
  3. Certified sustainable seafood costs for the retailer's highest-volume category exceeded initial budgeting assumptions the planning team had used by a wider margin than anticipated.
  4. Early supplier engagement during the conversion process reduced total sourcing modernization cost compared with the retailer's historical practice of finalising specifications before requesting supplier quotes.
CLIENT PROFILE
The client is a mid-sized regional premium grocery retail chain operating multiple seafood counters across a single national market, facing rising customer demand for certified sustainable seafood without a coordinated supplier transition strategy. The retailer reported annual seafood procurement spending in the low hundreds of millions of dollars (client-reported, unverified by MMA) and had relied predominantly on conventional wild-catch sourcing without a systematic traceability certification programme.
STRATEGIC CHALLENGE
The retailer faced growing customer pressure to convert seafood counters to certified sustainable sourcing across multiple species categories simultaneously, but limited procurement budget meant a phased supplier transition was unavoidable, requiring a defensible framework for prioritising which categories to convert first. Management needed a strategy that balanced customer sustainability expectations, conversion cost, and supply reliability across a multi-year sourcing modernization programme.
MMA APPROACH
MMA's engagement team benchmarked available seafood suppliers against the retailer's category-specific sales volumes and customer sustainability survey data, interviewed suppliers to assess certification track record, and modelled conversion cost and sustainability impact across three prioritisation scenarios. The team recommended a phased conversion that prioritised the retailer's highest-volume species categories first while securing supplier certification commitments ahead of the next seasonal relaunch.
KEY FINDINGS
  1. Two of the retailer's species categories accounted for a disproportionate share of total customer sustainability inquiries (client-reported, unverified by MMA), making them clear priorities for certification conversion investment.
  2. Suppliers offering integrated traceability support delivered meaningfully faster conversion timelines than suppliers expecting the retailer to manage chain-of-custody documentation independently during the transition process.
  3. Certified sustainable seafood costs for the retailer's highest-volume category exceeded initial budgeting assumptions the planning team had used by a wider margin than anticipated.
  4. Early supplier engagement during the conversion process reduced total sourcing modernization cost compared with the retailer's historical practice of finalising specifications before requesting supplier quotes.
RECOMMENDED STRATEGY
Phase 1: Phase 1 (Months 1 to 6): Convert the two highest-volume species categories to certified sustainable sourcing immediately, securing early customer trust recognition. Phase 2: Phase 2 (Months 7 to 15): Secure certification commitments and convert the remaining species categories, sequencing by volume and budget availability. Phase 3: Phase 3 (Months 16 to 20): Complete chain-wide conversion and consolidate all supplier relationships across the retailer's full seafood portfolio.
OUTCOME
Following the engagement, the client reported a meaningful increase in customer sustainability perception and improved regulatory compliance standing across its converted categories, avoiding the reputational risk it had initially feared (client-reported, unverified by MMA). The phased transition reduced total conversion cost relative to the retailer's budget.

Frequently Asked Questions

Foundational context covering the market sizes, CAGR, scope, country, region and competition that inform every finding below. This section is provided to cover basics and most often pre-purchase conversations, answered from the MMA Primary Research Dataset.

What is the current size of the Seafood Market?

The global market reached approximately $277.2 billion in 2026. Demand is concentrated in finfish and shrimp production, with seaweed and algae-based seafood products emerging as the fastest-growing category.

How large will the Seafood Market be by 2036?

MMA projects the market will reach approximately $434.6 billion by 2036. That represents roughly a 1.57 times increase over 2026 revenue across the ten-year forecast period.

What is the CAGR for the Seafood Market 2026 to 2036?

The base case compound annual growth rate is 4.6 percent. Bull and bear scenarios range from roughly 3.4 percent to 5.8 percent depending on aquaculture capacity expansion and certification pace.

Which segment is growing fastest?

Seaweed and algae-based seafood products are growing fastest, at roughly 1.87 times the overall market rate. Rising sustainability positioning and alternative protein demand are the primary drivers behind that outperformance.

Who are the major companies in the Seafood Market?

Five global suppliers, led by Mowi ASA, Thai Union Group PCL, and Nissui Corporation, lead the market. Together the top five hold roughly 24 percent of global seafood revenue.

Which country is growing fastest?

Vietnam is among the fastest-growing markets, driven by rapid shrimp farming expansion and growing aquaculture export investment. Its seafood demand is expanding at roughly 7.8 percent annually.

Report Segmentation Architecture

The full report scope spans multiple orthogonal segmentation dimensions, with cross-tabulated demand data provided for each dimension pair. Coverage extends further to regional breakdowns, trend trajectories, and the competitive detail needed to support segment-level decision-making.

By Species Category

  • Finfish
  • Shrimp and Prawns
  • Crab and Lobster
  • Bivalve Mollusks
  • Cephalopods
  • Seaweed and Algae-Based Seafood Products

By End-Use Industry

  • Retail Grocery Chains
  • Foodservice and Restaurant Channels
  • Export and Wholesale Distribution
  • Processed Food Manufacturers

By Commercial Dimension

  • Direct Producer-to-Retailer Sales
  • Export and International Trade Channels
  • Sustainability Certification and Traceability Services
  • Foodservice Distribution Channel Sales

By Region

  • North America
  • Western Europe
  • East Asia
  • South Asia and Pacific
  • Latin America
  • Middle East and Africa
  • Eastern Europe

Scope, Methodology, and Coverage

Every figure in this report is reproducible from documented input assumptions. The scope below maps the historical period, the forecast horizon, the segmentation dimensions, and the countries covered, alongside the underlying primary and qualitative methodology.
Historical Period
2020 to 2025
Forecast Period
2026 to 2036
Base Year
2025 (USD billions; MMA Primary Research Dataset, August 2026)
Market Definition
The seafood market covers wild-caught and farmed seafood products including finfish, shrimp and prawns, crab and lobster, bivalve mollusks, cephalopods, and seaweed and algae-based seafood, sold in fresh, frozen, and processed forms through retail, foodservice, and export channels. It excludes ornamental and aquarium fish, fishmeal and fish oil sold purely as animal feed ingredients, and non-food marine byproducts.
Quantitative Units
USD billions (current prices); annual metric ton volume where applicable
Segmentation Dimensions
By Species Category; By End-Use Industry; By Commercial Dimension; By Region
Regions Covered
North America, Western Europe, East Asia, South Asia and Pacific, Latin America, Middle East and Africa, Eastern Europe
Countries Covered
China, Japan, South Korea, Taiwan, Vietnam, Indonesia, Thailand, Australia, India, USA, Canada, Mexico, Norway, United Kingdom, Spain, France, Netherlands, Chile, Ecuador, Peru, Brazil, Argentina, Saudi Arabia, UAE, Morocco, South Africa, Poland, Czech Republic, Hungary, Romania, and additional markets relevant to this sector
Key Companies Profiled
Mowi ASA, Thai Union Group PCL, Nissui Corporation, Cermaq Group AS, Maruha Nichiro Corporation, Leroy Seafood Group ASA, SalMar ASA, Bakkafrost P/F, Cooke Inc, High Liner Foods Incorporated, American Seafoods Group LLC, Pacific Seafood Group, Austevoll Seafood ASA, Grieg Seafood ASA, Cargill Aqua Nutrition, Charoen Pokphand Foods PCL, Minh Phu Seafood Corporation, Nomad Foods Limited, Iglo Group, Trident Seafoods Corporation
Quantitative Methodology
Primary survey, n=3,800 respondents, Q4 2025, six countries; demand-side model with trade association cross-validation
Qualitative Methodology
47 expert interviews, Q4 2025; applied to validate demand model assumptions, identify emerging dynamics, and assess competitive positioning
Report Format
PDF and XLSX data workbook (Word format preview document)
Publisher
Market Minds Advisory
Report Code
MMA-2026-AGR-286
Published
August 2026
Contact
sales@marketmindsadvisory.com | www.marketmindsadvisory.com

Purchase the full Seafood Market Report (2026 to 2036).

The full report delivers a complete quantitative and qualitative assessment of the global seafood market across all seven regions. It includes detailed country-level sizing for the fifteen largest producing and consuming markets, full profiles of all twenty companies named in the competitive landscape, and a complete database of corporate developments tracked over the trailing eighteen months. Analysts provide segment-by-segment margin benchmarking derived from primary interviews with forty-seven aquaculture and seafood sourcing experts, alongside a sustainability certification and traceability regulatory tracker covering major jurisdictions. Buyers receive access to underlying data tables and a ninety-minute analyst briefing call included with purchase.
Country-level sizing for fifteen major producing and consuming markets
Full profiles of all twenty companies profiled
Sustainability certification and traceability regulatory tracker across major jurisdictions
Segment-level margin benchmarking from primary expert interviews
Eighteen-month corporate development and aquaculture capacity database
Ninety-minute analyst briefing call included with purchase

Built For The People Who Decide

From boardroom strategy to bench-side execution, this report is read cover-to-cover by leaders shaping the next decade of their industry, turning demand scenarios, market dynamics and valuation benchmarks into decisions.
CXOs/ Presidents/ VPs/ Managers
M&A and Corporate Development
Strategy Teams and R&D Heads
Procurement and Product Directors
Regulatory and Compliance Leaders
Investor Relations and Equity Analysts