Market Minds Advisory
Seafood Flavors Market

Seafood Flavors Market: Seafood Flavors Market. Noodle and Snack Seasoning, Allergen Rules, and Plant-Based Substitutes Shape Flavor House Returns.

Seafood flavors turn on Asian instant noodle and snack seasoning volumes, shellfish and fish allergen labelling, price swings for shrimp and fish by-products, sodium reduction targets, and flavor houses moving toward fermentation-derived and plant-based seafood-free

Lead Analyst

Published

September 2026

Make Smarter Decisions with Customized Research Insights

Request a free sample report and evaluate market opportunities, growth trends, and competitive dynamics relevant to your business needs.

2025 MARKET VALUE$1.8BMarket Size 2025
2036 FORECAST VALUE$3.4BBase Case , 2026 to 2036
CAGR 2026 TO 20366.0 %Bull 7.2% / Bear 4.8%
INCREMENTAL OPPORTUNITY$1.5BNet 10- year value creation
EXPANSION MULTIPLE1.79x2036 value over 2026 base
Strategic Levers
M&A Pipeline
Regional Outlook
Country Rankings
Competitive Intelligence
Segmental Deep-dive
Call-Us : 91 93563 13602

Executive Snapshot and Market Trajectory.

Seafood flavors give noodles, snacks, soups, sauces and seasonings the taste of shrimp, crab, fish, oyster and kelp, made from extracts, hydrolysates, reaction flavors, fermentation or plant-based systems. Value depends on raw material cost, allergen rules, sodium goals and how well flavor houses support recipe development.
Plant-Based and Seafood-Free Flavor Systems grows fastest as vegan seafood analog makers, allergen-conscious brands and sustainability programmes seek seafood taste without seafood raw material, while natural extracts and reaction flavors still carry the volume. East Asia holds the largest share because Chinese, Japanese and Korean noodle, snack and seasoning production sits in the region, and South Asia and Pacific follows on Indonesian, Thai and Indian demand.
Competition is concentrated in global flavor houses: a Swiss flavor and fragrance group, a Dutch-Swiss nutrition and flavor company, an American flavor and ingredients group, a German flavor group and an Irish taste and nutrition group lead, measured here on estimated seafood flavor sales volume. Buyers judge taste fidelity, allergen control and application support, and creation capability shapes margin more than price does. Buyers review suppliers every season. Supply contracts decide renewal too.
Market Definition
The market covers global sales of seafood flavors valued at producer level, including natural extracts and concentrates, enzyme-hydrolysed seafood flavors, reaction and process flavors, fermentation-derived seafood flavors, and plant-based and seafood-free flavor systems, sold to noodle, snack, soup, sauce and seasoning makers. The scope excludes finished fish sauce and oyster sauce condiments, fish protein hydrolysates for nutrition, and non-seafood savoury flavors.
Base Year Value
$1.8B in 2025 (MMA Primary Research Dataset, September 2026)
Forecast Period
2026 to 2036, eleven discrete annual values
CAGR
6.0% base case. Bull 7.2%. Bear 4.8%.
Fastest Growth Segment
Plant-Based and Seafood-Free Flavor Systems: 8.4% CAGR
Fastest Growth Country
Indonesia: 8.6% CAGR
Fastest Growth Region
South Asia and Pacific: 8.0% CAGR
Largest Region
East Asia: 38% of 2025 global value
Market Leaders
Givaudan, dsm-firmenich, IFF, Symrise, Kerry Group. Source: MMA Analysis, company annual reports.
Primary Survey
n=3,800 procurement and R&D decision-makers, Q4 2025, six countries
Methodology
Demand-side build-up, cross-validated against public data, 47 expert interviews

Seafood Flavors Market Forecast Scenarios

seafood-flavours-market-size-forecast-scenario-1789932309162
Between 2020 and 2025, seafood flavor value grew as instant noodle and snack volumes rose in the pandemic, Asian seasoning launches multiplied and brand owners widened savoury ranges. Shrimp and fish by-product prices swung, flavor houses passed costs on unevenly, and plant-based and fermentation-derived systems gained briefs while natural extracts held steady. Delivery reliability decides supplier rankings. Margins follow process discipline.
The base case rests on three commercial mechanisms. First, Asian noodle, snack and seasoning volumes keep growing with rising incomes. Second, sodium reduction and clean label programmes raise demand for umami-rich natural flavors. Third, allergen and sustainability concerns push brand owners toward seafood-free systems. Flavor houses plan creation capacity, raw material contracts and application support around these three drivers. Audit records protect future sales. Cost control separates leaders from followers. Clear specifications build buyer trust.
The bull case needs faster vegan seafood analog launches and easing raw material prices, which would lift volume and ease margins. The bear case is a spike in shrimp and fish by-product prices combined with tighter allergen labelling, which would squeeze margins and slow shellfish-derived flavors. Small flavor houses feel every price swing. Scale compounds over time.

Seasoning Volumes, Allergen Rules, and Plant-Based Systems Set Seafood Flavor Outcomes

Flavor houses extract or hydrolyse shrimp, crab, fish and oyster raw materials, react them with amino acids and sugars, ferment them, or build plant-based profiles, then blend them into powders and liquids. Raw materials take 30% to 40% of cost, and noodles, snacks and seasonings take about 41% of volume. Raw material price, taste fidelity and application support therefore set returns. Audits repeat every year.
MARKET CONCENTRATION44% CR5Top five flavor houses hold a substantial combined share
RAW MATERIAL COST SHARE30-40%Portion of flavor cost taken by seafood extracts and shells
TOP CONSUMING COUNTRYChina 31%Largest national source of total seafood flavor demand
USAGE LEVEL0.1-2%Typical flavor dose as share of finished food weight
NOODLE AND SNACK SHARE41%Portion of volume sold into noodles, snacks and seasonings
BRIEF-TO-LAUNCH TIME6-12 monthsTypical time from customer brief to commercial supply
Taste fidelity, umami depth, allergen status, sodium contribution, shelf stability and price decide value. Noodle makers test taste in soup base, snack makers test adhesion on seasoning, sauce makers test heat stability, and regulators check labelling. Givaudan wins on creation breadth, dsm-firmenich wins on savoury technology, and IFF wins on application reach. Briefs move orders slowly. Buyers review suppliers every season. Supply contracts decide renewal.
Buyers judge seafood flavors on taste, allergen documentation, price, consistency and supply reliability. Noodle makers want stable batches, snack makers want strong seasoning adhesion, brand owners want clean labels, and vegan brands want convincing seafood notes. Price sensitivity is moderate. Trials and panels decide shortlists, and most programmes need many months before first orders. Delivery reliability decides supplier rankings. Margins follow process discipline.
"Nobody buys seafood flavor for the seafood. They buy it for the bowl of noodles that tastes like the sea at a price of a packet. The flavor houses that reproduce that taste without a shrimp in the plant will win the next decade, and the rest will be arguing about shell prices."
Senior Analyst, Food Ingredients and Flavors Practice · MMA Seafood Flavors Practice · September 2026

Market Trends

Plant-Based Seafood Analogs Open Allergen-Free Flavor Systems Demand

Vegan seafood analog makers and allergen-conscious brands buy flavors that recreate shrimp, crab and fish notes without shellfish or fish raw material, and flavor houses invest in plant-based and yeast-derived building blocks to serve them. Plant-Based and Seafood-Free Flavor Systems grows about 8.4% a year, and gross margins run 34% to 48% against 22% to 30% for natural extracts. The trend needs creation skill, pilot plants and brand partnerships. Audit records protect future sales. Cost control separates leaders from followers. Clear specifications build buyer trust. Small flavor houses feel every price swing.
Market Impact: instant noodles exceed 100 billion servings

Fermentation-Derived Flavors Meet Clean Label and Umami Depth Demand

Brand owners want clean label umami depth and consistent quality, and flavor houses use fermentation of fish by-products, yeast and koji to build complex savoury notes that natural extracts cannot match at stable cost. Fermentation-Derived Seafood Flavors grows about 7.2% a year. The trend needs fermentation capacity, process knowledge and application support, and it rewards houses with long relationships with noodle, sauce and soup makers. Scale compounds over time. Audits repeat every year. Buyers review suppliers every season. Supply contracts decide renewal. Delivery reliability decides supplier rankings. Margins follow process discipline. Audit records protect future sales.
Market Impact: sodium cuts of 20-30% targeted

Market Opportunities and Growth Drivers

Instant Noodle and Snack Seasoning Demand Anchors Asian Volumes

Instant noodles, seasoned snacks and soup bases carry seafood flavor in every pack, and Asian makers launch new shrimp, crab, seafood and kelp profiles each season to hold shelf space. Global instant noodle consumption exceeds 100 billion servings a year. The driver sustains firm volume and rewards flavor houses with regional creation teams, fast sampling and stable supply to large noodle makers. Cost control separates leaders from followers. Clear specifications build buyer trust. Small flavor houses feel every price swing. Scale compounds over time. Audits repeat every year. Buyers review suppliers every season.
Market Impact: EU allergen list covers 14 groups

Sodium Reduction Programmes Raise Demand for Umami-Rich Seafood Flavors

Health agencies and brand owners set sodium reduction targets, and umami-rich seafood extracts and fermentation flavors let makers cut salt while keeping taste. Reformulation programmes target sodium cuts of 20% to 30% in soups, snacks and noodles. The driver supports higher-value flavor sales and rewards flavor houses with sodium reduction toolkits, sensory panels and application support. Supply contracts decide renewal. Delivery reliability decides supplier rankings. Margins follow process discipline. Audit records protect future sales. Cost control separates leaders from followers. Clear specifications build buyer trust. Small flavor houses feel every price swing.
Market Impact: seafood extract costs rose 20%

Market Restraints and Challenges

Allergen Labelling Rules Limit Shellfish-Derived Flavor Use in Foods

European and other rules list crustaceans, molluscs and fish among labelled allergens, and buyers audit cross-contact controls. The root cause is the risk of severe allergic reactions. Flavor houses respond with dedicated lines, documentation and seafood-free systems, though allergen labels can deter brand owners and restrict use in child-focused and export products. Scale compounds over time. Audits repeat every year. Buyers review suppliers every season. Supply contracts decide renewal. Delivery reliability decides supplier rankings. Margins follow process discipline. Audit records protect future sales. Cost control separates leaders from followers. Clear specifications build buyer trust.
Market Impact: plant-based segment grows 8.4% yearly

Raw Material Price Swings and Sodium Concerns Squeeze Flavor Margins

Shrimp shells, fish by-products and yeast extracts swing in price with fishing and farming results, and seafood flavors carry sodium that regulators and buyers question. The root cause is concentrated raw material supply and health policy. Flavor houses respond with contracts and lower-sodium blends, though seafood extract costs rose about 20% in a year and buyers accept only part of the increase. Small flavor houses feel every price swing. Scale compounds over time. Audits repeat every year. Buyers review suppliers every season. Supply contracts decide renewal. Delivery reliability decides supplier rankings. Margins follow process discipline.
Market Impact: fermentation segment grows 7.2% yearly
3 additional market trends, 2 additional growth drivers, and 4 additional restraints and challenges are covered in the full report. Contact sales@marketmindsadvisory.com to access the complete intelligence.

Segment CAGR and Growth Architecture

The global seafood flavors market is segmented by flavor route, which shows where technology, allergen status and taste fidelity create pricing power in a concentrated market. Five segments cover natural extracts and concentrates, enzyme-hydrolysed flavors, reaction and process flavors, fermentation-derived flavors, and plant-based and seafood-free systems. Plant-based and fermentation-derived routes grow fastest as buyers seek allergen-free and clean
seafood-flavours-market-market-share-analysis-1789932309477

Plant-Based and Seafood-Free Flavor Systems

Plant-Based and Seafood-Free Flavor Systems is the fastest-growing segment at 8.4% a year, about 1.40 times the overall market rate, from a small base. Vegan seafood analog makers, allergen-conscious brands and sustainability programmes pay for seafood taste without seafood raw material, so gross margins of 34% to 48% against 22% to 30% for natural extracts support creation teams and pilot plants. Taste fidelity and brand trust are the main constraints. Flavor houses with proven profiles win. Audit records protect future sales. Cost control separates leaders from followers. Clear specifications build buyer trust. Small flavor houses feel every price swing. Scale compounds over time. Audits repeat every year. Buyers review suppliers every season.
CAGR 8.4%

Fermentation-Derived Seafood Flavors

Fermentation-Derived Seafood Flavors grows at 7.2% a year, about 1.20 times the overall market rate, because noodle, sauce and soup makers pay for clean label umami depth and consistent quality from fermented fish by-products, yeast and koji, and flavor houses accept gross margins of 30% to 42% for verified performance. Fermentation capacity and process knowledge shape entry. Houses with regional plants and application support hold price better than extract sellers. Supply contracts decide renewal. Delivery reliability decides supplier rankings. Margins follow process discipline. Audit records protect future sales. Cost control separates leaders from followers. Clear specifications build buyer trust. Small flavor houses feel every price swing. Scale compounds over time. Audits repeat every year.
CAGR 7.2%
Full segment breakdown across 5 segments available in the complete report.

Regional Architecture and Country Demand Map

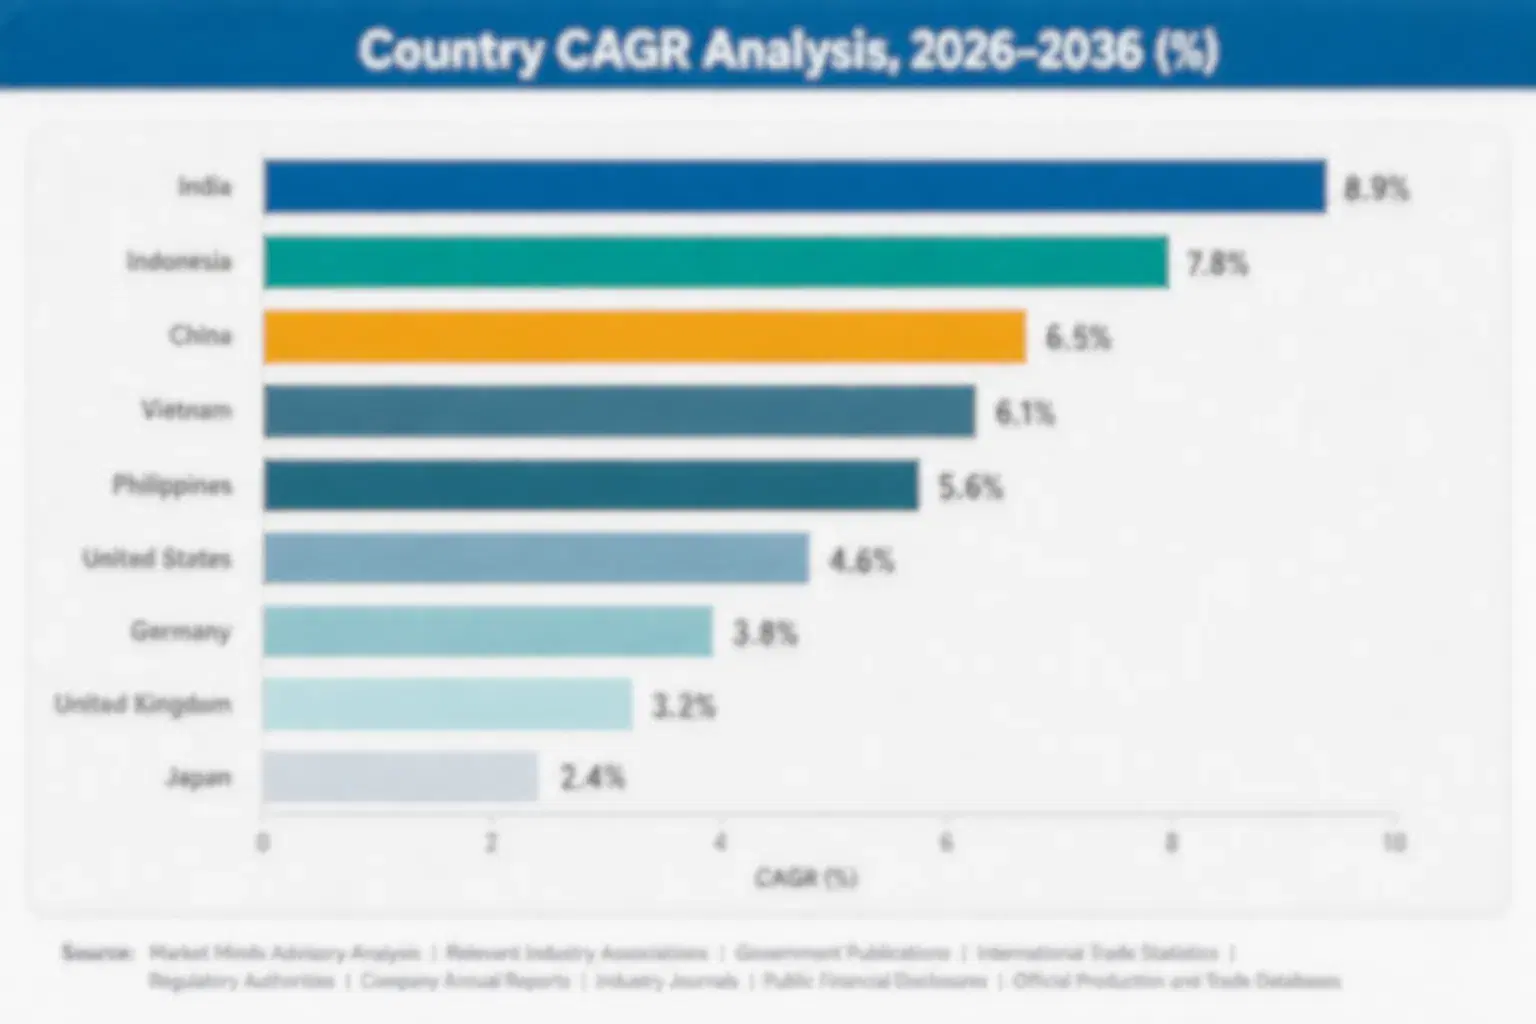
East Asia leads at 38% because Chinese, Japanese and Korean noodle, snack and seasoning production sits in the region, with South Asia and Pacific at 17% on Indonesian, Thai and Indian demand. South Asia and Pacific grows fastest as noodle and snack volumes expand. Buyers review suppliers every season.

East Asia

East Asia holds 38% share, above its 22% to 30% band, because China, Japan and South Korea combine the world's largest instant noodle, snack and seasoning production with deep seafood cooking traditions, and Takasago, Ajinomoto and Huabao supply local makers alongside global houses, which justifies the out-of-band share. Japanese dashi and Korean anchovy stock traditions keep natural extract demand deep, while Chinese hotpot and snack launches drive new profiles. Growth runs above the global rate. Local competition, additive rules and sodium goals restrain margins. Supply contracts decide renewal. Delivery reliability decides supplier rankings. Margins follow process discipline. Audit records protect future sales. Cost control separates leaders from followers. Clear specifications build buyer trust.
Share: 38% | CAGR: 7.0% (2026 to 2036)

South Asia and Pacific

South Asia and Pacific takes 17% share, above its 7% to 12% band, because Indonesia, Vietnam, Thailand, India and the Philippines make and eat large volumes of instant noodles, seasoned snacks and seafood-based seasonings, which justifies the out-of-band share. Regional noodle makers launch shrimp, anchovy and crab profiles each season, and Indian snack brands widen seafood-inspired seasoning. Growth exceeds the global rate. Price sensitivity, halal certification, import costs and local competition restrain margins. Small flavor houses feel every price swing. Scale compounds over time. Audits repeat every year. Buyers review suppliers every season. Supply contracts decide renewal. Delivery reliability decides supplier rankings. Margins follow process discipline. Audit records protect future sales. Cost control separates leaders from followers.
Share: 17% | CAGR: 8.0% (2026 to 2036)
Regional intelligence for 5 additional markets available in the complete report: North America, Western Europe, Latin America, Middle East and Africa, Eastern Europe. Contact sales@marketmindsadvisory.com.
seafood-flavours-market-country-cagr-analysis-1789932309791

Four Margin Routes for Seafood Flavor Houses

Margin in seafood flavors comes from plant-based and fermentation-derived systems, secured raw material supply, application support and allergen-controlled production rather than plain extract volume. The routes below apply to flavor houses, ingredient suppliers and contract producers, and each can start inside one planning cycle, with clear measures in gross margin points, raw material swings and qualified accounts.

Shifting Volume Into Plant-Based and Fermentation-Derived Flavor Systems

Plant-based and fermentation-derived systems earn gross margins of 30% to 48% against 22% to 30% for natural extracts, so flavor houses that add fermentation capacity and creation teams to shift 10% of volume into these systems report gross margin gains of three to five points on the mix. Conversion programmes cost $15 million to $60 million. Pilots with five brand owners confirm demand. Scale compounds over time. Audits repeat every year. Buyers review suppliers every season. Supply contracts decide renewal. Delivery reliability decides supplier rankings. Margins follow process discipline. Audit records protect future sales.
Market Impact: premium route mix shift lifts gross margin by 3-5 points

Securing Shell and Fish Extract Supply Through Multi-Year Contracts

Raw materials take 30% to 40% of cost and seafood extract prices rose about 20% in a year, so flavor houses that sign multi-year contracts, add second sources and hold inventory cover cut raw material swings by 8% to 14% each year. Programmes cost $5 million to $20 million. Flavor houses should start with the Chinese and Southeast Asian suppliers already supplying the largest volumes. Cost control separates leaders from followers. Clear specifications build buyer trust. Small flavor houses feel every price swing. Scale compounds over time. Audits repeat every year. Buyers review suppliers every season.
Market Impact: multi-year contracts cut raw material swings by 8-14% annually

Cutting Sodium and Cost Through Application Support for Noodle Makers

Noodle and snack makers write seasoning specifications into every recipe and sodium targets are tightening, so flavor houses that invest in application laboratories, sodium reduction toolkits and sensory panels lift qualified accounts by 12% to 20% each year. Programmes cost $4 million to $15 million. Flavor houses should target Chinese, Japanese and Southeast Asian noodle makers first, where volumes justify support. Supply contracts decide renewal. Delivery reliability decides supplier rankings. Margins follow process discipline. Audit records protect future sales. Cost control separates leaders from followers. Clear specifications build buyer trust. Small flavor houses feel every price swing.
Market Impact: application programmes lift qualified noodle accounts by 12-20% annually

Building Allergen-Controlled Plants and Documentation for Global Buyers

Allergen labelling rules and buyer audits punish weak cross-contact controls, so flavor houses that invest in dedicated lines, allergen documentation and audit readiness cut audit failures by 30% to 50% each year and protect listings worth 5% to 10% of sales. Programmes cost $3 million to $12 million. Flavor houses should start with plants serving multinational brand owners. Scale compounds over time. Audits repeat every year. Buyers review suppliers every season. Supply contracts decide renewal. Delivery reliability decides supplier rankings. Margins follow process discipline. Audit records protect future sales. Cost control separates leaders from followers.
Market Impact: allergen documentation cuts audit failures by 30-50% annually

Who Controls the Margin Pool

The global seafood flavors market is concentrated, with a CR5 of 44%, and a long tail of regional flavor houses and specialty suppliers sits outside the leading five. This assessment measures participants on estimated seafood flavor sales volume, held constant across all players. Givaudan leads through creation breadth, while dsm-firmenich, IFF, Symrise and Kerry Group follow, with a modest gap between the leader and the challengers.
Competition runs on four dimensions today: creation capability and taste fidelity, raw material access and cost, allergen control and documentation, and application support for noodle, snack and sauce makers. Global houses win on breadth and qualification, Japanese houses win on savoury depth, and Chinese houses win on cost. Imitators copy plain extracts quickly, so premiums outside fermentation-derived and plant-based systems erode within a season. Clear specifications build buyer trust.

Emerging pressure comes from vegan seafood analog makers that demand seafood-free profiles, Chinese flavor houses that cut prices, and allergen and sodium rules that reshuffle approved supplier lists. Rankings shift where a flavor house wins a noodle programme, launches a convincing plant-based profile or secures raw material through long contracts. Challengers can move up quickly when rivals face supply shocks.
seafood-flavours-market-company-positioning-matrix-1789932310103

Competitive Moat and Risk Dimensions

GIVAUDAN

Moat: Creation Breadth and Reach

Givaudan, a Swiss flavor and fragrance group, creates savoury and seafood flavors for noodle, snack, soup and sauce makers through regional creation centres, application laboratories and long relationships with global brand owners. Its creation breadth, regional reach and application support give it a market advantage, and its position supports stable briefs and long supply agreements with multinational and
GIVAUDAN

Risk: Price Pressure From Regional Rivals

Givaudan faces price pressure from Asian flavor houses and brand owner cost programmes, so margins can narrow. Houses with lower-cost seafood profiles can win regional noodle accounts. Small flavor houses feel every price swing. Scale compounds over time. Audits repeat every year. Buyers review suppliers every season.
DSM-FIRMENICH

Moat: Savoury and Fermentation Technology

dsm-firmenich, a Dutch-Swiss nutrition and flavor company, combines savoury flavor creation with yeast, fermentation and taste technology and supplies seafood-type and umami systems to noodle, snack and sauce makers. Its fermentation capability, savoury expertise and plant-based building blocks give it a cost and quality advantage, and its position supports competitive pricing and long supply agreements with brand owners.
DSM-FIRMENICH

Risk: Integration and Focus Risk

dsm-firmenich must integrate a broad portfolio and keep flavor customers close, so service gaps can cost briefs. Houses with sharper regional teams can win noodle programmes. Supply contracts decide renewal. Delivery reliability decides supplier rankings. Margins follow process discipline. Audit records protect future sales. Cost control separates leaders from followers.

Players Tracked

Prominent Players

Givaudan
dsm-firmenich
IFF
Symrise
Kerry Group

Other Key Players

Sensient Technologies
Takasago International
Mane
Ajinomoto
Kikkoman
Huabao International
Synergy Flavors
Bell Flavors and Fragrances
Blue Pacific Flavors
Prinova Group
Innova Flavors
Archer Daniels Midland
McCormick Flavor Solutions
Döhler
Nagase

Recent Developments

JANUARY 2026

Givaudan Expands Savoury Creation Centre Capacity in Asia for Noodle and Snack Makers

Givaudan expanded savoury creation centre capacity in Asia for noodle and snack makers, according to company communications. It is an organic capacity expansion, not an acquisition, and it tests regional demand. Investment terms were not disclosed. Clear specifications build buyer trust. Small flavor houses feel every price swing.
Signal: Suggests global flavor houses are adding regional creation capacity to win noodle and snack briefs from fast-moving Asian brand owners.
FEBRUARY 2026

dsm-firmenich Launches Plant-Based Seafood Flavor System for Vegan Analog Makers

dsm-firmenich launched a plant-based seafood flavor system for vegan analog makers, according to company communications. It is a product launch, not an acquisition, and it tests seafood-free demand. Sales terms were not disclosed. Scale compounds over time. Audits repeat every year. Buyers review suppliers every season.
Signal: Indicates leading houses see seafood-free profiles as a growth route as vegan analog makers seek allergen-free taste.
MARCH 2026

IFF Signs Multi-Year Fish and Shell Extract Supply Agreements With Asian Processors

IFF signed multi-year fish and shell extract supply agreements with Asian processors, according to company communications. It is a supply agreement, not a joint venture or acquisition, and it tests supply security. Terms were not disclosed. Supply contracts decide renewal. Delivery reliability decides supplier rankings. Margins follow process discipline.
Signal: Confirms flavor houses are locking in raw material supply through longer agreements to reduce price swings and protect margins.

What Drives Seafood Flavor Costs

Seafood extracts, shells and hydrolysates account for roughly 30% to 40% of flavor cost, yeast and amino acids about 12%, carriers and salt about 10%, energy for drying about 8%, and labour, testing and freight about 15%. Raw materials come from shrimp, crab and fish processing by-products in China, Vietnam, Thailand and Peru. Audits repeat every year. Buyers review suppliers every season.
The clearest recent shock came from raw material and yeast costs. The Givaudan Annual Report 2024 described higher raw material costs across savoury categories, and FAO seafood price data showed volatile shrimp and fish prices, so flavor houses raised prices by 6% to 12% and absorbed part of the increase. Supply contracts decide renewal. Delivery reliability decides supplier rankings. Margins follow process discipline. Audit records protect future sales.

The competitive disadvantage falls on small flavor houses without contracted supply, second sources or allergen-controlled plants, which cannot hold noodle and snack accounts through price spikes. Large houses buy at scale, run several plants and spread cost across many flavors. Exposure also varies by geography, since Asian houses sit near raw materials while European houses import. Cost control separates leaders from followers.
seafood-flavours-market-cost-volatility-analysis-1789932310403

Multi-Year Extract Contracts and Second Sources

Flavor houses sign multi-year contracts and qualify second sources in China, Vietnam and Peru. Contracts cut raw material swings by 8% to 14% each year. The main challenge is minimum volume commitments, so houses stage contracts with two suppliers first and keep spot access for flexibility in weak-demand quarters. Clear specifications build buyer trust. Scale compounds over time.

Plant-Based and Fermentation Routes Reduce Raw Material Exposure

Flavor houses build fermentation and plant-based routes that use yeast and plant inputs instead of shells. Programmes lift gross margin by three to five points on shifted volume. The main challenge is taste fidelity, so houses run panel tests early and keep natural extracts for buyers that value origin. Audits repeat every year. Buyers review suppliers every season.

Application Laboratories and Sodium Reduction Toolkits

Flavor houses build application laboratories and sodium reduction toolkits close to noodle and snack makers. Programmes lift qualified accounts by 12% to 20% each year. The main challenge is staffing, so houses train regional teams and share sensory data with customers to shorten development time. Supply contracts decide renewal. Delivery reliability decides supplier rankings. Margins follow process discipline.

Portfolio Architecture for Margin Defence

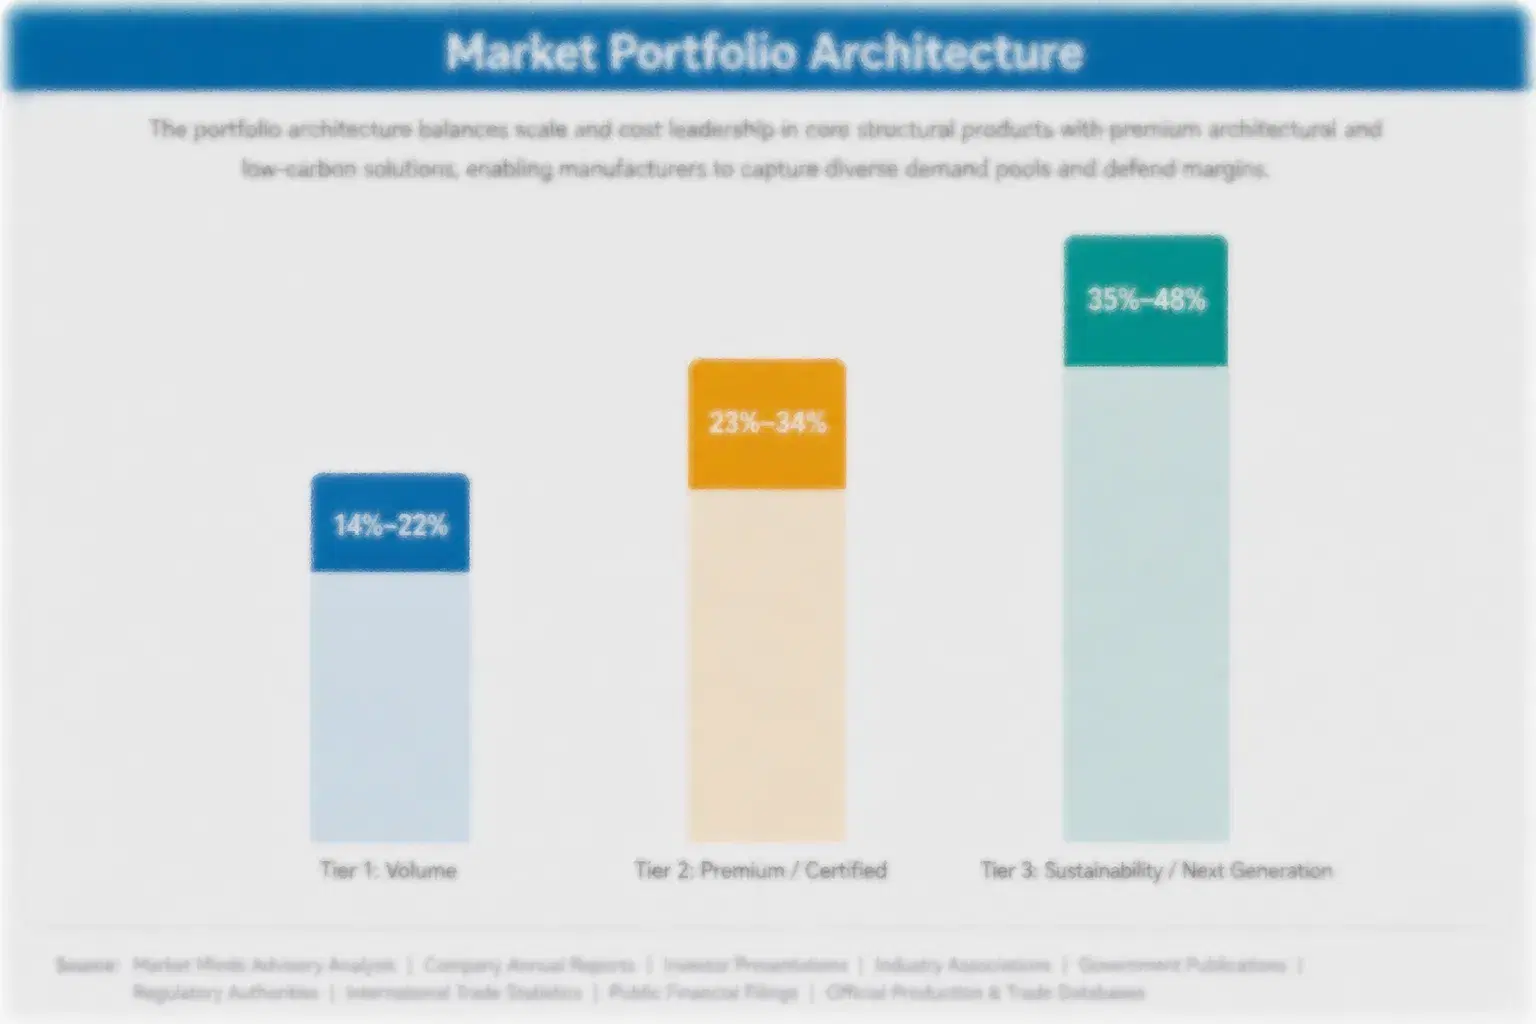
Margins run from moderate returns on natural extracts and reaction flavors sold in volume to strong returns on fermentation-derived and plant-based systems sold with creation and regulatory support. Three tiers separate volume products, premium clean label lines and next-generation seafood-free systems, and each tier draws on different raw material access, technology and customer relationships in a concentrated market. Scale compounds over time.
The tension between volume and premium is sharp. Natural extracts, enzyme-hydrolysed flavors and reaction flavors fill large noodle and snack orders and serve cost-led buyers but face raw material swings and price pressure, while fermentation-derived and plant-based systems earn higher margins on smaller volumes and depend on capital, creation skill and brand trust. Flavor houses that run only volume struggle when costs spike, while houses that run only premium lose early volume.

High-value pools concentrate in plant-based and seafood-free flavor systems sold to vegan analog and allergen-conscious brands and in fermentation-derived flavors sold to noodle, sauce and soup makers. They gather where buyers pay for taste fidelity, clean label and allergen status rather than kilograms. Enzyme-hydrolysed flavors add a middle pool. Audits repeat every year. Buyers review suppliers every season.

Volume / Commodity-Adjacent Tier

Natural extracts, concentrates and reaction flavors sold in volume to noodle, snack and seasoning makers under short contracts at moderate margins. Supply contracts decide renewal. Delivery reliability decides supplier rankings. Margins follow process discipline.
Gross Margin: 22%-30%

Premium / Certified Tier

Fermentation-derived and enzyme-hydrolysed flavors with defined taste profiles, clean label credentials and audit files, sold to sauce, soup and premium noodle makers. Audit records protect future sales. Cost control separates leaders from followers.
Gross Margin: 28%-42%

Sustainability / Regulatory / Next-Generation Tier

Plant-based and seafood-free flavor systems with allergen-free status, sensory data and regulatory files, sold to vegan analog makers and allergen-conscious brands. Clear specifications build buyer trust. Small flavor houses feel every price swing.
Gross Margin: 34%-48%
seafood-flavours-market-portfolio-architecture-1789932310707

High-value Sub-segments and Strategic Watch-out

Plant-Based and Seafood-Free Flavor Systems

Plant-based and seafood-free flavor systems combine the fastest growth with strong pricing, since vegan analog makers and allergen-conscious brands pay for seafood taste without seafood raw material at gross margins of 34% to 48%. Taste fidelity and brand trust limit competition, and houses with proven profiles win.
Gross Margin: 34%-48%

Fermentation-Derived Seafood Flavors

Fermentation-derived seafood flavors deliver firm growth and pricing, since noodle, sauce and soup makers pay for clean label umami depth at gross margins of 30% to 42%. Fermentation capacity and process knowledge form the entry barrier, and houses with regional plants and application support win briefs.
Gross Margin: 30%-42%

Natural Extracts and Concentrates

Natural extracts and concentrates are the volume core for flavor houses with raw material access and drying lines. Value grows about 4.6% a year, and raw material cost, taste consistency and delivery reliability decide profit. Houses anchor sales on long relationships with noodle, snack and soup makers.
Gross Margin: 22%-30%

Reaction and Process Flavors

Reaction and process flavors are the strategic watch-out, since growth of about 5.2% a year trails the leaders, cost-led buyers press on price and clean label buyers move toward fermentation-derived systems. Houses should manage these lines selectively and steer capacity toward premium and seafood-free products. Scale compounds over time.
Gross Margin: 20%-28%

Why Buyers Keep Flavor Suppliers

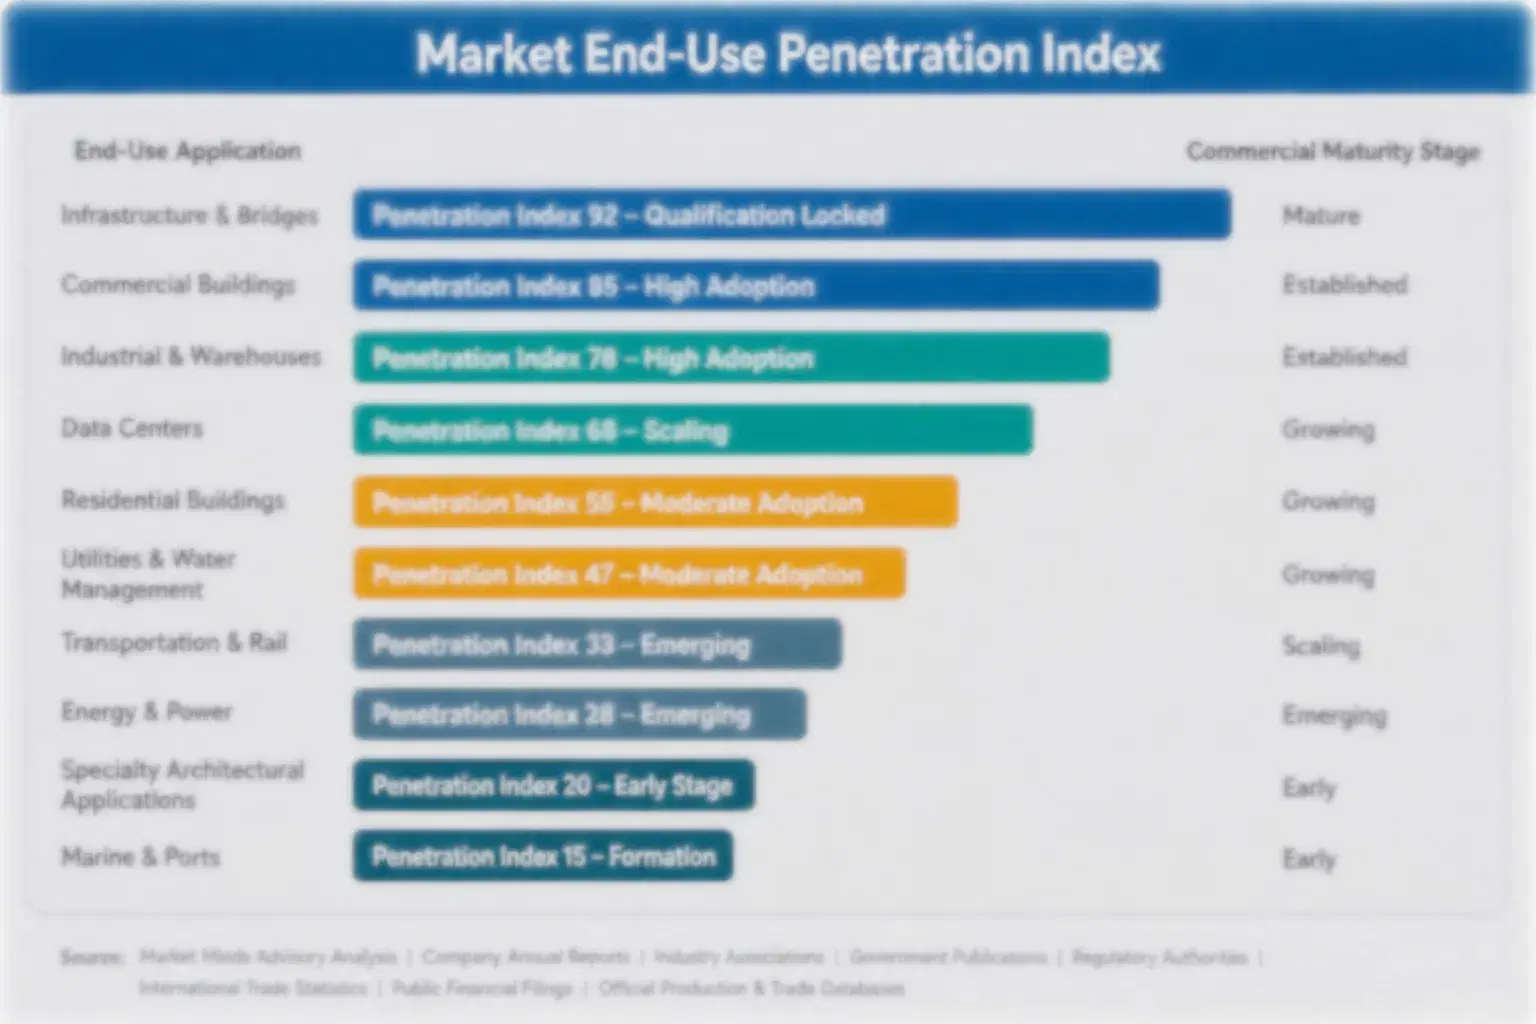
Seafood flavor demand behaves like an annuity attached to noodle recipes, snack seasoning ranges and soup base specifications. Once a noodle or snack maker qualifies a flavor whose taste, allergen status and delivery it trusts, it repeats the order every month, and switching means new sensory panels, retested shelf life and possible label change. Buyers use last season's delivery record to fix renewals, so suppliers with clean records
Adoption stickiness differs by end-use vertical. Instant noodle and snack makers are the deepest, since flavor is written into the recipe and brand identity and changes only when taste or supply fails. Soup and sauce makers follow recipe reviews. Food service is moderate and switches on cost, while spot buyers are shallow. Audits repeat every year. Buyers review suppliers every season. Supply contracts decide renewal.

Buyer profiles are shifting between generations. Older buyers chose seafood flavor on habit and price, while younger buyers ask for clean labels, lower sodium, allergen-free options and plant-based taste. Regulators and retailers add a third group that sets labelling and sourcing rules. Flavor houses that publish allergen and sourcing data win newer buyers and keep them. Delivery reliability decides supplier rankings.
seafood-flavours-market-end-use-penetration-index-1789932311052

MMA Verdict on Seafood Flavor Strategy

These are among the four positions where our research anticipates prominent divergence between winners and laggards over the coming forecast period. Each is grounded in the demand model, the regulatory perimeter, and the announced capacity pipeline.
01 / PREMIUM FLAVOR STRATEGY

Build Plant-Based and Fermentation Capacity Before Brand Owners Lock Suppliers

Plant-Based and Seafood-Free Flavor Systems grows at 8.4% a year, about 1.40 times the overall market rate, and gross margins of 34% to 48% compare with 22% to 30% for natural extracts. Flavor houses should commit $15 million to $60 million to plant-based and fermentation development and pilot plants, and shift 10% of volume into these products to lift gross margin by three to five points. Those that stay in natural extracts will lose vegan and allergen-free growth, while early movers keep briefs and loyalty.
02 / RAW MATERIAL STRATEGY

Secure Extract Supply Before Raw Material Swings Squeeze Flavor Margins

Seafood extracts and shell materials take 30% to 40% of flavor cost, and prices for shrimp and fish by-products rose about 20% in a year, so flavor houses without contracts absorb every swing. Flavor houses should invest $5 million to $20 million in multi-year contracts, alternative raw materials and inventory cover, target Chinese and Southeast Asian suppliers first, and cut raw material swings by 8% to 14% each year. Those without cover will lose margin and briefs, while prepared houses hold cost position and supply agreements across every cycle.
03 / APPLICATION SUPPORT STRATEGY

Support Noodle and Snack Makers Before Sodium Rules Reshuffle Flavor Suppliers

Instant noodle and snack makers write seasoning specifications into every recipe, sodium targets are tightening, and flavor houses without application support lose briefs to rivals that bring tested solutions. Flavor houses should invest $4 million to $15 million in application laboratories, sodium reduction toolkits and sensory panels, target Chinese, Japanese and Southeast Asian noodle makers first, and lift qualified accounts by 12% to 20% each year. Those that stay passive will lose accounts, while prepared houses hold access and long supply agreements across every season.
04 / ALLERGEN COMPLIANCE STRATEGY

Invest in Allergen Controls Before Labelling Rules Tighten Further

Allergen rules list crustaceans, molluscs and fish among 14 labelled groups, and buyers audit cross-contact controls, so flavor houses without controlled plants and documentation lose global programmes. Flavor houses should invest $3 million to $12 million in dedicated lines, allergen documentation and audit readiness, target multinational brand owners first, and cut audit failures by 30% to 50% each year. Those without controls will lose listings, while prepared houses hold access, premium pricing and long supply agreements across every buying cycle ahead.

Engagement Snapshot From the Field

A live engagement with an industry participant carrying material or product regulatory and market exposure ahead of a defining policy shift, showing how our research translates into a defensible multi-year portfolio strategy.
MARKET MINDS ADVISORY · CLIENT ENGAGEMENT SUMMARY
Seafood Flavors Producer Strategic Portfolio Review and Transition Roadmap 2026·Investment Scenario on Seafood Flavors Exposure Evaluation 2025-26
CLIENT PROFILE
The client is a mid-sized Asian flavor manufacturer with annual sales near $120 million (client-reported, unverified by MMA), making natural seafood extracts and reaction flavors for instant noodle and snack makers across Southeast Asia. It bought shells and by-products from six suppliers, ran two plants, and had faced a 21% raw material cost rise and a lost vegan analog brief.
STRATEGIC CHALLENGE
Raw material costs spiked, a vegan analog maker asked for seafood-free profiles, and a large noodle maker demanded lower-sodium flavors with allergen documentation. Management needed to decide whether to build fermentation capacity, sign supply contracts, or invest in application support, with limited working capital and one customer holding 30% of sales. Margins follow process discipline.
MMA APPROACH
MMA analysed sales, cost and formulation data across 40 flavors, interviewed eight flavor, noodle and analog experts and four suppliers, and ran a buyer survey on taste, allergen status and price across three countries. It modelled margin by route and raw material scenario and ranked options by payback and execution risk. Audit records protect future sales.
KEY FINDINGS
  1. Plant-based systems would earn gross margins near 38% against 24% for natural extracts but need pilot capacity costing about $8 million (client-reported, unverified by MMA).
  2. Multi-year extract contracts would cover about 55% of demand and cut raw material swings by about 10%. Cost control separates leaders from followers. Clear specifications build buyer trust.
  3. Sodium reduction toolkits would help win two large noodle programmes worth about 8% of sales. Small flavor houses feel every price swing. Scale compounds over time.
  4. Allergen-controlled documentation would take about seven months and cut audit failures by about 40%. Audits repeat every year. Buyers review suppliers every season. Supply contracts decide renewal.
CLIENT PROFILE
The client is a mid-sized Asian flavor manufacturer with annual sales near $120 million (client-reported, unverified by MMA), making natural seafood extracts and reaction flavors for instant noodle and snack makers across Southeast Asia. It bought shells and by-products from six suppliers, ran two plants, and had faced a 21% raw material cost rise and a lost vegan analog brief.
STRATEGIC CHALLENGE
Raw material costs spiked, a vegan analog maker asked for seafood-free profiles, and a large noodle maker demanded lower-sodium flavors with allergen documentation. Management needed to decide whether to build fermentation capacity, sign supply contracts, or invest in application support, with limited working capital and one customer holding 30% of sales. Margins follow process discipline.
MMA APPROACH
MMA analysed sales, cost and formulation data across 40 flavors, interviewed eight flavor, noodle and analog experts and four suppliers, and ran a buyer survey on taste, allergen status and price across three countries. It modelled margin by route and raw material scenario and ranked options by payback and execution risk. Audit records protect future sales.
KEY FINDINGS
  1. Plant-based systems would earn gross margins near 38% against 24% for natural extracts but need pilot capacity costing about $8 million (client-reported, unverified by MMA).
  2. Multi-year extract contracts would cover about 55% of demand and cut raw material swings by about 10%. Cost control separates leaders from followers. Clear specifications build buyer trust.
  3. Sodium reduction toolkits would help win two large noodle programmes worth about 8% of sales. Small flavor houses feel every price swing. Scale compounds over time.
  4. Allergen-controlled documentation would take about seven months and cut audit failures by about 40%. Audits repeat every year. Buyers review suppliers every season. Supply contracts decide renewal.
RECOMMENDED STRATEGY
Phase 1: Phase 1 (Months 1-6): Sign extract contracts with two suppliers and start allergen documentation upgrades. Delivery reliability decides supplier rankings. Margins follow process discipline. Phase 2: Phase 2 (Months 7-24): Build pilot capacity for plant-based systems and launch sodium reduction toolkits. Audit records protect future sales. Cost control separates leaders from followers. Phase 3: Phase 3 (Months 25-42): Extend fermentation-derived flavors to sauce and soup makers and review terms yearly. Clear specifications build buyer trust.
OUTCOME
Within 42 months, plant-based and fermentation-derived systems reached a fifth of sales, raw material swings fell by about 10%, and audit failures fell by about 40% (client-reported, unverified by MMA). Gross margin rose by four points, and profit exceeded plan by about 3%. Small flavor houses feel every price swing.

Frequently Asked Questions

Foundational context covering the market sizes, CAGR, scope, country, region and competition that inform every finding below. This section is provided to cover basics and most often pre-purchase conversations, answered from the MMA Primary Research Dataset.

What is the current size of the Seafood Flavors Market?

The global seafood flavors market was valued at $1.80 billion in 2025 on a producer-value basis. Growth is supported by noodle and snack seasoning volumes and sodium reduction, offset by allergen rules and raw material swings.

How large will the Seafood Flavors Market be by 2036?

The market is projected to reach $3.42 billion by 2036, up from $1.91 billion in 2026. The increase of $1.51 billion reflects plant-based systems, fermentation-derived flavors and Asian demand.

What is the CAGR for the Seafood Flavors Market 2026 to 2036?

The market is forecast to grow at a 6.0% CAGR from 2026 to 2036. The bull case reaches 7.2% and the bear case 4.8%, depending on raw material prices, allergen rules and plant-based adoption.

Which segment is growing fastest?

Plant-Based and Seafood-Free Flavor Systems is the fastest-growing segment at 8.4% CAGR, roughly 1.40 times the overall market rate. Fermentation-Derived Seafood Flavors follows at 7.2% CAGR each year.

Who are the major companies in the Seafood Flavors Market?

Major companies include Givaudan, dsm-firmenich, IFF, Symrise and Kerry Group. Sensient Technologies, Takasago International, Mane, Ajinomoto, Kikkoman and Huabao International also hold positions in seafood flavors.

Which country is growing fastest?

Indonesia is growing fastest at about 8.6% CAGR, because instant noodle and snack production is expanding and regional makers launch new seafood profiles each season. Vietnam and India follow.

Report Segmentation Architecture

The full report scope spans multiple orthogonal segmentation dimensions, with cross-tabulated demand data provided for each dimension pair. Coverage extends further to regional breakdowns, trend trajectories, and the competitive detail needed to support segment-level decision-making.

By Primary Market Dimension

  • Natural Extracts and Concentrates
  • Enzyme-Hydrolysed Seafood Flavors
  • Reaction and Process Flavors
  • Fermentation-Derived Seafood Flavors
  • Plant-Based and Seafood-Free Flavor Systems

By End-Use Industry

  • Instant Noodles
  • Snacks and Seasonings
  • Soups and Sauces
  • Meat Analogs and Seafood Analogs
  • Ready Meals

By Commercial Dimension

  • Direct Supply to Brand Owners
  • Distributors
  • Contract Manufacturers
  • Private Label Programmes
  • Online Ingredient Sales

By Region

  • East Asia
  • South Asia and Pacific
  • North America
  • Western Europe
  • Latin America
  • Middle East and Africa
  • Eastern Europe

Scope, Methodology, and Coverage

Every figure in this report is reproducible from documented input assumptions. The scope below maps the historical period, the forecast horizon, the segmentation dimensions, and the countries covered, alongside the underlying primary and qualitative methodology.
Historical Period
2020 to 2025
Forecast Period
2026 to 2036
Base Year
2025 (USD billions; MMA Primary Research Dataset, September 2026)
Market Definition
The market covers global sales of seafood flavors valued at producer level, including natural extracts and concentrates, enzyme-hydrolysed seafood flavors, reaction and process flavors, fermentation-derived seafood flavors, and plant-based and seafood-free flavor systems, sold to noodle, snack, soup, sauce and seasoning makers. The scope excludes finished fish sauce and oyster sauce condiments, fish protein hydrolysates for nutrition, and non-seafood savoury flavors.
Quantitative Units
USD billions (producer value); thousand tonnes of flavor for volume references
Segmentation Dimensions
By Flavor Route; By End-Use Industry; By Commercial Dimension; By Region
Regions Covered
East Asia, South Asia and Pacific, North America, Western Europe, Latin America, Middle East and Africa, Eastern Europe
Countries Covered
China, Japan, South Korea, Indonesia, Vietnam, Thailand, India, Philippines, United States, Canada, Germany, France, United Kingdom, Netherlands, Mexico, Brazil, Peru, Saudi Arabia, Nigeria, Poland, and additional markets relevant to this sector
Key Companies Profiled
Givaudan, dsm-firmenich, IFF, Symrise, Kerry Group, Sensient Technologies, Takasago International, Mane, Ajinomoto, Kikkoman, Huabao International, Synergy Flavors, Bell Flavors and Fragrances, Blue Pacific Flavors, Prinova Group, Innova Flavors, Archer Daniels Midland, McCormick Flavor Solutions, Döhler, Nagase
Quantitative Methodology
Primary survey, n=3,800 respondents, Q4 2025, six countries; demand-side model with trade association cross-validation
Qualitative Methodology
47 expert interviews, Q4 2025; applied to validate demand model assumptions, identify emerging dynamics, and assess competitive positioning
Report Format
PDF and XLSX data workbook (Word format preview document)
Publisher
Market Minds Advisory
Report Code
MMA-2026-AGR-967
Published
September 2026
Contact
sales@marketmindsadvisory.com | www.marketmindsadvisory.com

Purchase the full Seafood Flavors Market Report (2026 to 2036).

The full report delivers a detailed assessment of the seafood flavors market through 2036, covering flavor route, end-use and regional forecasts, competitive benchmarking of leading flavor houses, and input cost analysis. It combines MMA primary research, including a six-country survey of 3,800 respondents and 47 expert interviews, with public statistical and company data. Analysts also model raw material scenarios, allergen paths and plant-based adoption. Clients receive segment margin ranges, supply maps and a case study on route and sourcing strategy. Supplier programme and contract frameworks are also included for planning.
Ten-year flavor route and end-use demand forecasts
Extract, yeast, and energy cost tracking
Competitive benchmarking of leading flavor houses
Allergen and labelling rule tracker with updates
Regional market comparative analysis and forecasts included
Quarterly primary survey data update access

Built For The People Who Decide

From boardroom strategy to bench-side execution, this report is read cover-to-cover by leaders shaping the next decade of their industry, turning demand scenarios, market dynamics and valuation benchmarks into decisions.
CXOs/ Presidents/ VPs/ Managers
M&A and Corporate Development
Strategy Teams and R&D Heads
Procurement and Product Directors
Regulatory and Compliance Leaders
Investor Relations and Equity Analysts