Market Minds Advisory
Seabed Mapping and Imaging Market

Seabed Mapping and Imaging Market: Autonomous Platforms Reshape a Sonar-Led Survey Industry

Offshore wind developers and naval hydrographic agencies are pulling seabed mapping demand toward autonomous survey platforms faster than Kongsberg and Teledyne can requalify sensor packages for uncrewed vessels across most major projects.

Lead Analyst

David Horsley

Published

September 2026

Make Smarter Decisions with Customized Research Insights

Request a free sample report and evaluate market opportunities, growth trends, and competitive dynamics relevant to your business needs.

2025 MARKET VALUE$2.1BMarket Size 2025
2036 FORECAST VALUE$5.2BBase Case , 2026 to 2036
CAGR 2026 TO 20368.6 %Bull 9.8% / Bear 7.3%
INCREMENTAL OPPORTUNITY$2.9BNet 10- year value creation
EXPANSION MULTIPLE2.28x2036 value over 2026 base
Strategic Levers
M&A Pipeline
Regional Outlook
Country Rankings
Competitive Intelligence
Segmental Deep-dive
Call-Us : 91 93563 13602

Executive Snapshot and Market Trajectory

Seabed mapping demand is shifting from crewed survey vessels toward autonomous underwater and surface platforms, and sensor manufacturers are racing to requalify multibeam and sonar packages for uncrewed operation faster than most buyers expected even two years ago. Buyers face few genuine alternatives at that scale today overall.
Multibeam echosounder systems remain the largest equipment category by revenue, but autonomous vehicle mapping platforms are growing fastest as offshore wind developers and naval hydrographic agencies both push survey work away from expensive crewed vessels. Western Europe anchors the deepest concentration of sonar and positioning technology developers, a legacy of decades of Norwegian and British marine engineering investment. Buyers increasingly weigh both platform type and integration depth when selecting a supplier.
Kongsberg and Teledyne set technology and integration benchmarks that smaller specialized manufacturers struggle to match across a full sensor portfolio. Tightening offshore wind seabed survey requirements and rapidly maturing autonomous vehicle platforms are both reshaping which manufacturers can keep pace with developer and government qualification timelines each year. Buyers increasingly diversify across multiple qualified suppliers rather than depend on any single manufacturer for critical survey capacity.
Market Definition
The seabed mapping and imaging market covers multibeam echosounders, side-scan and synthetic aperture sonar, autonomous vehicle mapping platforms, positioning and navigation systems, sub-bottom profilers, and seabed mapping processing software sold for hydrographic, offshore energy, defense, and marine spatial planning applications. It excludes the survey vessels themselves and third-party survey services performed using this equipment.
Base Year Value
$2.1B in 2025 (MMA Primary Research Dataset, August 2026)
Forecast Period
2026 to 2036, eleven discrete annual values
CAGR
8.6% base case. Bull 9.8%. Bear 7.3%.
Fastest Growth Segment
Autonomous Underwater and Surface Vehicle Mapping Platforms: 14.8% CAGR
Fastest Growth Country
India: 12.4% CAGR
Fastest Growth Region
South Asia and Pacific: 10.6% CAGR
Largest Region
Western Europe: 26% of 2025 global value
Market Leaders
Kongsberg Discovery AS, Teledyne Marine, Exail Technologies, Sonardyne International Ltd., L3Harris Technologies Inc. Source: MMA Analysis based on company annual reports and primary research, July 2026.
Primary Survey
n=3,800 procurement and R&D decision-makers, Q4 2025, six countries
Methodology
Demand-side build-up, cross-validated against public data, 47 expert interviews

Seabed Mapping and Imaging Market Forecast Scenarios

seabed-mapping-imaging-market-size-forecast-scenario-1787302906430
Seabed mapping demand grew steadily across 2020 to 2025 as offshore wind development accelerated globally, though pandemic-era vessel availability constraints briefly slowed survey program timelines. The market grew at an estimated 7.6% historical CAGR across the period, reflecting that mix of accelerating offshore energy demand and temporary vessel-driven delivery constraints across major survey markets each year.
The base case assumes offshore wind seabed survey requirements continue tightening through 2030, autonomous vehicle mapping platforms move from pilot deployments into mainstream commercial fleets by 2028, and manufacturers add incremental sensor and software capacity to meet both established and emerging demand pools. Together these three commercial mechanisms support an 8.6% forecast CAGR, with multibeam echosounder systems remaining the anchor category even as autonomous platforms narrow the value gap each year.
The bull case centers on autonomous vehicle mapping platforms reaching full commercial-scale naval and offshore wind adoption well ahead of current 2028 timelines. The bear case centers on a renewed offshore wind investment slowdown, whether from policy reversal or reduced capital availability, which would strand incremental sensor capacity investment across manufacturers worldwide for several years across the industry.

Autonomous Platforms Meet Tightening Survey Standards

Seabed mapping sits at the intersection of acoustic sensing engineering and survey-grade software, since a multibeam system is only as valuable as the processing software that turns raw sonar returns into a usable bathymetric surface. That combination has kept the manufacturer base concentrated among companies that can deliver both hardware and software as an integrated package rather than separate purchases. Buyers rarely switch suppliers mid-program as a result.
MARKET CONCENTRATION (CR5)42%Top five manufacturers hold a fragmented plurality overall
AVERAGE SELLING PRICE$185,000 per multibeam systemReflects frequency range, depth rating, and software package
TOP PRODUCING COUNTRY SHARENorway, 24%Largest single national base for sensor manufacturing today
CAPACITY UTILIZATION RATE73%Manufacturers expanding ahead of confirmed near-term demand growth
TRADE INTENSITY64% cross-borderMost shipped systems cross a border before deployment
SENSOR COST SHARE48% of COGSLargest single cost line in system manufacturing overall
Commercially, the market splits between a mature crewed-vessel multibeam and positioning base sold through long-term government and offshore contractor relationships, and a smaller but faster-growing autonomous platform tier sold on cost-per-survey-kilometer economics rather than sensor performance alone. Sub-bottom profilers and specialty sonar round out demand with application-specific purchasing tied to geotechnical and unexploded ordnance survey work. Pricing differs meaningfully across each tier described.
Over the next decade, autonomous platform integration will matter more than raw sensor accuracy alone, since most established manufacturers already meet baseline accuracy requirements for commercial hydrographic work. The manufacturers that can requalify sensor packages for uncrewed operation fastest stand to capture a widening share of a market that offshore wind and defense budgets are reshaping simultaneously, across every major producing geography today.
"The sensor hasn't fundamentally changed in a decade. What changed is that it now has to survive strapped to a robot instead of bolted to a crewed vessel's hull, and that requalification is harder than it sounds."
Director, Marine Technology Practice · MMA Technology / Marine Survey and Sensin

Market Trends

Autonomous Vehicle Survey Fleet Expansion Accelerates

Offshore wind developers and hydrographic agencies are increasingly commissioning autonomous underwater and surface vehicle fleets rather than chartering crewed survey vessels, since a single uncrewed surface vessel can cover a survey area at a fraction of the daily operating cost. Ocean Infinity and comparable operators have expanded autonomous fleet deployments since 2023, targeting offshore wind seabed characterization and defense hydrographic mapping programs that specify autonomous-capable sensor packages. Manufacturers that requalify multibeam and side-scan sonar for autonomous platforms are capturing new contracts that crewed-vessel-only competitors cannot bid on, a qualification gap widening as developers standardize around autonomous-first survey specifications.
Market Impact: Adds demand 2 to 3 years
Offshore Wind Seabed Survey Requirement Tightening

Offshore wind developers face increasingly detailed seabed characterization requirements before foundation and cable route permitting can proceed, driven by regulators demanding higher-resolution bathymetric and sub-bottom data than earlier project generations required. Each gigawatt of new offshore wind capacity requires extensive multibeam, side-scan, and sub-bottom survey coverage across the full lease area before construction can begin, creating a direct and predictable demand pipeline tied to project development schedules. Manufacturers including Kongsberg and Teledyne have both expanded offshore wind-specific sensor packages to capture this demand, which shows no sign of slowing as global offshore wind capacity targets continue climbing through 2030.
Market Impact: Expands demand across 10+ navies

Market Opportunities and Growth Drivers

Global Offshore Wind Capacity Expansion Continues

Global offshore wind capacity additions have continued climbing through 2025 as governments commit to renewable energy targets extending through 2030 and beyond, each requiring seabed survey work before foundation design and cable routing can proceed. Every gigawatt of new offshore wind capacity translates into a proportional seabed mapping requirement, meaning capacity targets function as a leading indicator for survey equipment demand roughly two to three years ahead of construction. Manufacturers are responding by pre-committing sensor production capacity near offshore wind development regions in Europe, East Asia, and increasingly the United States, to secure supply agreements ahead of qualification competition.
Market Impact: Requires 2 to 3 year qualification

Naval Hydrographic Modernization Programs Expand Globally

Naval forces across multiple countries are modernizing hydrographic survey fleets with autonomous and semi-autonomous platforms, driven by both budget pressure to reduce crewed vessel operating costs and strategic interest in mapping contested or previously under-surveyed maritime zones. India, Australia, and several European navies have all disclosed hydrographic modernization programs referencing autonomous vehicle procurement since 2023, directly expanding addressable demand for ruggedized sensor packages built for unattended operation. Manufacturers including L3Harris and Kongsberg have both expanded defense-focused autonomous sensor lines specifically to capture this naval modernization wave, which shows continued momentum as maritime boundary disputes keep hydrographic mapping a strategic priority.
Market Impact: Slows adoption 2 to 3 years

Market Restraints and Challenges

High System Cost and Long Qualification Cycles

A fully equipped multibeam survey system with positioning, motion sensing, and processing software can cost several hundred thousand dollars, and government hydrographic agencies typically require multi-year procurement and qualification cycles before adopting a new sensor package into standard fleet operations. That cost and qualification burden discourages smaller survey operators from upgrading equipment as frequently as larger, better-capitalized competitors can afford. Manufacturers are responding by offering equipment leasing and survey-as-a-service commercial models that lower the upfront capital barrier, though these models still require the same underlying qualification testing before a government or offshore developer will accept survey data as compliant.
Market Impact: Cuts survey cost 40% per kilometer

Autonomous Platform Reliability and Data Assurance Gaps

Autonomous underwater and surface vehicles still face meaningful reliability and communication limitations compared to crewed vessels, particularly for deepwater and long-duration missions where recovering a malfunctioning platform can be costly and time-consuming. Regulators and offshore developers remain cautious about accepting autonomous-collected survey data as fully equivalent to crewed-vessel data for critical foundation design decisions, slowing the pace at which autonomous platforms can fully displace crewed survey work. Manufacturers are responding by building redundant sensor and communication systems into autonomous platforms and publishing data quality validation studies aimed at building regulator and developer confidence in autonomous-collected survey data.
Market Impact: Covers 100% of offshore lease areas
3 additional market trends, 4 additional growth drivers, and 3 additional restraints and challenges are covered in the full report. Contact sales@marketmindsadvisory.com to access the complete intelligence.

Segment CAGR and Growth Architecture

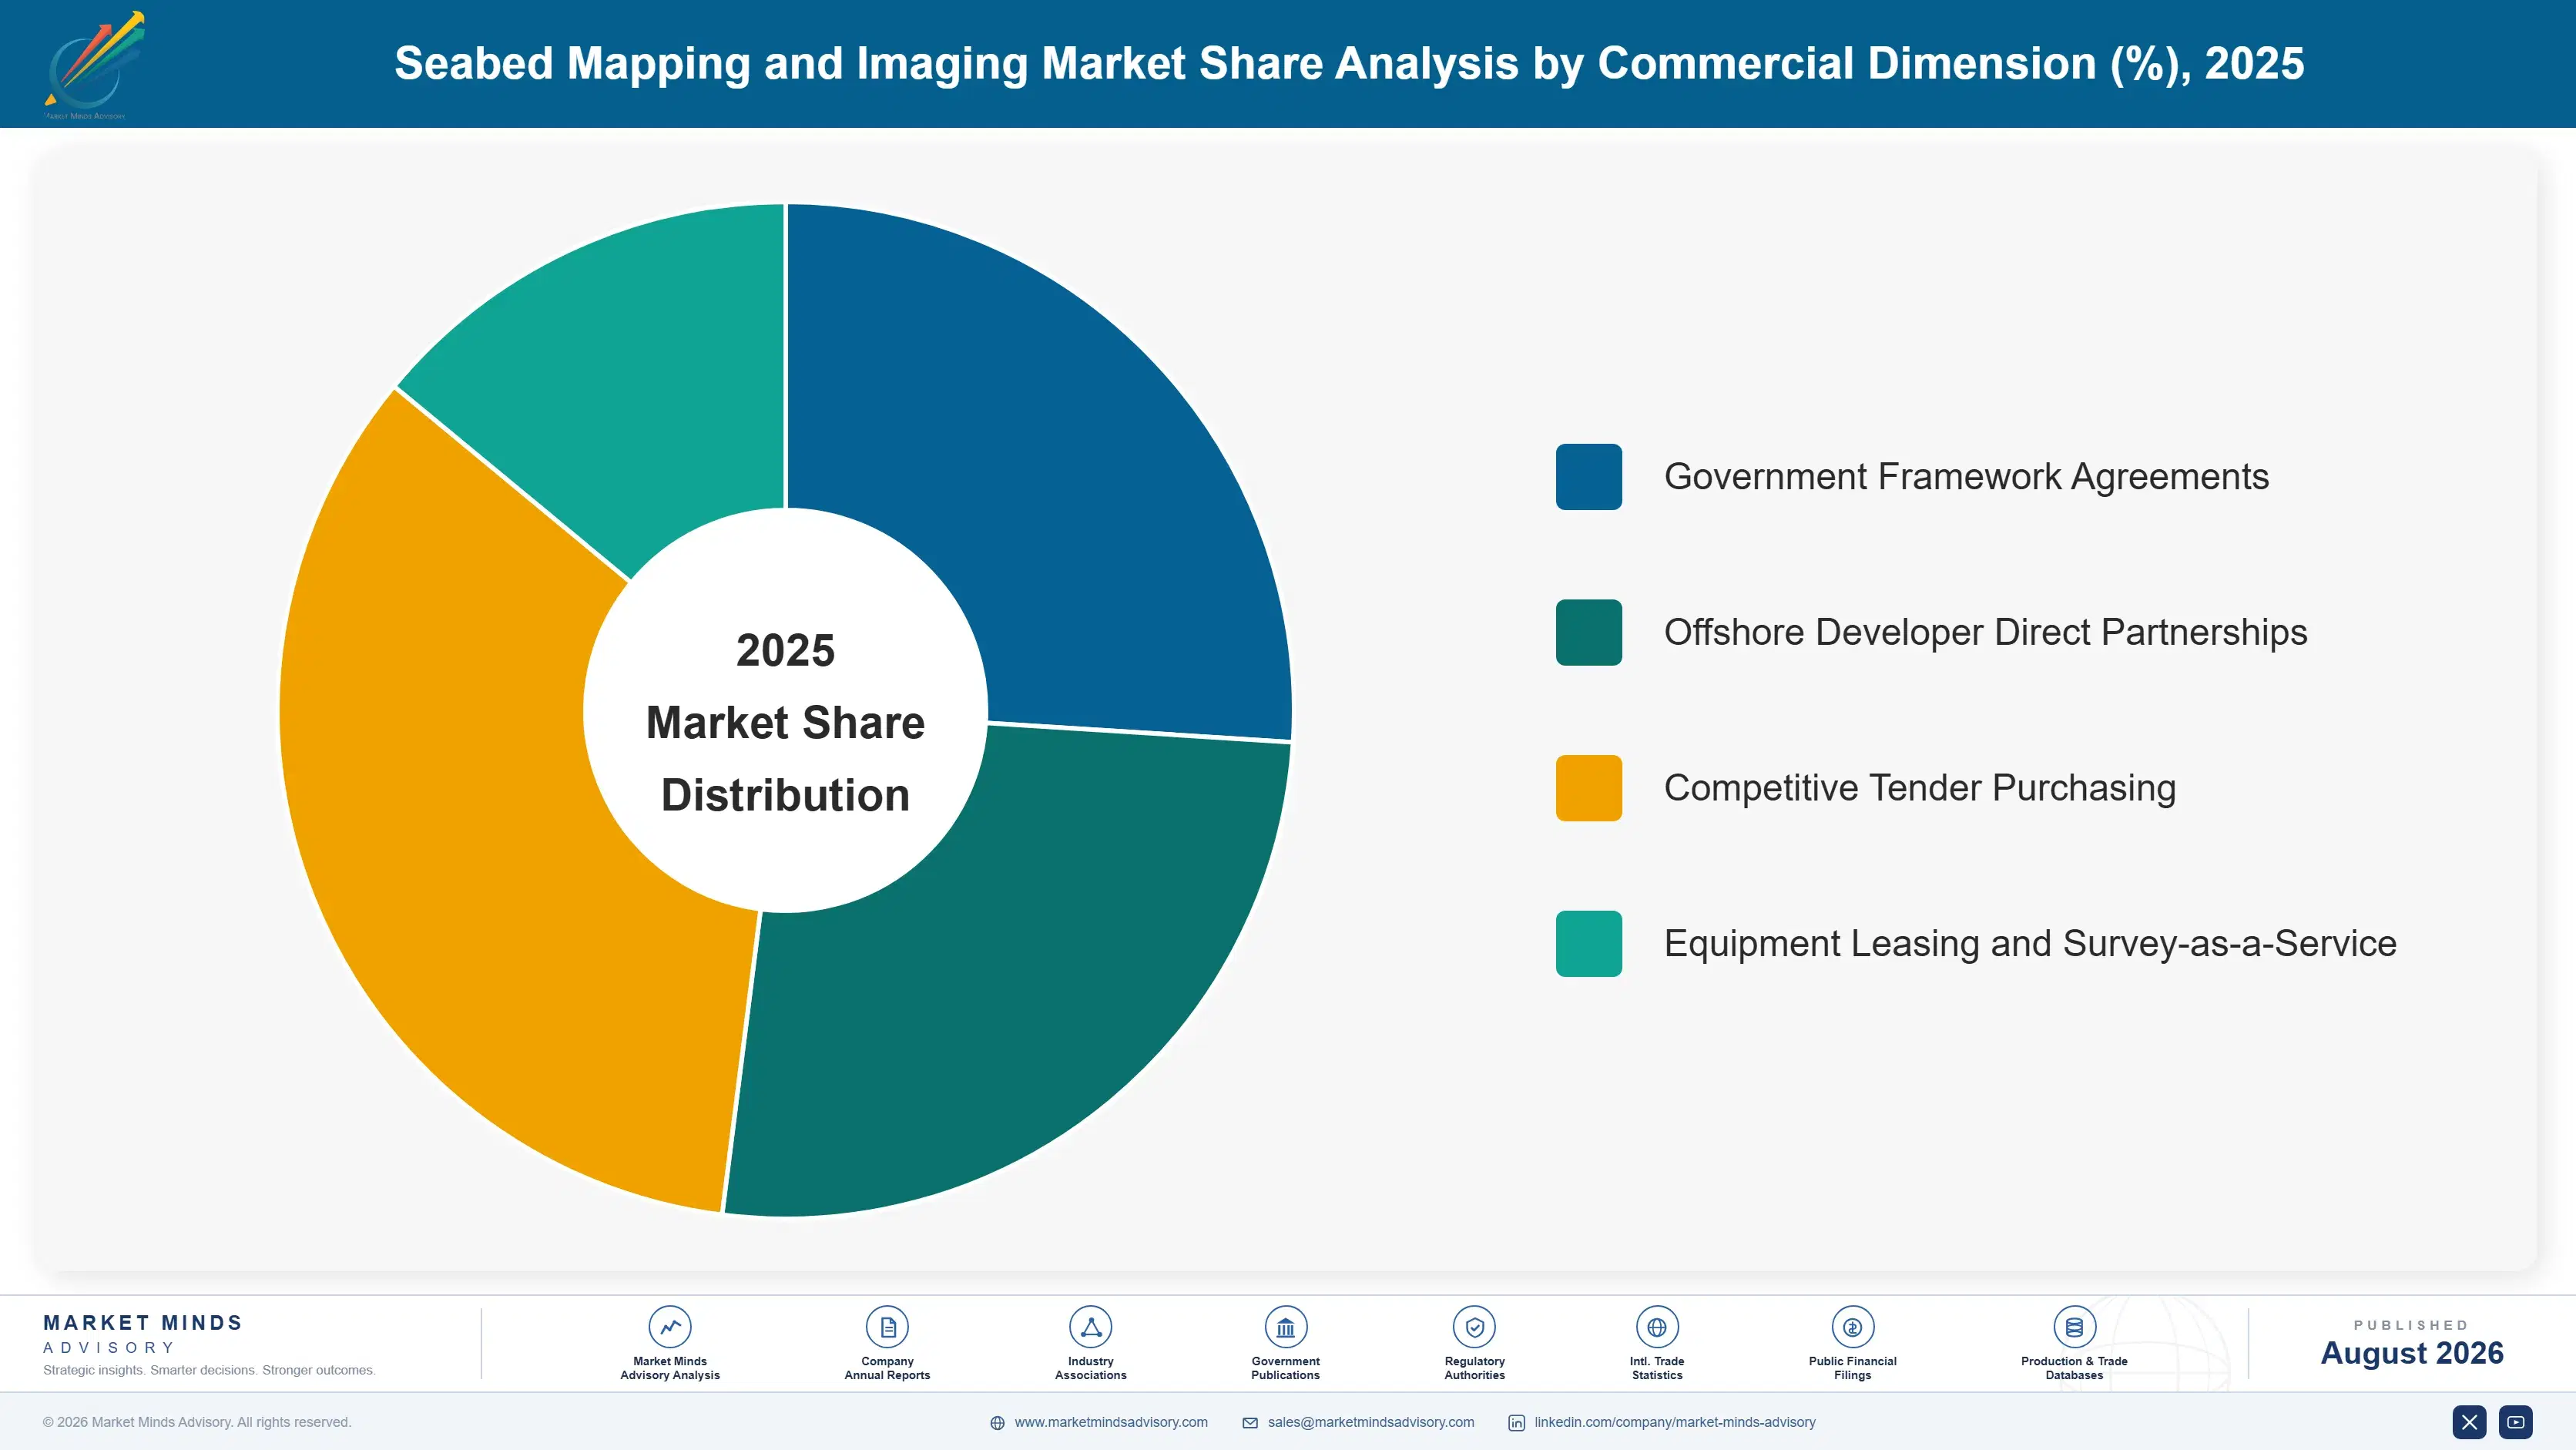
Seabed mapping segments by sensor and platform technology, the classification manufacturers and survey operators use to set procurement pathway, integration requirements, and qualification timeline, since multibeam, autonomous platform, and software buyers each negotiate under distinct commercial terms across the industry each year. Manufacturers price each category differently depending on integration depth and qualification burden required.
seabed-mapping-imaging-market-market-share-analysis-1787302906966

Autonomous Underwater and Surface Vehicle Mapping Platforms

Autonomous underwater and surface vehicle mapping platforms are the fastest-growing segment as offshore wind developers and naval hydrographic agencies both shift survey work away from expensive crewed vessels toward uncrewed alternatives. Ocean Infinity and comparable operators have expanded autonomous fleet deployments since 2023, targeting offshore wind seabed characterization and defense hydrographic mapping programs that increasingly specify autonomous-capable sensor packages. A single uncrewed surface vessel can cover a comparable survey area at a fraction of the daily operating cost of a crewed vessel, a cost advantage that grows as lease areas expand. If autonomous platforms continue displacing crewed vessel survey work, this segment could approach a meaningful share of total category value within the next decade, a trajectory no category matches.
CAGR 14.8%

Seabed Mapping and Processing Software

Seabed mapping and processing software is the second-fastest-growing segment as survey operators increasingly value the software that turns raw sonar returns into usable bathymetric and geological products as much as the sensors that collect the raw data. Teledyne's CARIS platform and comparable processing suites have expanded feature sets to handle growing data volumes from autonomous platform fleets, which generate more survey data per project than crewed vessel operations did previously. Software increasingly determines which sensor manufacturers win integrated contracts, since offshore developers and government agencies prefer a single validated processing workflow across their entire survey fleet rather than reconciling multiple outputs. Manufacturers investing in software development alongside hardware are capturing a disproportionate share of integrated contracts as this trend continues.
CAGR 11.2%
Full segment breakdown across 6 segments available in the complete report.

Regional Architecture and Country Demand Map

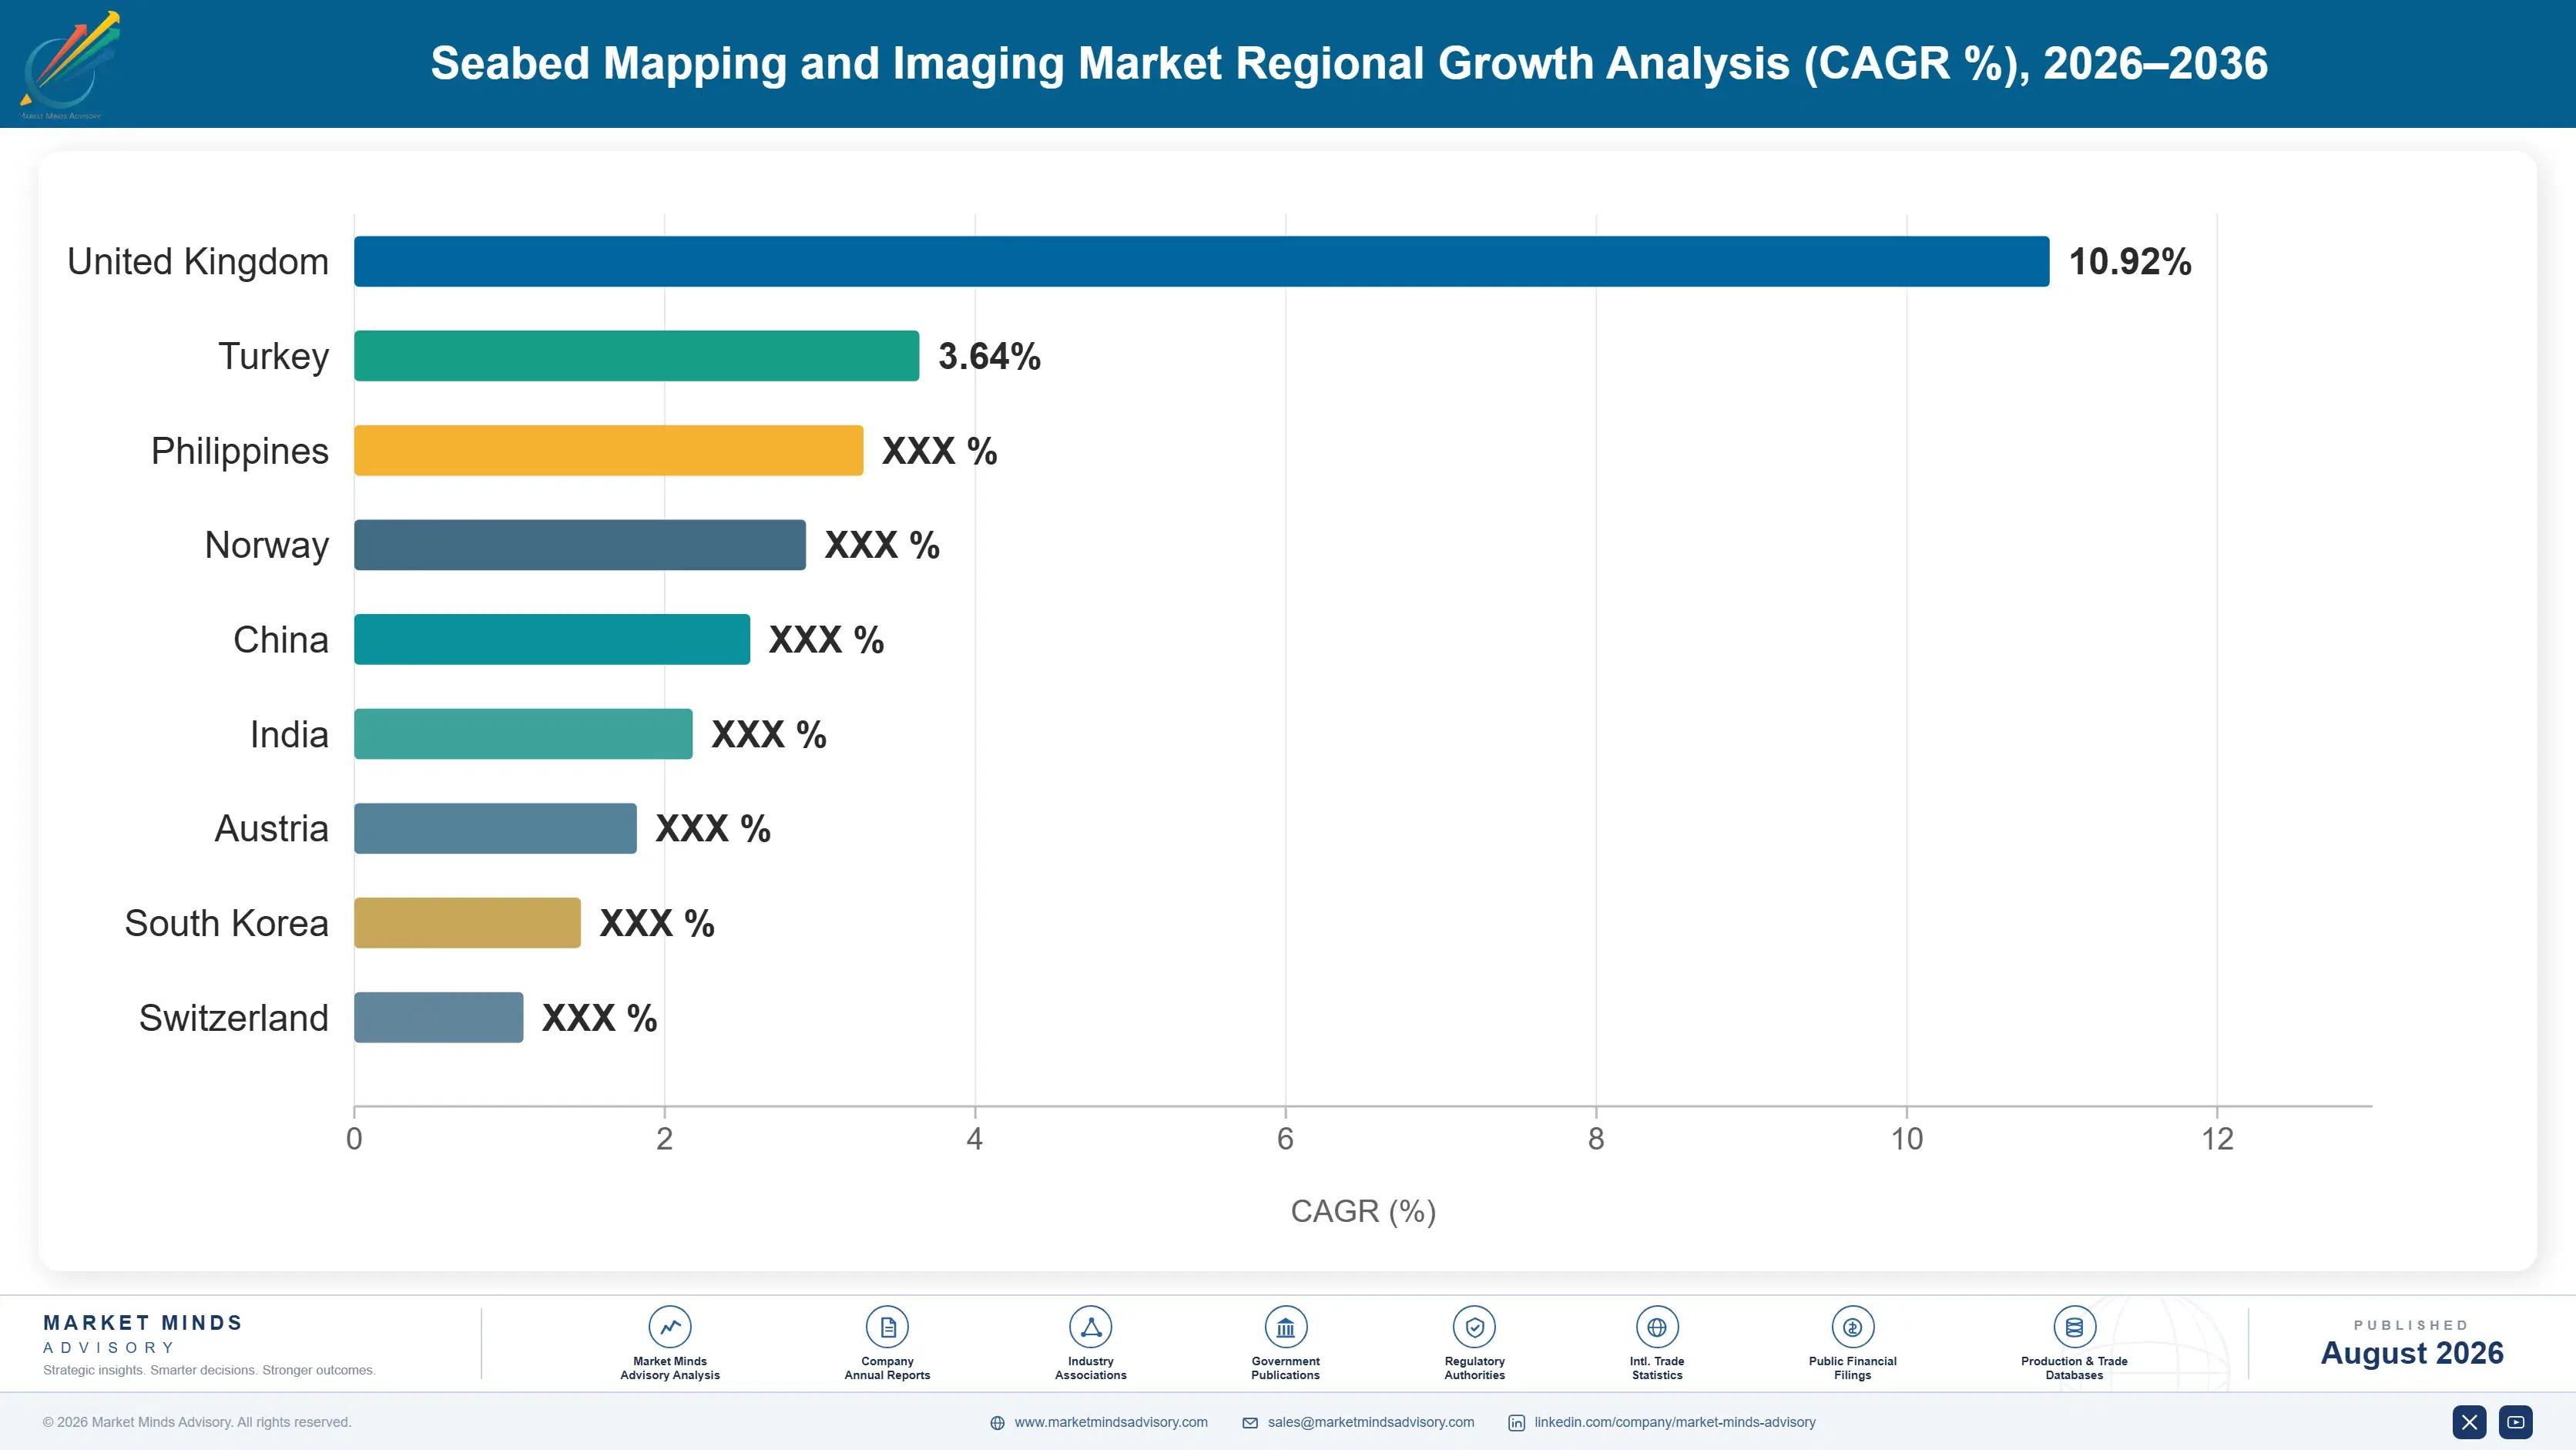
Seabed mapping technology development concentrates in Western Europe given decades of Norwegian and British marine engineering investment, though North America and East Asia both hold substantial and growing shares tied to offshore wind and defense hydrographic demand. South Asia and Pacific grows fastest as naval and offshore investment both accelerate.

North America

The United States accounts for the majority of North America's seabed mapping demand, anchored by Teledyne Marine's broad sensor and software portfolio alongside expanding offshore wind development along the Atlantic coast requiring extensive seabed characterization before permitting can proceed. Naval hydrographic modernization programs add a steady defense demand pool, with the US Navy and NOAA both disclosed procurement plans referencing autonomous survey platforms since 2023. Canada contributes a smaller but steady share tied to its own hydrographic survey and offshore energy sectors. Mexico's contribution remains modest but is growing as offshore energy exploration activity in the Gulf of Mexico expands survey requirements alongside established North American supply relationships each year.
Share: 25% | CAGR: 9.2% (2026 to 2036)

Western Europe

Norway anchors Western Europe's seabed mapping demand and manufacturing base, home to Kongsberg Discovery's multibeam sonar development and decades of accumulated marine engineering expertise that few other countries can match. The United Kingdom contributes a substantial share through Sonardyne, Applied Acoustics, and Valeport's positioning and sonar manufacturing base, alongside offshore wind survey demand across the North Sea. Germany and France add further demand tied to Wärtsilä ELAC Nautik's and Exail's sensor manufacturing operations and their own offshore wind development programs. Growth here trails East Asia and North America given an already-mature manufacturing base and offshore wind market that developed earlier than most other regions. Denmark also contributes a growing demand pool tied to North Sea offshore wind survey activity.
Share: 26% | CAGR: 7.0% (2026 to 2036)
Regional intelligence for 5 additional markets available in the complete report: East Asia, South Asia and Pacific, Latin America, Middle East and Africa, Eastern Europe. Contact sales@marketmindsadvisory.com.
seabed-mapping-imaging-market-country-cagr-analysis-1787302907482

Where Sensor Manufacturers Are Capturing Margin

Four commercial moves separate seabed mapping manufacturers capturing outsized margin from those competing purely on delivered sensor price, each tied to autonomous integration depth, software capability, or long-term government relationships that shield volume from commodity price competition across the industry each year. Each move requires a different mix of capital investment and multi-year commercial commitment before it meaningfully improves margin.

Autonomous Platform Sensor Qualification Growth Program

Manufacturers investing in requalifying multibeam and side-scan sonar packages for autonomous underwater and surface vehicle operation are capturing new contracts that crewed-vessel-only competitors cannot bid on as more developers standardize around autonomous-first survey specifications. Requalifying a sensor package for autonomous operation typically costs $3 million to $8 million in ruggedization, power optimization, and communication system testing. Manufacturers without autonomous qualification increasingly lose contract bids to better-prepared competitors as autonomous-first procurement specifications spread across offshore wind and defense programs. Manufacturers without such investment risk permanent exclusion from autonomous-first procurement programs industry-wide.
Market Impact: Costs $3 to $8 million per new qual

Integrated Survey Software Development Growth Program

Manufacturers developing survey processing software alongside their sensor hardware are capturing a disproportionate share of integrated contracts, since offshore developers and government agencies increasingly prefer a single validated processing workflow across their entire survey fleet. Building a competitive processing software platform typically costs $15 million to $35 million in development investment against established platforms like Teledyne's CARIS suite. Manufacturers without competitive software risk losing hardware sales entirely once buyers standardize on a competitor's integrated hardware and software package. Manufacturers without competitive software increasingly cede integrated contracts to better-positioned rivals industry-wide.
Market Impact: Costs $15 to $35 million per new pl

Long-Term Government Framework Agreement Growth Program

Manufacturers securing multi-year framework agreements with naval hydrographic agencies and national mapping authorities, guaranteeing priority allocation and defined procurement volume, are capturing premium pricing that protects against competitive tender pressure from smaller manufacturers without comparable government relationships. These agreements typically carry a 6 to 14% price premium over competitive tender pricing, reflecting the value agencies place on qualified, proven suppliers with established support infrastructure. Manufacturers able to demonstrate reliable long-term support increasingly win framework renewal over lower-cost competitors lacking comparable track records. Manufacturers without such agreements compete purely on price in open tenders.
Market Impact: Commands 6 to 14% premium over tend

Offshore Wind Developer Direct Partnership Program

Manufacturers building direct technical partnerships with major offshore wind developers, embedding engineering support teams into early-stage project planning, are capturing preferred-supplier status before formal procurement tenders begin. Establishing this kind of embedded partnership typically requires $2 million to $6 million in dedicated technical account management investment per major developer relationship. Manufacturers without these direct relationships increasingly find themselves competing purely on price in open tenders against suppliers who shaped the technical specification from the start. Manufacturers without embedded relationships increasingly lose preferred-supplier status to competitors who invested earlier industry-wide today.
Market Impact: Costs $2 to $6 million per new part

Who Controls the Margin Pool

The top five manufacturers hold an estimated 42% of global seabed mapping equipment revenue, a fragmented plurality reflecting the range of specialized sensor niches that smaller manufacturers can still profitably serve. Kongsberg and Teledyne lead on integrated sensor and software portfolio breadth, while a second tier of manufacturers competes on niche technical performance in categories like sub-bottom profiling and precision positioning that do not require a full portfolio.
Current competitive activity centers on three fronts. Autonomous platform sensor qualification is opening a new front for manufacturers willing to commit engineering capital ahead of confirmed procurement standardization. Integrated survey software development is becoming important as buyers consolidate around single validated processing workflows. And manufacturers are pursuing direct offshore wind developer partnerships to shape technical specifications before formal tenders begin.

Emerging pressure comes from smaller autonomous vehicle specialists moving into sensor integration as they partner with established sonar manufacturers, though matching Kongsberg or Teledyne's full portfolio breadth remains years away for most. If these challengers close that integration gap, expect share to shift within specific autonomous platform niches first, before any pressure reaches the largest incumbents given how deeply embedded existing government and offshore developer relationships are across the industry.
seabed-mapping-imaging-market-company-positioning-matrix-1787302908010

Competitive Moat and Risk Dimensions

KONGSBERG DISCOVERY AS

Moat: Multibeam Sonar Technology Leadership

Kongsberg's multibeam echosounder technology sets the performance benchmark that competitors are measured against across most government and offshore hydrographic procurement specifications worldwide. That reputation took decades to build and gives Kongsberg default consideration in tenders where proven performance matters more than price. That leadership shapes procurement specifications well beyond Kongsberg's own direct sales.
KONGSBERG DISCOVERY AS

Risk: Norway Manufacturing Concentration Exposure

Kongsberg's core manufacturing operations concentrate heavily in Norway, leaving it more exposed than geographically diversified competitors to any sustained domestic supply chain disruption or currency shift affecting export competitiveness against dollar-denominated American rivals. That exposure grows during any period of strained trade relations between Norway and key export markets.
TELEDYNE MARINE

Moat: Broad Sensor and Software Portfolio

Teledyne's combination of RESON sonar hardware and CARIS processing software gives it an integrated portfolio breadth that few competitors can match across the full survey workflow. That breadth lets Teledyne win contracts requiring both hardware and software from a single validated supplier relationship across most major contracts each year.
TELEDYNE MARINE

Risk: Integration Complexity Across Acquisitions

Teledyne's portfolio breadth stems substantially from acquiring multiple previously independent sonar and software companies, and integrating these product lines into a coherent roadmap has occasionally slowed innovation relative to more focused single-product competitors. That integration burden has occasionally slowed Teledyne's ability to respond quickly to fast-moving smaller competitors.

Players Tracked

Prominent Players

Kongsberg Discovery AS
Teledyne Marine
Exail Technologies
Sonardyne International Ltd.
L3Harris Technologies Inc.

Other Key Players

R2Sonic LLC
Norbit Subsea AS
EdgeTech
Saab Seaeye Ltd.
Ocean Infinity Group Ltd.
QPS BV
Wartsila ELAC Nautik GmbH
Applied Acoustics Engineering Ltd.
Valeport Ltd.
Fugro N.V.
Hydroid Inc.
Klein Marine Systems Inc.
Chesapeake Technology Inc.
Innomar Technologie GmbH
Kraken Robotics Inc.

Recent Developments

APRIL 2025

Kongsberg Expands Autonomous Sensor Qualification Program

Kongsberg commissioned additional testing capacity to requalify its multibeam sonar packages for autonomous surface and underwater vehicle operation, expanding engineering resources to meet rising developer demand. The expansion followed multi-year framework discussions with major offshore wind developers standardizing around autonomous-first survey specifications. Similar expansions are expected across other qualified manufacturers.
Signal: Confirms manufacturers are pre-committing
OCTOBER 2024

Teledyne Signs Multi-Year Naval Framework Agreement

Teledyne secured a multi-year framework agreement with a national hydrographic agency covering multibeam and positioning system procurement, guaranteeing priority allocation through 2028. The agreement reflects agencies' broader push to lock in qualified suppliers ahead of further fleet modernization investment. Similar agreements are expected across other qualified manufacturers.
Signal: Shows government agencies prioritizing sup
JANUARY 2025

Ocean Infinity Announces Expanded Autonomous Fleet Investment

Ocean Infinity announced incremental investment in its autonomous survey vessel fleet to serve growing offshore wind and defense hydrographic customers directly across multiple regions. The investment followed sustained developer pressure for autonomous-capable survey capacity as offshore wind lease areas expanded. Industry analysts expect similar investments from competing survey operators soon.
Signal: Signals autonomous survey platforms are mo

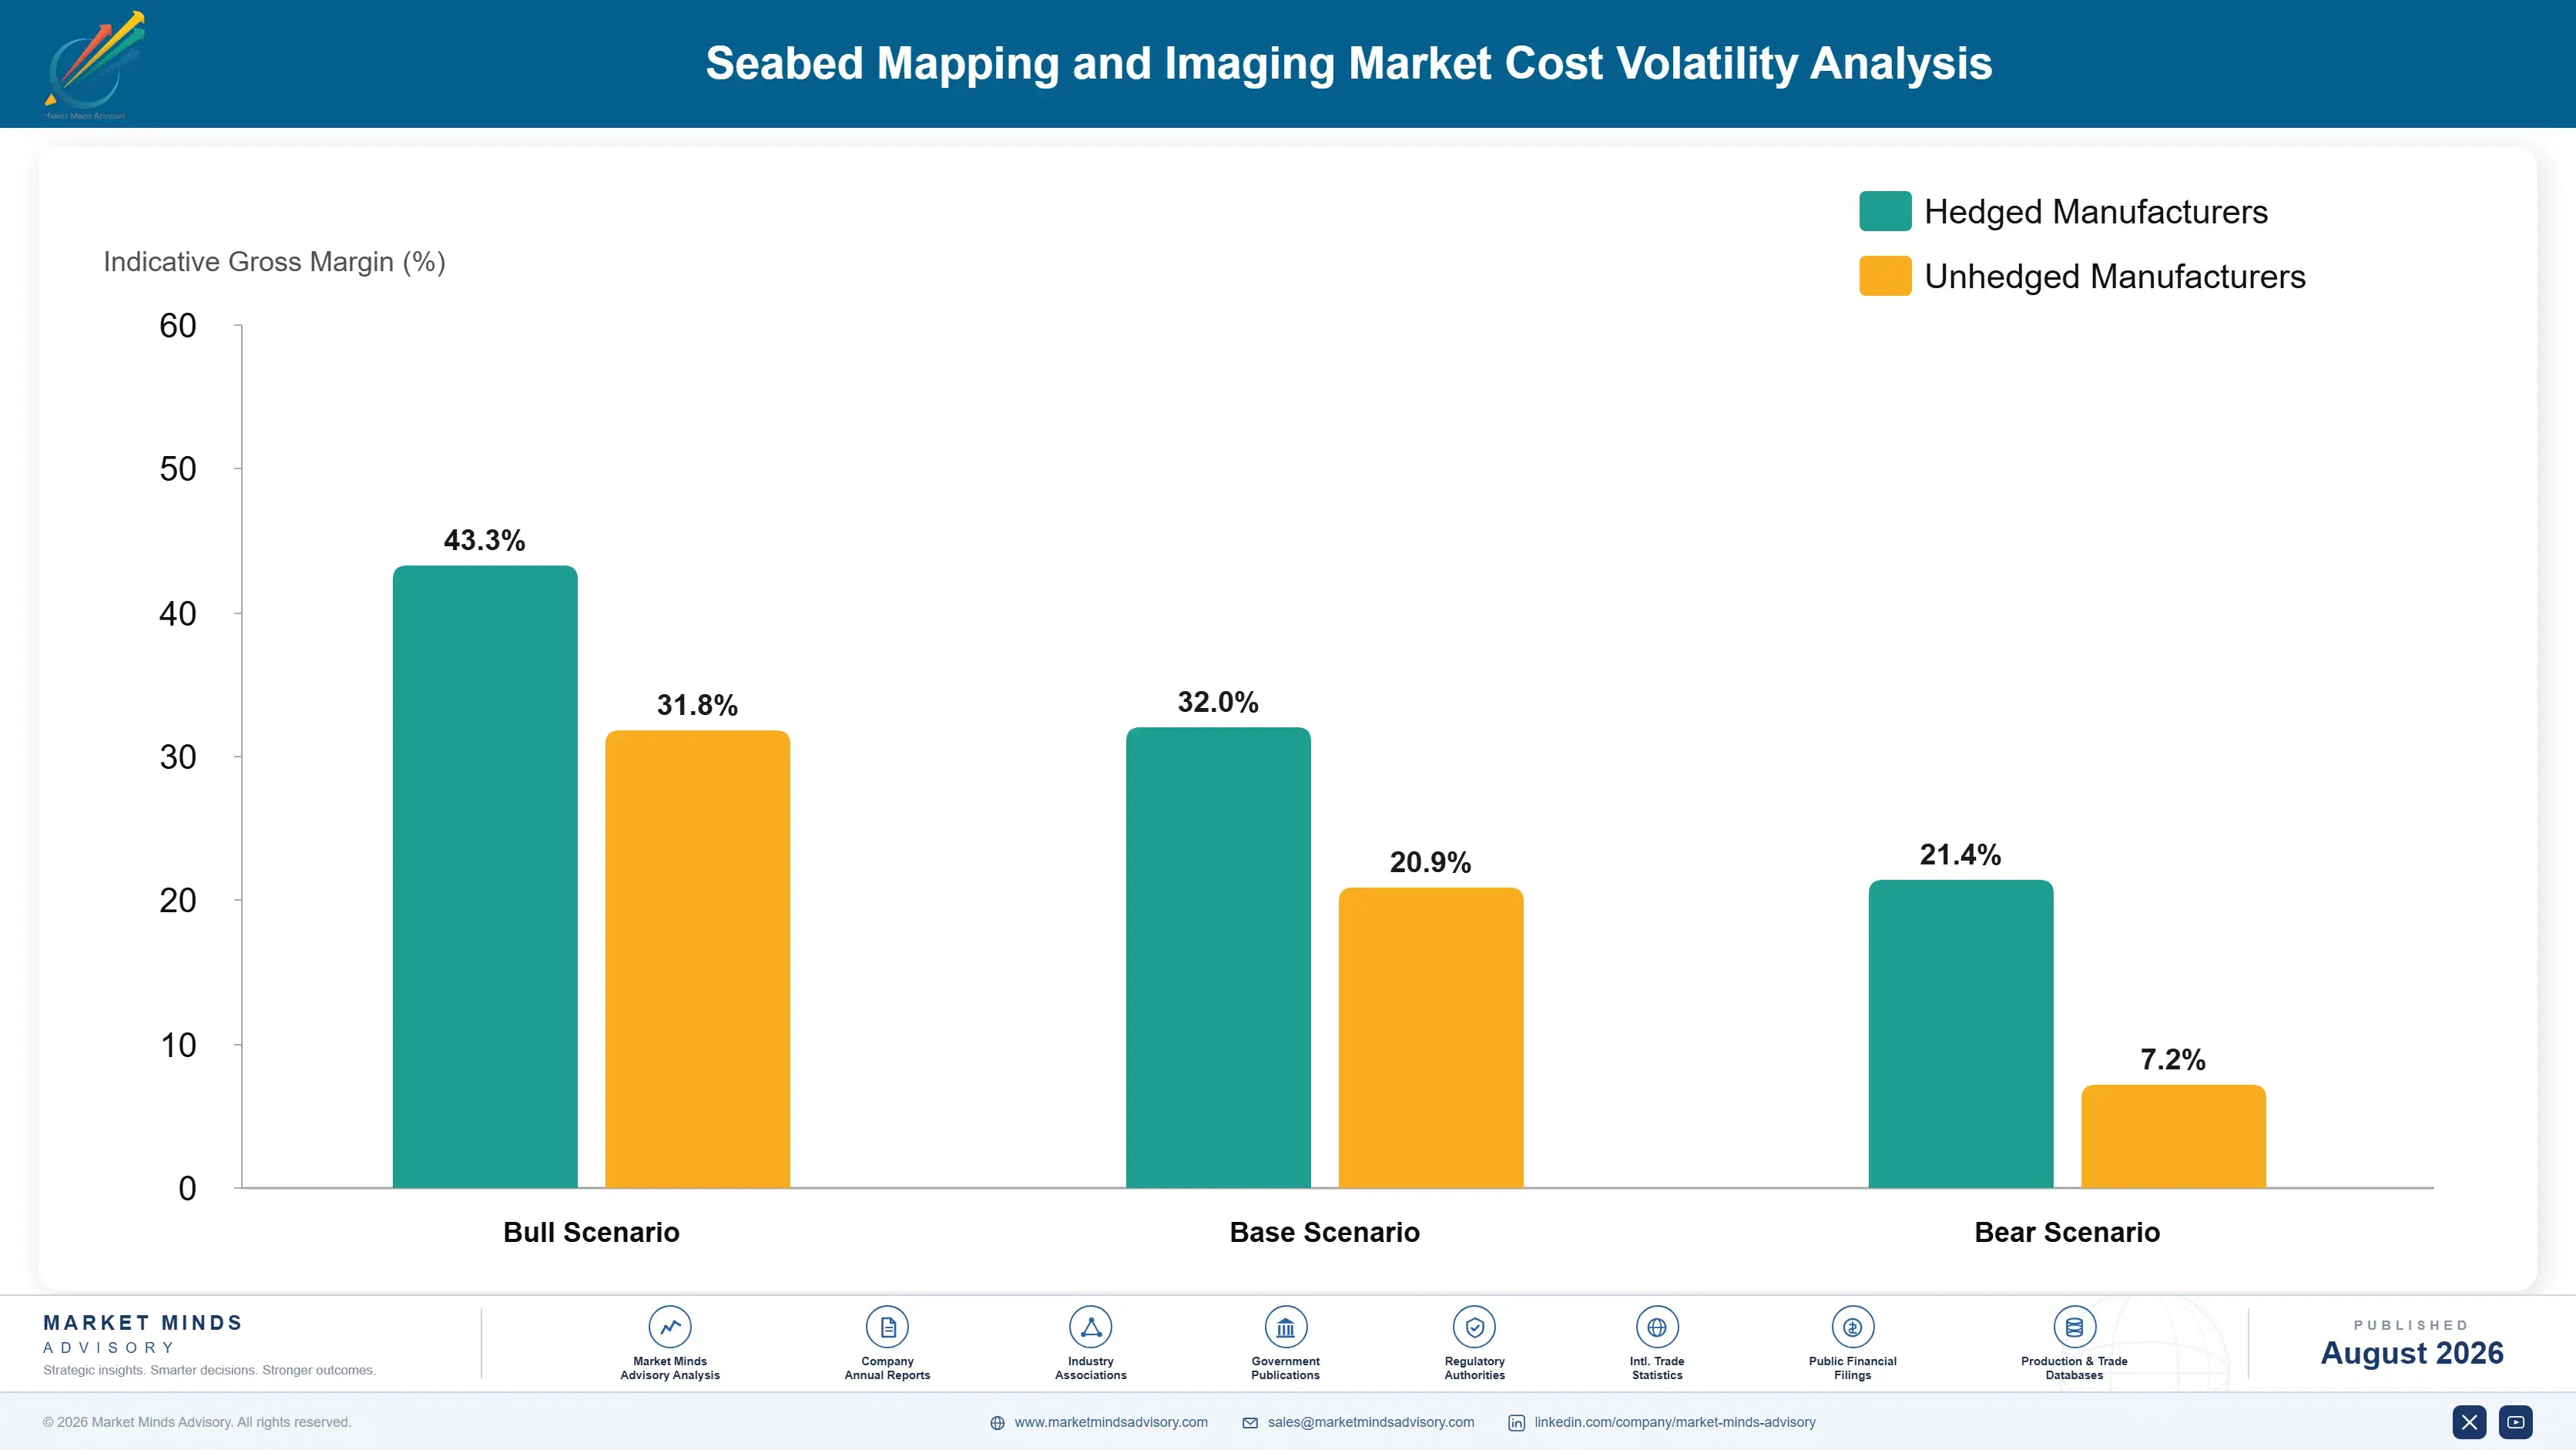
Precision Electronics Dependence and Transducer Cost Exposure

Precision transducers and specialized electronics together account for roughly 48% of cost of goods sold in seabed mapping system manufacturing, sourced from a limited pool of qualified suppliers capable of meeting the acoustic performance and pressure-housing tolerances hydrographic-grade sensors require. Software development labor adds a further meaningful share, concentrated among manufacturers maintaining both hardware and processing software teams internally.
Semiconductor and electronics component prices spiked during 2021 and 2022 as supply chain disruption constrained volume, with several manufacturers reporting component cost increases exceeding 30% in their 2022 annual reports before pricing stabilized through 2023. Industry supply chain reviews have flagged precision transducer and electronics sourcing as seabed mapping manufacturing's single most constrained input, more than other inputs. Several manufacturers have publicly flagged this component exposure as a leading operational risk heading into 2026.

Smaller specialized manufacturers without long-term component supply agreements absorbed the 2021 and 2022 shortage hardest, losing contract bids to larger competitors including Kongsberg and Teledyne that had negotiated priority component allocation years in advance. Manufacturers with secured component supply weathered the shortage far better than those dependent on spot market purchasing, a cost and availability advantage that persists most sharply across smaller specialized manufacturers today.
seabed-mapping-imaging-market-cost-volatility-analysis-1787302908210

Long-Term Component Supply Agreements

Larger manufacturers are locking in multi-year precision electronics and transducer supply agreements directly with qualified component suppliers, guaranteeing predictable input costs ahead of demand increases rather than relying on spot market purchasing that has grown increasingly volatile since 2021. This approach adds cost certainty to production planning even when spot component pricing swings sharply during periods of tight allocation.

Vertical Integration Into Transducer Manufacturing

Several manufacturers are investing in internal transducer manufacturing capability to reduce dependence on third-party suppliers, gaining pricing control and supply security that non-integrated competitors dependent on external sourcing cannot match during shortage periods. This integration also reduces manufacturers' exposure to spot market volatility that has repeatedly disadvantaged non-integrated competitors during past shortage cycles overall.

Software Revenue Diversification Strategy

Manufacturers are pursuing processing software and data analytics revenue partly to diversify away from hardware margins most exposed to component cost pass-through limitations under long-term government and developer contracts. This diversification strategy also spreads manufacturer revenue across a broader set of product categories, reducing dependence on any single component or pricing cycle for volume.

Portfolio Architecture for Margin Defence

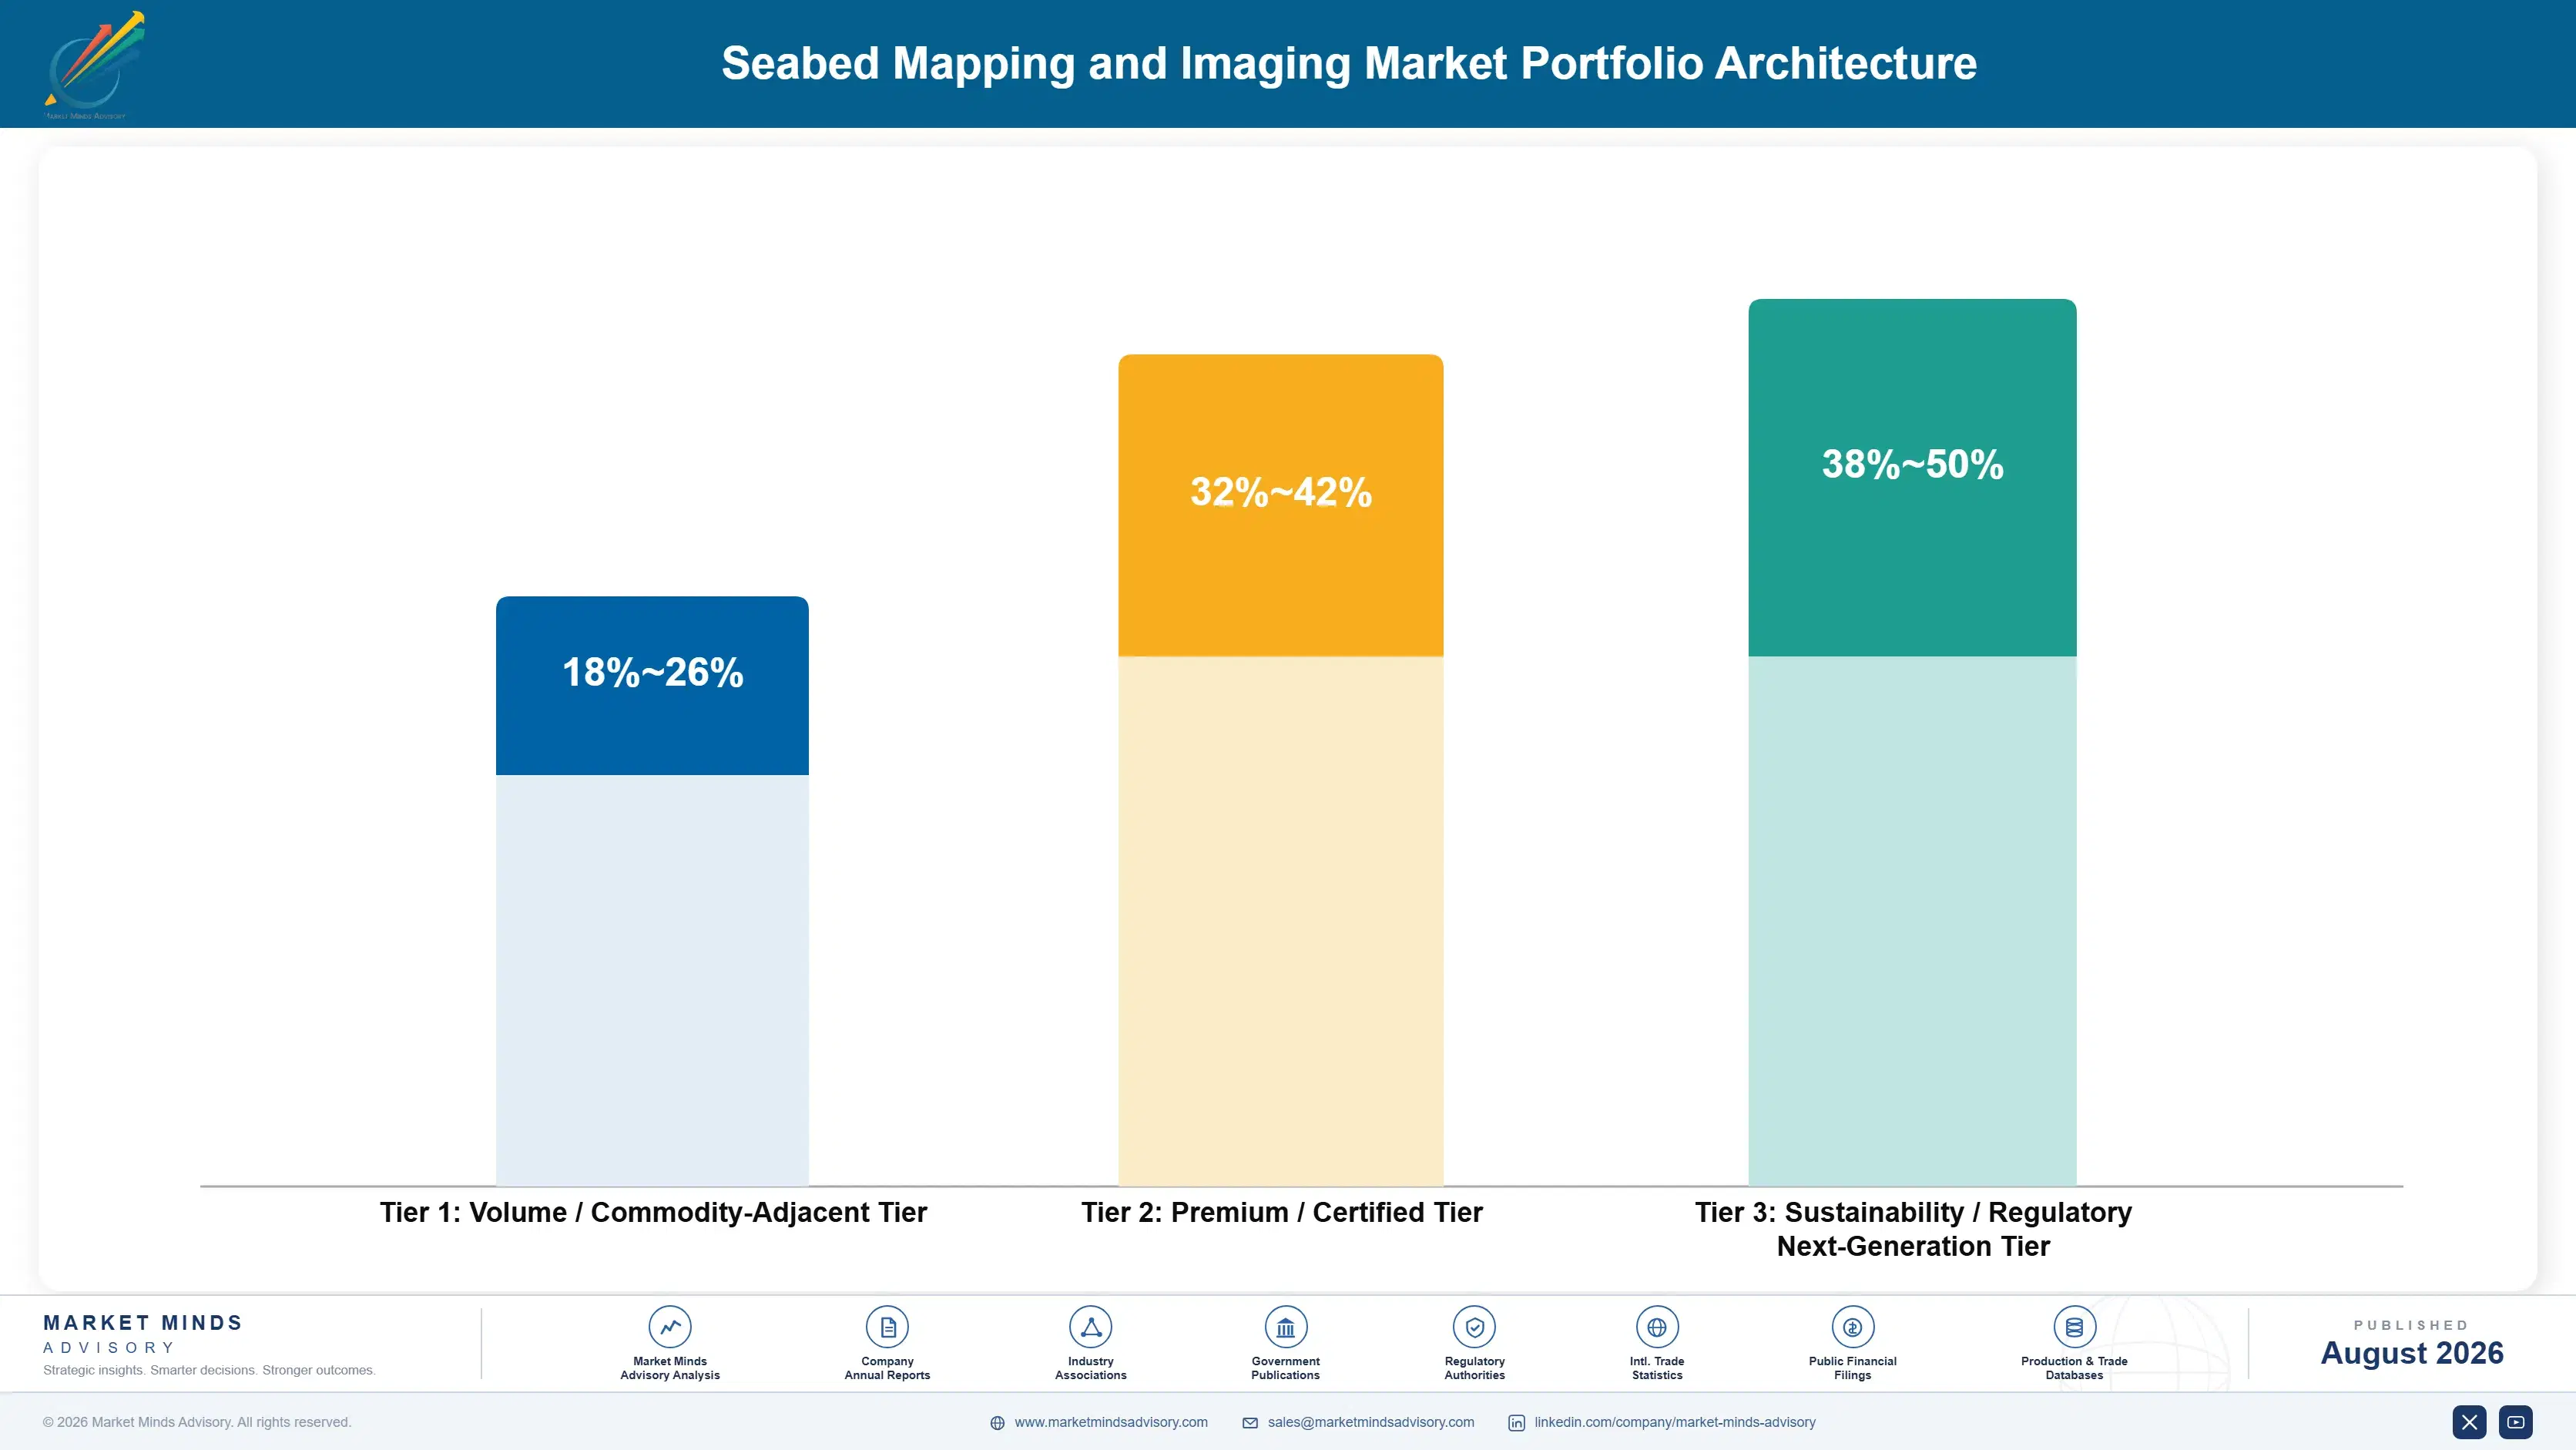
Seabed mapping portfolios span three margin tiers, from commodity-adjacent entry-level sonar and positioning equipment sold largely on price, through certified survey-grade multibeam and software systems carrying performance-driven premiums, toward a next-generation tier built around autonomous platform integration and processing software still gaining share. Gross margin widens at each tier as integration depth and software capability increase across the industry. Buyers pay for certification d
The volume versus premium tension centers on engineering allocation. Manufacturers must choose between dedicating capacity to high-margin autonomous integration and software programs with growing but smaller volume, or serving survey-grade hardware demand that fills out production capacity in a typical year. Manufacturers without spare capacity favor higher-margin programs where competition remains thin. That decision shapes which manufacturers win the highest-margin accounts each year.

High-value margin pools concentrate in autonomous platform integration and processing software programs, where technical complexity and validation requirements keep competition thin and buyers pay a premium for proven reliability. Entry-level sonar and positioning equipment remain the volume anchor but carry the thinnest margins across the portfolio, leaving smaller manufacturers with fewer diversification options than larger competitors. Manufacturers that diversify across premium and volume tiers capture the widest margin spread today.

Volume / Commodity-Adjacent Tier

Entry-level sonar and positioning equipment sold largely on price and delivery reliability without autonomous integration or advanced software premiums, across most entry-level commercial survey buyers worldwide each year consistently overall.
Gross Margin: 18%-26%

Premium / Certified Tier

Survey-grade multibeam and integrated hardware-software systems sold under government and developer framework agreements carrying performance-driven pricing power built through years of government qualification and proven long-term support track record overall.
Gross Margin: 32%-42%

Sustainability / Regulatory / Next-Generation Tier

Autonomous platform-integrated sensor packages and advanced processing software in active qualification, commanding premium pricing against limited proven alternatives as buyers wait for confirmed regulatory acceptance before committing further capital investment.
Gross Margin: 38%-50%
seabed-mapping-imaging-market-portfolio-architecture-1787302908713

Framework Agreements Anchor Recurring Demand

Seabed mapping equipment purchasing functions closer to an annuity than a transactional sale for government hydrographic agencies, since once a manufacturer clears multi-year qualification and framework agreement processes, that relationship typically persists through the framework's full term and frequently through renewal, given the cost and schedule risk of requalifying an alternative supplier. Offshore wind developer purchasing behaves somewhat differently, tracking individual project develo
Adoption depth varies sharply by end-use vertical. Government hydrographic agencies and defense buyers show the deepest stickiness given multi-year qualification cycles and mission-critical reliability requirements, while smaller commercial survey contractors switch equipment suppliers more readily since qualification barriers are lower and price sensitivity plays a larger role in purchasing decisions.

A generational shift is underway as offshore wind developers, who have no legacy relationship with traditional crewed-vessel survey equipment suppliers, evaluate manufacturers on autonomous platform integration and cost-per-survey-kilometer economics rather than decades-long government supply relationships. That openness gives newer, autonomous-focused manufacturers a rare opening to win share in a market where government procurement incumbency has otherwise been difficult to dislodge.
seabed-mapping-imaging-market-end-use-penetration-index-1787302909205

Where Sensor Manufacturers Should Focus Next

These are among the four positions where our research anticipates prominent divergence between winners and laggards over the coming forecast period. Each is grounded in the demand model, the regulatory perimeter, and the announced capacity pipeline.
01 / AUTONOMOUS QUALIFICATION STRATEGY

Requalify sensor packages before procurement standardizes further

Manufacturers that requalify sensor packages for autonomous platform operation capture new contracts that crewed-vessel-only competitors cannot bid on, a scarce advantage as offshore wind and defense buyers standardize around autonomous-first specifications. Building that qualification requires meaningful engineering investment that competitors cannot replicate overnight, since ruggedization and communication testing takes years to complete properly. Manufacturers waiting until standardization fully solidifies will find themselves racing to catch up against incumbents who invested years earlier, a gap that widens each quarter qualification investment lags behind.
02 / SOFTWARE INTEGRATION TIMING

Invest in processing software before hardware-only positioning erodes

Buyers increasingly prefer a single validated processing workflow across their entire survey fleet, and manufacturers without competitive software risk losing hardware sales entirely once buyers standardize on a competitor's integrated package. Building competitive processing software requires meaningful capital but positions manufacturers to capture the growing share of contracts that bundle hardware and software together. Manufacturers treating software as an afterthought risk becoming commoditized hardware suppliers to whichever competitor built the preferred processing platform first, a window that will not stay open indefinitely once buyers standardize on a single platform.
03 / GOVERNMENT FRAMEWORK RELATIONSHIP STRATEGY

Prioritize multi-year framework agreements over competitive tenders

Manufacturers with multi-year government framework agreements capture premium pricing and priority allocation that protects against competitive tender pressure from lower-cost rivals, an advantage that compounds with every framework renewal cycle. Manufacturers relying primarily on competitive tenders remain persistently exposed to price-based displacement whenever a lower-cost qualified competitor emerges. Building these relationships now, while several major modernization programs remain in early planning stages, protects long-term position against future tender cycles, since manufacturers that delay these relationships risk permanently ceding ground to better-positioned competitors during upcoming cycles.
04 / REGIONAL GROWTH MARKET ALLOCATION

Weight new investment toward South Asia and East Asia growth

South Asia and Pacific and East Asia are both growing faster than Western Europe as naval modernization and offshore wind investment both accelerate across India, China, and neighboring markets. Manufacturers concentrating capacity expansion solely around legacy Western European and North American relationships risk ceding share in the regions where volume growth will be steepest through 2036. Early investment in regional partnerships and local support infrastructure offers a meaningful head start over competitors still anchored entirely to legacy Western customer bases.

Engagement Snapshot From the Field

A live engagement with an industry participant carrying material or product regulatory and market exposure ahead of a defining policy shift, showing how our research translates into a defensible multi-year portfolio strategy.
MARKET MINDS ADVISORY · CLIENT ENGAGEMENT SUMMARY
Seabed Mapping and Imaging Producer Strategic Portfolio Review and Transition Roadmap 2026·Investment Scenario on Seabed Mapping and Imaging Exposure Evaluation 2025-26
CLIENT PROFILE
The client is a national hydrographic survey agency responsible for charting its country's exclusive economic zone, with an annual equipment procurement budget in the low tens of millions of dollars (client-reported, unverified by MMA). The client faced pressure to modernize its aging crewed-vessel survey fleet while managing budget constraints and growing autonomous platform vendor options.
STRATEGIC CHALLENGE
The client needed to decide how quickly to transition from crewed-vessel multibeam survey operations toward autonomous platforms, given uncertainty over whether autonomous-collected data would meet its own charting accuracy standards and international hydrographic data-sharing requirements, while balancing capital constraints typical of a mid-sized national agency, while managing procurement timelines against limited internal technical evaluation capacity.
MMA APPROACH
MMA benchmarked the client's procurement roadmap against three comparable national hydrographic agencies pursuing autonomous transitions and modeled cost and coverage scenarios comparing continued crewed-vessel operations against phased autonomous platform adoption, incorporating primary interview data from manufacturers and agency procurement officers on qualification timelines. The analysis also benchmarked data validation timelines across three peer agencies pursuing similar transitions.
KEY FINDINGS
  1. The client's continued reliance on crewed-vessel-only survey operations left it covering meaningfully less exclusive economic zone area annually than peer agencies that had already adopted autonomous platforms.
  2. Qualifying an autonomous platform for the client's charting accuracy standards required roughly eighteen months of parallel data validation but ultimately matched crewed-vessel accuracy within acceptable tolerance.
  3. Peer agencies that had already secured autonomous platform framework agreements captured meaningful operating cost savings the client's current fleet structure could not access.
  4. Component supply exposure at the client's incumbent equipment supplier posed a greater near-term procurement risk than the autonomous qualification risk the client had originally prioritized in planning.
CLIENT PROFILE
The client is a national hydrographic survey agency responsible for charting its country's exclusive economic zone, with an annual equipment procurement budget in the low tens of millions of dollars (client-reported, unverified by MMA). The client faced pressure to modernize its aging crewed-vessel survey fleet while managing budget constraints and growing autonomous platform vendor options.
STRATEGIC CHALLENGE
The client needed to decide how quickly to transition from crewed-vessel multibeam survey operations toward autonomous platforms, given uncertainty over whether autonomous-collected data would meet its own charting accuracy standards and international hydrographic data-sharing requirements, while balancing capital constraints typical of a mid-sized national agency, while managing procurement timelines against limited internal technical evaluation capacity.
MMA APPROACH
MMA benchmarked the client's procurement roadmap against three comparable national hydrographic agencies pursuing autonomous transitions and modeled cost and coverage scenarios comparing continued crewed-vessel operations against phased autonomous platform adoption, incorporating primary interview data from manufacturers and agency procurement officers on qualification timelines. The analysis also benchmarked data validation timelines across three peer agencies pursuing similar transitions.
KEY FINDINGS
  1. The client's continued reliance on crewed-vessel-only survey operations left it covering meaningfully less exclusive economic zone area annually than peer agencies that had already adopted autonomous platforms.
  2. Qualifying an autonomous platform for the client's charting accuracy standards required roughly eighteen months of parallel data validation but ultimately matched crewed-vessel accuracy within acceptable tolerance.
  3. Peer agencies that had already secured autonomous platform framework agreements captured meaningful operating cost savings the client's current fleet structure could not access.
  4. Component supply exposure at the client's incumbent equipment supplier posed a greater near-term procurement risk than the autonomous qualification risk the client had originally prioritized in planning.
RECOMMENDED STRATEGY
Phase 1: Phase 1 (Months 1 to 5): Initiate parallel data validation testing with an autonomous platform vendor alongside existing crewed-vessel survey operations. Phase 2: Phase 2 (Months 6 to 12): Validate autonomous platform accuracy against agency charting standards and begin phased fleet transition planning. Phase 3: Phase 3 (Months 13 to 18): Formalize a hybrid crewed and autonomous fleet structure weighted toward autonomous coverage for routine survey work.
OUTCOME
Within eighteen months of implementation, the client qualified an autonomous survey platform and began transitioning a meaningful share of routine survey coverage away from crewed-vessel-only operations. Client-reported annual survey coverage area increased by an estimated 24% over the following year, though this figure is client-reported and unverified by MMA.

Frequently Asked Questions

Foundational context covering the market sizes, CAGR, scope, country, region and competition that inform every finding below. This section is provided to cover basics and most often pre-purchase conversations, answered from the MMA Primary Research Dataset.

What is the current size of the Seabed Mapping and Imaging Market?

The global seabed mapping and imaging market reached an estimated $2.1 billion in 2025. Multibeam echosounder systems account for the largest share of that volume.

How large will the Seabed Mapping and Imaging Market be by 2036?

MMA forecasts the market will reach approximately $5.21 billion by 2036. That represents a 2.28x expansion over the 2026 base value across the ten-year forecast period.

What is the CAGR for the Seabed Mapping and Imaging Market 2026 to 2036?

The base case forecast CAGR is 8.6%, with a bull case of 9.8% and a bear case of 7.3% depending on offshore wind investment and autonomous platform adoption pace.

Which segment is growing fastest?

Autonomous Underwater and Surface Vehicle Mapping Platforms is growing fastest at a 14.8% CAGR, roughly 1.72 times the overall market rate, as survey work shifts away from crewed vessels.

Who are the major companies in the Seabed Mapping and Imaging Market?

Kongsberg Discovery, Teledyne Marine, Exail Technologies, Sonardyne International, and L3Harris Technologies lead the market. Together the top five hold an estimated 42% of global equipment revenue.

Which country is growing fastest?

India leads growth as its naval hydrographic modernization program and expanding offshore energy sector both scale sensor procurement, growing at an estimated 12.4% CAGR through 2036.

Report Segmentation Architecture

The full report scope spans multiple orthogonal segmentation dimensions, with cross-tabulated demand data provided for each dimension pair. Coverage extends further to regional breakdowns, trend trajectories, and the competitive detail needed to support segment-level decision-making.

By Sensor and Platform Technology

  • Multibeam Echosounder Systems
  • Side-Scan and Synthetic Aperture Sonar
  • Autonomous Underwater and Surface Vehicle Platforms
  • Positioning and Navigation Systems
  • Sub-Bottom Profilers
  • Seabed Mapping and Processing Software

By End-Use Industry

  • Offshore Wind and Energy
  • Defense and Naval Hydrography
  • Government Charting and Mapping Agencies
  • Marine Construction and Cable Route Survey
  • Seabed Mining and Geotechnical Survey

By Commercial Dimension

  • Government Framework Agreements
  • Offshore Developer Direct Partnerships
  • Competitive Tender Purchasing
  • Equipment Leasing and Survey-as-a-Service

By Region

  • North America
  • Western Europe
  • East Asia
  • South Asia and Pacific
  • Latin America
  • Middle East and Africa
  • Eastern Europe

Scope, Methodology, and Coverage

Every figure in this report is reproducible from documented input assumptions. The scope below maps the historical period, the forecast horizon, the segmentation dimensions, and the countries covered, alongside the underlying primary and qualitative methodology.
Historical Period
2020 to 2025
Forecast Period
2026 to 2036
Base Year
2025 (USD billions; MMA Primary Research Dataset, August 2026)
Market Definition
This report covers multibeam echosounders, side-scan and synthetic aperture sonar, autonomous vehicle mapping platforms, positioning and navigation systems, sub-bottom profilers, and seabed mapping processing software sold for hydrographic, offshore energy, defense, and marine spatial planning applications. It excludes the survey vessels themselves and third-party survey services performed using this equipment.
Quantitative Units
USD billions (current prices); number of survey-grade systems shipped where disclosed
Segmentation Dimensions
By Sensor and Platform Technology; By End-Use Industry; By Commercial Dimension; By Region
Regions Covered
North America, Western Europe, East Asia, South Asia and Pacific, Latin America, Middle East and Africa, Eastern Europe
Countries Covered
USA, China, Germany, France, UK, Japan, South Korea, India, Australia, Canada, Brazil, Mexico, Indonesia, Vietnam, Thailand, Malaysia, UAE, Saudi Arabia, South Africa, Nigeria, Norway, Poland, Netherlands, Italy, Spain, Sweden, Switzerland, Argentina, Guyana, Singapore, and additional markets relevant to this sector
Key Companies Profiled
Kongsberg Discovery AS, Teledyne Marine, Exail Technologies, Sonardyne International Ltd., L3Harris Technologies Inc., R2Sonic LLC, Norbit Subsea AS, EdgeTech, Saab Seaeye Ltd., Ocean Infinity Group Ltd., QPS BV, Wartsila ELAC Nautik GmbH, Applied Acoustics Engineering Ltd., Valeport Ltd., Fugro N.V., Hydroid Inc., Klein Marine Systems Inc., Chesapeake Technology Inc., Innomar Technologie GmbH, Kraken Robotics Inc.
Quantitative Methodology
Primary survey, n=3,800 respondents, Q4 2025, six countries; demand-side model with trade association cross-validation
Qualitative Methodology
47 expert interviews, Q4 2025; applied to validate demand model assumptions, identify emerging dynamics, and assess competitive positioning
Report Format
PDF and XLSX data workbook (Word format preview document)
Publisher
Market Minds Advisory
Report Code
MMA-2026-TEC-158
Published
August 2026
Contact
sales@marketmindsadvisory.com | www.marketmindsadvisory.com

Purchase the full Seabed Mapping and Imaging Market Report (2026 to 2036).

The full report delivers an assessment of the global seabed mapping and imaging market across all six sensor and platform technology segments and seven world regions through 2036. It includes competitive profiling of twenty active manufacturers, primary survey data from procurement and engineering decision-makers, and a dedicated deep-dive on autonomous platform qualification timelines. Buyers receive access to underlying segment and regional data tables alongside the full narrative analysis, supporting both procurement planning and supplier evaluation decisions. The report also benchmarks revenue lever adoption and input cost exposure across the top twenty profiled companies, drawing on MMA's primary survey of 3,800 respondents and 47 expert interviews conducted in Q4 2025.
Twenty-company competitive profiling and margin benchmarking
Six-segment sensor technology forecast data and tables
Seven-region demand and CAGR breakdown data
Autonomous platform qualification timeline deep-dive overview
Precision electronics supply chain risk assessment
Primary interview data from procurement decision-makers

Built For The People Who Decide

From boardroom strategy to bench-side execution, this report is read cover-to-cover by leaders shaping the next decade of their industry, turning demand scenarios, market dynamics and valuation benchmarks into decisions.
CXOs/ Presidents/ VPs/ Managers
M&A and Corporate Development
Strategy Teams and R&D Heads
Procurement and Product Directors
Regulatory and Compliance Leaders
Investor Relations and Equity Analysts