Market Minds Advisory
Satellite Payloads Market

Satellite Payloads Market: Satellite Payloads Market: Launch Cost Collapse, Qualification Economics and What Buses Now Carry 2026 to 2036

Launch cost fell by roughly an order of magnitude and the payload did not follow. The instrument is now the expensive part of a satellite, which reverses how this industry priced everything.

Lead Analyst

Published

September 2026

Make Smarter Decisions with Customized Research Insights

Request a free sample report and evaluate market opportunities, growth trends, and competitive dynamics relevant to your business needs.

2025 MARKET VALUE$18.9BMarket Size 2025
2036 FORECAST VALUE$68.6BBase Case , 2026 to 2036
CAGR 2026 TO 203612.4 %Bull 13.7% / Bear 11.2%
INCREMENTAL OPPORTUNITY$47.3BNet 10- year value creation
EXPANSION MULTIPLE3.22x2036 value over 2026 base
Strategic Levers
M&A Pipeline
Regional Outlook
Country Rankings
Competitive Intelligence
Segmental Deep-dive
Call-Us : 91 93563 13602

Executive Snapshot and Market Trajectory.

Launch cost fell by roughly an order of magnitude across a decade and payload cost did not follow it down. The instrument is now the expensive part of a satellite, which reverses how this industry priced everything. Designers are still shaving grams.
The market reaches USD 21.3 billion in 2026 and USD 68.6 billion by 2036, a 3.22 times expansion at 12.4% annually. Electronically steered communications payloads grow at 18.6%, half again the market rate of 12.4%, because a constellation needs beams that move without moving hardware. North America holds 34% of payload revenue, above the usual band, and India compounds fastest at 20.1% on sovereign programmes. Both rest on payload revenue.
Five suppliers hold 51% of payload manufacturing revenue, and the concentration reflects qualification history rather than any manufacturing advantage. Airbus Defence and Space, Thales Alenia Space, L3Harris Technologies, Northrop Grumman and Maxar lead. Space qualification takes around 29 months, which protects incumbents better than technology does. Airbus and Thales built theirs across decades of agency work. None of that changed much across the past decade. Very little of that has moved. Concentration has barely shifted.
Market Definition
This report covers satellite payloads by instrument class: electronically steered communications payloads, mechanically steered and fixed communications payloads, optical earth observation instruments, radar and microwave sensing payloads, navigation and timing payloads, and scientific and hosted instrument packages. It excludes satellite buses and platforms, launch vehicles and services, ground segment equipment and gateways, satellite operations and data services, and propulsion or power subsystems sold separately from any payload.
Base Year Value
$18.9B in 2025 (MMA Primary Research Dataset, September 2026)
Forecast Period
2026 to 2036, eleven discrete annual values
CAGR
12.4% base case. Bull 13.7%. Bear 11.2%.
Fastest Growth Segment
Electronically Steered Communications Payloads: 18.6% CAGR
Fastest Growth Country
India: 20.1% CAGR
Fastest Growth Region
South Asia and Pacific: 14.5% CAGR
Largest Region
North America: 34% of 2025 global value
Market Leaders
Airbus Defence and Space, Thales Alenia Space, L3Harris Technologies, Northrop Grumman and Maxar lead on satellite payload manufacturing revenue. Source: MMA Analysis.
Primary Survey
n=3,800 procurement and R&D decision-makers, Q4 2025, six countries
Methodology
Demand-side build-up, cross-validated against public data, 47 expert interviews

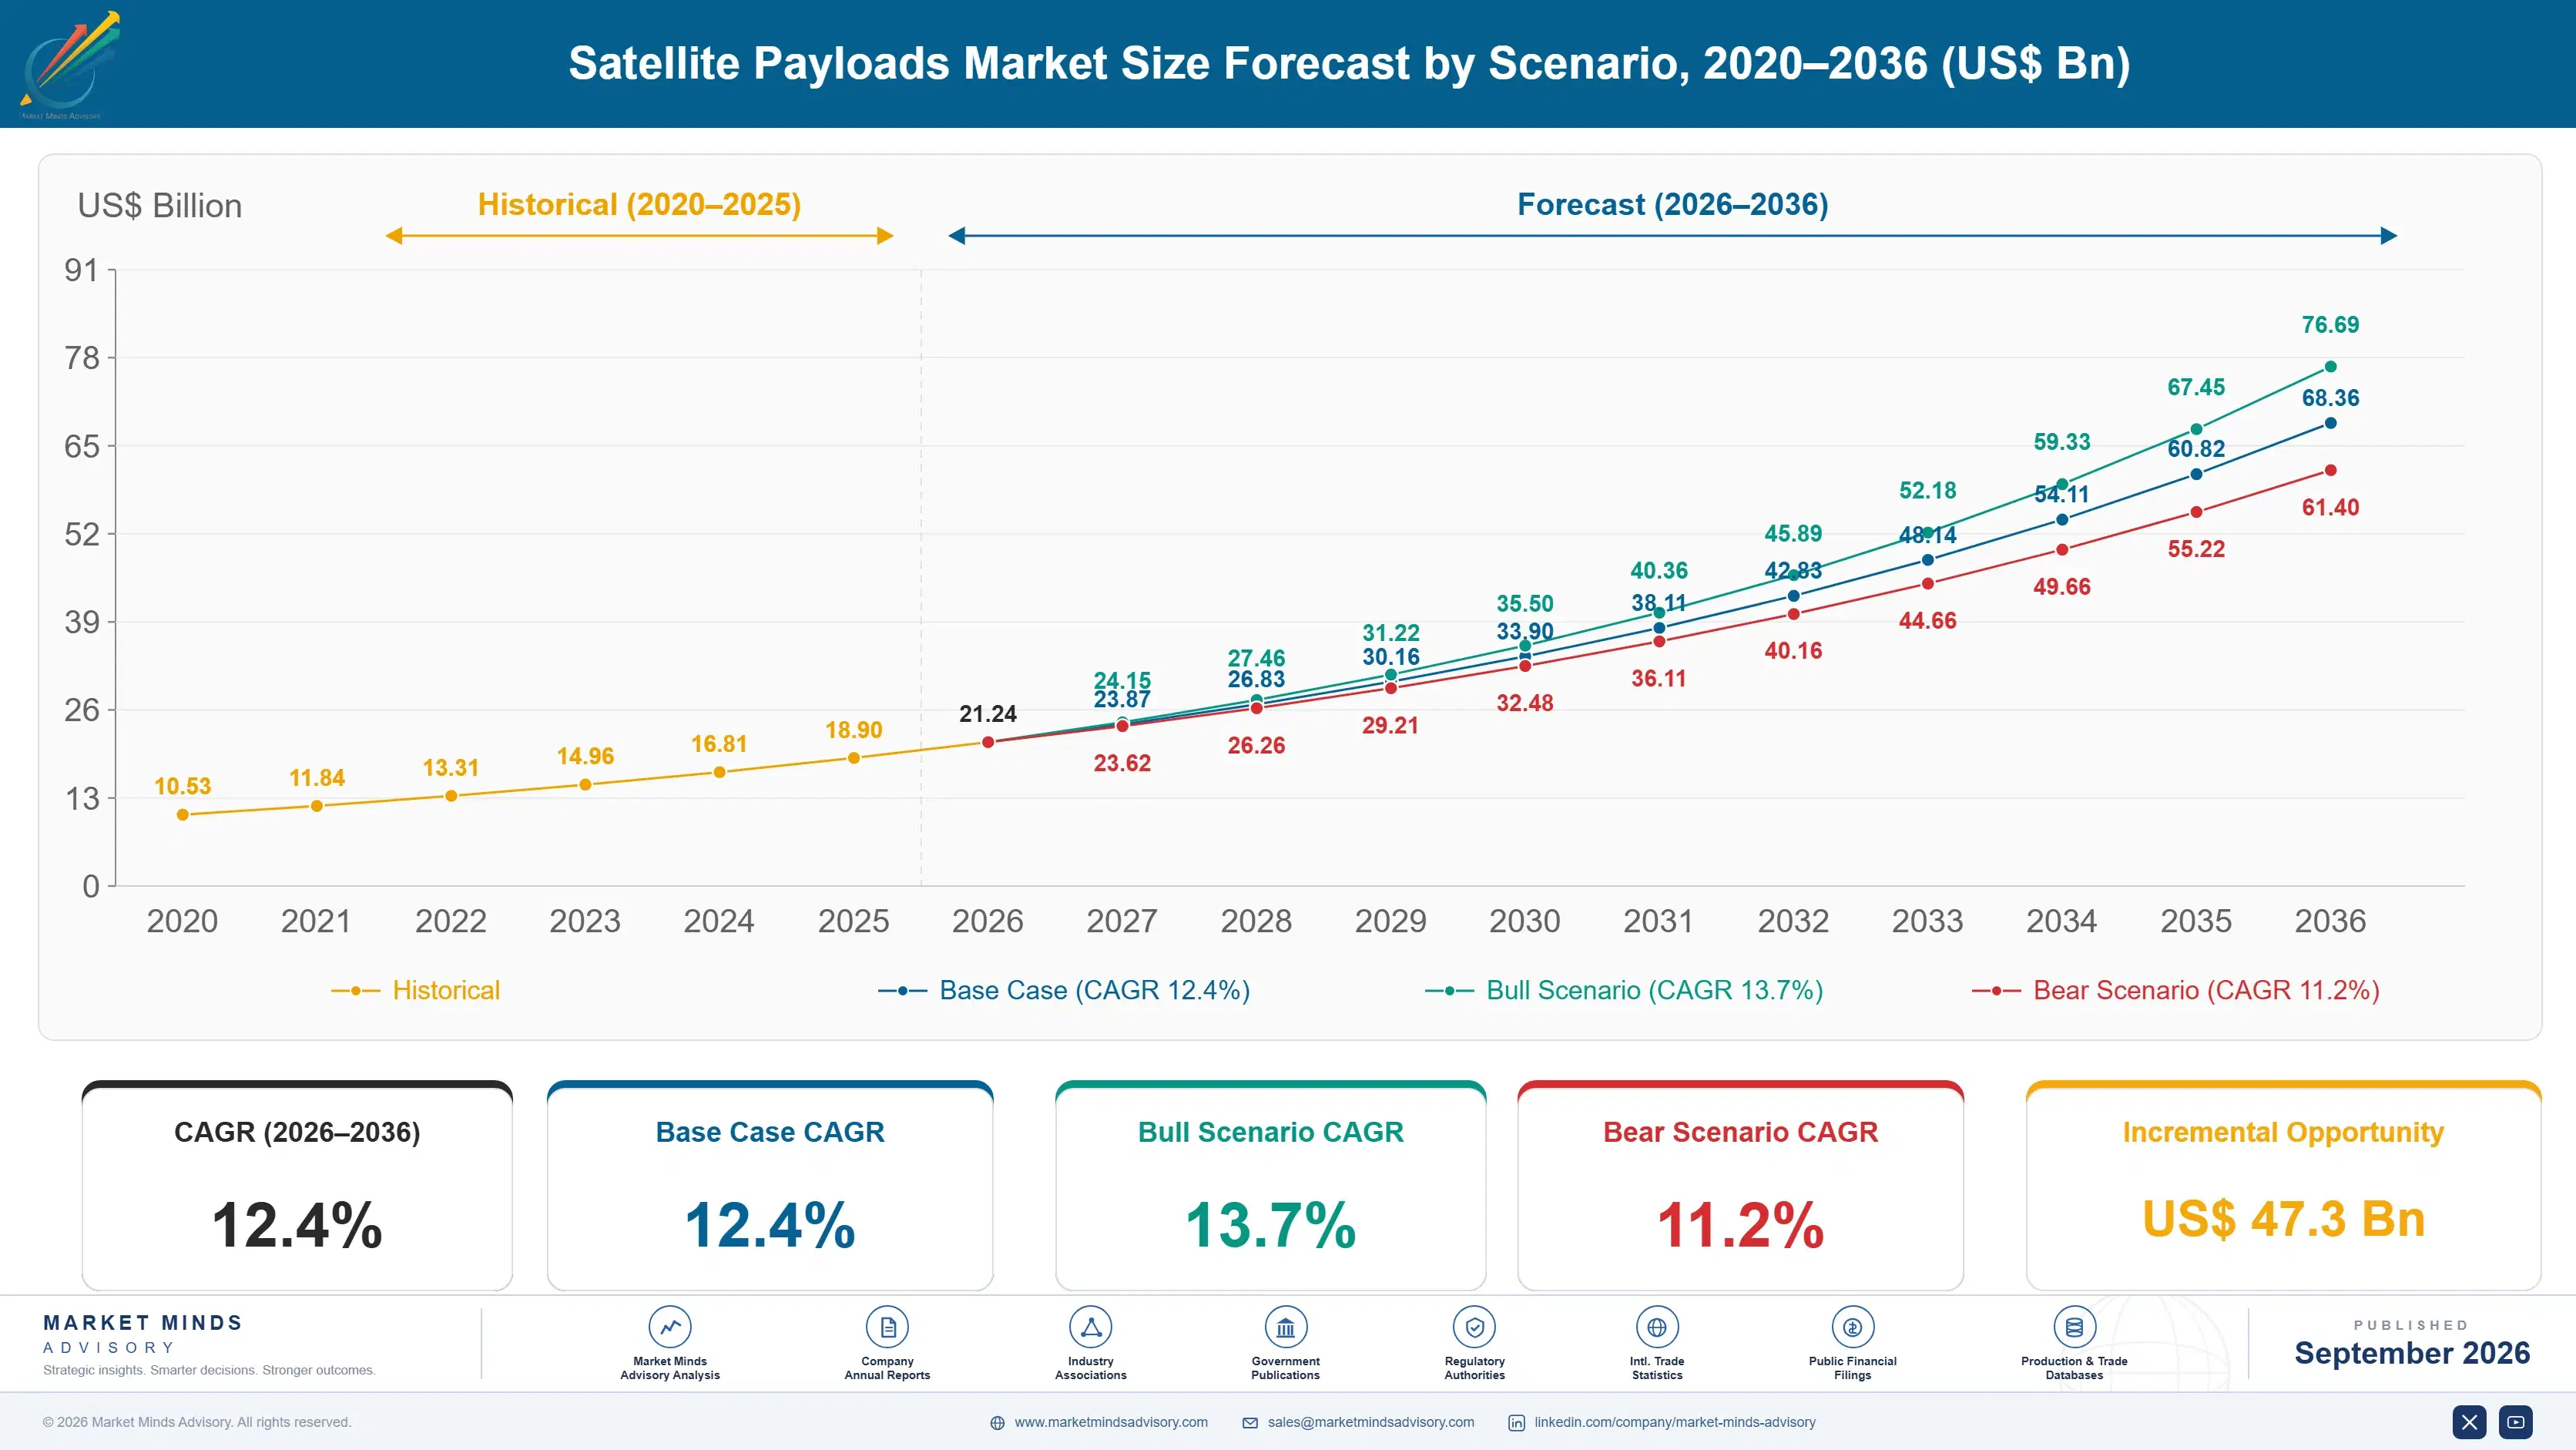
Satellite Payloads Market Forecast Scenarios

satellite-payloads-market-size-forecast-scenario-1789997538337
Between 2020 and 2025 the category compounded at 11.1%, and the change underneath was more interesting than the total. Launch became cheap enough that mass stopped being the binding constraint on mission design, which had governed every decision since this industry began. Payload cost did not fall correspondingly, so programme economics started turning on the instrument rather than on orbit access.
The base case holds 12.4% on three mechanisms. Communications constellations keep requiring electronically steered payloads that can serve moving coverage without mechanical pointing, which is a genuinely different product from anything geostationary programmes bought. Earth observation keeps commercialising as imagery buyers move from governments toward insurance, agriculture and finance. And sovereign programmes across India, the Gulf and Southeast Asia keep funding domestic payload capability rather than importing complete satellites. Each of those three runs independently of the others.
The bull case at 13.7% assumes constellation replenishment cycles arrive as scheduled, since a five year satellite life implies continuous payload demand rather than episodic programme buying. The bear case at 11.2% is constellation consolidation, where fewer operators than currently planned actually reach deployment and the aggregate payload requirement falls well short of announced ambition.

The Instrument Costs More

One ratio inverted and took the industry's whole planning logic with it. Cost per kilogram to orbit fell by roughly 91% across a decade while payload cost did not follow, which means the instrument now accounts for around 58% of programme cost. Mission designers who spent fifty years shaving grams to save launch money are now designing around instrument capability instead, and a good many organisations have not adjusted their procurement to match.
TOP FIVE CONCENTRATION51%Held by suppliers with qualification history rather than manufacturing advantage
PAYLOAD SHARE OF COST58%Satellite programme cost sitting in the instrument alone
SPACE QUALIFICATION PERIOD29 monthsFrom design freeze to flight qualified status for new hardware
CONSTELLATION SATELLITE LIFE5 yearsBefore low orbit spacecraft require replacement or deorbiting
LAUNCH COST REDUCTION91%Fall in cost per kilogram to orbit over a decade
HERITAGE REQUIREMENT SHARE73%Procurements requiring demonstrated flight history before any award
Qualification is what actually protects position here. Reaching flight qualified status takes around 29 months from design freeze, and roughly 73% of procurements require demonstrated flight heritage before anything can be awarded. That combination means a supplier with better technology and no flight history frequently cannot bid at all, which is an unusual competitive structure and one that explains most of the concentration in this market.
Constellations changed the demand pattern more than the technology. A five year satellite life across a large constellation implies continuous replenishment rather than the episodic programme buying that geostationary work involved, and electronically steered payloads serving moving coverage are a genuinely different product from the fixed beams that geostationary missions specified. Those payloads grow at 18.6% against 12.4% for the market.
"For fifty years everybody in this business optimised mass because launch was the expensive part. Launch got cheap and almost nobody rewrote their design rules. You still see programmes agonising over a kilogram while accepting an instrument that costs more than the rocket."
Director, Space Systems and Payload Technology Practice · MMA Technology Practice · September 2026

Market Trends

Constellations Require Beams That Move Electronically

A satellite in low orbit passes over any given point in minutes, so a constellation must steer coverage continuously in a way that geostationary missions never had to consider at all. Electronically steered payloads deliver that without moving any hardware, which matters enormously across a five year design life with no maintenance possible. Electronically steered communications payloads grow at 18.6% against 12.4% for the market. That is a genuinely different product from the fixed beam instruments that geostationary programmes specified for decades. Suppliers holding mechanical steering heritage find that it transfers into phased array work barely at all.
Market Impact: India compounds at 20.1% annually
Flight Heritage Requirements Exclude Better Technology

Roughly 73% of payload procurements require demonstrated flight history before any award can be made, and reaching qualified status takes around 29 months from design freeze even once somebody funds it. That combination means a supplier with materially better technology and no heritage frequently cannot bid at all, regardless of what the instrument would actually do. It is an unusual competitive structure and it explains most of the concentration, since heritage accumulates only through flying and flying requires winning first. Better technology loses to demonstrated history more often in this market than in almost any other.
Market Impact: Optical instruments grow at 13.1%

Market Opportunities and Growth Drivers

Sovereign Programmes Fund Domestic Payload Capability

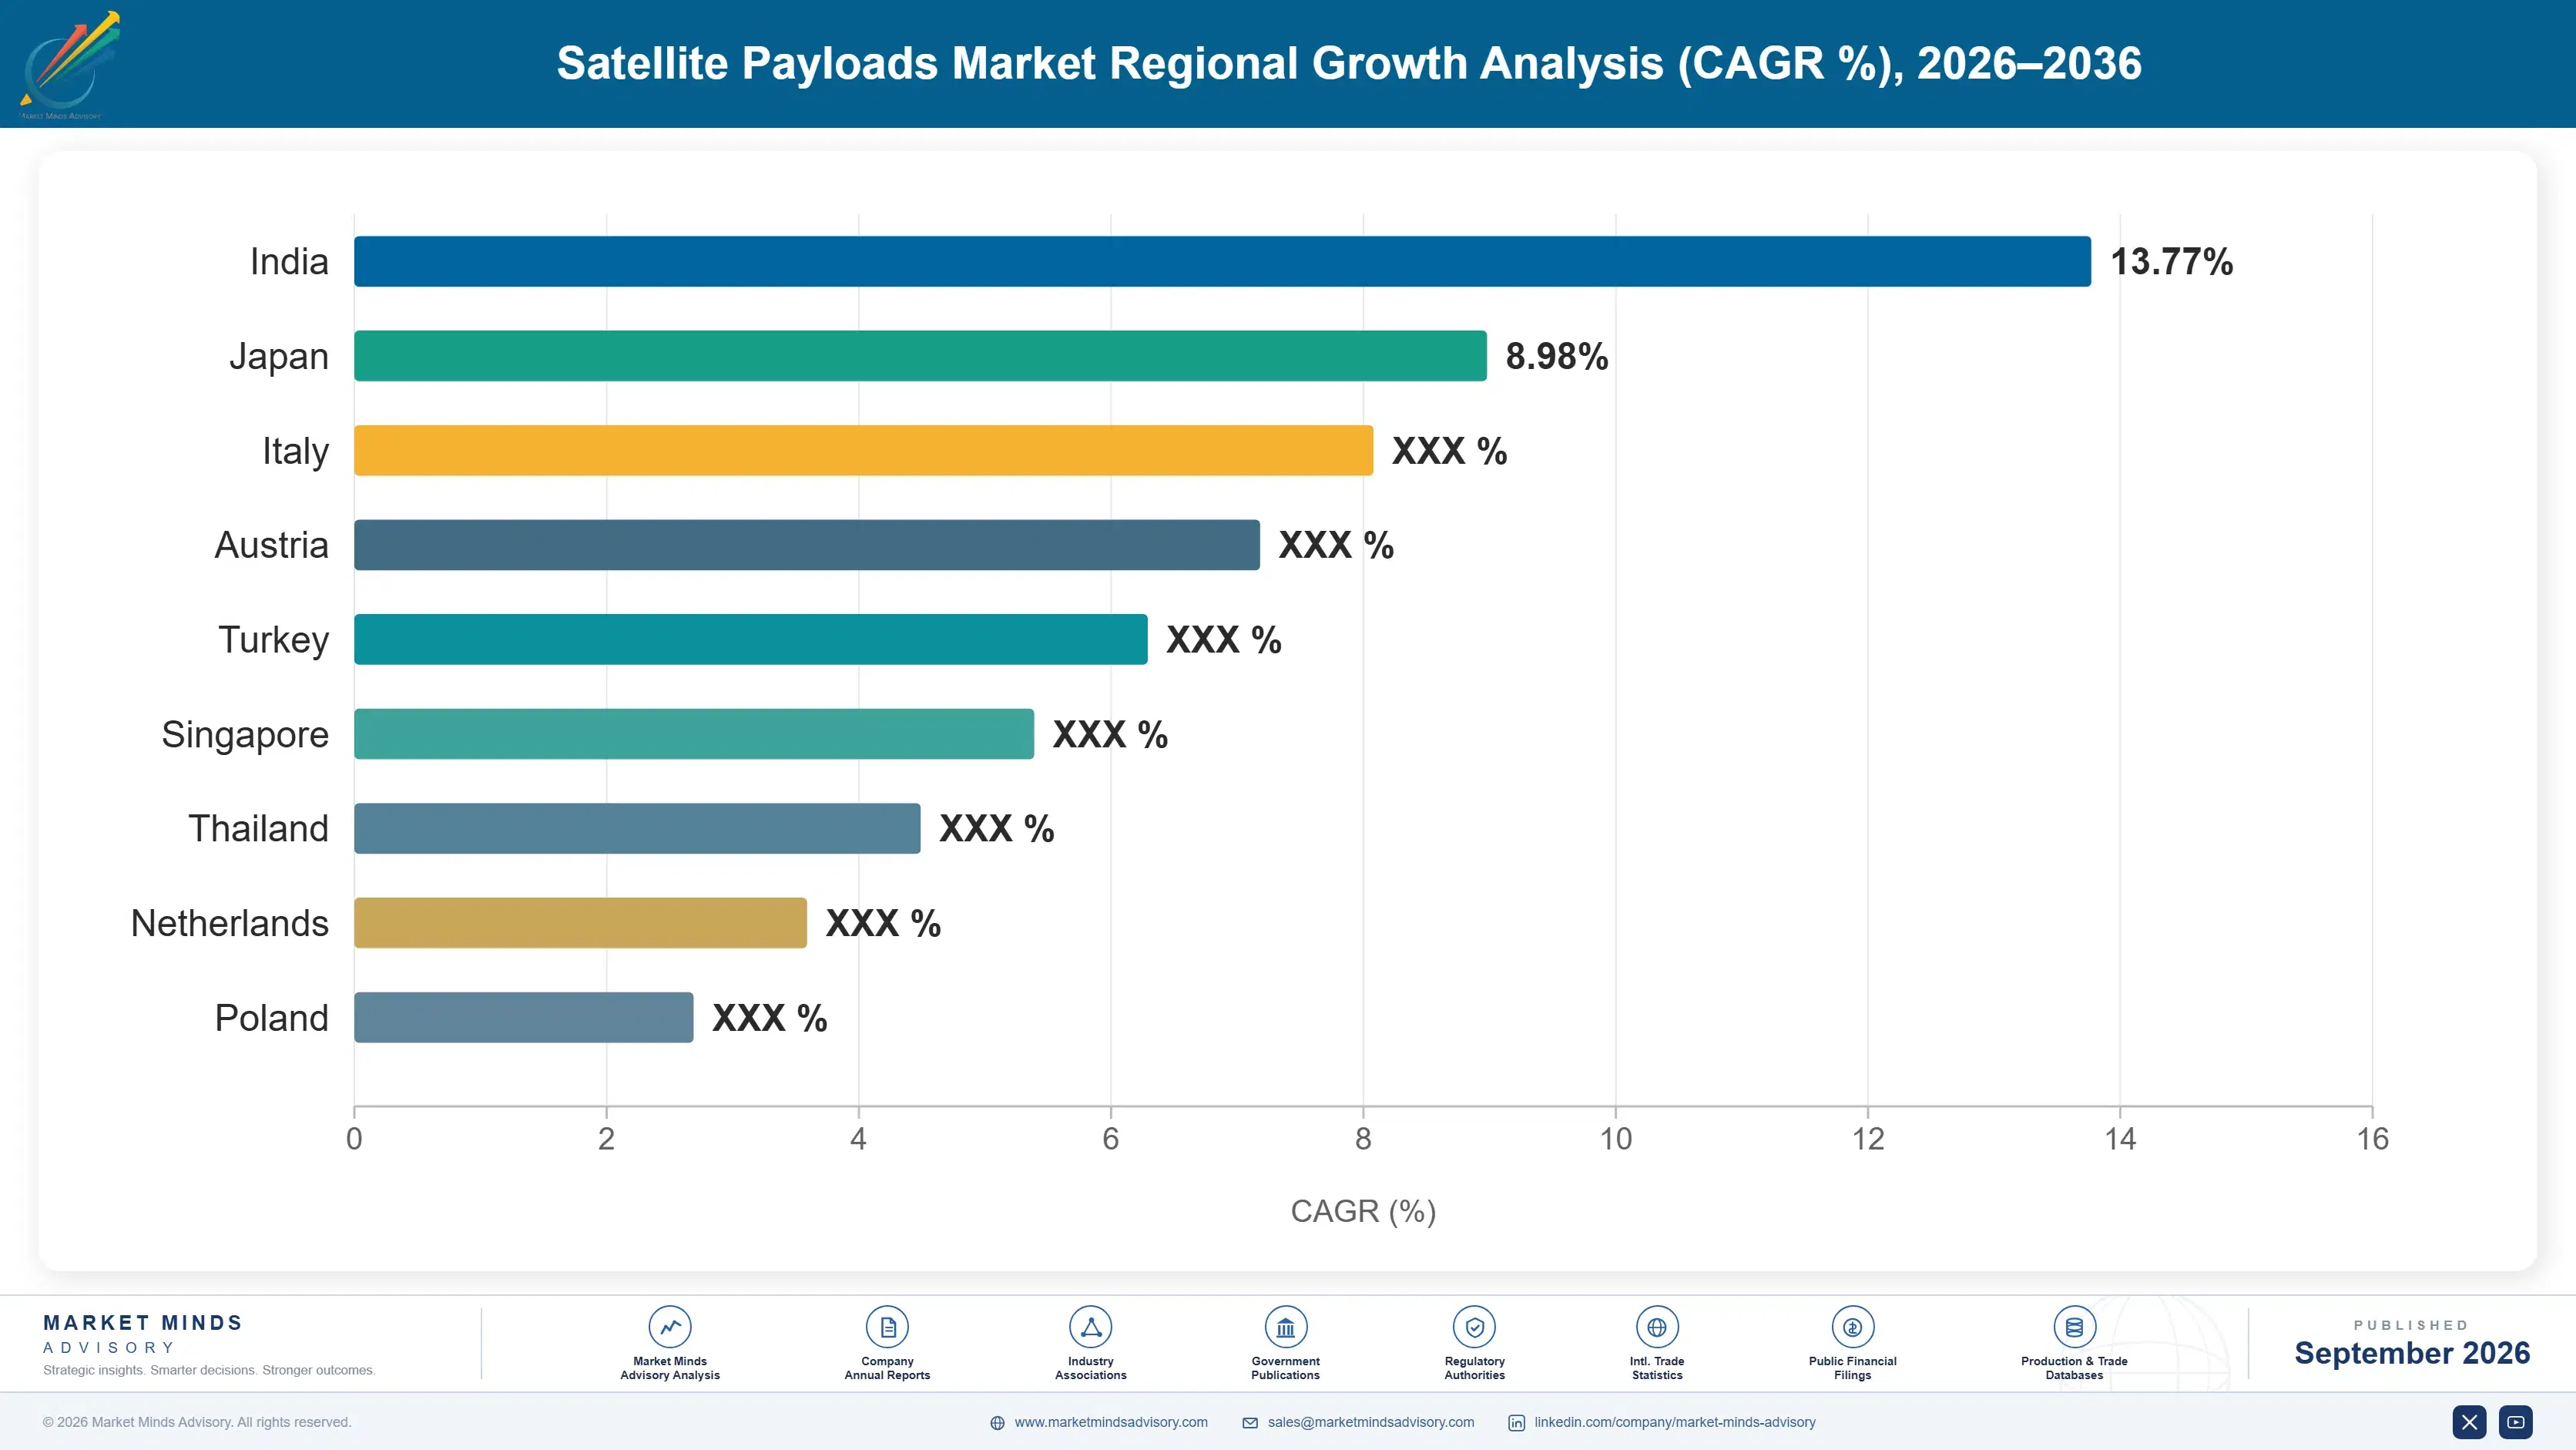
India compounds at 20.1%, faster than any other market, on national programmes funding domestic payload development rather than importing complete satellites from established suppliers abroad. Gulf states and several Southeast Asian governments are pursuing comparable capability for reasons that are as much industrial as strategic. Those buyers procure instrument development alongside technology transfer and local manufacturing, which is a different commercial arrangement from any straightforward payload sale and considerably more demanding to negotiate. Established suppliers who decline those terms find the programmes closed to them entirely, and successive national programmes then follow the same route.
Market Impact: Qualification consumes 29 months

Observation Buyers Shift From Government To Commerce

Earth observation imagery is increasingly bought by insurance underwriters, agricultural operations and financial analysts rather than by defence and civil agencies alone, which changes what payloads must actually deliver. Commercial buyers want revisit frequency and consistency more than they want ultimate resolution, and those are different instrument design decisions with different cost implications. Optical earth observation instruments grow at 13.1% as constellation operators specify for commercial demand rather than for government specifications written decades ago. That shift has opened room for suppliers who never held any defence imaging position at all.
Market Impact: Design life runs just 5 years

Market Restraints and Challenges

Qualification Timelines Delay Any Genuine Innovation

Reaching flight qualified status takes around 29 months from design freeze, and roughly 73% of procurements will not consider anything lacking demonstrated heritage regardless of capability. The root cause is that a payload cannot be repaired once launched, so buyers reasonably prefer what has already worked. Commercially this slows technology adoption severely. Mitigation runs through hosted payload flights that build heritage cheaply, through in-orbit demonstration missions, and through modular architectures where qualified subsystems carry forward into new instruments. None of those routes removes the delay; they only make it survivable for a supplier without a prime contract.
Market Impact: Satellites last only 5 years

Constellation Ambition Exceeds Deployment Reality Repeatedly

Announced constellation plans imply payload demand well above what has historically been deployed, and a considerable share of those programmes will not reach orbit at all. The root cause is that capital availability and regulatory approval both constrain deployment more tightly than technical capability does. Commercially this creates forecast risk that has caught suppliers out before. Mitigation runs through diversification across observation, navigation and scientific payloads, and through capacity planning that assumes attrition rather than announced ambition. Capacity built against announced plans has stranded suppliers before, and it will again.
Market Impact: Some 73% demand flight heritage
4 additional market trends, 3 additional growth drivers, and 2 additional restraints and challenges are covered in the full report. Contact sales@marketmindsadvisory.com to access the complete intelligence.

Segment CAGR and Growth Architecture

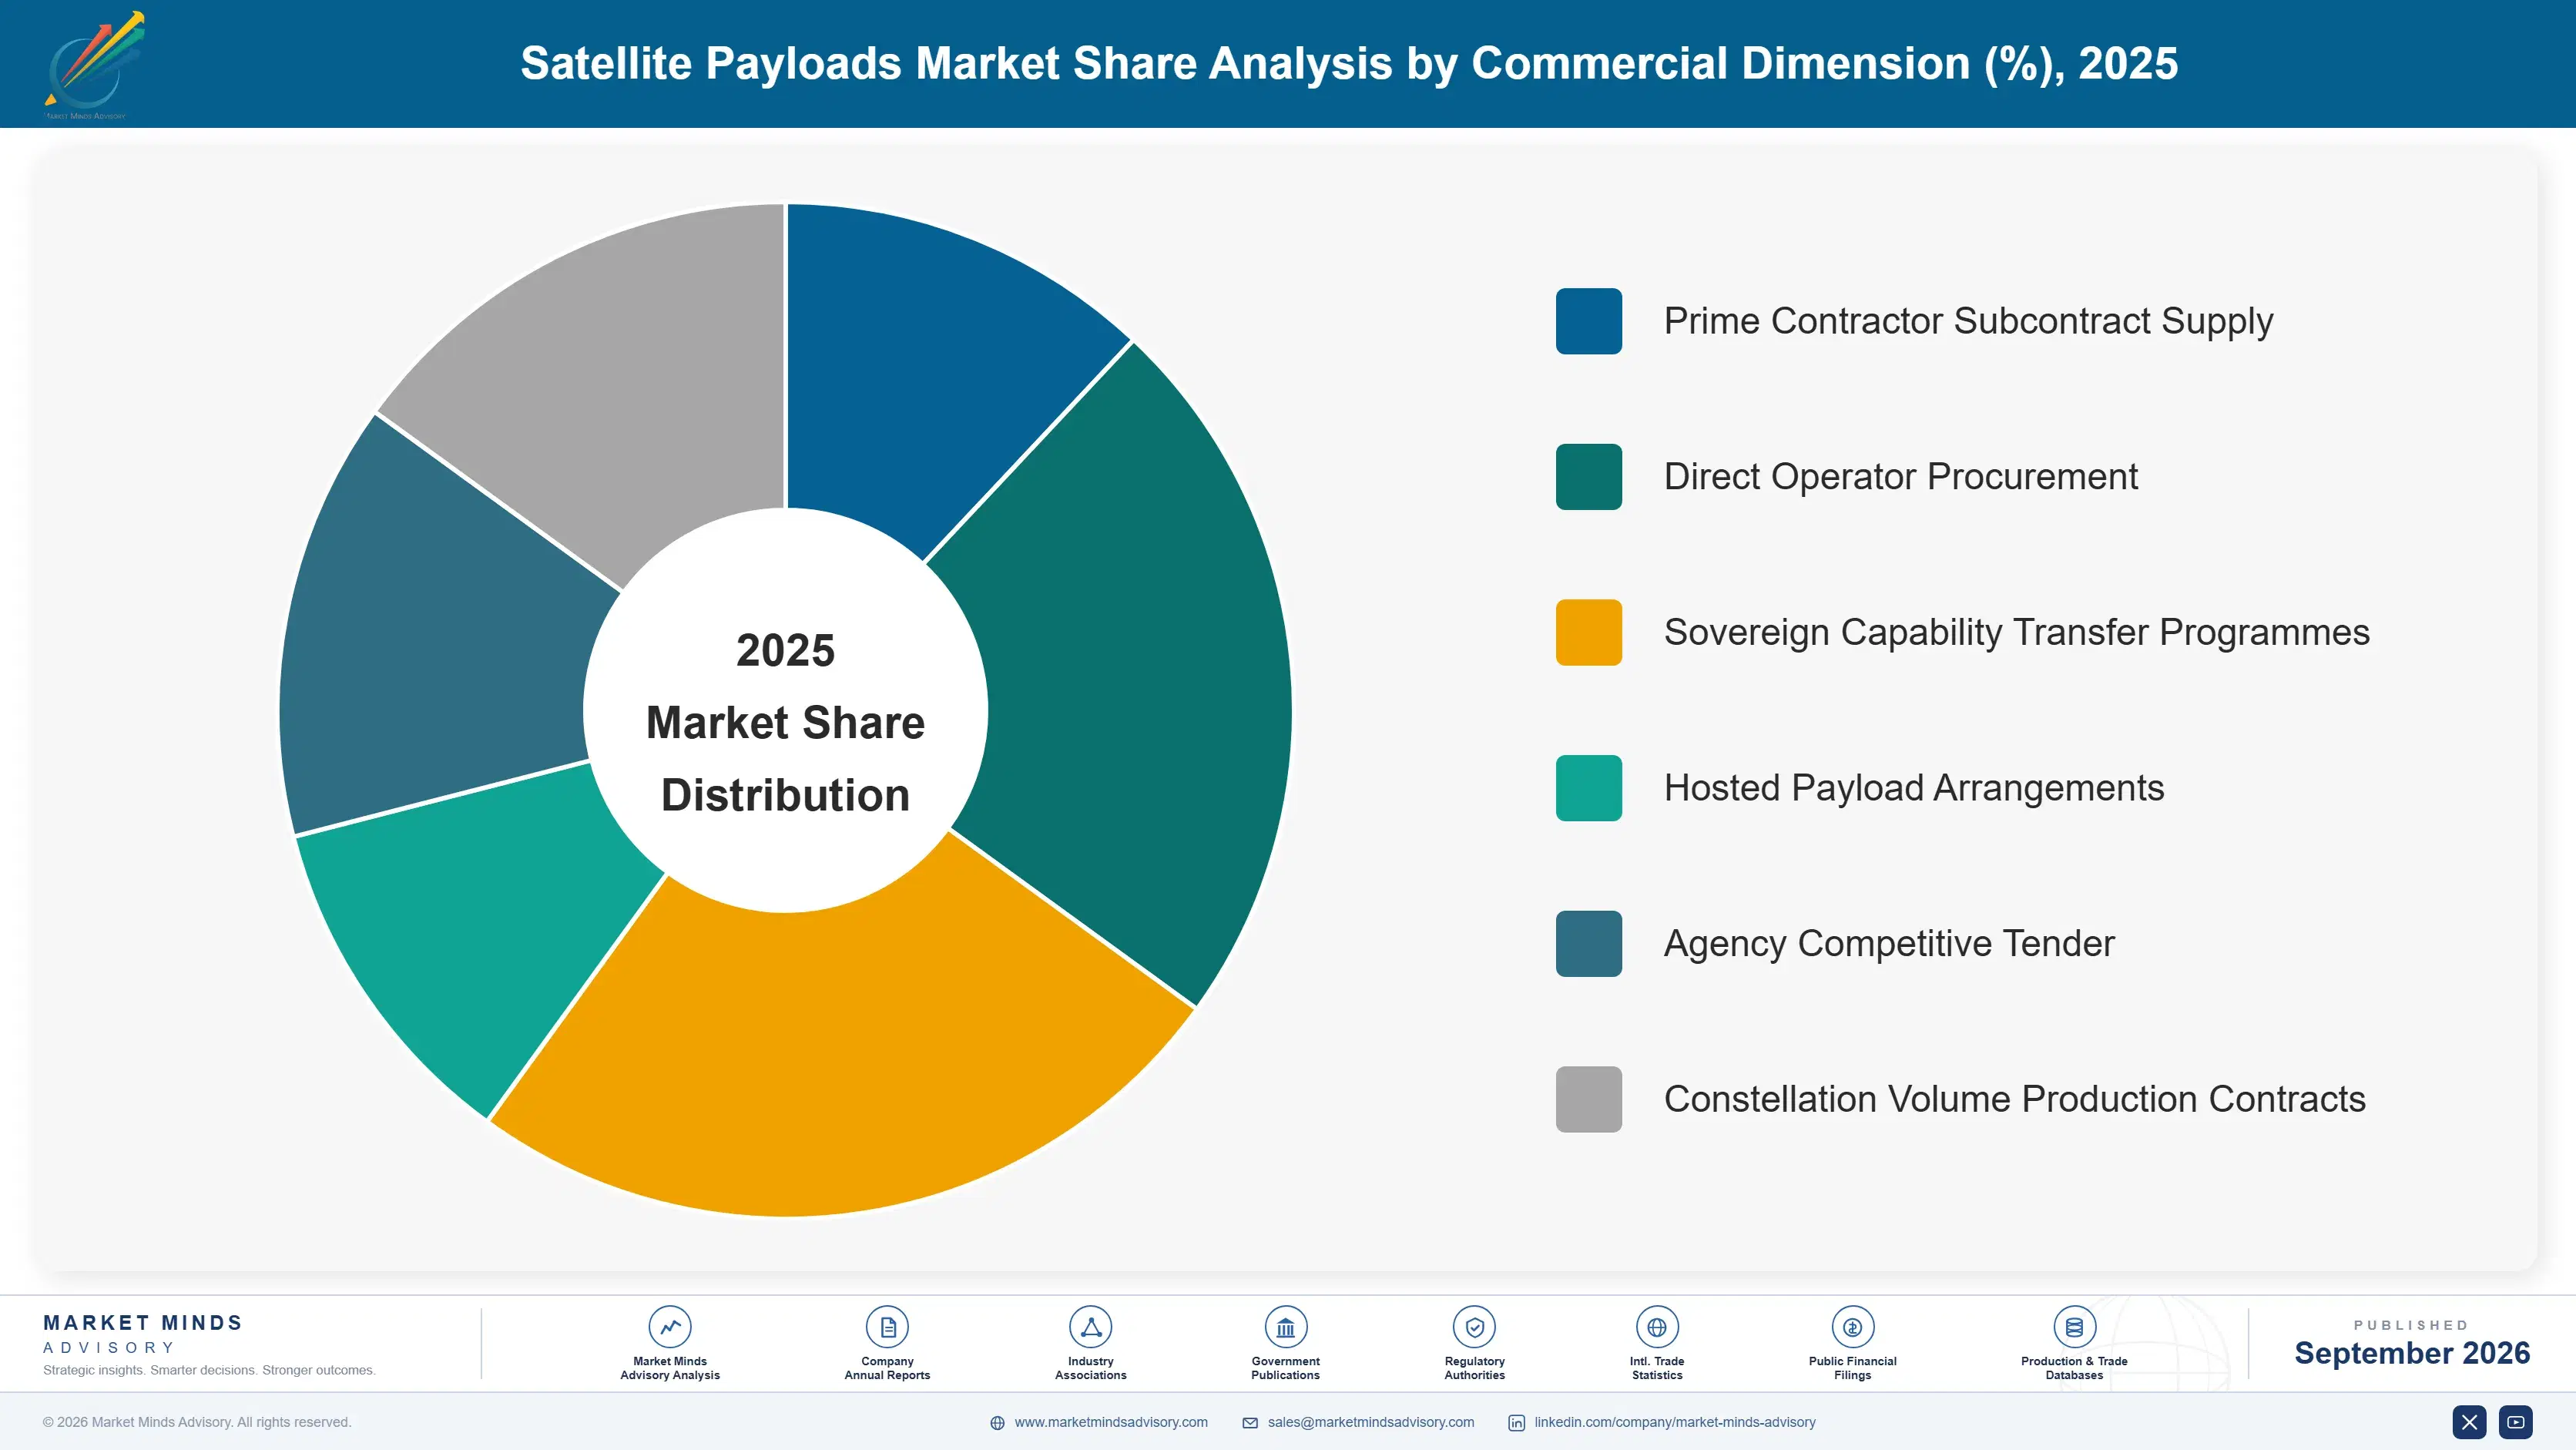
Segmentation follows instrument class, since each carries different qualification burden, different buyer behaviour and quite different exposure to constellation versus programme demand. Six classes cover the market, spanning electronically steered communications, mechanically steered communications, optical observation, radar sensing, navigation payloads and scientific packages. Orbit type and procurement route are separate dimensions handled elsewhere in this report.
satellite-payloads-market-market-share-analysis-1789997538874

Electronically Steered Communications Payloads

Electronically steered communications payloads grow at 18.6%, half again the market rate of 12.4%, because a satellite in low orbit passes over any point within minutes and coverage has to follow users continuously rather than staying fixed. Steering electronically rather than mechanically matters enormously across a five year design life with no possibility of maintenance or repair once launched. These are genuinely different instruments from the fixed beam payloads geostationary programmes specified for decades, and the suppliers who built heritage in one do not automatically hold any position in the other at all. Phased array engineering is what separates them, and mechanical steering experience transfers into it barely at all.
CAGR 18.6%

Optical Earth Observation Instruments

Optical earth observation instruments compound at 13.1% as imagery buyers shift from defence and civil agencies toward insurance, agriculture and financial analysis. Those commercial buyers want revisit frequency and consistency considerably more than they want ultimate spatial resolution, which are different design decisions carrying different cost implications entirely. Constellation operators now specify against commercial demand rather than against government requirements written decades earlier for entirely different purposes. That shift has opened space for suppliers who never held any defence imaging heritage and could not previously compete at all. Revisit frequency is now specified more tightly than resolution on most commercial constellation programmes, which reverses how these instruments were traded off for decades.
CAGR 13.1%
Full segment breakdown across 6 segments available in the complete report.

Regional Architecture and Country Demand Map

North America holds 34% of payload revenue, above the usual band, because constellation deployment, defence programmes and commercial observation all concentrate there together. Western Europe follows at 24% on institutional programmes and established instrument capability. East Asia takes 19% on sovereign capability, while India drives the fastest regional growth.

North America

North America takes 34% of payload revenue, above the 32% band ceiling, because constellation deployment, defence programmes and commercial earth observation all concentrate within the same jurisdiction and reinforce one another. Constellation replenishment across a five year satellite life produces continuous payload demand rather than episodic programme buying, which no other region matches at anything like this scale. L3Harris Technologies, Northrop Grumman and Maxar all operate here. Growth at 12.8% sits above the global rate on constellation volume rather than on any institutional programme expansion. Commercial observation operators here increasingly build instruments internally rather than procuring them, which removes demand rather than redirecting it. Defence programmes here also fund instrument development that eventually reaches commercial work.
Share: 34% | CAGR: 12.8% (2026 to 2036)

Western Europe

Western Europe accounts for 24% of payload revenue, where institutional programmes and long-established instrument capability both sit rather than any constellation volume. Airbus Defence and Space and Thales Alenia Space between them hold genuine heritage across communications, observation and scientific instruments accumulated over decades of agency work. European programmes procure through arrangements that distribute work across member states, which shapes supplier selection independently of pure capability. Growth at 11.0% is the slowest of any region, on institutional funding cycles rather than any commercial constellation demand. Constellation replenishment work sits largely outside the region, which is why growth trails despite genuine instrument depth. Scientific instrument work remains a genuine regional strength that revenue share understates badly.
Share: 24% | CAGR: 11.0% (2026 to 2036)
Regional intelligence for 5 additional markets available in the complete report: East Asia, South Asia and Pacific, Latin America, Middle East and Africa, Eastern Europe. Contact sales@marketmindsadvisory.com.
satellite-payloads-market-country-cagr-analysis-1789997539426

Where Payload Programmes Are Won

Launch stopped being the expensive part and nobody rewrote the design rules, heritage requirements exclude better technology from most procurements entirely, and sovereign buyers want capability transfer rather than instruments. The four levers below follow those conditions rather than any argument about instrument performance. Each addresses a commercial condition rather than an engineering one.

Build Heritage Through Hosted And Demonstration Flights

Roughly 73% of procurements require demonstrated flight history and qualification takes around 29 months, which means a supplier with better technology and no heritage frequently cannot bid at all. Hosted payload slots and in-orbit demonstration missions build that heritage at a fraction of what a dedicated programme costs. Suppliers waiting for a prime contract to establish heritage are waiting for something the heritage requirement prevents them from winning, which is a circle that only deliberate demonstration flying breaks. Budget spent on further bid discounting reaches nothing at all until that heritage exists.
Market Impact: Flight heritage now gates fully 73% of procurements

Design Against Instrument Cost Not Launch Mass

Cost per kilogram to orbit fell roughly 91% across a decade while payload cost did not follow, so the instrument now represents around 58% of programme cost. Mission designs still optimising mass are saving the cheap resource while accepting expense in the expensive one. Suppliers who reframe the conversation around instrument cost per unit of capability reach a programme office that has usually not yet updated its own trade study assumptions from an earlier era. That conversation reframes a competition the supplier was otherwise going to lose on mass. Mass optimisation saves the cheap resource entirely.
Market Impact: Payload carries a full 58% of programme cost

Serve Replenishment Rather Than Programme Buying

A five year satellite life across a large constellation implies continuous payload demand rather than the episodic buying that geostationary programmes involved, which is a completely different manufacturing and commercial rhythm. Suppliers organised around bespoke instruments for individual missions cannot serve it at the rates or volumes required. Those organised around repeatable production with qualified designs can, and the revenue is recurring rather than arriving once every decade with a programme award. A constellation of 500 satellites on a 5 year life implies continuous annual demand rather than one award.
Market Impact: Constellation replenishment now recurs every single 5 years

Offer Capability Transfer To Sovereign Programmes

India compounds at 20.1% and Gulf programmes are funding domestic payload capability rather than importing complete satellites from anybody. Those buyers procure instrument development alongside technology transfer and local manufacturing, which is a more demanding arrangement than any straightforward sale and one many established suppliers decline. Suppliers willing to structure that properly reach programmes that would otherwise be closed to them entirely, and the relationships persist across successive national programmes. Declining those terms leaves the fastest growing demand entirely inaccessible. India compounds at 20.1% while established markets grow at roughly half that rate.
Market Impact: India now compounds at fully 20.1% every year

Who Controls the Margin Pool

Five suppliers hold 51% of payload manufacturing revenue, and that concentration reflects accumulated qualification history rather than any manufacturing or technology advantage anybody holds. Airbus Defence and Space, Thales Alenia Space, L3Harris Technologies, Northrop Grumman and Maxar lead. All participants here are assessed on satellite payload manufacturing revenue rather than on any broader space systems or defence business they also operate. Concentration has moved barely at all across the past decade despite considerable new entry, which tells you what actually governs selection here.
Competition runs on flight heritage and qualification status far more than on instrument capability, since roughly 73% of procurements will not consider anything without demonstrated history. The second dimension is production rate, because constellation replenishment across five year satellite lives requires repeatable manufacturing that bespoke instrument builders genuinely cannot deliver at the volumes involved. Price competes third, well behind both.

Pressure is emerging from constellation operators building payloads internally, which removes procurement entirely rather than competing for it. Rankings shift where sovereign programmes fund domestic capability and where constellations replenish, particularly across India, the Gulf and North America. Suppliers organised entirely around institutional programme buying are serving the slowest growing part of this market.
satellite-payloads-market-company-positioning-matrix-1789997539956

Competitive Moat and Risk Dimensions

AIRBUS DEFENCE AND SPACE

Moat: Institutional Programme Heritage

Airbus holds flight heritage across communications, observation and scientific instruments accumulated over decades of European agency programmes, which satisfies the demonstrated history that roughly 73% of procurements require. That heritage cannot be acquired except by flying, and flying requires winning first. Competitors with better technology and no history frequently cannot bid at all.
AIRBUS DEFENCE AND SPACE

Risk: Constellation Rate Mismatch

Institutional heritage was built through bespoke instruments for individual missions, while constellation replenishment across five year satellite lives requires repeatable production at rates that bespoke manufacturing cannot reach. That is where the growth sits. Heritage satisfies the qualification requirement and does not by itself deliver the production rate a constellation operator actually needs.
MAXAR

Moat: Commercial Observation Position

Maxar built position in commercial earth observation instruments at a point when most capability sat with defence programmes, which reaches buyers moving toward insurance, agriculture and financial analysis. Those customers want revisit frequency and consistency rather than ultimate resolution, which are different design decisions entirely. That commercial orientation is difficult for defence-heritage suppliers to adopt convincingly.
MAXAR

Risk: Operator Vertical Integration

Constellation operators increasingly build observation payloads internally rather than procuring them, which removes the customer altogether rather than competing on price. Commercial observation is precisely where that integration has moved furthest and fastest. A supplier position in a segment whose buyers are becoming manufacturers faces a demand problem that no capability improvement addresses.

Players Tracked

Prominent Players

Airbus Defence and Space
Thales Alenia Space
L3Harris Technologies
Northrop Grumman
Maxar

Other Key Players

Ball Aerospace
Raytheon Technologies
Mitsubishi Electric
NEC Corporation
OHB System
Leonardo
Honeywell Aerospace
Terma
Sener Aeroespacial
Israel Aerospace Industries
Mynaric
Tesat-Spacecom
Simera Sense
Dhruva Space
Satrec Initiative

Recent Developments

APRIL 2025

Constellation Operators Expand Internal Payload Development

Several large constellation operators expanded internal payload design and manufacturing capability, capability development rather than any corporate transaction. Replenishment across five year satellite lives requires repeatable production at rates bespoke instrument manufacturing cannot reach, which is part of why operators concluded that building internally made commercial sense for them.
Signal: An operator that builds its own payloads removes the customer altogether rather than merely negotiating harder on price.
OCTOBER 2024

Indian Programmes Fund Domestic Payload Development Capability

Indian national programmes funded domestic payload development across communications and observation instruments, a capability development rather than any commercial transaction. Those buyers procure instrument development alongside technology transfer and local manufacturing arrangements, which is a materially more demanding commercial structure than any straightforward payload sale.
Signal: Sovereign buyers now want capability transferred and built locally rather than finished instruments delivered and invoiced.
JULY 2025

Hosted Payload Flights Expand As Heritage Building Route

Payload developers expanded use of hosted slots and in-orbit demonstration missions to establish flight heritage, an engineering development rather than any acquisition. Roughly 73% of procurements require demonstrated history, and qualification takes around 29 months, which makes hosted flying the practical route into a closed market.
Signal: Heritage requirements create a circle that only deliberate demonstration flying breaks, and waiting for a prime contract never does.

What A Payload Costs

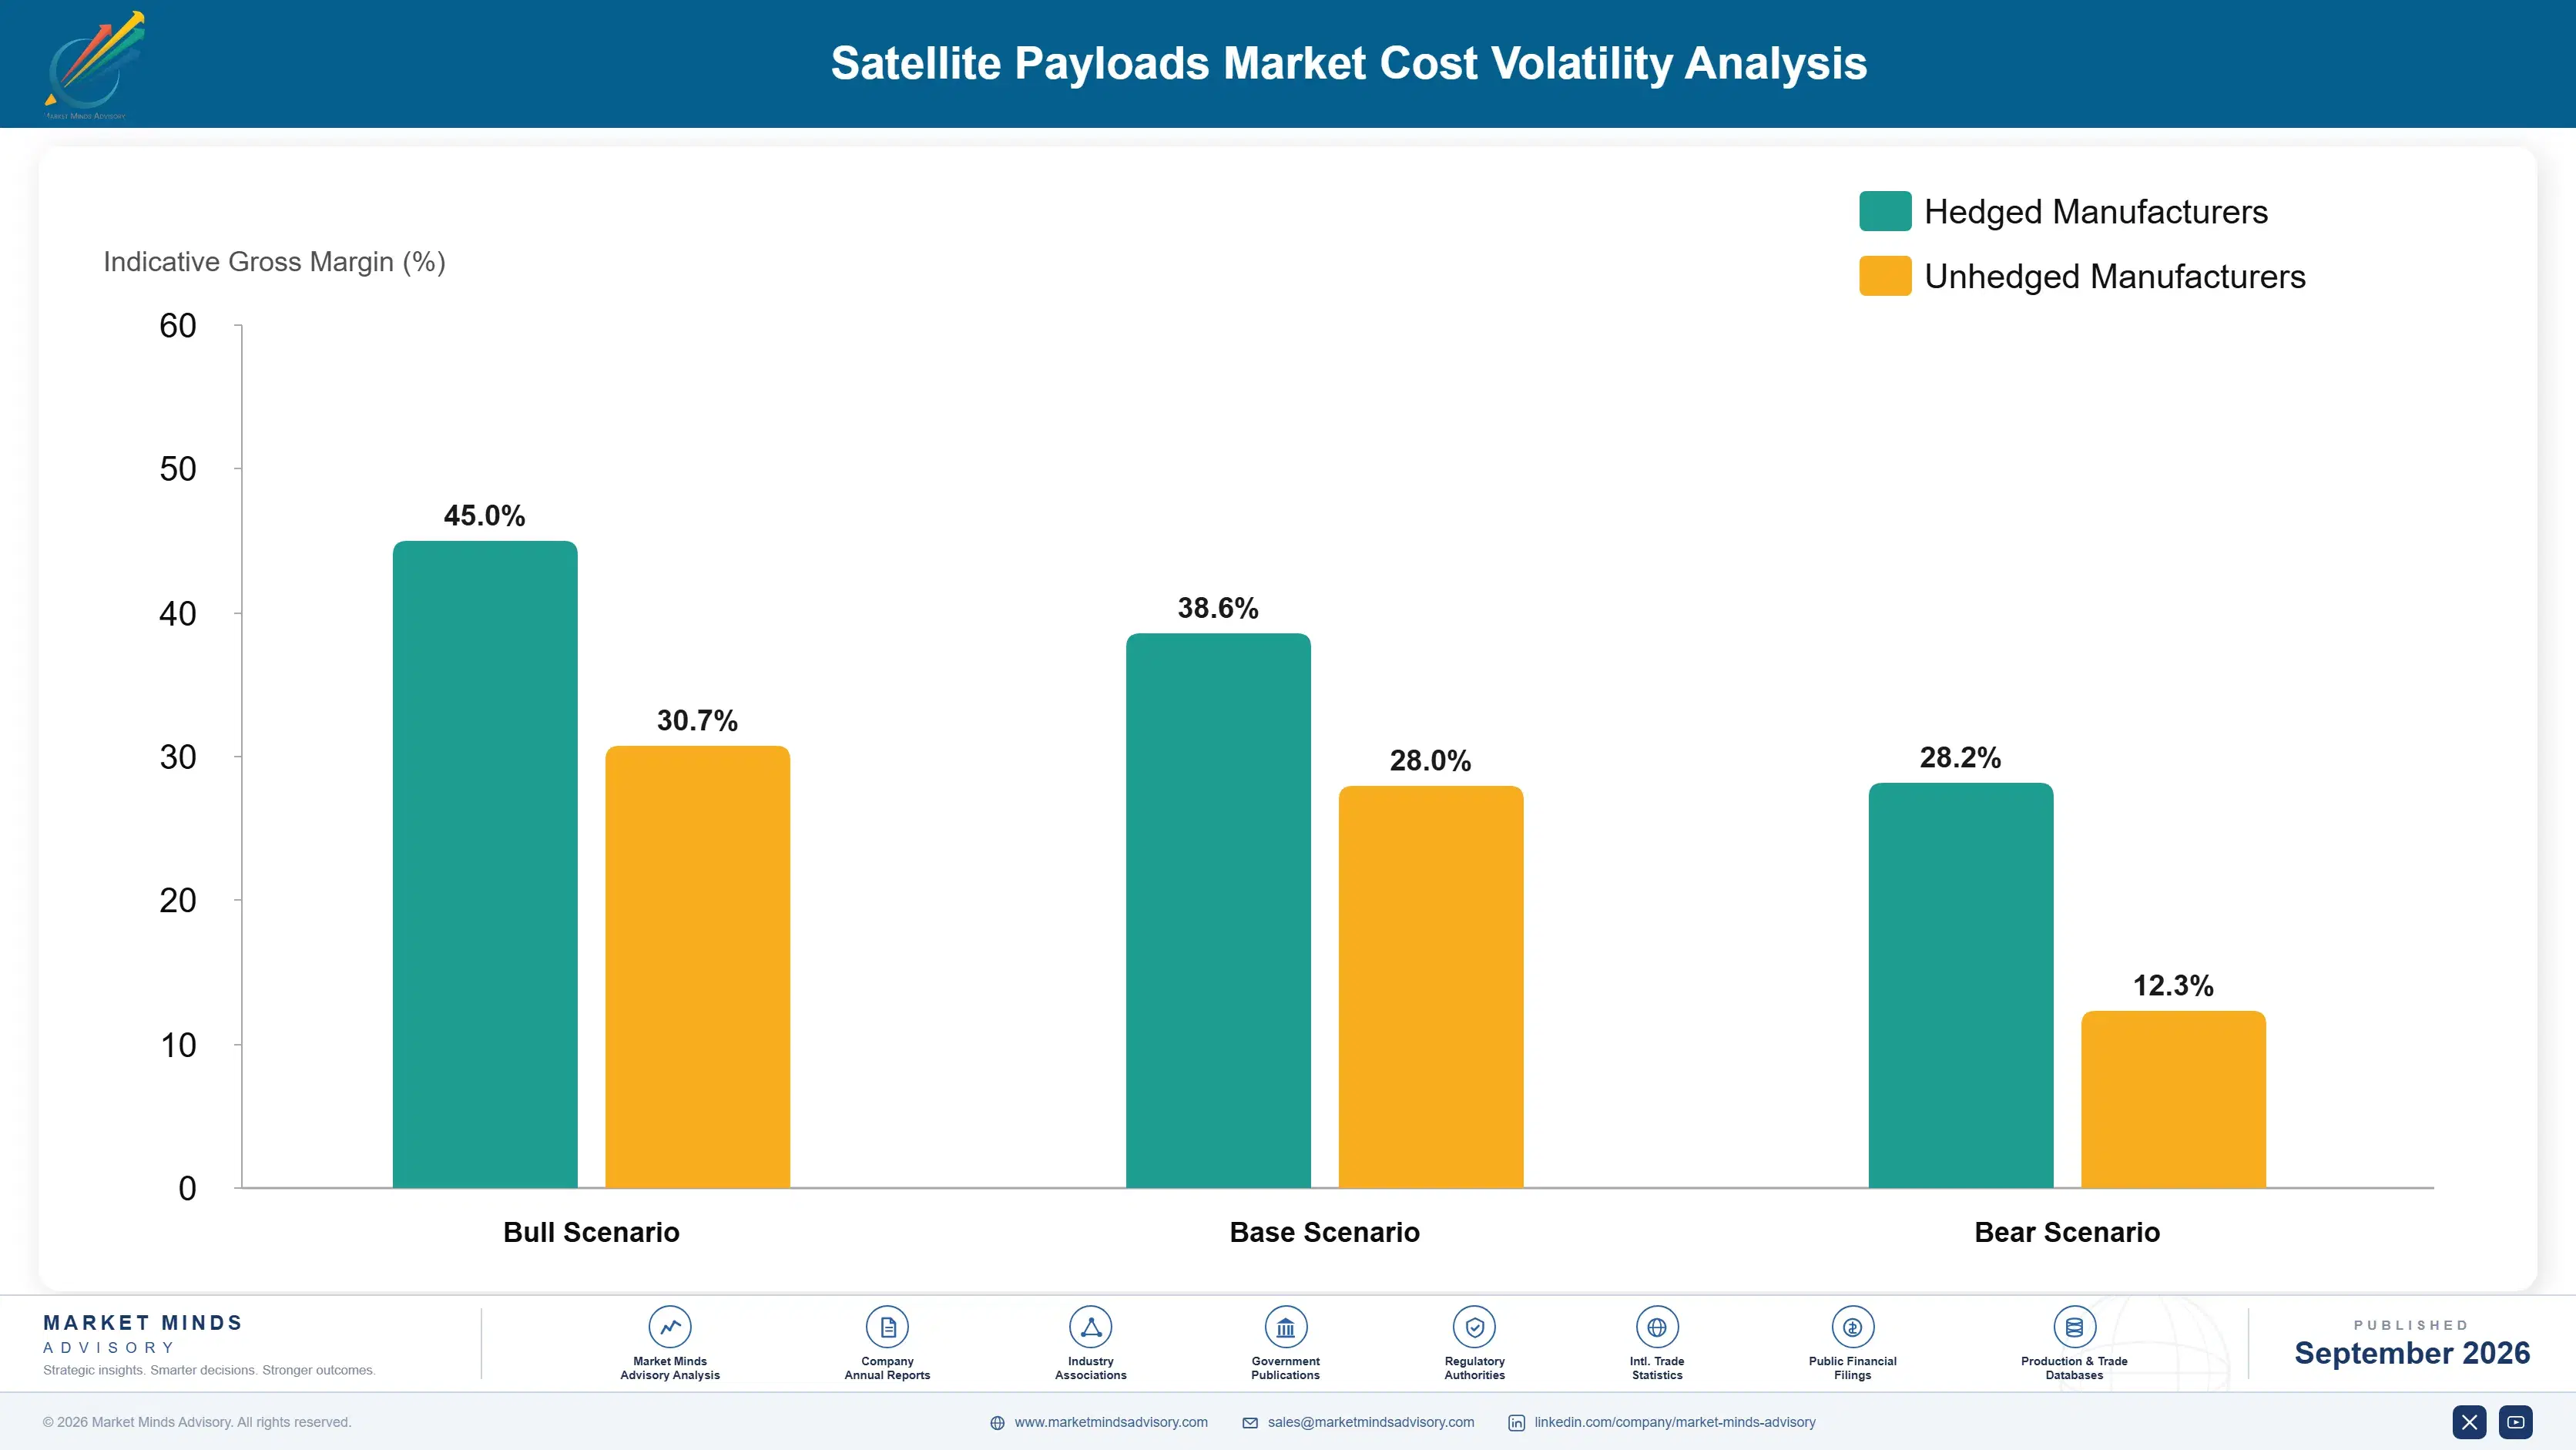
Space qualified electronic components absorb roughly 34% of payload cost, sourced from a small group of suppliers producing radiation tolerant parts at very low volume. Qualification testing and environmental validation take around 21% and recur with every design change. Precision optical or antenna assembly absorbs about 22%, and engineering amortisation takes most of the remaining balance across small production runs.
Radiation tolerant component supply tightened through 2022 and 2023 as constellation demand competed with institutional programmes for the same limited specialist production capacity. Airbus Annual Report 2024 and L3Harris Technologies Annual Report 2024 both record component availability and qualification cost as principal operating variables. Suppliers holding multi-year component agreements delivered considerably better than those buying against programme award timing. Programme schedules slipped where allocation could not be secured against launch dates.

The competitive disadvantage mechanism is qualification amortisation rather than component price. A supplier spreading roughly 29 months of qualification work across constellation production volume carries far lower cost per unit than one amortising the same effort across a handful of bespoke instruments. Exposure concentrates among institutional suppliers whose production runs are small by design, which is precisely where the heritage that wins procurements actually sits.
satellite-payloads-market-cost-volatility-analysis-1789997540155

Amortise Qualification Across Repeatable Production Runs

Qualification testing absorbs roughly 21% of payload cost and recurs with every significant design change made afterwards. Structuring designs so one qualification campaign supports a whole production run rather than a single instrument spreads that expense considerably further. The discipline is architectural and must be decided early, since retrofitting production repeatability into a bespoke design is not realistically possible.

Contract Radiation Tolerant Component Supply Early

Space qualified electronic components run roughly 34% of payload cost and come from a small group of specialist suppliers serving constellation and institutional demand simultaneously. Multi-year agreements secure allocation and let a supplier quote delivery dates a programme can plan around. Buying against award timing loses competitions on schedule rather than capability. Allocation is the constraint, not price.

Reuse Qualified Subsystems Across Instrument Families

Engineering amortisation across small production runs is what makes bespoke payloads expensive, and qualification takes around 29 months whenever anything material changes. Building instrument families around qualified subsystems that carry forward preserves heritage while allowing new capability above it. Suppliers redesigning from scratch for each programme repeat the whole qualification burden and gain nothing from what they already flew.

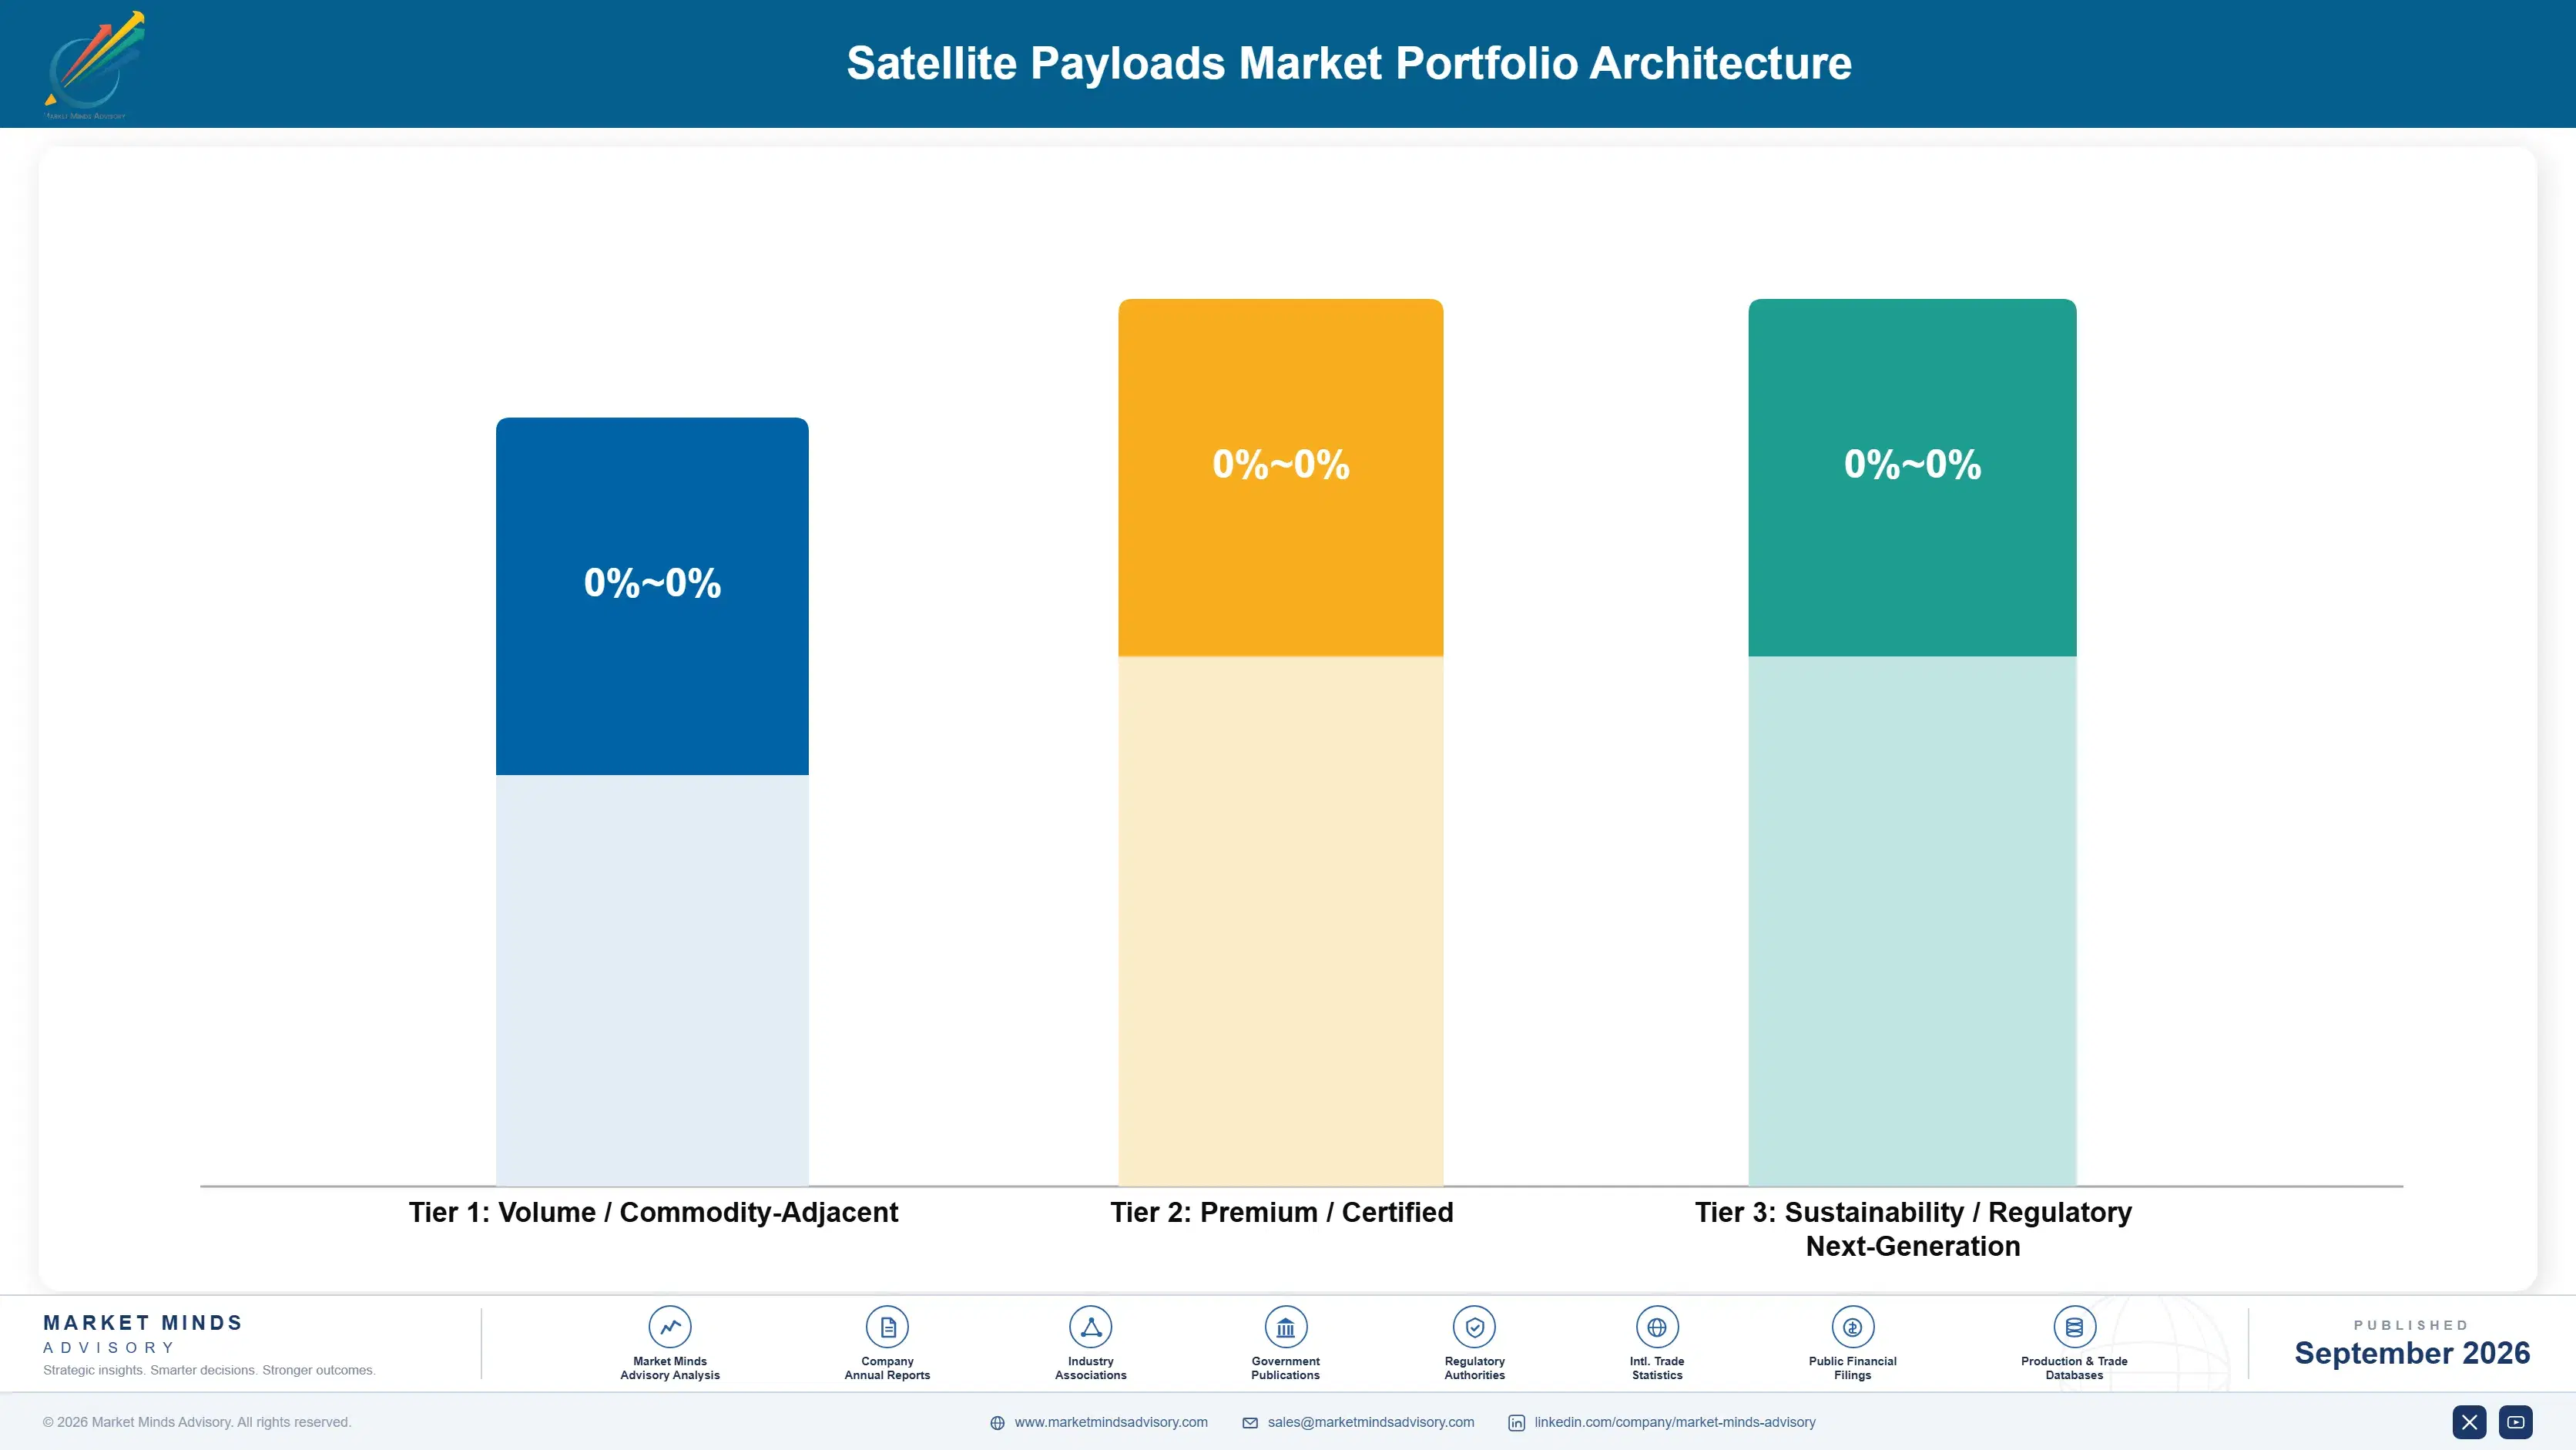
Portfolio Architecture for Margin Defence

Margin architecture separates on qualification scarcity and production repeatability. Mechanically steered communications payloads earn least, since the technology is mature and several suppliers hold comparable heritage. Navigation payloads sit above on precision requirements. Electronically steered communications, radar sensing and scientific instrument packages earn most, because each combines difficult engineering with heritage that very few suppliers actually hold.
The volume versus premium tension runs between constellation production and institutional programmes, which reward opposite manufacturing behaviour entirely. Constellations need repeatable output at rates bespoke builders cannot reach, at prices that reflect volume. Institutional programmes pay properly for instruments built once. Suppliers attempting both with one organisation consistently underperform at whichever they are less naturally suited to. Choosing one deliberately beats serving both indifferently.

High-value pools concentrate in electronically steered payloads and in radar sensing, and neither is reached through general payload capability. Electronic steering requires phased array engineering that mechanical heritage does not transfer into. Radar requires signal processing and power handling that optical suppliers have not built. Both take years and qualification flights, which is exactly why the leaders keep holding those positions across programme generations.

Volume / Commodity-Adjacent

Mechanically steered and fixed communications payloads at established specifications, where the technology is mature and several suppliers hold broadly comparable flight heritage already. The twelve point spread separates suppliers with repeatable production from those building each instrument essentially as a bespoke exercise.
Gross Margin: 18% to 30%

Premium / Certified

Optical observation instruments and navigation payloads, where precision engineering and calibration quality determine selection alongside demonstrated flight heritage. The fourteen point spread tracks how much qualification each supplier has already amortised against how much remains ahead of any new programme.
Gross Margin: 34% to 48%

Sustainability / Regulatory / Next-Generation

Electronically steered communications payloads, radar sensing instruments and scientific packages, each combining difficult engineering with heritage that very few suppliers genuinely hold. The eighteen point spread reflects phased array and signal processing depth, neither of which transfers from mechanical instrument experience.
Gross Margin: 52% to 70%
satellite-payloads-market-portfolio-architecture-1789997540661

High-value Sub-segments and Strategic Watch-out

Electronically Steered Communications Payloads

Grows at 18.6% because constellations must steer coverage continuously across a five year life with no maintenance possible. The eighteen point spread reflects phased array engineering depth. Mechanical heritage does not transfer into this at all, which keeps the field narrow. Very few suppliers hold genuine depth here at present.
Gross Margin: 52% to 70%

Radar And Microwave Sensing Payloads

Grows at 14.8% on all-weather observation that optical instruments simply cannot provide through cloud or darkness. The eighteen point spread reflects signal processing depth. Power handling and processing requirements exclude most suppliers before capability is even assessed. Defence demand has historically funded most of the capability that exists.
Gross Margin: 52% to 70%

Optical Earth Observation Instruments

Grows at 13.1% as imagery buyers move from agencies toward insurance, agriculture and financial analysis instead. The fourteen point spread reflects amortised qualification. Commercial buyers want revisit frequency far more than they want ultimate spatial resolution. Constellation operators increasingly build these instruments internally instead. Commercial specification now leads.
Gross Margin: 34% to 48%

Mechanically Steered And Fixed Communications Payloads

Grows at 4.2%, slowest of the six instrument classes, on mature technology where several suppliers hold broadly comparable flight heritage. The twelve point spread reflects production repeatability. Geostationary programme buying has slowed considerably as constellation deployment accelerated. Replacement demand persists but new programme awards have thinned considerably.
Gross Margin: 18% to 30%

Why Heritage Holds Position

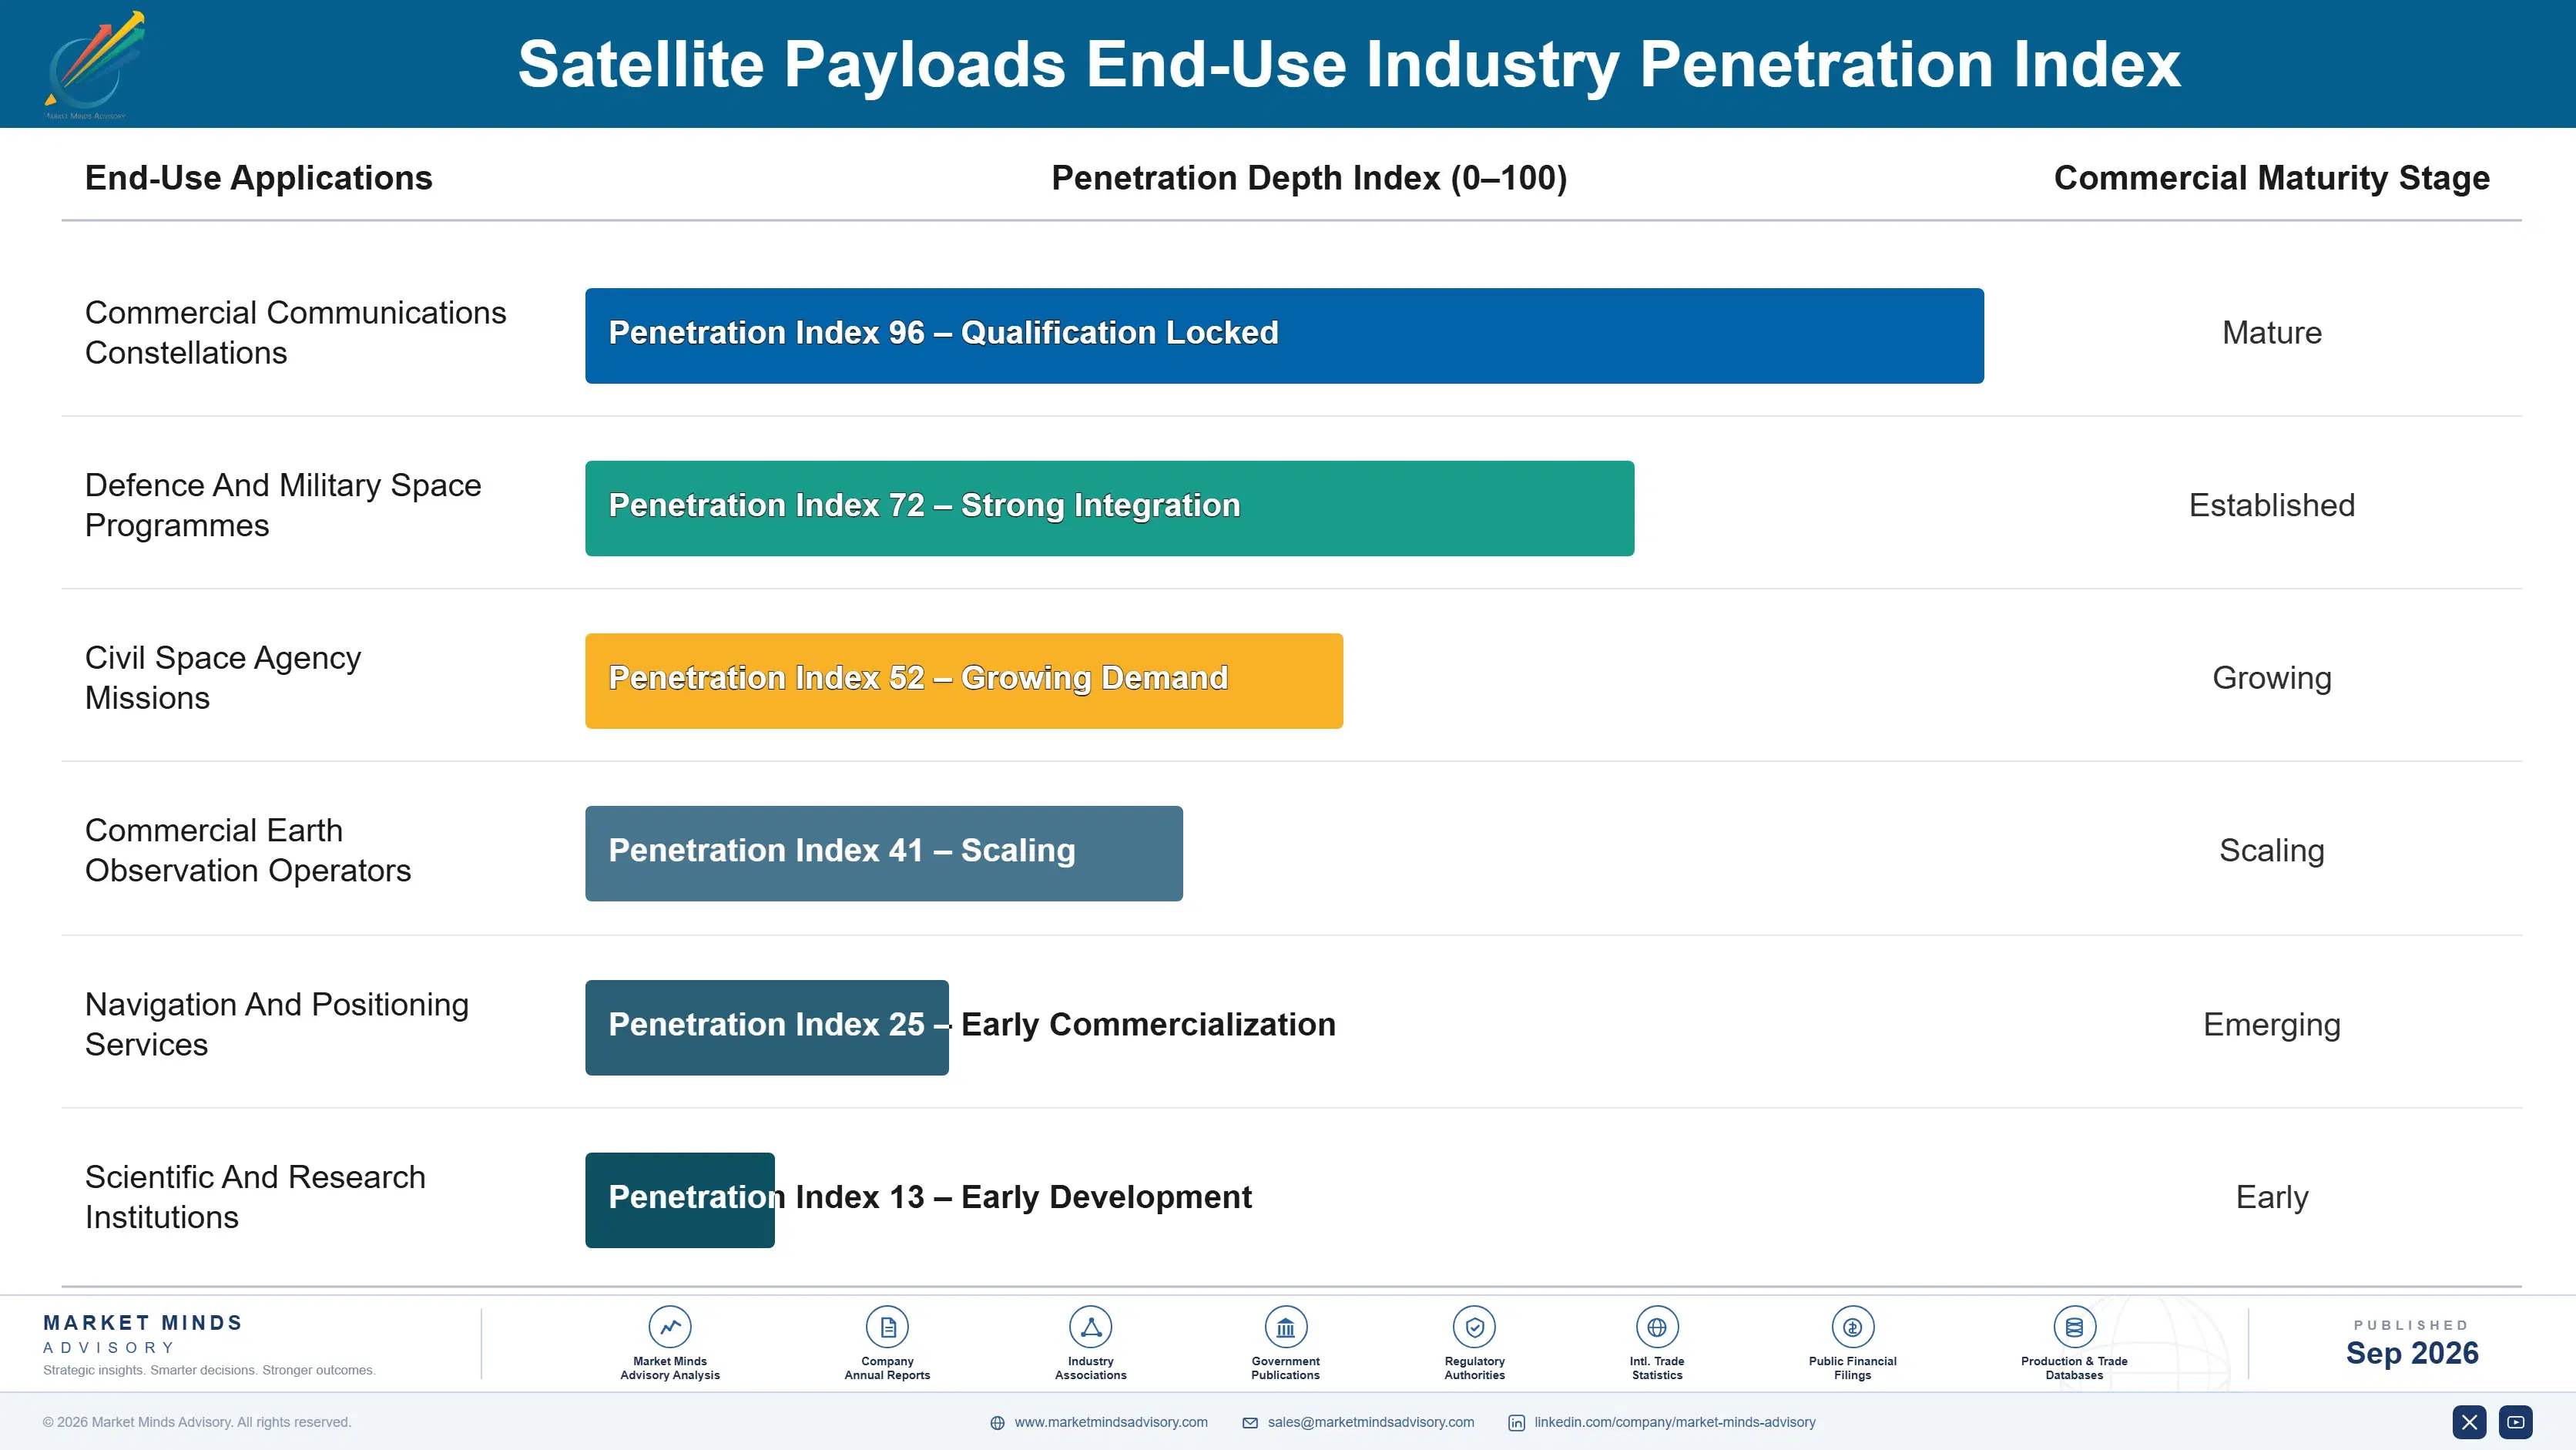
The annuity here is qualification rather than any contract. A payload design that has flown successfully satisfies the demonstrated history requirement across roughly 73% of subsequent procurements, and that qualification carries forward into every programme reusing the design. Reaching it took around 29 months and a flight opportunity somebody had to fund. A supplier holding heritage therefore competes on ground competitors cannot reach without flying first.
Depth varies by how much of a design carries forward. An instrument family built around qualified subsystems accumulates heritage with every flight and applies it repeatedly. A bespoke instrument designed for a single mission generates heritage that transfers poorly into anything else. Suppliers who architected for reuse hold compounding positions, while those who redesign each time start the qualification clock again on every programme they win.

The buyer has changed more than the technology. An institutional programme office evaluated capability against mission requirements over years of study. A constellation operator evaluates production rate, unit cost and whether delivery can match a launch cadence. A sovereign programme evaluates whether capability can be transferred and built domestically. Suppliers organised entirely around the first buyer are serving the slowest growing part of this market.
satellite-payloads-market-end-use-penetration-index-1789997541152

What Wins Payload Contracts

These are among the four positions where our research anticipates prominent divergence between winners and laggards over the coming forecast period. Each is grounded in the demand model, the regulatory perimeter, and the announced capacity pipeline.
01 / HERITAGE BUILDING INVESTMENT

Fly Something Before Bidding Anything

Roughly 73% of payload procurements require demonstrated flight history before any award can be made, and reaching qualified status takes around 29 months from design freeze even once somebody agrees to fund the work. A supplier with materially better technology and no heritage frequently cannot bid at all, regardless of what the instrument would genuinely do in orbit. Hosted payload slots and demonstration missions build that heritage at a fraction of what any dedicated programme costs, and the pipeline that opens afterwards is worth several times the flight.
02 / COST FRAME CORRECTION

Optimise The Instrument, Not The Mass

Cost per kilogram to orbit fell by roughly 91% across a decade while payload cost did not follow it down at all, so the instrument now represents around 58% of total programme cost. Mission designs still optimising mass are carefully saving the cheap resource while accepting expense in the genuinely expensive one. Suppliers who reframe the conversation around instrument cost per unit of capability reach a programme office that has usually not updated its trade study assumptions from an era when launch was genuinely the expensive part of any mission.
03 / PRODUCTION RATE CAPABILITY

Build For Replenishment, Not For Missions

A five year satellite life across a large constellation implies continuous payload demand rather than the episodic buying that geostationary programmes involved for decades, which is a completely different manufacturing and commercial rhythm to operate at. Suppliers organised around bespoke instruments for individual missions genuinely cannot serve it at the rates or volumes required. Those organised around repeatable production with qualified designs can, and that revenue recurs rather than arriving once every decade or so with a single programme award.
04 / SOVEREIGN TRANSFER STRUCTURING

Sell Capability, Not Finished Instruments

India compounds at 20.1% annually and Gulf programmes are funding domestic payload capability rather than importing complete satellites from anybody at all. Those buyers procure instrument development alongside technology transfer and local manufacturing arrangements, which is a considerably more demanding structure than any straightforward sale and one that many established suppliers simply decline. Suppliers willing to structure that properly reach programmes that would otherwise stay entirely closed to them, and those relationships persist across successive national programmes for years afterwards.
Engagement Snapshot From the Field

A live engagement with an industry participant carrying material or product regulatory and market exposure ahead of a defining policy shift, showing how our research translates into a defensible multi-year portfolio strategy.
MARKET MINDS ADVISORY · CLIENT ENGAGEMENT SUMMARY
Satellite Payloads Producer Strategic Portfolio Review and Transition Roadmap 2026·Investment Scenario on Satellite Payloads Exposure Evaluation 2025-26
CLIENT PROFILE
A payload developer holding genuinely advanced electronically steered antenna technology and no flight heritage whatsoever, having lost three consecutive competitive procurements without reaching technical evaluation in any of them. Management believed the losses reflected pricing and had authorised further discounting on the next bid without establishing why the earlier ones failed. Nobody in the company had asked why the bids failed.
STRATEGIC CHALLENGE
Sales wanted to reduce pricing further to win a reference programme. Engineering wanted investment in additional capability to widen the technical margin. Nobody had established whether either would have changed any of the three outcomes, and a fourth procurement was closing within the quarter on essentially the same terms as the previous three.
MMA APPROACH
MMA reviewed the three lost procurements to establish at what stage and on what grounds the company had been excluded. We assessed the cost and timeline of alternative heritage building routes including hosted payload slots, and modelled which forthcoming procurements would become addressable once heritage existed. Work drew on 47 expert interviews conducted in Q4 2025 with operators, agencies and payload suppliers.
KEY FINDINGS
  1. All 3 lost procurements had excluded the company at heritage screening, before any technical or commercial evaluation had taken place at all.
  2. Further price reduction would have changed nothing at all, since the exclusion occurred well before pricing was ever examined by anybody involved.
  3. A hosted payload slot cost a small fraction of a dedicated demonstration mission and would satisfy heritage screening (client-reported, unverified by MMA).
  4. Around 7 forthcoming procurements would become addressable once flight heritage existed, none of which the company could realistically bid for at present.
CLIENT PROFILE
A payload developer holding genuinely advanced electronically steered antenna technology and no flight heritage whatsoever, having lost three consecutive competitive procurements without reaching technical evaluation in any of them. Management believed the losses reflected pricing and had authorised further discounting on the next bid without establishing why the earlier ones failed. Nobody in the company had asked why the bids failed.
STRATEGIC CHALLENGE
Sales wanted to reduce pricing further to win a reference programme. Engineering wanted investment in additional capability to widen the technical margin. Nobody had established whether either would have changed any of the three outcomes, and a fourth procurement was closing within the quarter on essentially the same terms as the previous three.
MMA APPROACH
MMA reviewed the three lost procurements to establish at what stage and on what grounds the company had been excluded. We assessed the cost and timeline of alternative heritage building routes including hosted payload slots, and modelled which forthcoming procurements would become addressable once heritage existed. Work drew on 47 expert interviews conducted in Q4 2025 with operators, agencies and payload suppliers.
KEY FINDINGS
  1. All 3 lost procurements had excluded the company at heritage screening, before any technical or commercial evaluation had taken place at all.
  2. Further price reduction would have changed nothing at all, since the exclusion occurred well before pricing was ever examined by anybody involved.
  3. A hosted payload slot cost a small fraction of a dedicated demonstration mission and would satisfy heritage screening (client-reported, unverified by MMA).
  4. Around 7 forthcoming procurements would become addressable once flight heritage existed, none of which the company could realistically bid for at present.
RECOMMENDED STRATEGY
Phase 1: Phase one: stop bidding procurements requiring heritage the company does not hold, since exclusion happens before pricing is examined at all. Phase 2: Phase two: fund a hosted payload flight to establish heritage, which costs a fraction of any dedicated demonstration mission would. Phase 3: Phase three: redirect the discounting budget into that hosted flight rather than into further bids that cannot reach technical evaluation at all.
OUTCOME
The developer stopped bidding heritage-gated procurements and funded a hosted payload flight instead (client-reported, unverified by MMA). Bid costs fell immediately and the addressable pipeline expanded substantially once the flight completed. Heritage status is now checked before any bid decision, which is the change that outlasted the engagement itself.

Frequently Asked Questions

Foundational context covering the market sizes, CAGR, scope, country, region and competition that inform every finding below. This section is provided to cover basics and most often pre-purchase conversations, answered from the MMA Primary Research Dataset.

What is the current size of the Satellite Payloads Market?

Global value reaches USD 21.3 billion in 2026, measured as payload manufacturing revenue across six instrument classes. The 2025 base was USD 18.9 billion on the same basis.

How large will the Satellite Payloads Market be by 2036?

The market reaches USD 68.6 billion by 2036, an increase of USD 47.3 billion across the forecast period. That represents 3.22 times expansion from the 2026 base.

What is the CAGR for the Satellite Payloads Market 2026 to 2036?

The base case runs at 12.4% annually, with a bull case at 13.7% if constellation replenishment arrives as scheduled and a bear case at 11.2% if fewer constellations reach deployment than currently announced.

Which segment is growing fastest?

Electronically steered communications payloads grow at 18.6%, half again the market rate of 12.4%. A constellation needs beams that move without any hardware moving with them.

Who are the major companies in the Satellite Payloads Market?

Airbus Defence and Space, Thales Alenia Space, L3Harris Technologies, Northrop Grumman and Maxar lead on payload revenue, holding 51%. Ball Aerospace and Mitsubishi Electric hold smaller positions.

Which country is growing fastest?

India leads at 20.1%, on national programmes funding domestic payload development rather than importing complete satellites from established suppliers. Saudi Arabia and South Korea follow.

Report Segmentation Architecture

The full report scope spans multiple orthogonal segmentation dimensions, with cross-tabulated demand data provided for each dimension pair. Coverage extends further to regional breakdowns, trend trajectories, and the competitive detail needed to support segment-level decision-making.

By Instrument Class

  • Electronically Steered Communications Payloads
  • Radar And Microwave Sensing Payloads
  • Optical Earth Observation Instruments
  • Scientific And Hosted Instrument Packages
  • Navigation And Timing Payloads
  • Mechanically Steered And Fixed Communications Payloads

By End-Use Industry

  • Commercial Communications Constellations
  • Defence And Military Space Programmes
  • Civil Space Agency Missions
  • Commercial Earth Observation Operators
  • Navigation And Positioning Services
  • Scientific And Research Institutions

By Commercial Dimension

  • Prime Contractor Subcontract Supply
  • Direct Operator Procurement
  • Sovereign Capability Transfer Programmes
  • Hosted Payload Arrangements
  • Agency Competitive Tender
  • Constellation Volume Production Contracts

By Region

  • North America
  • Western Europe
  • East Asia
  • South Asia and Pacific
  • Latin America
  • Middle East and Africa
  • Eastern Europe

Scope, Methodology, and Coverage

Every figure in this report is reproducible from documented input assumptions. The scope below maps the historical period, the forecast horizon, the segmentation dimensions, and the countries covered, alongside the underlying primary and qualitative methodology.
Historical Period
2020 to 2025
Forecast Period
2026 to 2036
Base Year
2025 (USD billions; MMA Primary Research Dataset, September 2026)
Market Definition
This report covers satellite payloads by instrument class: electronically steered communications payloads, mechanically steered and fixed communications payloads, optical earth observation instruments, radar and microwave sensing payloads, navigation and timing payloads, and scientific and hosted instrument packages. It excludes satellite buses and platforms, launch vehicles and services, ground segment equipment, satellite operations and data services, and propulsion or power subsystems sold separately.
Quantitative Units
USD millions, payload manufacturing revenue basis; delivered instruments; payload share of programme cost as a percentage; qualification periods in months; satellite design life in years; heritage requirement prevalence as a percentage.
Segmentation Dimensions
Instrument class; end-use mission type; commercial procurement route; geography across seven regions.
Regions Covered
North America, Western Europe, East Asia, South Asia and Pacific, Latin America, Middle East and Africa, Eastern Europe
Countries Covered
United States, Canada, United Kingdom, France, Germany, Italy, Spain, Netherlands, Poland, Romania, China, Japan, South Korea, India, Australia, Brazil, Argentina, Israel, Saudi Arabia, United Arab Emirates.
Key Companies Profiled
Airbus Defence and Space, Thales Alenia Space, L3Harris Technologies, Northrop Grumman, Maxar, Ball Aerospace, Mitsubishi Electric, NEC Corporation, OHB System, Leonardo, Terma, Israel Aerospace Industries, Tesat-Spacecom, Dhruva Space, Satrec Initiative.
Quantitative Methodology
Primary survey, n=3,800 respondents, Q4 2025, six countries; demand-side model with trade association cross-validation
Qualitative Methodology
47 expert interviews, Q4 2025; applied to validate demand model assumptions, identify emerging dynamics, and assess competitive positioning
Report Format
PDF and XLSX data workbook (Word format preview document)
Publisher
Market Minds Advisory
Report Code
MMA-2026-TEC-891
Published
September 2026
Contact
sales@marketmindsadvisory.com | www.marketmindsadvisory.com

Purchase the full Satellite Payloads Market Report (2026 to 2036).

This report sizes the global satellite payloads market from 2026 to 2036 across six instrument classes, six mission types and seven regions. It explains why launch cost falling roughly 91% while payload cost held steady inverted the industry's planning logic, leaving the instrument at around 58% of programme cost. Flight heritage requirements gating roughly 73% of procurements are analysed as the competitive structure that excludes better technology. Constellation replenishment across five year satellite lives is examined as a manufacturing rhythm bespoke suppliers cannot serve. Regional analysis explains why North America holds 34% of payload revenue.
Six instrument classes sized through to 2036
Launch and payload cost inversion quantified across a decade
Flight heritage requirements assessed as a competitive barrier
Twenty named suppliers assessed on payload revenue
Four revenue levers with quantified commercial impact
Anonymised payload developer entry engagement documented in full

Built For The People Who Decide

From boardroom strategy to bench-side execution, this report is read cover-to-cover by leaders shaping the next decade of their industry, turning demand scenarios, market dynamics and valuation benchmarks into decisions.
CXOs/ Presidents/ VPs/ Managers
M&A and Corporate Development
Strategy Teams and R&D Heads
Procurement and Product Directors
Regulatory and Compliance Leaders
Investor Relations and Equity Analysts