Market Minds Advisory
Sales Performance Management (SPM) Software Market

Sales Performance Management (SPM) Software Market: Sales Performance Management Software Market. Trends and Forecast 2026 to 2036

AI-driven forecasting and coaching tools are pushing sales performance management beyond commission calculation into predictive pipeline management, forcing vendors to rebuild platforms around real-time rep behavior analysis rather than quarterly payout reconciliation.

Lead Analyst

Published

September 2026

Make Smarter Decisions with Customized Research Insights

Request a free sample report and evaluate market opportunities, growth trends, and competitive dynamics relevant to your business needs.

2025 MARKET VALUE$4.6BMarket Size 2025
2036 FORECAST VALUE$13.1BBase Case , 2026 to 2036
CAGR 2026 TO 203610.0 %Bull 11.2% / Bear 8.7%
INCREMENTAL OPPORTUNITY$8.1BNet 10- year value creation
EXPANSION MULTIPLE2.59x2036 value over 2026 base
Strategic Levers
M&A Pipeline
Regional Outlook
Country Rankings
Competitive Intelligence
Segmental Deep-dive
Call-Us : 91 93563 13602

Executive Snapshot and Market Trajectory.

AI-driven forecasting is compressing the gap between sales activity and revenue prediction, letting sales leaders spot pipeline risk weeks before quota misses become visible in traditional dashboards built for retrospective reporting rather than early warning and proactive intervention across the sales organization overall.
Enterprises are shifting budget from spreadsheet-based commission tracking toward integrated platforms combining incentive compensation, quota planning, and territory design in a single system of record across the entire revenue organization and broader go-to-market function. North America and Western Europe concentrate the largest share of SPM software spending, driven respectively by dense enterprise SaaS vendor headquarters and mature sales operations practice adoption across large multinational companies operating globally.
Competitive intensity centers on native CRM integration depth, since incentive compensation accuracy depends entirely on clean, real-time access to opportunity and transaction data that fragmented point solutions struggle to maintain reliably across large, complex sales organizations worldwide today. Established enterprise software vendors and specialized SPM providers are both racing to own this integration layer, with several vendors now embedding AI coaching recommendations directly into compensation dashboards rather than selling coaching as a separate module entirely.
Market Definition
The Sales Performance Management Software Market covers platforms that automate incentive compensation calculation, quota planning, territory design, and sales coaching for revenue-generating teams. It excludes general customer relationship management platforms and standalone business intelligence tools sold independently of compensation functionality.
Base Year Value
$4.6B in 2025 (MMA Primary Research Dataset, September 2026)
Forecast Period
2026 to 2036, eleven discrete annual values
CAGR
10.0% base case. Bull 11.2%. Bear 8.7%.
Fastest Growth Segment
AI-Driven Sales Forecasting and Coaching Platforms: 15.0% CAGR
Fastest Growth Country
India: 13.5% CAGR
Fastest Growth Region
South Asia and Pacific: 12.0% CAGR
Largest Region
North America: 32% of 2025 global value
Market Leaders
Leading participants include SAP, Salesforce, Xactly, Varicent, and Anaplan.
Primary Survey
n=3,800 procurement and R&D decision-makers, Q4 2025, six countries
Methodology
Demand-side build-up, cross-validated against public data, 47 expert interviews

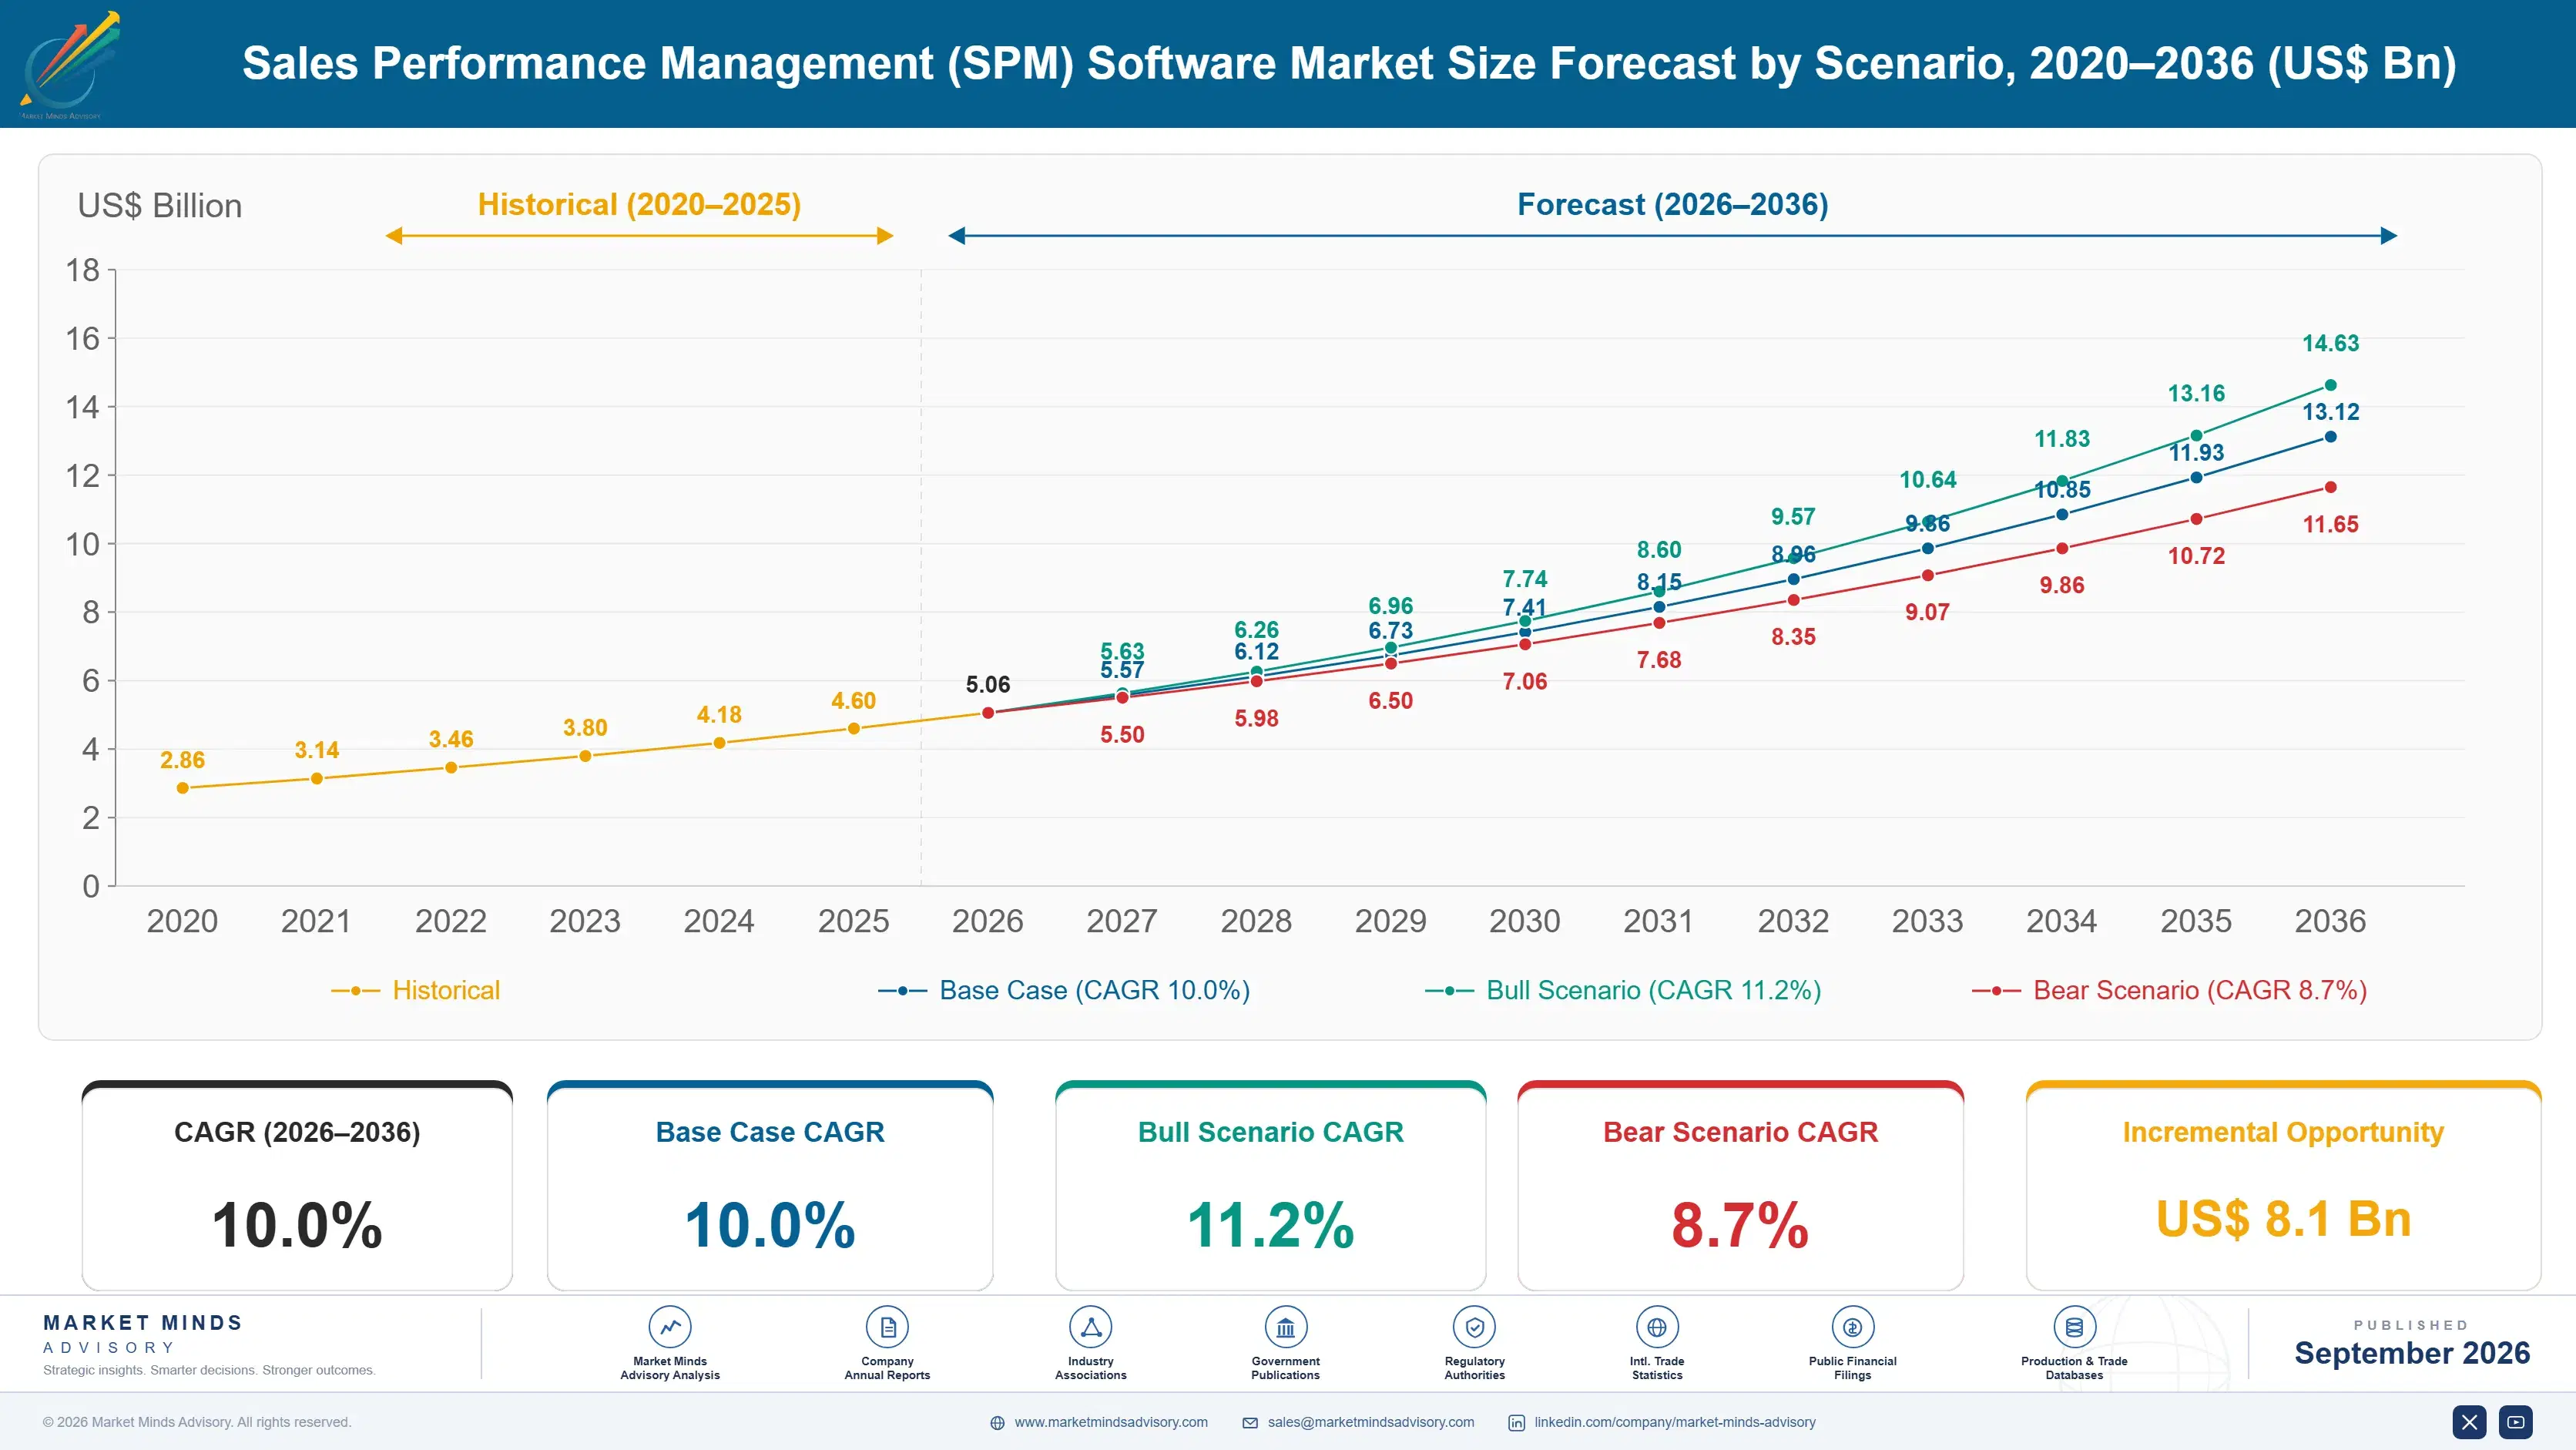
Sales Performance Management (SPM) Software Market Forecast Scenarios

sales-performance-management-spm-software-market-size-forecast-scenario-1789993612066
Between 2020 and 2025, the market grew steadily as enterprises replaced spreadsheet-based commission tracking with dedicated software, then accelerated meaningfully as remote sales team management increased demand for centralized visibility into rep performance and compensation accuracy across distributed teams. Consolidation of point solutions into integrated platforms picked up pace toward the end of the period.
The base case assumes continued enterprise SaaS adoption, expanding AI forecasting capability, and gradual replacement of standalone spreadsheet processes with integrated platforms across the forecast period through 2036. Sales operations teams will prioritize real-time compensation visibility over quarterly reconciliation cycles, vendors will expand AI coaching capability to differentiate beyond core compensation calculation, and mid-market companies will increasingly access enterprise-grade SPM capability through simplified cloud subscription tiers rather than complex custom implementations.
A bull scenario emerges if AI-driven sales coaching demonstrates clear quota attainment improvement across a broad customer base, driving accelerated enterprise adoption within a compressed multi-year window. The bear risk is prolonged economic uncertainty causing enterprises to freeze software budgets and extend existing contract terms rather than migrate to newer platforms, delaying the replacement cycle that currently drives new license growth.

Where Compensation Accuracy Determines Vendor Trust

Sales performance management software has moved from a niche compensation calculation tool into core revenue operations infrastructure, since companies now treat payout accuracy and rep coaching as direct drivers of sales team retention and quota attainment. Vendors that can demonstrate measurable reduction in compensation disputes are capturing disproportionate share of enterprise contracts currently expanding faster than broader sales technology spending overall.
MARKET CONCENTRATIONCR5 42%Top five vendors control nearly half of revenue
AVERAGE CONTRACT VALUE$180KTypical annual enterprise license and support fee paid
TOP ADOPTING REGION SHARE34%North America leads global SPM software technology spending
COMPENSATION ERROR RATE3-8%Typical payout error rate under legacy spreadsheet processes
CLOUD DEPLOYMENT SHARE72%Portion of new deployments choosing cloud over on-premise
SALES REP TURNOVER IMPACT18-25%Share of turnover attributable to unclear compensation visibility
Compensation calculation errors remain a persistent trust problem, since even a small error rate translates into meaningful dollar disputes across a large sales organization and erodes confidence in the entire system. Companies that have consolidated compensation, quota, and territory management onto a single integrated platform consistently report fewer disputes than those running fragmented spreadsheet and point-solution combinations, a lesson increasingly shaping vendor selection criteria.
AI-driven coaching is expanding the addressable use case list well beyond commission calculation, into pipeline risk detection, deal scoring, and personalized rep development recommendations generated automatically from historical performance data across the sales cycle. Mid-market companies increasingly access this capability through simplified cloud subscription tiers rather than complex custom implementations, narrowing the technology gap that once separated large enterprises from smaller competitors.
"Nobody trusts a compensation system that pays them wrong twice. Once a rep stops trusting the numbers, you've lost far more than a calculation error, you've lost their motivation to chase quota at all."
Director, Revenue Operations and Sales Technology Practice · MMA Technology Practice · September 2026

Market Trends

AI Forecasting Tools Enter Mainstream Enterprise Use

Major enterprises have begun deploying AI-driven forecasting tools that analyze historical deal patterns and rep activity to flag pipeline risk weeks before quota shortfalls become visible in traditional quarter-end reporting cycles across the entire sales organization. Several large sales organizations have publicly reported meaningful improvements in forecast accuracy after adopting these tools, reducing the frequency of last-minute revenue surprises that previously caught leadership off guard. Vendors offering pre-integrated AI forecasting capability are winning a disproportionate share of new enterprise contracts as a direct result of this shift toward predictive management.
Market Impact: Cuts voluntary rep turnover by 20%

Native CRM Integration Becomes Baseline Procurement Requirement

Enterprises are increasingly requiring native, bidirectional integration with their existing customer relationship management platform before seriously considering an SPM vendor at all today, since compensation accuracy depends entirely on clean, real-time access to opportunity and transaction data across every single deal stage and pipeline. This shift has pushed several vendors toward deeper platform partnerships with major CRM providers rather than relying on generic API connections that require ongoing custom maintenance and dedicated support. Vendors lacking certified native integration increasingly find themselves excluded from enterprise procurement shortlists during vendor evaluation processes.
Market Impact: Covers over 60% of remote teams

Market Opportunities and Growth Drivers

Rising Sales Rep Turnover Costs Drive Retention Focus

Sales rep turnover costs have climbed steadily as replacement hiring, training ramp time, and lost pipeline continuity all add up to substantial per-departure expense for enterprises with large sales organizations spanning multiple regions, territories, product lines, and business units. Compensation transparency directly addresses a meaningful share of turnover, since ambiguous or error-prone payout calculation is a top cited reason reps leave for competitors offering clearer incentive structures. Companies deploying integrated SPM platforms report meaningfully lower voluntary turnover among quota-carrying reps compared to those still using fragmented spreadsheet-based compensation tracking processes.
Market Impact: Extends migration timelines beyond 1 year

Remote and Hybrid Sales Teams Require Centralized Visibility

The shift toward remote and hybrid sales team structures has eliminated the informal, in-office visibility managers once relied on to track rep activity and pipeline health across their territories, accounts, and broader product and service portfolios nationwide and internationally today. This shift is driving sustained demand for centralized SPM platforms that surface rep performance metrics, quota attainment, and coaching opportunities without requiring in-person observation of daily selling activity. Sales leaders increasingly treat platform-based visibility as a baseline management requirement rather than an optional productivity enhancement for distributed sales teams everywhere.
Market Impact: Consumes 30% of implementation budgets

Market Restraints and Challenges

Legacy System Migration Complexity Delays Adoption

Migrating years of historical compensation data, plan rules, and territory assignments from spreadsheets or legacy systems into a new platform requires substantial upfront professional services engagement, rooted in the accumulated complexity of custom compensation logic built up over many years of incremental changes. The commercial impact falls hardest on companies with the most complex, customized compensation structures, since migration timelines can stretch beyond a year for the largest global sales organizations attempting comprehensive platform replacement. Vendors are increasingly offering phased migration approaches that allow customers to run legacy and new systems in parallel during transition.
Market Impact: Reduces forecast error by roughly 25%

Integration Complexity With Legacy ERP Systems Persists

Many enterprises still run compensation-relevant transaction data through legacy enterprise resource planning systems that predate modern API standards, rooted in decades-old technology investment decisions that remain costly and genuinely disruptive to replace outright across the entire organization and its many operating departments. The commercial impact falls hardest on large, established enterprises with the most entrenched legacy technology stacks, since integration projects can consume significant implementation budget before any compensation calculation functionality goes live. Some vendors now offer pre-built connectors for common legacy ERP systems to reduce this integration burden meaningfully.
Market Impact: Excludes vendors from 60% of shortlists
3 additional market trends, 4 additional growth drivers, and 2 additional restraints and challenges are covered in the full report. Contact sales@marketmindsadvisory.com to access the complete intelligence.

Segment CAGR and Growth Architecture

Sales performance management software segments by application function across six categories, spanning AI-driven forecasting through incentive compensation, quota planning, territory design, and coaching used across enterprise and mid-market sales organizations worldwide today and going forward each year. Each represents a distinct commercial function, rather than overlapping product tiers within a single category or hierarchy.
sales-performance-management-spm-software-market-market-share-analysis-1789993612608

AI-Driven Sales Forecasting and Coaching Platforms

AI-driven sales forecasting and coaching platforms are growing fastest as companies move beyond retrospective compensation reporting toward predictive pipeline management that flags risk before it becomes a quota shortfall across the entire sales organization and broader revenue team structure nationwide and even internationally. These platforms analyze historical deal patterns, rep activity, and external signals to generate forecasts more accurate than traditional bottom-up sales estimates that depend heavily on individual rep judgment and optimism bias present in most estimates and forecasts. Large enterprises with substantial historical deal data are adopting this capability fastest, while mid-market companies increasingly access comparable functionality through managed cloud platforms rather than building in-house data science expertise.
CAGR 15.0%

Incentive Compensation Management Systems

Incentive compensation management systems represent the market's foundational and largest revenue category, since accurate commission calculation remains the primary reason most companies initially adopt dedicated SPM software over spreadsheet-based tracking methods still common at smaller firms and early-stage startups across every industry, vertical, geography, and market segment worldwide today, tomorrow, and even further going forward. These systems increasingly bundle with quota planning and territory design modules, letting vendors sell integrated revenue operations suites rather than standalone compensation calculators sold separately as add-ons and product extensions. Adoption concentrates among enterprises with complex, multi-tiered compensation plans spanning multiple product lines and sales roles, where manual calculation error risk grows substantially with plan complexity.
CAGR 11.5%
Full segment breakdown across 6 segments available in the complete report.

Regional Architecture and Country Demand Map

North America leads global SPM software spending given its concentration of enterprise SaaS vendor headquarters and mature sales operations practice adoption. East Asia follows closely behind, while South Asia and Pacific posts the market's fastest regional growth as enterprise sales technology adoption accelerates across expanding markets.

North America

North America's dominance rests on the concentration of leading SPM vendors including Xactly, Varicent, and Salesforce, all headquartered in the United States and serving the world's largest population of enterprise sales organizations across nearly every industry vertical, company size segment, and business geography imaginable today and quite consistently. American companies pioneered the shift from spreadsheet-based commission tracking to dedicated software decades ago, building institutional sales operations expertise that continues driving adoption of increasingly sophisticated AI-driven forecasting and coaching capability. The region's dense concentration of enterprise software buyers with complex, multi-tiered compensation plans creates sustained demand for the platform sophistication that leading vendors continue to invest in developing and refining further.
Share: 32% | CAGR: 10.5% (2026 to 2036)

Western Europe

Western Europe's SPM adoption trails North America's pace, weighed down by more conservative enterprise software procurement cycles and greater reliance on regional systems integrators for implementation rather than direct vendor relationships common in American markets and business cultures broadly and quite consistently over time and across most cycles. German and British companies lead regional adoption, benefiting from mature sales operations practices developed within their large multinational manufacturing and financial services sectors over many decades of continuous operation and growth. The region's fragmented regulatory landscape around data residency requirements creates persistent complexity for vendors serving cross-border enterprises that must satisfy multiple overlapping national compliance regimes simultaneously across member states and jurisdictions.
Share: 24% | CAGR: 8.5% (2026 to 2036)
Regional intelligence for 5 additional markets available in the complete report: East Asia, South Asia and Pacific, Latin America, Middle East and Africa, Eastern Europe. Contact sales@marketmindsadvisory.com.
sales-performance-management-spm-software-market-country-cagr-analysis-1789993613154

Where Vendors Can Defend Contract Pricing

Revenue expansion in SPM software depends increasingly on proving measurable dispute reduction and forecast accuracy improvement rather than raw feature breadth, since enterprises now demand quantified outcomes before committing to expanded contract value across additional business units or geographies each renewal cycle throughout the ongoing vendor relationship over time and even quite well beyond.

AI Forecasting Module Premium Pricing Strategy

Vendors offering AI-driven forecasting modules that demonstrably reduce quota shortfall surprises can command meaningful price premiums, since sales leaders facing board scrutiny will pay for tooling that improves forecast accuracy and reduces the reputational cost of missed revenue guidance entirely across the whole enterprise. Several vendors report contract values rising by roughly 25% when AI forecasting modules are bundled into core compensation platform licenses rather than sold separately. This positioning matters most for large enterprises with dedicated revenue operations teams evaluating every forecasting tool available across the sales technology stack.
Market Impact: Lifts total contract value by roughly 25% each year

Managed Implementation Services Expansion Growth Strategy

Offering managed implementation and configuration services as a bundled option alongside core software licenses lets vendors capture recurring revenue well beyond the initial platform sale, addressing the persistent complexity of migrating years of historical compensation data and plan rules into a completely new system entirely, reliably, and efficiently across the whole organization and its departments. This service layer can add 20 to 30% incremental revenue per account, since enterprises increasingly prefer outsourcing complex migration work rather than dedicating internal resources amid competing technology priorities and constrained budgets across most departments.
Market Impact: Adds 20 to 30% of total account revenue

Coaching and Development Module Upsell Strategy

Enterprises increasingly pay premium pricing for AI coaching modules that layer directly on top of existing compensation and forecasting platforms, since these modules have demonstrated measurable quota attainment improvement without requiring a complete platform replacement or costly migration project across the wider enterprise organization and broader revenue and sales team. Vendors offering this consolidation typically see contract expansion of 15 to 25% when customers add coaching capability to their existing compensation platform subscription. This lever works best for enterprises already running the vendor's core compensation engine, where integration friction remains minimal.
Market Impact: Expands contract value by 15 to 25% overall

Cross-Business Unit Bundle Expansion Growth Strategy

Vendors offering unified compensation management spanning multiple business units and geographies within a single subscription can convert single-department license sales into broader enterprise-wide contracts, capturing incremental revenue that department-specific point solutions never generate for the vendor across the expanding customer account relationship over the long term and beyond. Bundling cross-business unit deployment typically increases total contract value by 18 to 28% over single-department deployments, since enterprises pay for unified compensation visibility that eliminates reconciliation work across separate systems. Large multinational companies with multiple sales divisions represent the strongest adoption segment.
Market Impact: Increases total contract value by 18 to 28%

Who Controls the Margin Pool

The SPM software market shows moderate concentration, with the top five vendors controlling roughly 42% of global revenue given the CRM integration depth and compensation plan complexity expertise required to compete credibly at enterprise scale. SAP and Salesforce hold a substantial scale advantage over Xactly and the remaining challengers, backed by broader enterprise software platform relationships that specialized SPM-only vendors cannot easily replicate.
Current competitive activity centers on AI forecasting module launches and managed implementation service expansion, with major vendors announcing integrated platforms that combine compensation, coaching, and forecasting into a single unified revenue operations suite across the enterprise. Several vendors are pursuing native CRM integration partnerships, seeking to displace point solutions requiring custom integration work that enterprise buyers increasingly find unacceptable.

Emerging pressure comes from specialized coaching-focused startups like CaptivateIQ and Spiff rapidly closing the technology gap with established compensation vendors, supported by venture capital targeting AI-driven forecasting and coaching capability specifically. Rankings could shift meaningfully over the coming decade as forecast accuracy and coaching effectiveness, rather than legacy compensation calculation alone, become the primary basis for competitive differentiation within the highest-value enterprise segment.
sales-performance-management-spm-software-market-company-positioning-matrix-1789993613674

Competitive Moat and Risk Dimensions

SAP

Moat: Bundled ERP and CRM Integration

SAP's moat rests on deep integration with its broader enterprise resource planning and customer relationship management suite, letting it bundle compensation management directly into existing enterprise software relationships rather than selling standalone software. Switching costs run high: customers already running SAP's core financial and HR systems face substantial migration friction considering a competing compensation vendor.
SAP

Risk: Slower AI Feature Development

SAP's broad enterprise focus means it moves slower than specialized SPM vendors on coaching and forecasting feature depth, particularly around AI-driven capability where nimbler competitors iterate faster. Customers seeking cutting capability increasingly evaluate specialized vendors alongside SAP, and if the gap widens, SAP risks losing new logo growth to focused competitors even while retaining its large existing installed base.
SALESFORCE

Moat: Dominant CRM Platform Integration

Salesforce pairs its compensation management capability with its dominant customer relationship management platform already embedded across most enterprise sales organizations, letting it sell integrated revenue operations solutions rather than standalone point products. This bundled positioning makes Salesforce difficult to displace within accounts already running its CRM for pipeline and opportunity management.
SALESFORCE

Risk: Per-Seat Pricing Model Pressure

Salesforce's per-seat pricing model faces pressure from vendors offering usage-based pricing that scales more predictably for high-growth companies expanding their sales headcount rapidly. Younger, specialized competitors are winning fast-growing accounts specifically because Salesforce's pricing model penalizes rapid sales team expansion, a segment increasingly important as venture-backed companies scale quickly.

Players Tracked

Prominent Players

SAP
Salesforce
Xactly
Varicent
Anaplan

Other Key Players

NICE
Oracle
Workday
Performio
CaptivateIQ
Spiff
QuotaPath
Iconixx
Optymyze
Beqom
Xoxoday Compass
Everstage
Palette Software
Blitz
Yield Solutions Group

Recent Developments

FEBRUARY 2026

SAP acquired a specialized AI coaching startup in February 2026, adding personalized rep development recommendations to its existing compensation management platform. The deal extends SAP's ability to compete directly with specialized coaching vendors, addressing growing customer demand for integrated forecasting and coaching capability rather than standalone compensation calculation alone.
Signal: Signals AI coaching becoming a required baseline platform feature for compensation vendors rather than a differentiator.
MAY 2026

Salesforce and a major cloud infrastructure provider announced a joint venture in May 2026 to deliver managed compensation hosting for mid-market companies lacking dedicated revenue operations teams. The venture combines Salesforce's compensation platform with elastic compute capacity, targeting companies previously priced out of enterprise-grade SPM software due to implementation costs.
Signal: Signals major cloud infrastructure providers partnering directly with compensation vendors to reach underserved mid-market SPM customers.
APRIL 2026

Xactly secured a multi-year supply agreement in April 2026 with a consortium of technology companies to deploy its compensation and forecasting suite across their combined sales organizations. The agreement represents one of the largest multi-company consortium deployments announced this year, reinforcing Xactly's positioning in cost-sharing arrangements among mid-sized technology companies.
Signal: Signals consortium-based deployments emerging as a viable and quite durable cost-sharing model for mid-sized tech companies.

Where Talent Costs Squeeze Vendor Margins

Cloud compute and data storage infrastructure represent approximately 22% of total cost of goods sold for SPM software vendors, with skilled implementation and customer success personnel adding a further 30%. Most vendors source infrastructure from a concentrated group of three hyperscale cloud providers, leaving them exposed to pricing changes during periods of elevated demand for compute capacity supporting AI forecasting features.
Skilled implementation consultant shortages during 2023 and 2024 extended average deployment timelines for several vendors, with major SPM providers reporting elevated professional services backlogs in their published earnings commentary during that same extended period of very tight overall labor supply. The disruption forced smaller vendors to delay planned customer onboarding, temporarily degrading the implementation experience that new customers had been promised during the sales process.

Smaller vendors without established implementation partner networks face a persistent competitive disadvantage, often paying higher effective delivery costs than larger competitors who have built scalable implementation methodologies and partner networks over many years. This exposure varies by business model too: vendors offering fully managed implementation absorb more talent cost volatility directly than those relying primarily on customer self-service configuration tools.
sales-performance-management-spm-software-market-cost-volatility-analysis-1789993613868

Building Scalable Implementation Playbooks and Templates

Larger vendors are investing in standardized implementation playbooks and configuration templates that reduce dependency on scarce senior consultant time for common deployment patterns across most customer types and industries alike. These templates allow less experienced staff to handle straightforward implementations, freeing senior consultants for the most complex enterprise engagements requiring specialized expertise and judgment.

Expanding Certified Implementation Partner Networks

Several vendors are certifying third-party systems integrators to deliver implementation services, reducing dependency on internal headcount during periods of elevated customer demand across the broader industry and overall global market landscape. This partner-delivered model adds modest revenue-sharing cost but has proven effective at maintaining consistent deployment timelines even during consultant shortages and talent constraints.

Automating Common Configuration Tasks Through Software

Several vendors are building self-service configuration tools that automate common plan setup tasks previously requiring manual consultant intervention, reducing the professional services hours needed per customer implementation significantly and quite consistently over time. This engineering investment reduces ongoing talent cost exposure and shortens the deployment timeline for customers with standard compensation structures and plan designs.

Portfolio Architecture for Margin Defence

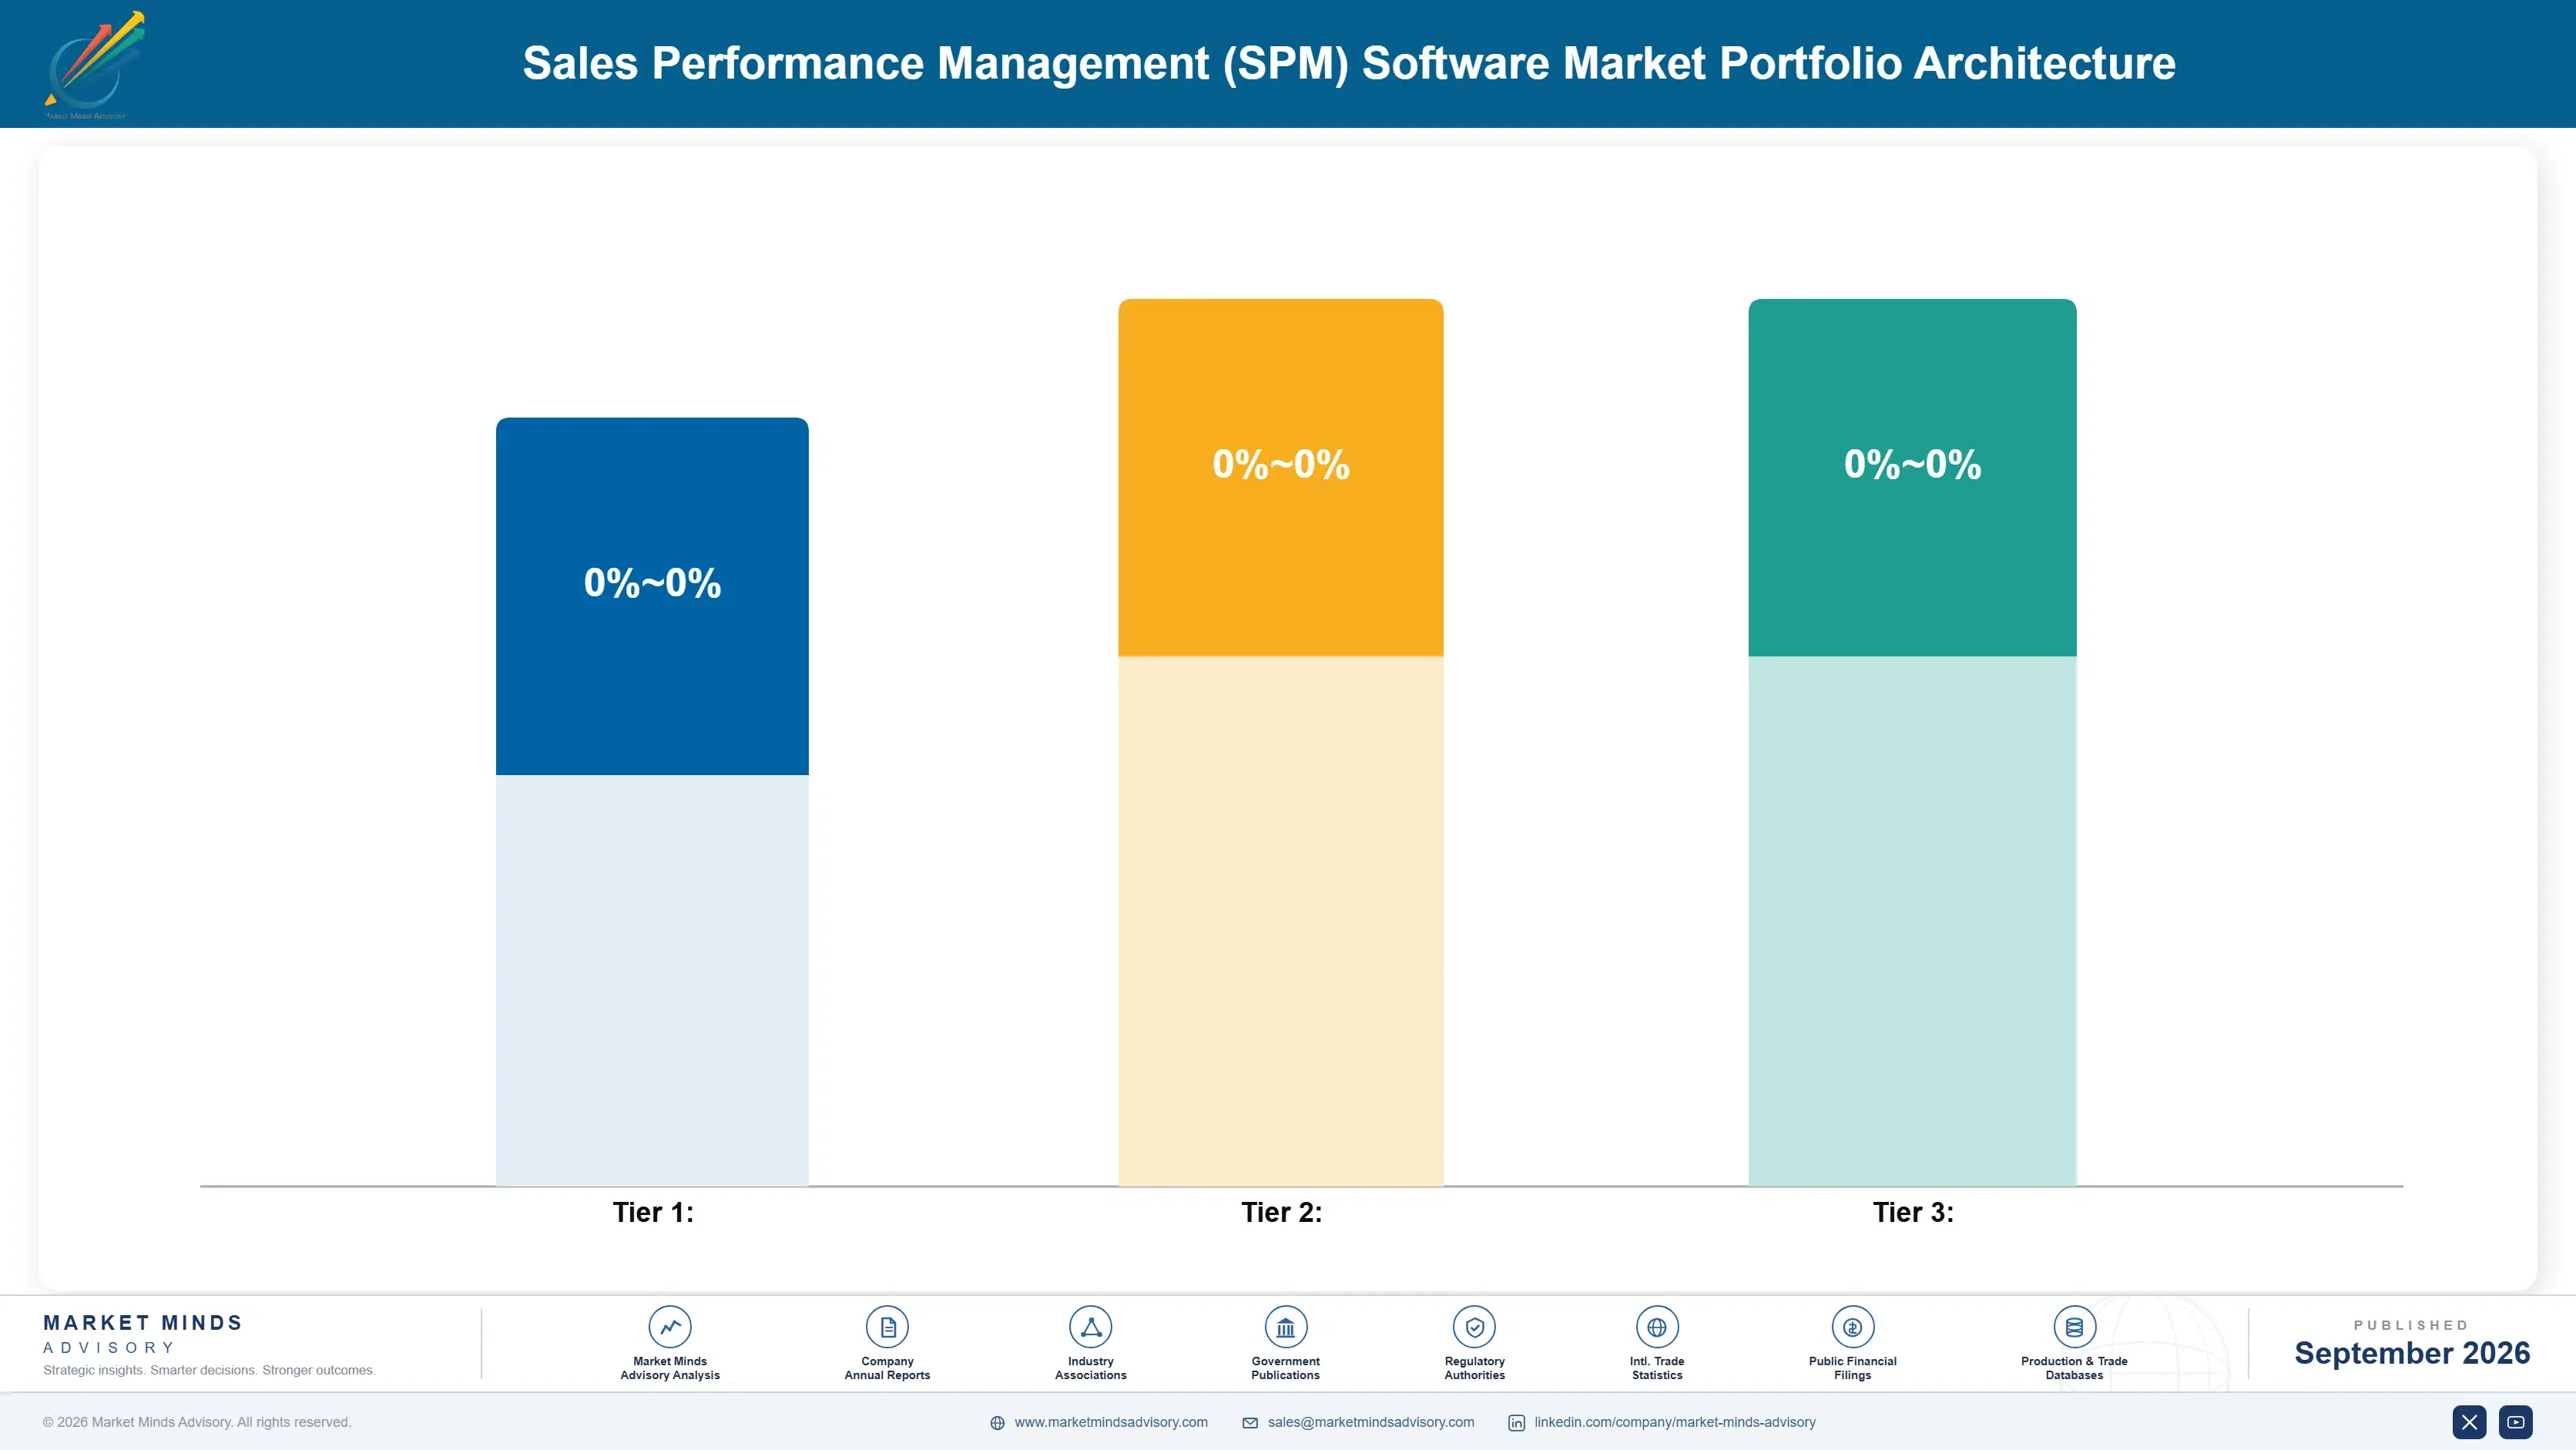
Portfolio architecture in SPM software splits into three distinct tiers, ranging from commodity spreadsheet-replacement compensation calculators competing on price to certified AI-driven revenue operations suites carrying substantial margin premiums. Gross margins vary from the mid-twenties on basic compensation calculation licenses to over 55% on integrated platforms with AI forecasting and coaching capability, reflecting the platform sophistication and implementation expertise required to sell credibly into large enterprise sales organizations.
Volume economics still matter for smaller companies, since basic incentive compensation licenses account for a meaningful share of total contracts signed annually across small and mid-market businesses. But value concentrates elsewhere: large enterprises running AI-driven forecasting and coaching platforms with managed implementation services generate a disproportionate share of vendor profit, paying recurring fees for capability that basic compensation calculators cannot deliver at comparable sophistication.

The highest-value pools sit at the intersection of AI forecasting accuracy and coaching effectiveness, where vendors combining both can command premium pricing that pure compensation calculators cannot match. Emerging categories, including ethical AI governance for automated coaching recommendations, remain smaller today but are attracting disproportionate development investment, since regulatory scrutiny creates durable competitive barriers that commodity vendors struggle to clear.

Basic compensation calculation licenses sold largely on per-seat price, with gross margins in the mid-twenties given intense competition from low-cost regional and legacy vendors offering limited product differentiation and features.
Gross Margin

AI-driven revenue operations platforms carrying proven forecast accuracy and coaching effectiveness track records, commanding gross margins in the low forties as enterprises pay for measurable quota attainment improvement outcomes achieved.
Gross Margin

Fully integrated, governance-validated platforms paired with managed implementation and coaching services, achieving gross margins above 55% through certification barriers that competitors cannot quickly or easily replicate at any real scale.
Gross Margin
sales-performance-management-spm-software-market-portfolio-architecture-1789993614376

High-value Sub-segments and Strategic Watch-out

AI-Driven Sales Forecasting and Coaching Platforms

AI-driven sales forecasting and coaching platforms combine the fastest projected growth with the highest per-contract margins in the portfolio, driven by accelerating demand for predictive pipeline management over retrospective reporting. Vendors capturing this segment early are positioned to defend pricing power as customers standardize on AI-driven platforms.

Incentive Compensation Management Systems

Incentive compensation management systems pair strong growth with meaningful margin premiums, supported by complex, multi-tiered compensation plans requiring sophisticated calculation infrastructure across large enterprise organizations. This segment carries higher implementation barriers than simpler point solutions, which limits new entrant competition and helps established vendors retain pricing discipline.

Quota Planning Systems

Quota planning systems represent the volume core of the market, generating a steady contract base even as growth moderates relative to AI-driven forecasting and compensation categories. Margins here run moderately thinner, but the recurring annual planning cycle obligation provides vendors with a durable revenue stream across every enterprise customer relationship.

Legacy On-Premise Compensation Tools

Legacy on-premise compensation tools carry the slowest growth in the portfolio and warrant strategic monitoring rather than heavy near-term investment, given accelerating displacement by cloud-native alternatives across the industry. A slower-than-expected cloud migration timeline at conservative enterprises could extend this segment's relevance meaningfully within certain regulated industries.

Where Compensation Spending Becomes Recurring Infrastructure

SPM software deployments generate annuity-like economics once integrated into a company's payroll and financial reporting workflows, since enterprises rarely rip out functioning compensation infrastructure feeding critical downstream financial processes. Vendors capture recurring revenue through subscription renewals, coaching add-ons, and increasingly through cross-business unit expansion tiers layered on top of the original platform license, creating revenue that compounds over the customer relationship's lifetime.
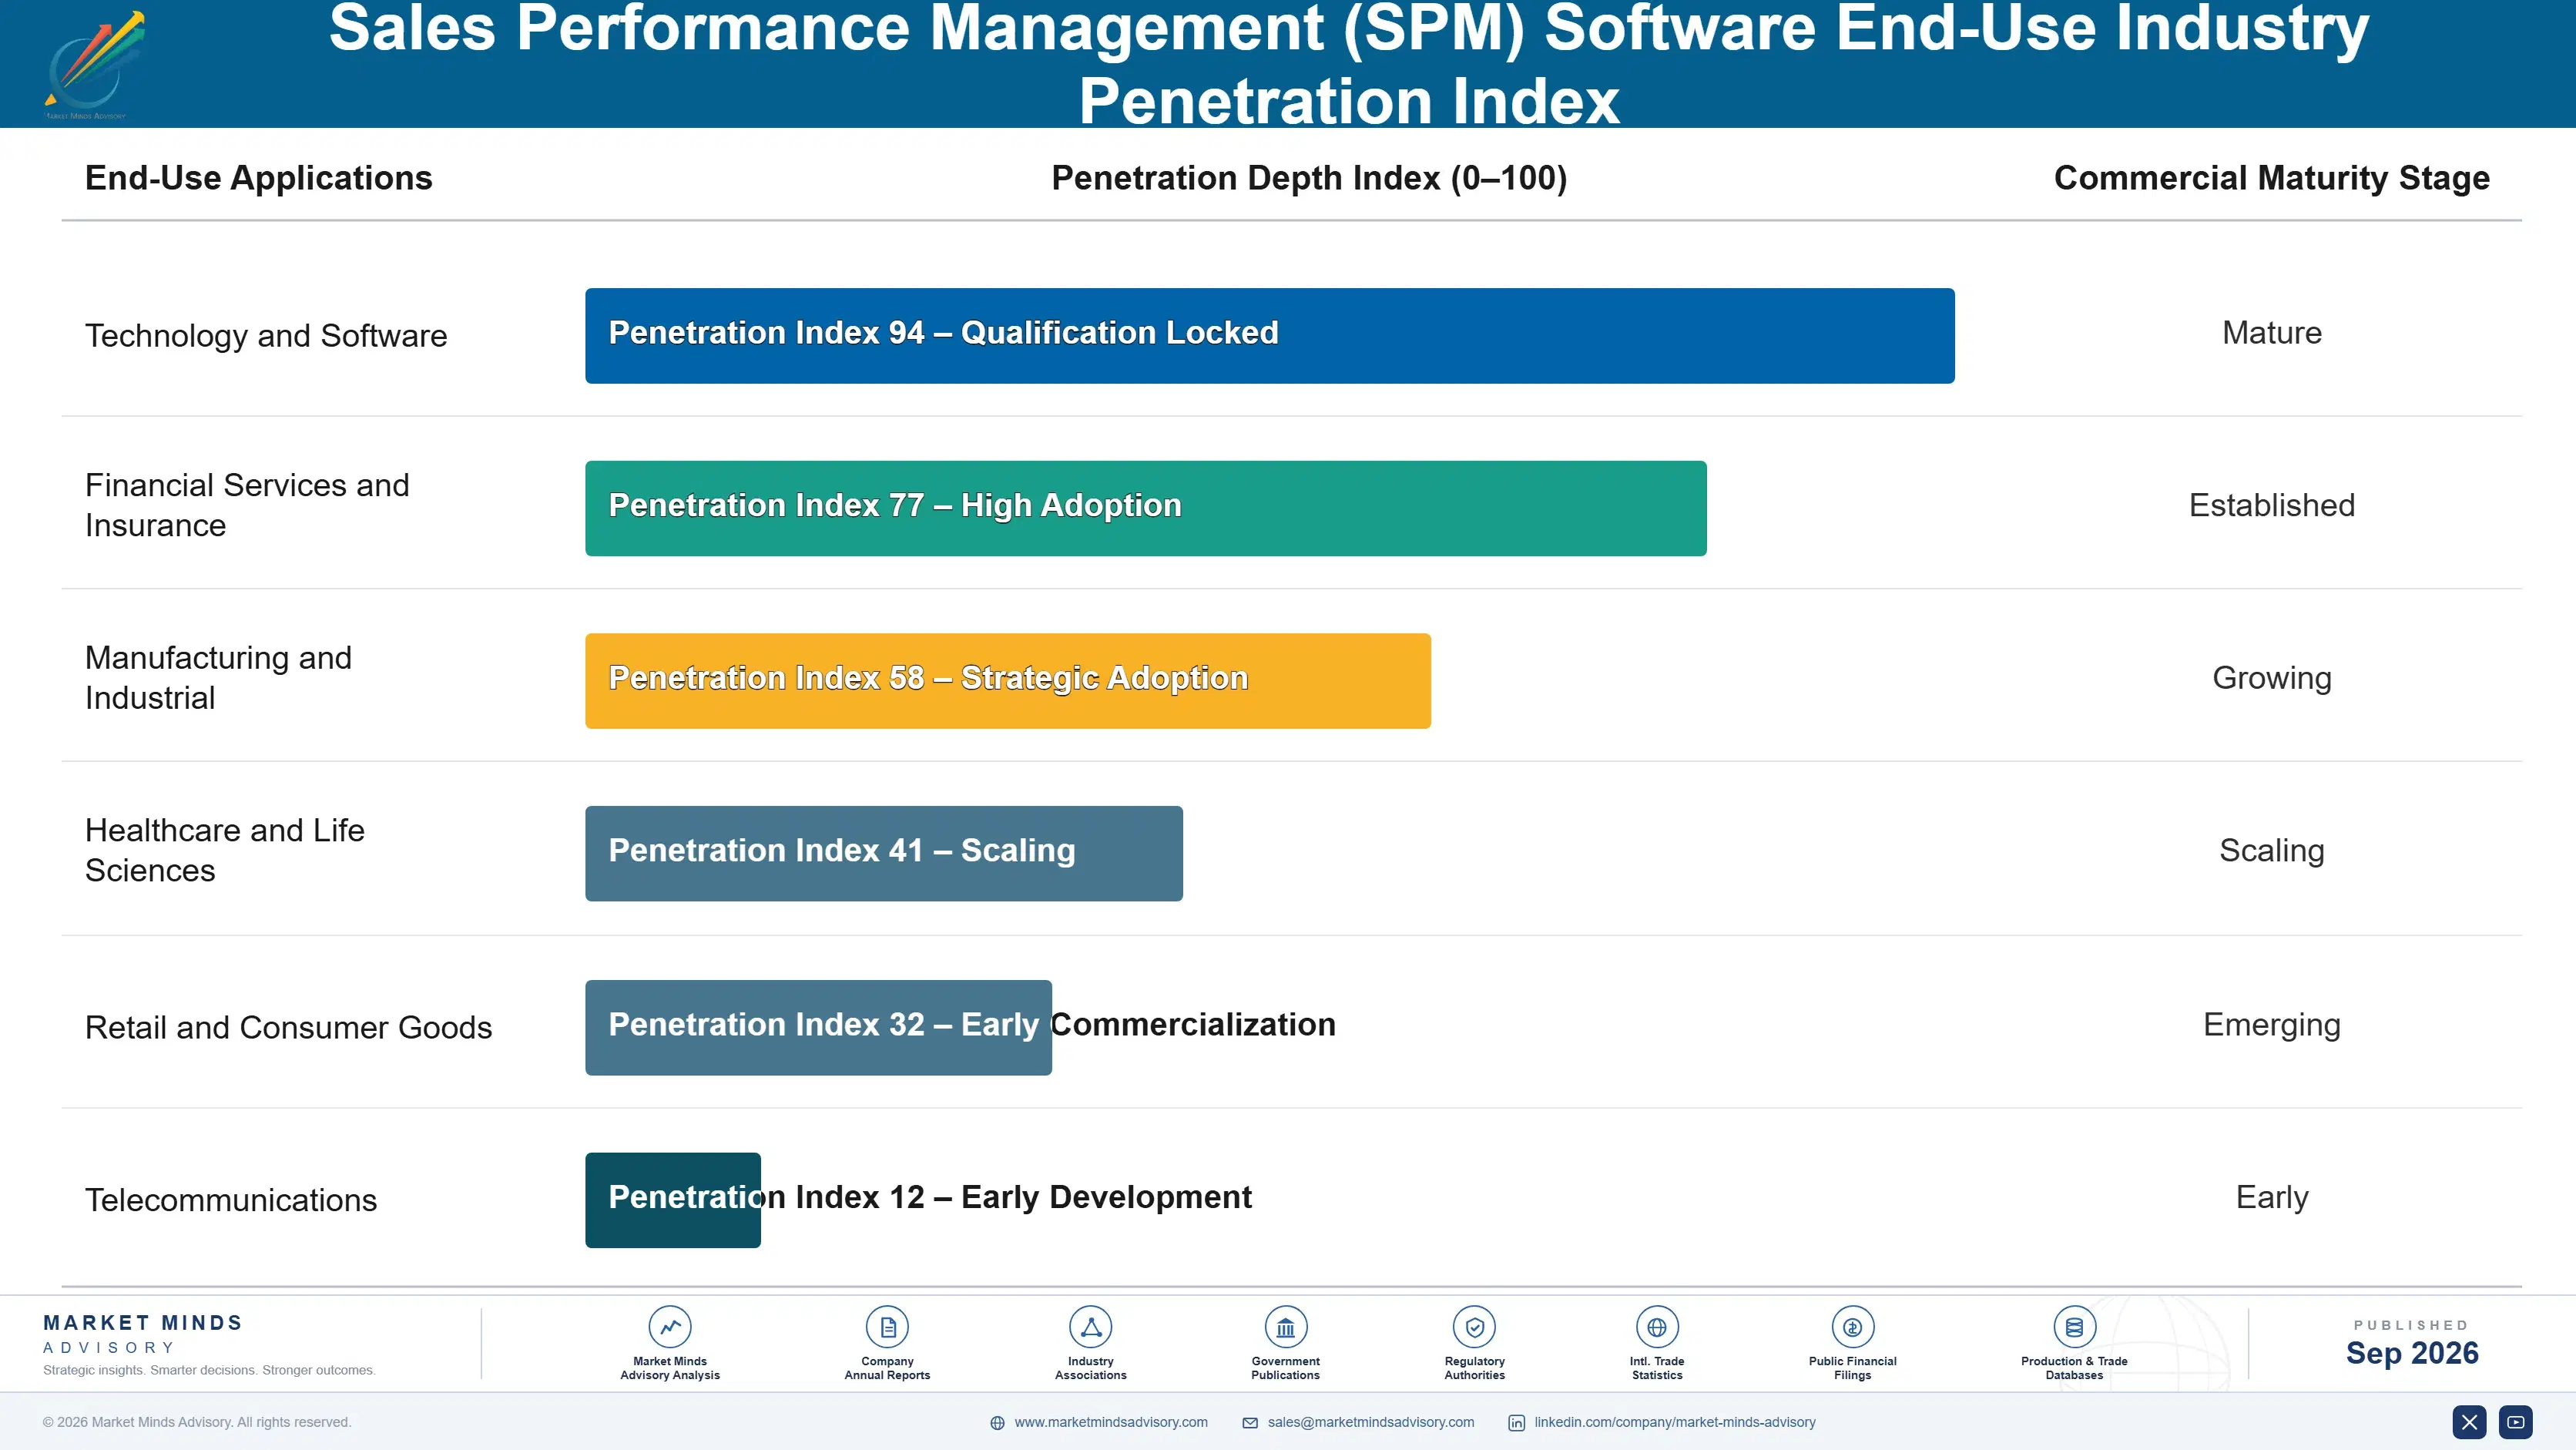
Adoption depth and stickiness vary considerably by end-use vertical. Large enterprises with complex, multi-tiered compensation plans, once integrated with a vendor's calculation engine and reporting workflows, rarely switch providers given the requalification burden involved, while smaller companies show comparatively higher churn given simpler compensation structures and lower switching costs. Mid-market companies sit between these extremes, anchored by growing complexity but still exposed to competitive displacement during major platform upgrade cycles.

A generational shift in buyer profile is underway as chief revenue officers and revenue operations leads, rather than pure finance executives, increasingly influence the purchasing decision for SPM platforms. These technical buyers prioritize forecast accuracy and coaching effectiveness over legacy compensation calculation reputation, favoring vendors who can demonstrate measurable quota attainment outcomes across comparable customer deployments rather than theoretical accuracy claims.
sales-performance-management-spm-software-market-end-use-penetration-index-1789993614863

Where Vendors Should Focus Investment

These are among the four positions where our research anticipates prominent divergence between winners and laggards over the coming forecast period. Each is grounded in the demand model, the regulatory perimeter, and the announced capacity pipeline.
01 / AI FORECASTING INVESTMENT PRIORITY

Prioritize AI forecasting accuracy over legacy compensation features

Enterprises now value forecast accuracy as much as compensation calculation reliability, since an accurate forecast directly affects board confidence and resource allocation decisions across the entire organization and its many teams, stakeholders, and departments. SAP and Salesforce have already demonstrated this shift, investing heavily in AI forecasting capability to defend pricing power against specialized coaching-focused startups lacking comparable enterprise scale. Vendors delaying this investment risk losing enterprise renewals to competitors offering measurable forecast accuracy improvement as a standard platform feature.
02 / MANAGED IMPLEMENTATION SERVICE EXPANSION

Build managed implementation services to capture recurring revenue

Enterprises with complex, multi-tiered compensation plans consistently underestimate migration complexity, creating a persistent barrier that vendors can address through managed implementation services offered as a bundled deployment phase rather than an afterthought during the initial sales process. Vendors without this service layer capture only the initial software license value, leaving substantial recurring revenue on the table that service-oriented competitors are actively capturing instead. Building managed implementation capability should be treated as a core strategic priority rather than an optional add-on.
03 / NATIVE CRM INTEGRATION PRIORITY

Deepen CRM integration to satisfy enterprise procurement requirements

Enterprises are increasingly requiring native, bidirectional CRM integration before considering a vendor seriously at all, since compensation accuracy depends entirely on clean, real-time access to opportunity and transaction data across the entire sales pipeline. Vendors lacking certified native integration increasingly find themselves excluded from enterprise procurement shortlists during vendor evaluation, regardless of other feature strengths they might otherwise offer. This dynamic will likely intensify as more enterprises formalize integration certification as a mandatory procurement requirement rather than a nice-to-have consideration.
04 / CROSS-BUSINESS UNIT CONSOLIDATION STRATEGY

Pursue cross-business unit consolidation ahead of enterprise standardization

Large multinational companies are increasingly consolidating compensation management onto a single platform across business units and geographies, seeking unified visibility rather than fragmented departmental point solutions purchased independently over time and across many separate budget cycles. Vendors offering consolidated multi-unit capability early can position themselves as preferred enterprise-wide partners ahead of competitors still selling primarily through single-department relationships within larger organizations. This dynamic will likely accelerate as more enterprises formalize revenue operations standardization initiatives spanning their entire global sales organization.

Engagement Snapshot From the Field

A live engagement with an industry participant carrying material or product regulatory and market exposure ahead of a defining policy shift, showing how our research translates into a defensible multi-year portfolio strategy.
MARKET MINDS ADVISORY · CLIENT ENGAGEMENT SUMMARY
Sales Performance Management (SPM) Software Producer Strategic Portfolio Review and Transition Roadmap 2026·Investment Scenario on Sales Performance Management (SPM) Software Exposure Evaluation 2025-26
CLIENT PROFILE
The client is a global technology reseller operating sales teams across a dozen countries with several thousand quota-carrying representatives, generating substantial annual revenue (client-reported, unverified by MMA). The organization had relied on regional spreadsheet-based compensation tracking for over a decade, accumulated through multiple market expansions, resulting in inconsistent calculation logic across different regional sales teams.
STRATEGIC CHALLENGE
The client faced escalating compensation dispute volumes that had grown unsustainable, consuming finance and sales operations resources exceeding budget projections annually by a meaningful margin each and every quarter (client-reported, unverified by MMA). Leadership needed a unified compensation strategy replacing fragmented regional spreadsheets without disrupting ongoing quarterly payout cycles already scheduled.
MMA APPROACH
MMA conducted a comprehensive audit of existing calculation logic gaps, vendor consolidation opportunities, and total cost of ownership across three competing AI-driven SPM platforms under evaluation by the client. The engagement combined primary interviews with sales operations and finance leadership, competitive vendor benchmarking against the framework outlined in this report, and a phased migration sequencing model prioritizing highest-dispute regions first.
KEY FINDINGS
  1. Regional compensation calculation logic inherited from three separate market expansions had never been consolidated, creating overlapping and sometimes contradictory commission rules across regions.
  2. The compensation dispute rate exceeded 12% of all monthly payouts across all regions combined, well above industry benchmarks, driven primarily by calculation errors in legacy spreadsheet formulas.
  3. Regions using dedicated SPM software showed dispute rates roughly 70% lower than regions still relying on spreadsheet-based tracking, according to internal client benchmarking data reviewed.
  4. Sales operations staff turnover correlated directly with dispute resolution workload, as experienced analysts left for competitors offering better-supported, lower-volume compensation management environments with modern tooling.
CLIENT PROFILE
The client is a global technology reseller operating sales teams across a dozen countries with several thousand quota-carrying representatives, generating substantial annual revenue (client-reported, unverified by MMA). The organization had relied on regional spreadsheet-based compensation tracking for over a decade, accumulated through multiple market expansions, resulting in inconsistent calculation logic across different regional sales teams.
STRATEGIC CHALLENGE
The client faced escalating compensation dispute volumes that had grown unsustainable, consuming finance and sales operations resources exceeding budget projections annually by a meaningful margin each and every quarter (client-reported, unverified by MMA). Leadership needed a unified compensation strategy replacing fragmented regional spreadsheets without disrupting ongoing quarterly payout cycles already scheduled.
MMA APPROACH
MMA conducted a comprehensive audit of existing calculation logic gaps, vendor consolidation opportunities, and total cost of ownership across three competing AI-driven SPM platforms under evaluation by the client. The engagement combined primary interviews with sales operations and finance leadership, competitive vendor benchmarking against the framework outlined in this report, and a phased migration sequencing model prioritizing highest-dispute regions first.
KEY FINDINGS
  1. Regional compensation calculation logic inherited from three separate market expansions had never been consolidated, creating overlapping and sometimes contradictory commission rules across regions.
  2. The compensation dispute rate exceeded 12% of all monthly payouts across all regions combined, well above industry benchmarks, driven primarily by calculation errors in legacy spreadsheet formulas.
  3. Regions using dedicated SPM software showed dispute rates roughly 70% lower than regions still relying on spreadsheet-based tracking, according to internal client benchmarking data reviewed.
  4. Sales operations staff turnover correlated directly with dispute resolution workload, as experienced analysts left for competitors offering better-supported, lower-volume compensation management environments with modern tooling.
RECOMMENDED STRATEGY
Phase 1: Consolidate all regional compensation calculation logic onto a single unified platform within eighteen months, prioritizing the highest-dispute regions for immediate migration first. Phase 2: Standardize commission calculation rules across regions while preserving necessary local compliance variations, eliminating the inconsistent logic that drove most calculation disputes. Phase 3: Redesign sales operations staffing around the reduced dispute volume, redeploying experienced analysts toward strategic compensation design work rather than routine dispute resolution.
OUTCOME
Within twelve months of platform consolidation, the client reported compensation dispute rates falling from 12% to approximately 4%, cutting dispute resolution labor costs meaningfully across all twelve served regions worldwide (client-reported, unverified by MMA). Sales operations staff turnover also declined meaningfully following the reduced workload.

Frequently Asked Questions

Foundational context covering the market sizes, CAGR, scope, country, region and competition that inform every finding below. This section is provided to cover basics and most often pre-purchase conversations, answered from the MMA Primary Research Dataset.

What is the current size of the Sales Performance Management (SPM) Software Market?

The Sales Performance Management Software Market reached an estimated $4.6 billion in 2025. This base reflects rising enterprise investment in AI-driven forecasting and coaching capability across sales organizations.

How large will the Sales Performance Management (SPM) Software Market be by 2036?

The market is projected to reach approximately $13.1 billion by 2036. This growth reflects sustained enterprise SaaS adoption, expanding AI forecasting capability, and CRM integration standardization globally.

What is the CAGR for the Sales Performance Management (SPM) Software Market 2026 to 2036?

The Sales Performance Management Software Market is projected to grow at a 10.0% compound annual growth rate between 2026 and 2036. This rate reflects accelerating AI adoption across enterprises.

Which segment is growing fastest?

AI-Driven Sales Forecasting and Coaching Platforms is the fastest-growing segment, expanding at 15.0% annually, roughly 1.5 times the overall market rate. This reflects accelerating demand for predictive pipeline management.

Who are the major companies in the Sales Performance Management (SPM) Software Market?

Major companies include SAP, Salesforce, Xactly, Varicent, and Anaplan. These vendors combine deep enterprise software platform integration with expanding AI-driven forecasting, coaching, and analytics capability.

Which country is growing fastest?

India is the fastest-growing country, driven by its expanding technology and business process outsourcing sector requiring sophisticated compensation infrastructure. Its 13.5% projected CAGR outpaces the broader South Asia and Pacific regional average.

Report Segmentation Architecture

The full report scope spans multiple orthogonal segmentation dimensions, with cross-tabulated demand data provided for each dimension pair. Coverage extends further to regional breakdowns, trend trajectories, and the competitive detail needed to support segment-level decision-making.

By Application Function

  • AI-Driven Sales Forecasting and Coaching Platforms
  • Incentive Compensation Management Systems
  • Quota Planning Systems
  • Territory Design Systems
  • Sales Performance Analytics Systems
  • Legacy On-Premise Compensation Tools

By End-Use Industry

  • Technology and Software
  • Financial Services and Insurance
  • Manufacturing and Industrial
  • Healthcare and Life Sciences
  • Retail and Consumer Goods
  • Telecommunications

By Commercial Dimension

  • Software Licensing
  • Managed Implementation Services
  • AI Coaching Module Subscriptions
  • Implementation and Support Services

By Region

  • North America
  • Western Europe
  • East Asia
  • South Asia and Pacific
  • Latin America
  • Middle East and Africa
  • Eastern Europe

Scope, Methodology, and Coverage

Every figure in this report is reproducible from documented input assumptions. The scope below maps the historical period, the forecast horizon, the segmentation dimensions, and the countries covered, alongside the underlying primary and qualitative methodology.
Historical Period
2020 to 2025
Forecast Period
2026 to 2036
Base Year
2025 (USD billions; MMA Primary Research Dataset, September 2026)
Market Definition
The Sales Performance Management Software Market covers platforms that automate incentive compensation calculation, quota planning, territory design, and sales coaching for revenue-generating teams. It excludes general customer relationship management platforms and standalone business intelligence tools sold independently of compensation functionality.
Quantitative Units
USD Billion, CAGR (%)
Segmentation Dimensions
By Application Function, By End-Use Industry, By Commercial Dimension, By Region
Regions Covered
North America, Western Europe, East Asia, South Asia and Pacific, Latin America, Middle East and Africa, Eastern Europe
Countries Covered
United States, Canada, Germany, United Kingdom, France, China, Japan, South Korea, India, Australia, Brazil, Mexico, Saudi Arabia, United Arab Emirates, Poland
Key Companies Profiled
SAP, Salesforce, Xactly, Varicent, Anaplan, NICE, Oracle, Workday, Performio, CaptivateIQ, Spiff, QuotaPath, Iconixx, Optymyze, Beqom, Xoxoday Compass, Everstage, Palette Software, Blitz, Yield Solutions Group
Quantitative Methodology
Primary survey, n=3,800 respondents, Q4 2025, six countries; demand-side model with trade association cross-validation
Qualitative Methodology
47 expert interviews, Q4 2025; applied to validate demand model assumptions, identify emerging dynamics, and assess competitive positioning
Report Format
PDF and XLSX data workbook (Word format preview document)
Publisher
Market Minds Advisory
Report Code
MMA-2026-TEC-948
Published
September 2026
Contact
sales@marketmindsadvisory.com | www.marketmindsadvisory.com

Purchase the full Sales Performance Management (SPM) Software Market Report (2026 to 2036).

This report provides comprehensive analysis of the Sales Performance Management Software Market across all major application functions, regions, and competitive dynamics through 2036. It combines primary survey data from 3,800 respondents with 47 expert interviews conducted across six countries during the fourth quarter of 2025. The analysis covers segment-level growth forecasts, regional demand architecture, and competitive positioning assessments across the full ten-year forecast horizon, spanning compensation and coaching applications. Readers gain the strategic context needed to inform investment prioritization, vendor selection, and market entry timing decisions.
Ten-year market sizing and forecast model
Segment-level growth and margin analysis breakdown
Regional demand architecture across seven regions
Competitive benchmarking and moat risk assessment
Input cost exposure and mitigation strategies
Anonymized client engagement case study review

Built For The People Who Decide

From boardroom strategy to bench-side execution, this report is read cover-to-cover by leaders shaping the next decade of their industry, turning demand scenarios, market dynamics and valuation benchmarks into decisions.
CXOs/ Presidents/ VPs/ Managers
M&A and Corporate Development
Strategy Teams and R&D Heads
Procurement and Product Directors
Regulatory and Compliance Leaders
Investor Relations and Equity Analysts