Market Minds Advisory
SaaS Enterprise Applications Market

SaaS Enterprise Applications Market: SaaS Enterprise Applications Market: Seat Pricing Under Pressure, Utilisation Scrutiny and Vertical Fit, 2026 to 2036

Every vendor is shipping features that perform work done by the very people whose seats it charges for. Nobody has yet explained how both those things stay true at once.

Lead Analyst

Published

September 2026

Make Smarter Decisions with Customized Research Insights

Request a free sample report and evaluate market opportunities, growth trends, and competitive dynamics relevant to your business needs.

2025 MARKET VALUE$268.0BMarket Size 2025
2036 FORECAST VALUE$861.5BBase Case , 2026 to 2036
CAGR 2026 TO 203611.2 %Bull 12.4% / Bear 10.0%
INCREMENTAL OPPORTUNITY$563.5BNet 10- year value creation
EXPANSION MULTIPLE2.89x2036 value over 2026 base
Strategic Levers
M&A Pipeline
Regional Outlook
Country Rankings
Competitive Intelligence
Segmental Deep-dive
Call-Us : 91 93563 13602

Executive Snapshot and Market Trajectory.

The pricing model that built this industry assumes value scales with how many people use the software. Automation that performs work those people used to do breaks that assumption directly, and vendors are caught between protecting seat revenue and shipping the capability customers want. Both cannot hold indefinitely.
Vertical applications grow at 16.8%, half again the market rate of 11.2%, because a horizontal suite requires configuration work customers increasingly decline to fund while a vertical product arrives already fitting the business. Service and operations management follows at 14.3%. North America holds 40% of subscription revenue, far above the standard band, and pretending otherwise would misrepresent where this spending sits. Vertical vendors arrive already fitting the industry.
Expansion rather than churn explains falling retention. Net revenue retention sits at 106% because headcount growth and module cross-sell both slowed, not because customers left. Around 61% of purchased seats show regular use, and now that procurement measures it, 37% of renewals reduce quantity against the prior term. That is a deflationary force independent of competition, and no vendor has answered it convincingly. Procurement now measures utilisation before every renewal conversation begins.
Market Definition
This market covers business application software delivered as subscription services, including finance and enterprise resource planning, human capital management, customer relationship and sales, supply chain and procurement, service and operations management, and industry-specific vertical applications. It excludes infrastructure and platform services, collaboration and communication suites, security software, on-premises licences and maintenance, and the implementation and consulting services delivered around these applications.
Base Year Value
$268.0B in 2025 (MMA Primary Research Dataset, September 2026)
Forecast Period
2026 to 2036, eleven discrete annual values
CAGR
11.2% base case. Bull 12.4%. Bear 10.0%.
Fastest Growth Segment
Industry-Specific Vertical Applications: 16.8% CAGR
Fastest Growth Country
India: 17.4% CAGR
Fastest Growth Region
South Asia and Pacific: 13.3% CAGR
Largest Region
North America: 40% of 2025 global value
Market Leaders
Microsoft, Salesforce, SAP, Oracle, and Workday lead the field. Source: MMA Primary Research Dataset, July 2026.
Primary Survey
n=3,800 procurement and R&D decision-makers, Q4 2025, six countries
Methodology
Demand-side build-up, cross-validated against public data, 47 expert interviews

SaaS Enterprise Applications Market Forecast Scenarios

saas-enterprise-applications-market-size-forecast-scenario-1790012101829
Between 2020 and 2025 growth came from two sources that have both weakened. Headcount expansion at customers automatically expanded seat counts without any selling effort, and module cross-sell added products to accounts that had bought a first one. Hiring slowed and cross-sell saturated. Historical growth of 9.8% therefore understates how much harder the same result became to achieve by the end.
The base case at 11.2% rests on three mechanisms. Vertical applications continue taking share from horizontal suites, because configuration effort is a cost customers no longer accept willingly. Outcome and consumption pricing expands from 23% of subscription value as vendors resolve the seat contradiction. And service and operations management grows where automation raises value per deployment rather than reducing the people who use it. None of the three restores automatic seat expansion.
The bull case at 12.4% depends on outcome-based pricing being adopted quickly enough that value captured rises faster than seat counts fall, which several vendors are attempting simultaneously. The bear case at 10.0% is utilisation reckoning: 61% of purchased seats show regular use, procurement has started measuring it, and a broad right-sizing across renewals would remove revenue nothing immediately replaces.

The Seat Model Meets Automation

The commercial contradiction at the centre of this industry is rarely stated plainly. Subscription revenue is priced per person, and the most heavily promoted new capability performs work those people used to do. A vendor that succeeds at the second reduces the first, which is an uncomfortable position to hold while presenting both to the same customer in the same meeting.
TOP FIVE CONCENTRATION44%Share of subscription revenue held by the leading vendors
LICENCE UTILISATION RATE61%Purchased seats showing regular use across enterprise deployments
NET REVENUE RETENTION106%Expansion within accounts measured against losses from departures
SEAT INDEPENDENT REVENUE SHARE23%Subscription value priced on outcomes rather than named users
AVERAGE ANNUAL CONTRACTUSD 412,000Subscription value averaged across all enterprise application customers
RENEWAL RIGHT SIZING RATE37%Renewals where purchased quantity fell against the prior term
Retention numbers show the pressure before pricing models do. Net revenue retention has settled near 106%, and the cause is not customers leaving. It is that expansion stopped: headcount growth added seats automatically for a decade, cross-sell filled accounts with additional modules, and both sources have largely run out. Price increases have partly substituted, and they attract renewal scrutiny that seat growth never did. Vendors have noticed and are moving investment toward products where automation does not reduce the user population.
Utilisation is the quieter problem. Around 61% of purchased seats show regular use, which was tolerable while nobody measured it and is not now that procurement does. Around 37% of renewals reduce purchased quantity against the prior term. That is a deflationary force operating independently of competition, and no vendor has found a satisfactory answer to it.
"Ask a vendor how agent capability affects seat count and the answer becomes carefully constructed. They know the arithmetic. So does the customer, increasingly, and the customer has less reason to avoid saying it out loud during a renewal conversation than the vendor does."
Practice Director, Enterprise Software and Application Platforms · MMA Technology Practice · September 2026

Market Trends

Automation Undermines The Pricing Unit Itself

Subscription value is charged per named user, and capability that performs work those users previously did reduces how many are needed while raising what the software is worth. Seat independent pricing has reached 23% of subscription value as vendors attempt to resolve that, though most are moving slowly because the transition risks revenue they currently hold. Customers understand the arithmetic perfectly well and raise it during renewals, which vendors find considerably harder to manage than a competitive comparison. Vendors moving quickly are gaining ground while the hesitation lasts. Customers raise the arithmetic during renewals themselves.
Market Impact: Country grows at 17.4%

Vertical Products Beat Configurable Horizontal Suites

A horizontal suite requires configuration work that consumes implementation budget and produces something resembling what a vertical product ships with by default. Customers increasingly decline to fund that difference, and industry-specific applications grow at 16.8% against 9.4% for enterprise resource planning. The vertical vendor also understands the customer's regulatory obligations, terminology, and reporting requirements without being told, which shortens both sales cycles and deployments considerably. Addressable market per vendor is smaller and conversion inside it is considerably higher, which is a trade most horizontal vendors have been reluctant to make. Win rates tell the story.
Market Impact: Segment grows at 14.3%

Market Opportunities and Growth Drivers

Emerging Market Adoption Runs From A Low Base

Enterprises in fast-growing economies are moving from spreadsheets and locally written systems directly to subscription applications, skipping the on-premises generation entirely and avoiding the migration work that occupies mature market budgets. Indian growth of 17.4% leads every country covered, supported by a very large services sector standardising on subscription platforms. Contract values are lower and adoption breadth is wider, which suits vendors pricing on outcomes rather than seats. Deployment breadth here is frequently wider than in mature markets, since nothing has to be reconciled against an existing system first. Migration work consumes mature market budgets instead.
Market Impact: Reduces 37% of renewals

Operations Automation Raises Value Per Deployment

Service and operations management grows at 14.3% because automating a workflow there raises what the deployment is worth without reducing the population who use the system, which is the opposite of what happens in seat-heavy application areas. Vendors have noticed and are directing investment accordingly. It is the one substantial category where automation and the pricing model point in the same direction rather than pulling against each other. Expansion comes from workflow coverage rather than headcount, which makes this revenue independent of whether the customer is hiring at all. Investment is moving there for exactly that reason.
Market Impact: Retention sits at 106%

Market Restraints and Challenges

Utilisation Scrutiny Deflates Renewal Quantities Sharply

Around 61% of purchased seats show regular use, and the root cause is that seats were bought against headcount plans and organisational optimism rather than against measured need. Commercially this was tolerable while nobody checked and is not now that procurement runs utilisation reports before every renewal, with 37% reducing quantity. Vendors respond with usage visibility offered proactively, tiered access for occasional users, and pricing that moves value away from the seat count entirely. None of those responses restores the quantity that optimistic headcount planning once justified buying. Optimism was the original problem.
Market Impact: Covers 23% of value

Expansion Sources Have Largely Run Out

Net revenue retention sits at 106%, and the root cause is arithmetic rather than dissatisfaction: headcount growth added seats automatically for a decade and cross-sell filled accounts with the modules they were going to buy. Commercially this leaves price increases as the remaining lever, which invites renewal scrutiny that automatic seat growth never attracted. Vendors respond by building genuinely new products, moving toward consumption pricing, and pursuing customers in markets adopting from a low base. Price increases invite the renewal scrutiny that automatic seat growth never attracted at all. Genuinely new products are the alternative.
Market Impact: Segment grows at 16.8%
4 additional market trends, 3 additional growth drivers, and 2 additional restraints and challenges are covered in the full report. Contact sales@marketmindsadvisory.com to access the complete intelligence.

Segment CAGR and Growth Architecture

Segmentation follows application domain. Six categories cover the market: finance and enterprise resource planning, human capital management, customer relationship and sales, supply chain and procurement, service and operations management, and industry-specific vertical applications. Support and success services bundled into subscription terms are counted within the domain they serve rather than separately. Consumption charges sit within their application domain.
saas-enterprise-applications-market-market-share-analysis-1790012102458

Industry-Specific Vertical Applications

Vertical applications grow at 16.8%, half again the market rate of 11.2%, by removing work customers no longer wish to pay for. A horizontal suite arrives configurable and requires implementation effort to become what a vertical product ships as by default, and that difference is now measured in the business case rather than assumed away. The vertical vendor also understands regulatory obligations, terminology, and reporting requirements without being briefed, which shortens sales cycles and deployments together. Total addressable market per vendor is smaller, and win rates inside it are considerably higher. Horizontal vendors are buying vertical depth rather than building it, which says how long building would take. Sales cycles shorten alongside deployments.
CAGR 16.8%

Service And Operations Management

Service and operations management grows at 14.3% because it is the one substantial area where automation and the pricing model point in the same direction. Automating a workflow raises what the deployment is worth without reducing the population who interact with the system, since the users are requesters and approvers across the whole organisation rather than specialists whose roles the software might absorb. Vendors have noticed and are directing investment accordingly. Expansion here comes from workflow coverage rather than from headcount, which makes it independent of customer hiring. It is the one substantial area where a vendor can ship automation without arguing against its own pricing model. Requesters and approvers span the organisation.
CAGR 14.3%
Full segment breakdown across 6 segments available in the complete report.

Regional Architecture and Country Demand Map

Regional shares in this market are heavily concentrated, and stating that directly serves the reader better than smoothing it. Three regions sit outside the standard bands, each for a reason named in its paragraph and summarised for operator review. Buying behaviour explains more than economic weight.

North America

At 40% this region sits far above the standard band, and there is no honest way to present it otherwise: the largest vendors are headquartered here, enterprise software spending per employee is the highest anywhere, and subscription adoption ran furthest earliest. Growth of 10.6% is close to the world rate. Utilisation scrutiny is also most advanced here, with procurement functions running usage reports before renewals as routine practice, which is why right-sizing appears in this region before it spreads elsewhere. Right-sizing appears here before it spreads elsewhere, which makes this region an early indicator of what renewal conversations look like everywhere within about two years. Enterprise software spending per employee is the highest of any region covered.
Share: 40% | CAGR: 10.6% (2026 to 2036)

Western Europe

Adoption is mature and spending per employee sits below North American levels, partly because works council consultation and data protection review lengthen deployment decisions and partly because headcount growth has been slower. Growth of 9.7% is the slowest of the seven regions. Vertical applications do well here, since regulatory variation between countries makes configurable horizontal products expensive to adapt. Several substantial vendors are headquartered in the region and export vertical depth well beyond their domestic markets. Works council consultation and data protection review lengthen deployment decisions materially, which slows adoption without reducing the eventual commitment size. Regulatory variation between countries makes configurable horizontal products expensive to adapt, which favours vertical vendors. Several substantial vendors are headquartered across the region.
Share: 24% | CAGR: 9.7% (2026 to 2036)
Regional intelligence for 5 additional markets available in the complete report: East Asia, South Asia and Pacific, Latin America, Middle East and Africa, Eastern Europe. Contact sales@marketmindsadvisory.com.
saas-enterprise-applications-market-country-cagr-analysis-1790012102985

Where Vendors Hold Their Ground

Four commercial moves separate vendors growing through the pricing transition from those defending seat counts that automation and utilisation scrutiny are both eroding. Each accepts that value has to be captured somewhere other than named users, and that customers already understand the arithmetic. Defending the seat count is a losing position on both sides.

Move Value Away From The Seat Deliberately

Capability that performs work people used to do reduces seat counts while raising what the software is worth, and every vendor shipping it faces that contradiction. Those moving pricing toward outcomes, transactions, or workflow volume report net revenue retention 14 to 22 points above vendors defending named user pricing. The transition risks revenue currently held, which is why most move slowly, and the ones moving quickly are gaining ground while the hesitation lasts. Customers raise the contradiction themselves during renewal conversations, which is harder to manage than any competitive comparison.
Market Impact: Lifts net revenue retention 14 to 22 points

Show Utilisation Before Procurement Discovers It

Around 61% of purchased seats show regular use and 37% of renewals now reduce quantity, because procurement runs usage reports that vendors could have supplied first. Vendors presenting utilisation proactively and proposing tiered access for occasional users retain 2.4 times more contract value through right-sizing than those waiting to be told. Volunteering an unfavourable number buys credibility that survives the conversation, which defending an indefensible position never does. Procurement was going to run the report either way, so the only choice is who presents it first and with what proposal attached.
Market Impact: Retains 2.4 times more contract value at renewal

Build Vertical Depth Instead Of Configurability

Configuration effort is now measured in the business case rather than assumed away, and industry-specific applications grow at 16.8% against 9.4% for horizontal enterprise resource planning. Vendors with genuine vertical depth win 3.1 times more competitive evaluations inside their industry, because they arrive understanding regulatory obligations and terminology without a briefing. Addressable market per vendor is smaller and conversion within it is far higher, which is a trade most horizontal vendors dislike. Horizontal vendors are buying vertical depth rather than building it, which indicates how long building would take. Building it takes years.
Market Impact: Wins 3.1 times more evaluations within the industry

Grow Where No Legacy System Exists

Enterprises in fast-growing economies move from spreadsheets directly to subscription applications, skipping the migration work that consumes mature market budgets and slows every deployment. Indian growth runs at 17.4% and the wider region at 13.3%, the fastest anywhere. Contract values are lower and deployment breadth is wider, which suits vendors pricing on outcomes rather than seats and disadvantages those whose commercial model assumes large headcounts in a single organisation. Nothing has to be reconciled against an existing system, which removes the slowest part of every mature market deployment. Deployments proceed far faster.
Market Impact: Regional growth now runs at 13.3% every year

Who Controls the Margin Pool

Concentration is moderate for a market of this size. Five vendors hold 44% of subscription revenue, measured consistently on that basis across all participants, and the remainder is distributed across a very long tail of vertical and mid-market specialists. Scale advantages in distribution and platform investment have not translated into the consolidation many observers expected a decade ago.
Competition currently turns on three things: vertical fit, which removes configuration cost customers now measure; pricing model credibility as automation undermines seat counts; and honest utilisation reporting, which decides how much contract value survives a renewal. Feature breadth decides considerably less than it did, since most suites long ago exceeded what customers use. Price competition happens mostly at renewal rather than at initial purchase, which is a reversal of how this market behaved for most of the past decade.

Pressure comes from two directions. Vertical specialists take industry accounts that horizontal suites once won by default. Meanwhile platform vendors bundle application capability into agreements customers already hold. Rankings will shift toward vendors who resolve the pricing contradiction convincingly, since that determines whether automation raises revenue or quietly removes it. Seat-priced horizontal vendors face the sharpest exposure.
saas-enterprise-applications-market-company-positioning-matrix-1790012103514

Competitive Moat and Risk Dimensions

MICROSOFT

Moat: Agreement Level Commercial Position

Applications sold inside enterprise agreements that already cover productivity, identity, and infrastructure reach buyers through a relationship competitors must displace rather than merely underprice. Bundling also makes individual application pricing considerably harder for a customer to benchmark, which weakens the utilisation argument that erodes standalone vendors.
MICROSOFT

Risk: Bundle Value Under Renewal Scrutiny

Agreements covering many products invite scrutiny of everything inside them once procurement examines utilisation, and applications with low usage are visible alongside those with high usage in the same review. A bundle that concealed weak adoption for years exposes it all at once when somebody finally runs the numbers.
SALESFORCE

Moat: Customer Data And Extension Depth

Customer records, custom objects, and years of extension work built around one platform create switching costs that have very little to do with the application's own capability. Organisations that built processes on top rather than merely using the product face rebuilding work they cannot easily scope or justify.
SALESFORCE

Risk: Seat Pricing Exposure To Automation

Revenue tied closely to named user counts is the most directly exposed position in this market as automation performs work those users previously did. Moving toward consumption or outcome pricing means repricing an enormous installed base, which is difficult to do quickly without disrupting the revenue it currently produces.

Players Tracked

Prominent Players

Microsoft
Salesforce
SAP
Oracle
Workday

Other Key Players

ServiceNow
Intuit
Adobe
Infor
Sage
Zoho
HubSpot
Freshworks
Epicor
IFS
Unit4
Coupa
Kinaxis
Veeva Systems
Blackbaud

Recent Developments

JANUARY 2026

ServiceNow Restructures Pricing Toward Workflow Volume Not Named Users

ServiceNow restructured commercial terms around workflow volume rather than named user counts, a pricing model change involving no acquisition or partnership, acknowledging that automation reduces the users its previous model charged for. Existing customers were offered transition terms rather than being repriced immediately, which slowed the revenue effect considerably.
Signal: Vendors resolving the seat contradiction early are gaining ground while competitors hesitate. Hesitation is costly here.
SEPTEMBER 2025

SAP Acquires Industry Vertical Application Vendor For Sector Depth

SAP completed an acquisition of an industry vertical application vendor, obtaining sector-specific capability that customers had previously reached through configuration work they were increasingly unwilling to fund themselves. Customers had increasingly declined to fund the configuration work that horizontal products require before they fit an industry properly.
Signal: Horizontal vendors are buying vertical depth because configuration is now measured in the business case. Building takes far too long.
MAY 2025

Workday Signs Multi-Year Agreement With Public Sector Buying Group

Workday entered a multi-year supply agreement covering human capital and finance applications across a public sector buying group, with pricing tied to organisational scope rather than to fluctuating headcount across the participating bodies. Participating bodies had found headcount-linked pricing unworkable given how often their workforce numbers change.
Signal: Buying groups are negotiating away from headcount because their own workforce numbers keep changing. Scope pricing suits them better.

What Delivering These Applications Costs

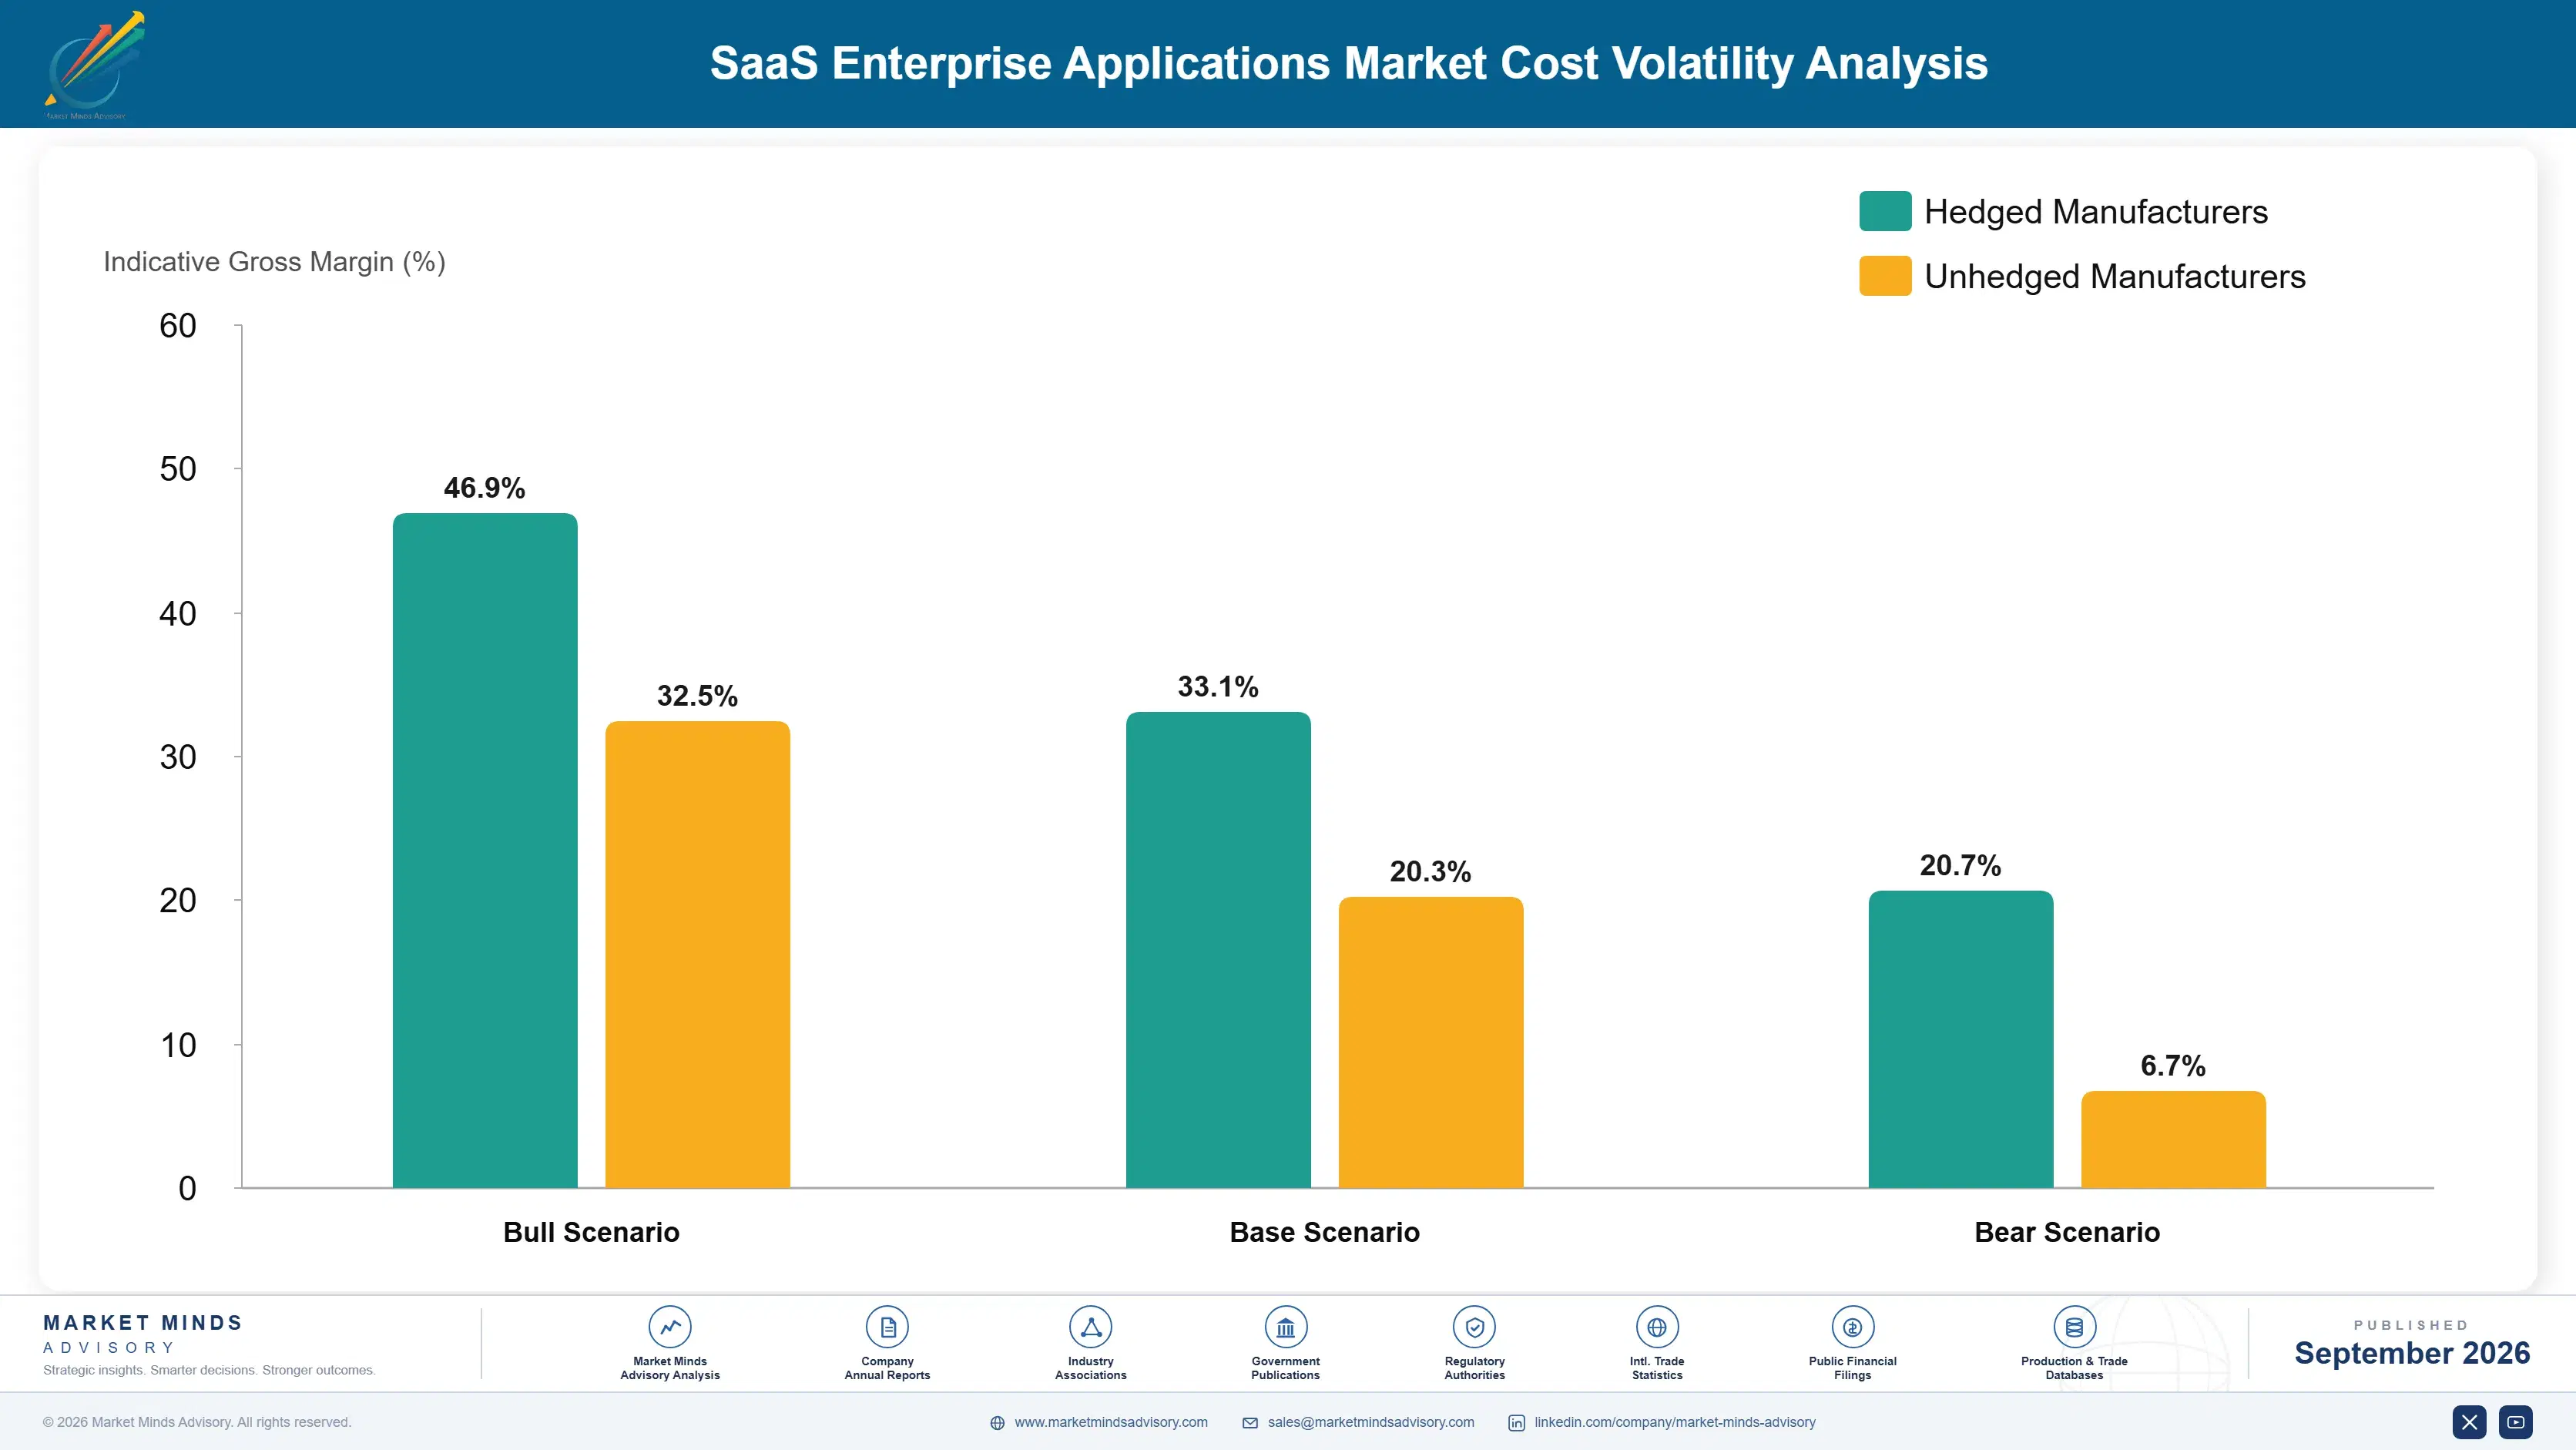
Three input groups dominate cost of revenue. Product engineering runs 34% to 42%, concentrated in North America, Western Europe, India, and Eastern Europe. Cloud hosting and delivery take 24% to 32%, rising materially where automation features consume inference compute rather than merely serving records. Customer success and support add 20% to 28%, higher than most software categories because deployment complexity generates continuing demand for help.
Hosting and inference costs rose through 2024 and 2025 as vendors shipped automation features whose compute consumption scales with usage rather than with subscription revenue, and several described the gross margin effect in their annual reports for those years. SEMI equipment data showed accelerator capacity expanding behind demand. Vendors charging per seat while incurring cost per action face a widening gap that pricing has not yet caught up with.

The competitive disadvantage mechanism runs through pricing structure rather than delivery efficiency. A vendor charging per named user while paying per automated action absorbs cost that rises exactly as the capability succeeds, which is the opposite of a healthy unit economic position. Exposure varies by vendor type, and seat-priced vendors absorb it until they reprice.
saas-enterprise-applications-market-cost-volatility-analysis-1790012103712

Align Pricing Units With Cost Drivers Before Repricing Hurts

Charging per named user while paying per automated action creates a gap that widens exactly as the capability succeeds with customers. Aligning the pricing unit to the cost driver removes that exposure permanently, and doing it while the installed base is smaller is considerably less painful than repricing later under margin pressure everybody can see.

Tier Automation Features By Consumption Rather Than Bundling

Bundling automation into existing subscription tiers hides a cost that scales with usage inside a price that does not, which is a margin problem disguised as a competitive response. Explicit consumption tiers let heavy users pay for what they consume while light users are not subsidising them, and customers accept the logic readily. Light users stop subsidising heavy ones.

Reduce Support Load Through Vertical Default Configurations

Support cost runs higher here than in most software categories because configurable products generate continuing questions about how to configure them properly. Vertical default configurations that fit an industry out of the box reduce that load substantially, shorten deployment, and improve the utilisation figures that now decide how much survives renewal. Renewal outcomes improve as a direct result.

Portfolio Architecture for Margin Defence

Margin follows how exposed the pricing unit is. Seat-priced horizontal applications face the sharpest pressure, since automation reduces users while utilisation scrutiny reduces purchased quantity from the other side. Consumption and workflow-priced products earn better because value and cost move together. Vertical applications earn most, since fit removes configuration cost and win rates inside an industry are far higher. Pricing unit exposure rather than product quality decides this whole hierarchy.
The tension between volume and premium runs through who the buyer is. A large enterprise buying horizontal seats has procurement, benchmarks, and utilisation reports, and it negotiates accordingly at every renewal. A mid-sized business buying a vertical product that fits its industry compares against building something itself, which is a different and considerably more favourable comparison for the vendor.

High-value pools concentrate where fit removes work: regulated industries with specific reporting obligations, sectors where terminology and process differ enough that horizontal products need heavy adaptation, and workflow areas where automation raises deployment value without reducing user populations. Where the product is a general application sold per seat, both deflationary forces apply simultaneously. Both deflationary forces apply at once there.

Volume / Commodity-Adjacent

Horizontal seat-priced applications facing automation pressure on user counts and procurement pressure on purchased quantity simultaneously. The ten-point range reflects hosting efficiency and support load rather than any functional difference between the competing suites.
Gross Margin: 64% to 74%

Premium / Certified

Consumption and workflow-priced applications where value captured and cost incurred move together rather than in opposite directions. The eight-point range separates vendors who repriced early from those still absorbing automation compute inside seat-based subscriptions.
Gross Margin: 76% to 84%

Sustainability / Regulatory / Next-Generation

Industry-specific vertical applications where fit removes configuration cost and regulatory depth cannot be replicated quickly by a horizontal competitor. The ten-point range reflects how completely each product covers its industry's obligations without adaptation.
Gross Margin: 80% to 90%
saas-enterprise-applications-market-portfolio-architecture-1790012104219

High-value Sub-segments and Strategic Watch-out

Industry Vertical Applications

Highest value and fastest growth at 16.8%, removing configuration work customers now measure in the business case rather than accepting. The ten-point range reflects how completely each product covers its industry's regulatory and reporting obligations without adaptation. Horizontal vendors are buying this rather than building it.
Gross Margin: 82% to 92%

Workflow Priced Operations Software

High value growing at 14.3%, the one substantial area where automation and the pricing model point in the same direction. The eight-point range separates vendors pricing on workflow volume from those still charging per named user for the same capability. Users are requesters rather than specialists being replaced.
Gross Margin: 78% to 86%

Emerging Market Deployments

Volume core growing at 13.3% regionally, reaching enterprises with no on-premises generation to migrate away from first. The ten-point range reflects contract values well below mature markets against deployment breadth that is frequently wider. No migration work slows these deployments down at all. Contract values sit below mature markets throughout.
Gross Margin: 70% to 80%

Horizontal Seat Priced Suites

The strategic watch-out. Automation reduces the users being charged for while procurement reduces purchased quantity at 37% of renewals, and both forces operate simultaneously. The ten-point range reflects hosting efficiency rather than anything commercially defensible. Automation and procurement pressure arrive together here. Nothing here resists either force effectively.
Gross Margin: 62% to 72%

How This Revenue Compounds

Subscription revenue renews annually and historically expanded without selling effort, because customer headcount grew and seat counts followed automatically. That mechanism has largely stopped, which is why net revenue retention sits near 106% rather than the levels this industry became accustomed to. What replaces it has to be either genuinely new products or a pricing unit that grows with usage rather than with employment. Neither replacement is straightforward to arrange quickly.
Attachment depth follows what the customer built on top rather than what the vendor supplies. An organisation whose processes, custom objects, integrations, and reporting all sit inside one application faces rebuilding work it cannot scope confidently, which is why switching remains rare despite widespread dissatisfaction. An organisation using a product as delivered has little attachment and right-sizes or replaces it without much difficulty.

The buyer has shifted from functional leadership toward procurement and finance. Applications were once chosen by the head of the function that would use them, evaluating capability and fit. Utilisation reports, benchmark pricing, and multi-year commitment analysis now sit with procurement, and renewal conversations involve finance functions asking why quantity has not fallen alongside measured usage.
saas-enterprise-applications-market-end-use-penetration-index-1790012104715

Where This Market Rewards

These are among the four positions where our research anticipates prominent divergence between winners and laggards over the coming forecast period. Each is grounded in the demand model, the regulatory perimeter, and the announced capacity pipeline.
01 / PRICING UNIT REALIGNMENT

Stop charging for people you replace

Capability performing work that named users previously did reduces seat counts while raising what the software is worth, and every vendor shipping automation faces that contradiction directly. Those moving toward outcome, transaction, or workflow pricing report net revenue retention 14 to 22 points above vendors defending named user models. The transition risks revenue currently held, which is why most move slowly and the quick ones are gaining ground meanwhile, and customers now raise the contradiction during renewals themselves, which is considerably harder to manage than a competitive comparison.
02 / UTILISATION TRANSPARENCY DISCIPLINE

Volunteer the number before procurement finds it

Around 61% of purchased seats show regular use, and 37% of renewals now reduce quantity because procurement runs the usage reports vendors could have supplied first themselves. Vendors presenting utilisation proactively and proposing tiered access for occasional users retain 2.4 times more contract value through right-sizing. Volunteering an unfavourable figure buys credibility that survives the conversation, which defending an indefensible position never manages to do, and procurement was going to run that report regardless, so the only choice was who presented it first.
03 / VERTICAL FIT INVESTMENT

Configuration is a cost customers now count

Horizontal suites arrive configurable and require implementation effort to become what vertical products ship as standard, and that difference now appears in the business case rather than being assumed away. Vendors with genuine vertical depth win 3.1 times more competitive evaluations inside their industry, arriving with regulatory obligations and terminology already understood. Addressable market per vendor is smaller and conversion within it far higher, which horizontal vendors find an uncomfortable trade, which is why several are buying vertical depth rather than building it.
04 / GREENFIELD MARKET PRIORITY

Skipping a generation removes the migration

Enterprises in fast-growing economies move from spreadsheets and locally written systems straight to subscription applications, avoiding the migration work that consumes mature market budgets and delays every deployment there. Indian growth runs at 17.4% and the wider region at 13.3%, the fastest anywhere covered. Contract values are lower and deployment breadth wider, which suits vendors pricing on outcomes and disadvantages those assuming large single-organisation headcounts, and the migration work that slows mature markets simply does not exist, which removes the slowest stage of any deployment elsewhere.

Engagement Snapshot From the Field

A live engagement with an industry participant carrying material or product regulatory and market exposure ahead of a defining policy shift, showing how our research translates into a defensible multi-year portfolio strategy.
MARKET MINDS ADVISORY · CLIENT ENGAGEMENT SUMMARY
SaaS Enterprise Applications Producer Strategic Portfolio Review and Transition Roadmap 2026·Investment Scenario on SaaS Enterprise Applications Exposure Evaluation 2025-26
CLIENT PROFILE
A manufacturing group operating in seventeen countries with roughly 34,000 employees, spending approximately USD 61 million annually across eleven subscription application vendors (client-reported, unverified by MMA). Contracts had been signed by individual functions over eight years with no central review of utilisation or overlap. No central utilisation reporting existed across the portfolio at any point.
STRATEGIC CHALLENGE
Application spending had risen 74% in four years while headcount grew 9%, and nobody could explain the gap. Two vendors had proposed automation modules priced per additional seat, which the chief financial officer found difficult to reconcile with claims that the same modules reduced manual work substantially. Nobody had reconciled the two claims.
MMA APPROACH
MMA measured actual seat usage across all eleven vendors over twelve months, mapped functional overlap between products, and modelled renewal outcomes under right-sized quantities. Automation module proposals were assessed against the headcount reduction each vendor implied their product would deliver. Vertical products in the portfolio were assessed separately against configurable horizontal alternatives.
KEY FINDINGS
  1. Measured utilisation across the portfolio was 58%, and in three products fewer than a third of purchased seats had been used at all during the previous twelve months.
  2. Four vendors provided overlapping capability in supply chain and procurement, a duplication that had accumulated as individual sites purchased independently over several years.
  3. Automation modules priced per seat would have raised cost per user while the vendors' own materials projected reduced manual effort, which nobody had reconciled before.
  4. Two vertical products serving specific manufacturing processes showed utilisation above 90% and had required no configuration spending since deployment. Both had fitted their processes without adaptation.
CLIENT PROFILE
A manufacturing group operating in seventeen countries with roughly 34,000 employees, spending approximately USD 61 million annually across eleven subscription application vendors (client-reported, unverified by MMA). Contracts had been signed by individual functions over eight years with no central review of utilisation or overlap. No central utilisation reporting existed across the portfolio at any point.
STRATEGIC CHALLENGE
Application spending had risen 74% in four years while headcount grew 9%, and nobody could explain the gap. Two vendors had proposed automation modules priced per additional seat, which the chief financial officer found difficult to reconcile with claims that the same modules reduced manual work substantially. Nobody had reconciled the two claims.
MMA APPROACH
MMA measured actual seat usage across all eleven vendors over twelve months, mapped functional overlap between products, and modelled renewal outcomes under right-sized quantities. Automation module proposals were assessed against the headcount reduction each vendor implied their product would deliver. Vertical products in the portfolio were assessed separately against configurable horizontal alternatives.
KEY FINDINGS
  1. Measured utilisation across the portfolio was 58%, and in three products fewer than a third of purchased seats had been used at all during the previous twelve months.
  2. Four vendors provided overlapping capability in supply chain and procurement, a duplication that had accumulated as individual sites purchased independently over several years.
  3. Automation modules priced per seat would have raised cost per user while the vendors' own materials projected reduced manual effort, which nobody had reconciled before.
  4. Two vertical products serving specific manufacturing processes showed utilisation above 90% and had required no configuration spending since deployment. Both had fitted their processes without adaptation.
RECOMMENDED STRATEGY
Phase 1: Phase one: right-size purchased quantities against measured usage at every renewal, and require utilisation reporting from vendors as a contract term going forward. Phase 2: Phase two: consolidate the four overlapping supply chain products onto one, selecting on vertical fit rather than on breadth of configurable capability. Phase 3: Phase three: decline automation modules priced per seat and require pricing tied to work performed rather than to the users the module reduces.
OUTCOME
Application spending fell 22% while capability coverage was retained (client-reported, unverified by MMA). Two vendors offered workflow-based pricing rather than lose the automation opportunity. Utilisation across the retained portfolio rose to 84% following right-sizing. Four overlapping supply chain products were consolidated onto one vertical platform.

Frequently Asked Questions

Foundational context covering the market sizes, CAGR, scope, country, region and competition that inform every finding below. This section is provided to cover basics and most often pre-purchase conversations, answered from the MMA Primary Research Dataset.

What is the current size of the SaaS Enterprise Applications Market?

The market was worth USD 268.0 billion in 2025 and reaches USD 298.0 billion in 2026. Value covers subscription business applications, excluding infrastructure and implementation services.

How large will the SaaS Enterprise Applications Market be by 2036?

MMA forecasts USD 861.5 billion by 2036, an increase of USD 563.5 billion across the forecast period. That represents 2.89 times the 2026 base of USD 298.0 billion.

What is the CAGR for the SaaS Enterprise Applications Market 2026 to 2036?

The base case compound annual growth rate is 11.2%, with a bull case at 12.4% and a bear case at 10.0%. Historical growth from 2020 to 2025 ran at 9.8%.

Which segment is growing fastest?

Industry-specific vertical applications grow at 16.8%, half again the market rate of 11.2%. Configuration effort is now measured in the business case rather than assumed away.

Who are the major companies in the SaaS Enterprise Applications Market?

Microsoft, Salesforce, SAP, Oracle, and Workday lead, together holding 44% of subscription revenue. A very long tail of vertical and mid-market specialists holds the remainder.

Which country is growing fastest?

India grows at 17.4%, driven by enterprises moving from spreadsheets straight to subscription applications, with no on-premises generation requiring any migration work beforehand at all.

Report Segmentation Architecture

The full report scope spans multiple orthogonal segmentation dimensions, with cross-tabulated demand data provided for each dimension pair. Coverage extends further to regional breakdowns, trend trajectories, and the competitive detail needed to support segment-level decision-making.

By Application Domain

  • Finance and Enterprise Resource Planning
  • Human Capital Management
  • Customer Relationship and Sales
  • Supply Chain and Procurement
  • Service and Operations Management
  • Industry-Specific Vertical Applications

By End-Use Industry

  • Manufacturing and Industrial
  • Financial Services and Insurance
  • Retail, Consumer and Distribution
  • Healthcare and Life Sciences
  • Public Sector and Education
  • Professional and Business Services

By Commercial Dimension

  • Named User Subscription
  • Consumption and Workflow Pricing
  • Enterprise Agreement Bundle
  • Partner and Reseller Channel
  • Buying Group Framework Contract
  • Marketplace Procurement

By Region

  • North America
  • Western Europe
  • East Asia
  • South Asia and Pacific
  • Latin America
  • Middle East and Africa
  • Eastern Europe

Scope, Methodology, and Coverage

Every figure in this report is reproducible from documented input assumptions. The scope below maps the historical period, the forecast horizon, the segmentation dimensions, and the countries covered, alongside the underlying primary and qualitative methodology.
Historical Period
2020 to 2025
Forecast Period
2026 to 2036
Base Year
2025 (USD billions; MMA Primary Research Dataset, September 2026)
Market Definition
This market covers business application software delivered as subscription services, including finance and enterprise resource planning, human capital management, customer relationship and sales, supply chain and procurement, service and operations management, and industry-specific vertical applications. It excludes infrastructure and platform services, collaboration and communication suites, security software, on-premises licences and maintenance, and implementation and consulting services.
Quantitative Units
USD billions, subscription and bundled support revenue
Segmentation Dimensions
Application domain, end-use industry, commercial dimension, region
Regions Covered
North America, Western Europe, East Asia, South Asia and Pacific, Latin America, Middle East and Africa, Eastern Europe
Countries Covered
United States, Canada, Mexico, United Kingdom, Germany, France, Netherlands, Sweden, Switzerland, Spain, Italy, Ireland, China, Japan, South Korea, Taiwan, India, Australia, Singapore, Indonesia, Brazil, Mexico, Chile, Colombia, Saudi Arabia, United Arab Emirates, Nigeria, South Africa, Poland, Czechia
Key Companies Profiled
Microsoft, Salesforce, SAP, Oracle, Workday, ServiceNow, Intuit, Adobe, Infor, Sage, Zoho, HubSpot, Freshworks, Epicor, IFS, Unit4, Coupa, Kinaxis, Veeva Systems, Blackbaud
Quantitative Methodology
Primary survey, n=3,800 respondents, Q4 2025, six countries; demand-side model with trade association cross-validation
Qualitative Methodology
47 expert interviews, Q4 2025; applied to validate demand model assumptions, identify emerging dynamics, and assess competitive positioning
Report Format
PDF and XLSX data workbook (Word format preview document)
Publisher
Market Minds Advisory
Report Code
MMA-2026-TEC-871
Published
September 2026
Contact
sales@marketmindsadvisory.com | www.marketmindsadvisory.com

Purchase the full SaaS Enterprise Applications Market Report (2026 to 2036).

The full report sizes the subscription enterprise application market across six application domains, seven regions, and thirty countries, with forecasts to 2036 under base, bull, and bear cases. It examines why automation undermines the pricing unit this industry was built on, how utilisation scrutiny deflates renewal quantities independently of competition, and why vertical products keep taking share from configurable horizontal suites. Competitive analysis covers twenty participants evaluated consistently on subscription revenue, with detailed treatment of pricing model exposure and vertical depth. Cost structure, margin architecture, and regional adoption patterns are analysed throughout. Primary research includes 3,800 survey responses and 47 expert interviews.
Six application domains sized and forecast separately
Twenty participants evaluated on subscription revenue consistently
Regional adoption and buying behaviour across seven distinct geographies
Margin architecture by domain and pricing unit exposure
Utilisation and right-sizing benchmarking across enterprise application portfolios
Pricing model transition analysed against automation compute cost exposure

Built For The People Who Decide

From boardroom strategy to bench-side execution, this report is read cover-to-cover by leaders shaping the next decade of their industry, turning demand scenarios, market dynamics and valuation benchmarks into decisions.
CXOs/ Presidents/ VPs/ Managers
M&A and Corporate Development
Strategy Teams and R&D Heads
Procurement and Product Directors
Regulatory and Compliance Leaders
Investor Relations and Equity Analysts