Market Minds Advisory
Rugged Display Market

Rugged Display Market: Rugged Display Market. Sunlight-Readable Panels Anchor Defense and Industrial Modernization

Defense modernization budgets and factory automation programs are pushing sunlight-readable, shock-resistant display panels into cockpits, mining vehicles, and marine bridges once served only by analog gauges and unlit switches directly.

Lead Analyst

Published

September 2026

Make Smarter Decisions with Customized Research Insights

Request a free sample report and evaluate market opportunities, growth trends, and competitive dynamics relevant to your business needs.

2025 MARKET VALUE$4.3BMarket Size 2025
2036 FORECAST VALUE$8.9BBase Case , 2026 to 2036
CAGR 2026 TO 20366.8 %Bull 8.0% / Bear 5.6%
INCREMENTAL OPPORTUNITY$4.3BNet 10- year value creation
EXPANSION MULTIPLE1.93x2036 value over 2026 base
Strategic Levers
M&A Pipeline
Regional Outlook
Country Rankings
Competitive Intelligence
Segmental Deep-dive
Call-Us : 91 93563 13602

Executive Snapshot and Market Trajectory.

Defense modernization programs and factory automation investment are converging on the same underlying demand for displays that survive vibration, sunlight glare, and temperature extremes that consumer-grade panels were never engineered to withstand reliably across most harsh operating environments encountered daily across defense, industrial, marine, and mining fleets worldwide.
Military and industrial automation applications still anchor the bulk of current demand, but mining and heavy equipment operators are pulling installed base growth faster as digitized cabs replace analog gauge clusters, reshaping display vendor product roadmaps well beyond traditional defense contracting relationships and procurement cycles across most equipment manufacturers and their global dealer networks, service partners, and aftermarket retrofit programs nationwide and across major export markets.
Competitive intensity concentrates around optical bonding and sunlight-readability engineering rather than raw panel manufacturing, as vendors race to certify displays for harsher environmental standards ahead of procurement cycles that increasingly favor proven ruggedization credentials over simple screen size or resolution specifications across most buyer categories and applications worldwide today. This pressure is pushing smaller specialists lacking certification budgets toward consolidation or a full category exit within the next few years ahead.
Market Definition
The rugged display market covers ruggedized LCD, OLED, and touch panel displays engineered for shock, vibration, temperature extreme, and sunlight-readability requirements across defense, industrial, marine, aerospace, and mining applications. It excludes consumer and commercial-grade displays without environmental hardening, standalone touch sensor components, and general-purpose computing hardware sold without an integrated ruggedized display.
Base Year Value
$4.3B in 2025 (MMA Primary Research Dataset, September 2026)
Forecast Period
2026 to 2036, eleven discrete annual values
CAGR
6.8% base case. Bull 8.0%. Bear 5.6%.
Fastest Growth Segment
Industrial Automation and HMI: 10.5% CAGR
Fastest Growth Country
India: 9.3% CAGR
Fastest Growth Region
South Asia and Pacific: 8.8% CAGR
Largest Region
North America: 30% of 2025 global value
Market Leaders
Getac Technology, Panasonic, Winmate, Advantech, and Curtiss-Wright lead the competitive landscape. Source: MMA Primary Research Dataset, July 2026.
Primary Survey
n=3,800 procurement and R&D decision-makers, Q4 2025, six countries
Methodology
Demand-side build-up, cross-validated against public data, 47 expert interviews

Rugged Display Market Forecast Scenarios

rugged-display-market-size-forecast-scenario-1790002020640
Between 2020 and 2025 rugged display demand progressed steadily as defense modernization programs and industrial automation investment both expanded gradually, with mining and marine adoption entering the mainstream only toward the end of the period, producing a historical CAGR of 6.2 percent that understates the pace now underway as digitized cabs and cockpits become standard equipment across most major equipment categories.
The base case assumes three commercial mechanisms compound together: expanding defense modernization budgets open new cockpit and vehicle display procurement programs previously served only by analog gauges, falling optical bonding and sunlight-readability component costs lower the total installed cost of ruggedized panels across industrial applications, and equipment manufacturers increasingly specify digital displays as standard cab equipment rather than an optional upgrade reserved for premium equipment tiers alone across the broader industry.
A bull scenario builds on accelerated defense procurement cycles that convert legacy analog cockpit instrumentation to digital displays years ahead of current modernization timelines, pulling forward panel and optical bonding demand across the industry. The bear case centers on consumer display manufacturing overcapacity eroding rugged display's cost advantage as commercial panels gain incidental environmental hardening through unrelated smartphone durability improvements over the coming years.

Environmental Certification Now Defines Procurement Eligibility

Defense and industrial procurement teams increasingly specify environmental certification standards before evaluating display specifications like resolution or size, a shift that rewards vendors able to demonstrate proven test pedigree across vibration, shock, and temperature extreme standards simultaneously rather than negotiating certification as a late-stage contract requirement added after initial vendor selection has already occurred and shortlists finalized well in advance of final contract award decisions.
MARKET CONCENTRATIONCR5 42%Top five vendors hold meaningfully fragmented but consolidating share
AVERAGE SELLING PRICE$3,200 per unitCertified defense-grade panels command substantial premium pricing consistently
TOP PRODUCING COUNTRY SHARETaiwan 34%Concentrated panel and optical bonding base supplies most platforms
CERTIFICATION PASS RATE71%Share of submitted designs clearing environmental hardening test standards
REPLACEMENT CYCLE LENGTH9 yearsTypical interval before defense and industrial fleets refresh displays
COMPONENT COST SHARE46%Optical bonding and sealed enclosures dominate manufacturing cost structure
Mining and marine buyers favor displays bundled with sealed enclosure and anti-glare optical bonding technology, since retrofitting environmental protection onto a standard panel after the fact rarely achieves the reliability that purpose-built ruggedized designs deliver across multi-year deployment cycles in harsh field conditions and remote operating locations far from service support, spare parts inventory, and qualified repair technicians nearby.
Panel and optical bonding manufacturing remains concentrated in a small number of countries with mature display fabrication capacity, though rising defense localization requirements in several markets are pushing some vendors toward domestic assembly to satisfy government sourcing mandates despite the resulting cost premium involved across most affected national defense procurement programs, their allied trading partners, and various secondary export markets worldwide.
"Resolution used to sell the display. Now the sale happens in the certification lab, months before a customer ever sees the screen light up."
Senior Analyst, Rugged Electronics and Defense Hardware Practice · MMA Technology Practice · September 2026

Market Trends

Optical Bonding Becomes Standard on New Programs

Optical bonding, which eliminates the air gap between touch sensor and display glass, has moved from a premium option to a baseline specification on new defense and mining equipment programs, since the technology meaningfully improves sunlight readability and reduces internal fogging in temperature-cycling environments common across field deployments. Vendors without in-house optical bonding capability increasingly partner with specialist bonding houses to remain competitive on procurement bids, since building the capability internally requires substantial capital investment and process expertise that smaller display manufacturers struggle to justify given uncertain program volumes across a fragmented defense and industrial customer base this year.
Market Impact: Cuts panel cost by 22 percent
Digitized Cabs Replace Analog Gauge Clusters

Heavy equipment manufacturers are replacing analog gauge clusters with configurable digital display panels across new mining, agricultural, and construction vehicle programs, letting a single hardware platform serve multiple equipment variants through software configuration rather than requiring separate gauge tooling for each model variant produced across a growing product lineup. Operators report meaningfully improved diagnostic visibility when equipment health data displays digitally rather than through separate analog warning lights, letting maintenance teams identify developing mechanical issues before they cause unplanned downtime across remote job sites far from service support infrastructure and spare parts inventory.
Market Impact: Adds 19 percent modernization budget share

Market Opportunities and Growth Drivers

Falling Panel Costs Widen Industrial Adoption

Display panel prices have declined steadily as broader consumer electronics manufacturing scale improved across the shared LCD and OLED supply chain that rugged display makers also draw from for their own base panel components before ruggedization and environmental hardening begins. Industrial equipment manufacturers who previously viewed digital displays as a premium option now specify them as standard cab equipment on new vehicle programs, since the marginal cost premium over analog gauge clusters has narrowed considerably against the diagnostic and configuration flexibility digital displays deliver across multi-year equipment service lives and fleet management programs.
Market Impact: Cuts pricing power by 12 percent

Defense Modernization Budgets Expand Steadily Worldwide

National defense modernization programs across several major economies are allocating meaningfully larger budgets to cockpit and vehicle electronics upgrades, replacing legacy analog instrumentation with digital displays that support software-defined mission systems and reduce long-term sustainment costs tied to obsolete analog component sourcing and diminishing manufacturing sources. Defense contractors increasingly specify rugged displays early in new platform design cycles rather than treating them as a late-stage integration decision, letting display vendors participate in multi-year program relationships that extend well beyond a single procurement contract into decades of sustainment and upgrade revenue across fielded platforms.
Market Impact: Adds 12 to 18 months delay

Market Restraints and Challenges

Consumer Panel Overcapacity Pressures Ruggedized Pricing

Global consumer LCD manufacturing overcapacity periodically drives commercial-grade panel prices low enough that some cost-sensitive industrial buyers attempt to retrofit standard panels with aftermarket protective enclosures rather than purchasing purpose-built ruggedized displays, undermining pricing power for legitimate vendors during oversupply cycles. The root cause is that consumer display fabs built for smartphone and television volume periodically overshoot demand, dumping excess capacity into adjacent markets at prices ruggedized manufacturers cannot match given their smaller production runs and certification overhead. Vendors are responding by emphasizing total lifecycle cost and field failure rate data to justify the price premium over unproven retrofit alternatives.
Market Impact: Covers 31 percent of new programs

Certification Timelines Delay New Program Revenue

Defense and safety-critical environmental certification processes routinely take twelve to eighteen months per display design, delaying revenue recognition on new programs and forcing vendors to commit engineering resources well before a contract award is confirmed. The underlying constraint is that certification bodies test each specific hardware and firmware combination individually, offering no meaningful shortcut for vendors introducing incremental design changes even when core components remain unchanged from a prior certified design. Some vendors now maintain pre-certified reference designs that customers can adapt with minor modifications, cutting incremental certification time meaningfully compared to starting from a fully custom specification.
Market Impact: Lifts diagnostic visibility by 27 percent
3 additional market trends, 4 additional growth drivers, and 2 additional restraints and challenges are covered in the full report. Contact sales@marketmindsadvisory.com to access the complete intelligence.

Segment CAGR and Growth Architecture

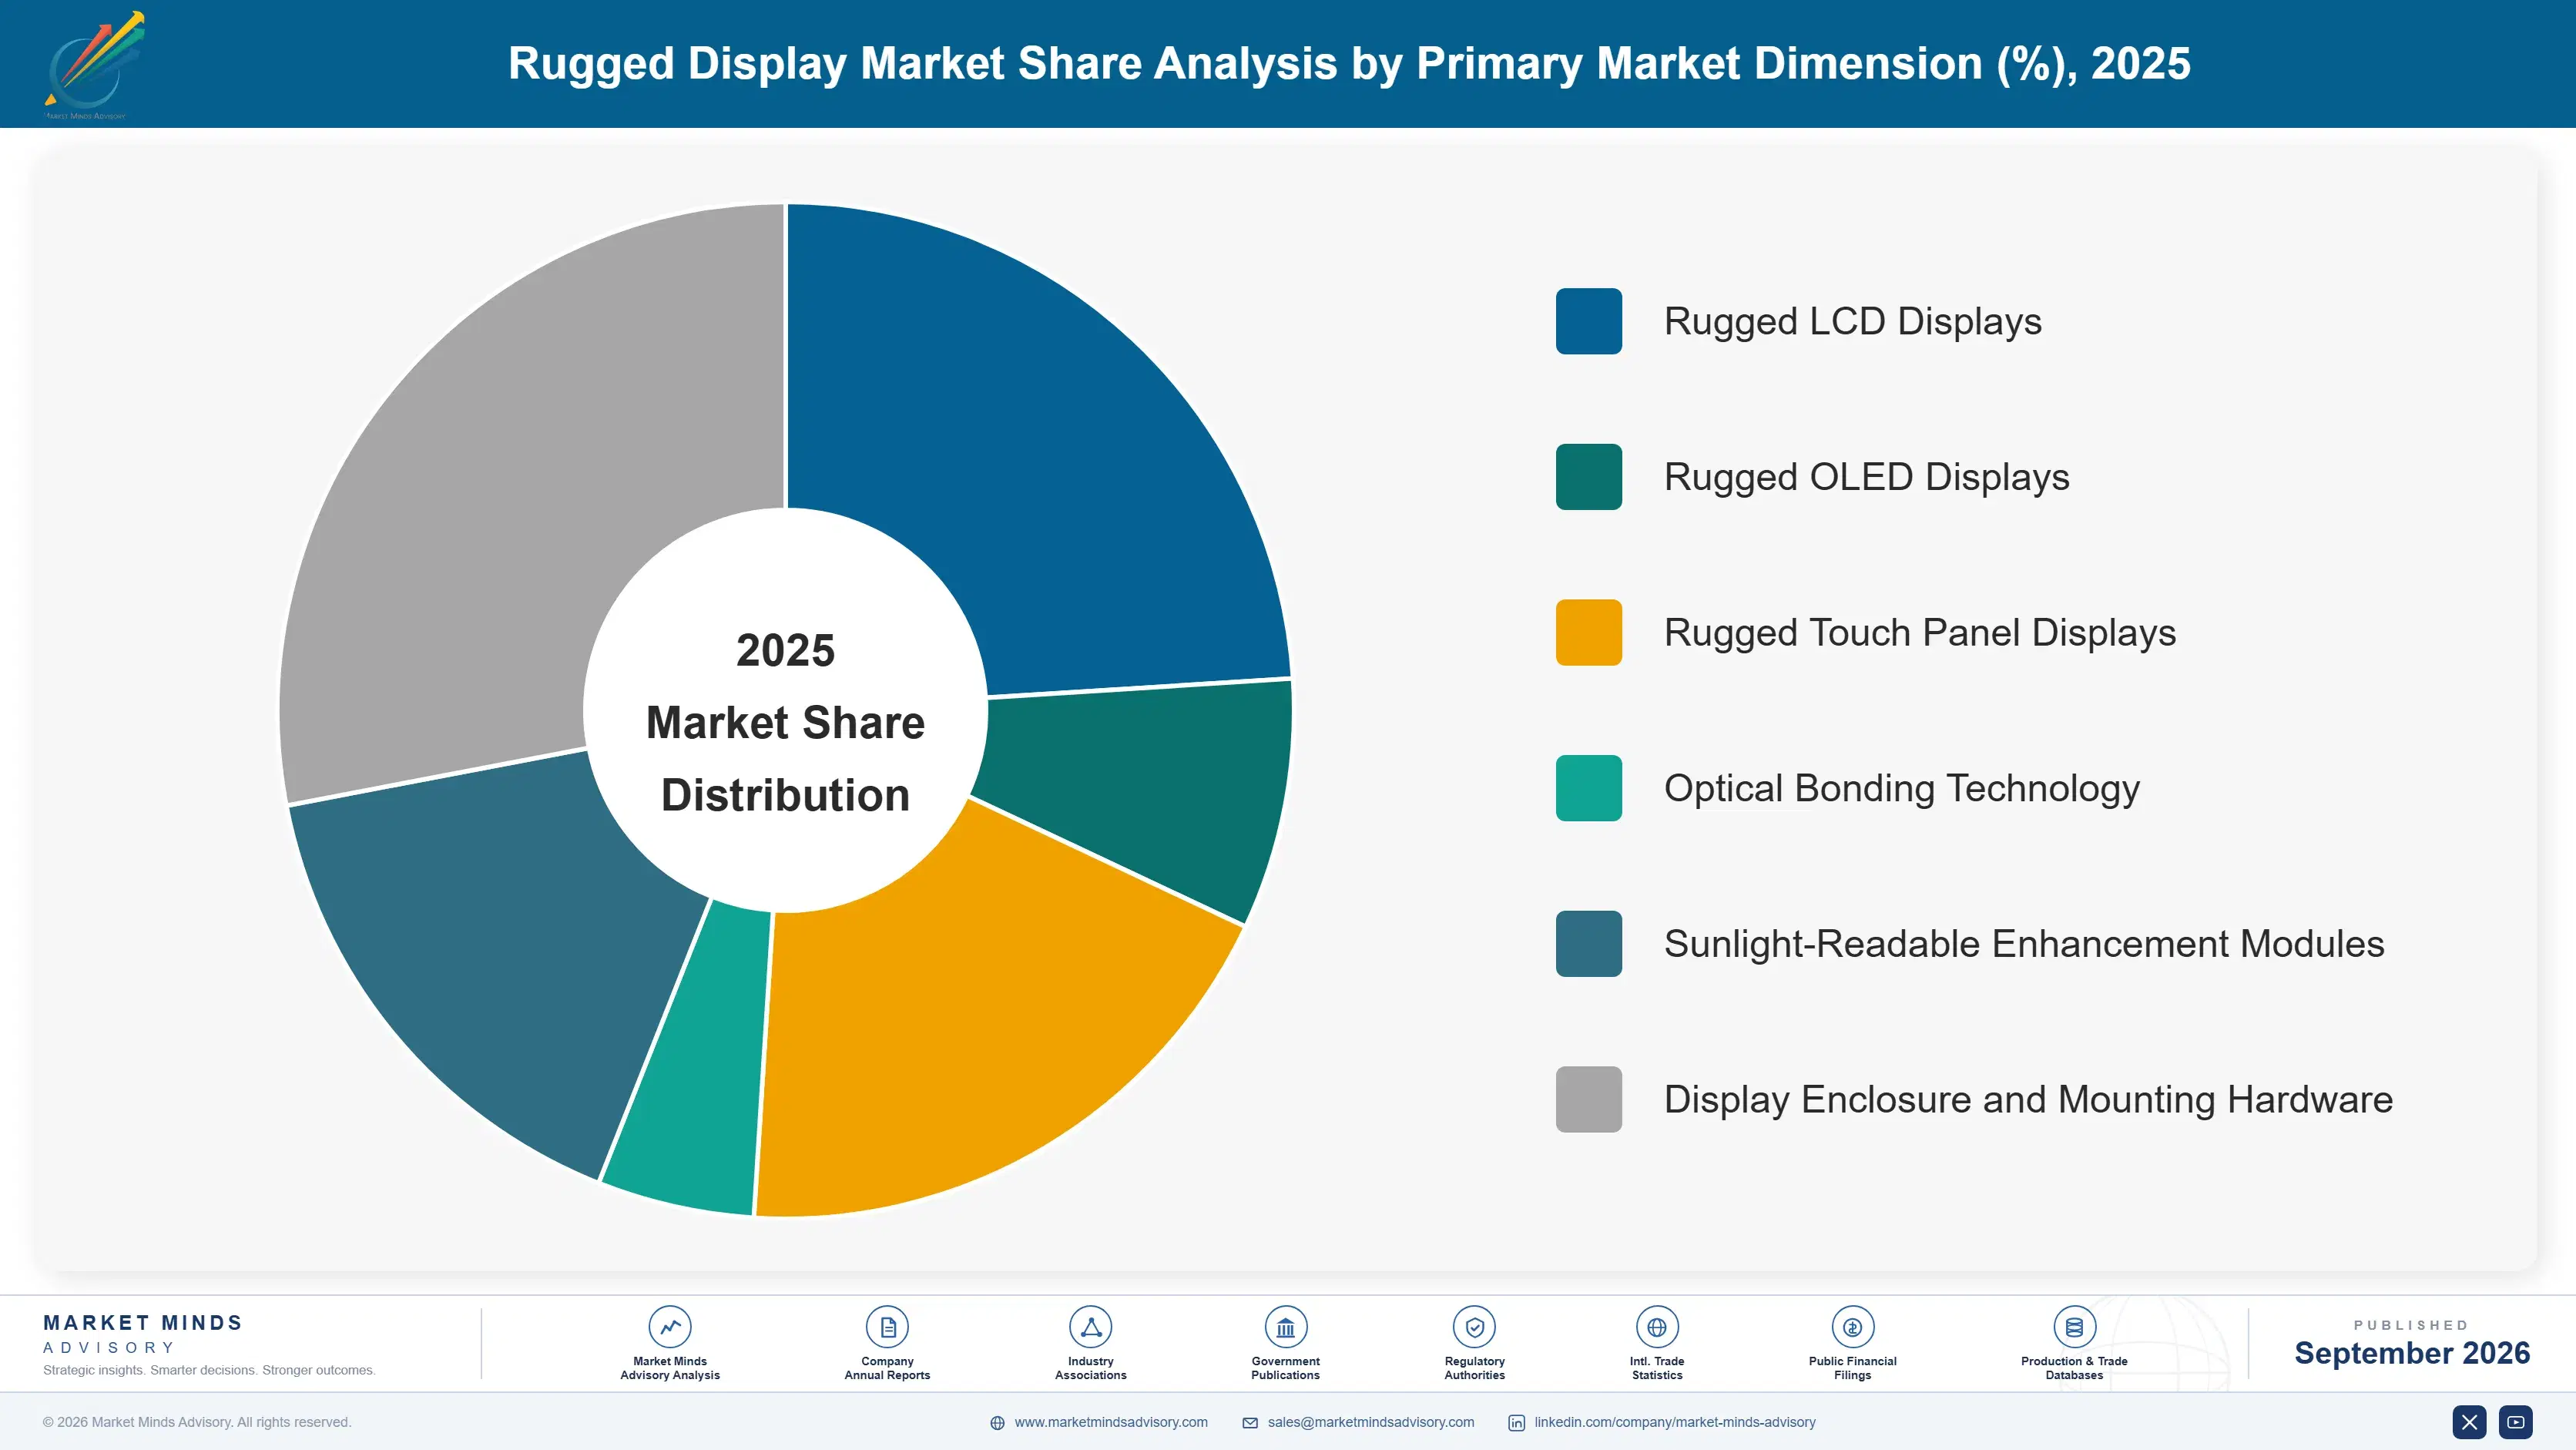
Six application segments define rugged display demand, spanning military and defense, industrial automation, marine and maritime, aerospace and avionics, mining and heavy equipment, and outdoor public safety and signage across enterprise and government buyers. Industrial automation and HMI panels now grow fastest as factories digitize control room and machine interface hardware across production floors.
rugged-display-market-market-share-analysis-1790002021672

Industrial Automation and HMI

Factory operators are replacing legacy control panels and analog gauge clusters with configurable digital human-machine interfaces that let a single hardware platform serve multiple production line variants through software configuration rather than requiring separate custom panel tooling for each machine model produced across a growing product range and evolving manufacturing footprint worldwide. Sealed, washdown-rated displays dominate new orders across food processing and pharmaceutical manufacturing environments given hygiene requirements that standard consumer panels cannot satisfy without extensive aftermarket modification and ongoing maintenance. Predictive maintenance dashboards anchor much of the near-term volume, though machine vision integration and operator training interfaces increasingly contribute meaningful new contract value as factories pursue broader automation programs and modernization initiatives.
CAGR 10.5%

Mining and Heavy Equipment

Heavy equipment manufacturers are converting analog gauge clusters into configurable digital cab displays that support real-time diagnostic monitoring and remote fleet management across mining, agricultural, and construction vehicle programs operating in remote and harsh field environments far from service infrastructure and spare parts inventory. Sunlight-readable, vibration-resistant panels dominate new orders given the extreme operating conditions common across open-pit mining and off-road construction applications, distinguishing this segment sharply from indoor industrial deployments elsewhere in the market. Retrofit programs anchor much of the current volume as fleet operators upgrade aging equipment, though new equipment orders increasingly specify digital cabs from the factory rather than as an aftermarket addition installed later by dealers.
CAGR 9.2%
Full segment breakdown across 6 segments available in the complete report.

Regional Architecture and Country Demand Map

North America leads global rugged display demand, anchored by the world's largest defense modernization budget alongside deep industrial automation and mining equipment adoption across most major national and regional government procurement markets today, well ahead of a fast-growing East Asian panel manufacturing and export base.

North America

Defense procurement anchors regional demand more deeply than anywhere else, with cockpit and vehicle electronics modernization programs across the region's armed forces committing multi-year budgets that display vendors plan capacity around years in advance. Industrial automation adoption runs deep across manufacturing and mining operations, with fleet operators increasingly specifying digitized cabs on new equipment orders rather than treating displays as an aftermarket addition installed later. Marine and public safety adoption round out regional demand, with vendors here also leading global optical bonding and sunlight-readability engineering investment across most major defense contractor supply chains and their subcontractor networks nationwide. Canada follows similar defense and mining adoption patterns, though at a comparatively smaller absolute regional scale overall.
Share: 30% | CAGR: 7.3% (2026 to 2036)

East Asia

Panel and optical bonding manufacturing concentration gives this region a durable cost advantage that pulls both domestic and export demand toward locally assembled platforms, with Taiwan anchoring the bulk of regional production capacity across display glass, touch sensors, and ruggedization components alike. Industrial automation adoption runs unusually deep here, particularly across electronics and automotive manufacturing where factories continue replacing legacy control panels with configurable digital interfaces. Marine and shipbuilding demand is also expanding steadily across the region's major shipyards, aided by government modernization programs favoring digital bridge instrumentation over legacy analog gauge clusters nationwide. Japan and South Korea contribute additional premium optical bonding design capacity to the region's overall manufacturing depth and export strength.
Share: 25% | CAGR: 7.8% (2026 to 2036)
Regional intelligence for 5 additional markets available in the complete report: Western Europe, South Asia and Pacific, Latin America, Middle East and Africa, Eastern Europe. Contact sales@marketmindsadvisory.com.
rugged-display-market-country-cagr-analysis-1790002022624

Converting Certification Investment Into Program Lock-In

Vendors capture the largest share of long-term value by bundling display hardware with certification support, extended sustainment contracts, and design partnership agreements that convert one-time equipment sales into multi-year program relationships spanning platform lifecycle, upgrade cycles, and eventual replacement decisions across the entire fielded operational service life of each and every single deployed unit.

Bundle Pre-Certified Reference Designs With Hardware Sales

Vendors increasingly offer pre-certified reference designs that customers can adapt with minor modifications, converting a one-time display sale into a recurring design partnership relationship that persists across a program's full multi-year development and production timeline and eventual sustainment period spanning the platform's entire operational life. Customers gain meaningfully faster time to certification, while vendors capture margin that hardware price competition alone increasingly compresses across most standard product tiers and applications. Roughly 28 percent of defense buyers now select vendors partly based on reference design maturity rather than base panel specifications alone.
Market Impact: Adds roughly 21 percent recurring design revenue annually

Offer Long-Term Sustainment and Obsolescence Management Contracts

Vendors bundling long-term sustainment contracts with obsolescence management services capture ongoing revenue beyond the initial hardware sale, proactively managing component end-of-life risk across the decades-long service life common to defense and industrial equipment programs and their fielded platforms. This approach appeals particularly to program managers responsible for platforms that must remain operational for twenty years or more after initial fielding, where unmanaged component obsolescence can ground entire equipment fleets. Vendors report significantly higher contract renewal rates, roughly 26 percent higher, among customers enrolled in sustainment programs compared to those purchasing hardware without ongoing support commitments.
Market Impact: Lifts contract renewal rates by 26 percent overall

Sell Optical Bonding as a Standalone Service Offering

Vendors with in-house optical bonding capability increasingly offer bonding services to smaller display manufacturers lacking the capital to build their own bonding lines, capturing margin on a specialized process step that would otherwise require the customer's own significant capital investment and years of process development. This service layer captures incremental revenue beyond the vendor's own branded product sales while building relationships with smaller competitors that occasionally convert into acquisition or partnership opportunities later. Vendors report meaningfully higher blended margins, roughly 17 percent higher, on bonding service revenue than on standard branded display hardware sales alone.
Market Impact: Generates roughly 17 percent incremental service margin overall

Monetize Field Reliability and Failure Rate Data

Vendors with large installed display fleets increasingly package anonymized field failure rate and environmental exposure data into secondary analytics products sold to equipment manufacturers and program managers seeking reliability benchmarking data across comparable operating environments and applications. This data layer requires minimal incremental cost to produce once the underlying warranty tracking system already exists, making it disproportionately profitable relative to hardware margins that rarely exceed 24 percent across the category. Early movers in this space are building data moats that later entrants will find increasingly difficult to replicate at comparable scale.
Market Impact: Generates roughly 13 percent incremental margin each year

Who Controls the Margin Pool

The rugged display market carries a CR5 of 42 percent, leaving meaningful room for regional specialists and optical bonding houses to compete alongside the largest rugged computing incumbents across most application segments and geographies simultaneously and across most defense procurement programs. Getac's rugged computing scale and defense channel relationships separate it clearly from the next tier of challengers, most of whom compete on specialization rather than head-to-head price competition across every product category at once.
Current competitive activity centers on optical bonding certification and sunlight-readability engineering races, as vendors work to qualify designs ahead of procurement cycles that increasingly favor proven ruggedization credentials for defense and mining applications. Several vendors have also begun bundling long-term sustainment contracts and pre-certified reference designs to lock in program relationships beyond the initial hardware sale.

Rankings are most likely to shift as defense localization requirements tighten further, favoring vendors with proven domestic assembly capability over those relying entirely on offshore manufacturing. Smaller specialists focused narrowly on marine or aerospace applications face rising pressure from generalist platforms adding mining and industrial automation support, threatening the niche positioning several mid-tier vendors have relied on for years.
rugged-display-market-company-positioning-matrix-1790002023508

Competitive Moat and Risk Dimensions

GETAC TECHNOLOGY

Moat: Rugged computing scale and channel

Getac's deep defense and industrial sales channel and installed base across rugged computing give it a distribution advantage competitors struggle to match, letting the company bundle display upgrades into broader rugged device refresh cycles that customers already plan around Getac hardware and existing service contracts.
GETAC TECHNOLOGY

Risk: Slower specialty market response

Getac's broad rugged computing focus makes it comparatively slower to respond to specialty applications like marine bridge instrumentation or aerospace avionics, where smaller focused vendors move faster on certification and product design tailored to narrower use cases and technical requirements across specific vertical markets and buyer segments.
CURTISS-WRIGHT

Moat: Defense program integration depth

Curtiss-Wright's deep integration into existing defense platform programs gives it design-in relationships across a wide range of cockpit and vehicle electronics systems, creating a supplier relationship that is costly and time-consuming for program managers to switch away from once integrated into a certified system design.
CURTISS-WRIGHT

Risk: Exposure to defense budget cycles

Curtiss-Wright's defense-concentrated business model leaves it more exposed to government budget cycle volatility than vendors selling across a broader mix of commercial industrial and mining customers, compressing revenue visibility during periods of defense procurement uncertainty or continuing resolution funding gaps affecting new program starts and awards.

Players Tracked

Prominent Players

Getac Technology Corporation
Panasonic Holdings Corporation
Winmate Inc
Advantech Co Ltd
Curtiss-Wright Corporation

Other Key Players

Crystal Group Inc
Barco NV
Kontron AG
MilDef Group AB
Elo Touch Solutions Inc
DFI Inc
AUO Display Plus Corporation
Innolux Corporation
Estone Technology Co Ltd
General Dynamics Mission Systems Inc
Cybernet Manufacturing Inc
Zytronic PLC
Havis Inc
Teguar Corporation
Dawar Technologies Inc

Recent Developments

AUGUST 2025

Getac launches new rugged tablet display line

Getac Technology announced a new rugged tablet display line featuring enhanced sunlight-readability and extended temperature range certification for defense field applications, extending its existing rugged computing portfolio into higher-brightness display use cases previously served only by specialty vendors and smaller regional display manufacturers focused narrowly on niche defense applications.
Signal: Signals large rugged computing incumbents moving directly into specialty high-brightness display segments and niche defense markets
APRIL 2025

Panasonic acquires optical bonding technology startup

Panasonic Holdings acquired an optical bonding technology startup to strengthen its rugged display sunlight-readability portfolio, adding specialized bonding process capability and engineering talent that complements its existing Toughbook and industrial display product lines sold to defense and industrial customers across multiple regions and applications worldwide.
Signal: Signals optical bonding capability steadily becoming a key competitive differentiator across the entire global rugged industry
NOVEMBER 2025

Curtiss-Wright signs cockpit display supply agreement

Curtiss-Wright entered into a supply agreement with a defense prime contractor to provide cockpit display systems for a new multi-year aircraft modernization program, extending its existing avionics electronics relationship into the display hardware category for the first time across its broader defense electronics product portfolio and offerings.
Signal: Signals defense electronics incumbents expanding further into rugged display hardware categories nationwide and across international markets

Display Glass and Optical Bonding Cost Exposure

Display glass panels and optical bonding adhesive materials together represent roughly 46 percent of rugged display cost of goods sold, sourced predominantly from a concentrated group of manufacturers based across Taiwan, South Korea, and Japan, with secondary fabrication capacity spread across China, the United States, and parts of Southeast Asia supplementing the primary Asian supply base.
Display glass and touch sensor prices spiked meaningfully during 2025 as demand for specialized display components surged across automotive, industrial, and consumer electronics sectors simultaneously, a trend the IEA linked to broader glass fabrication capacity constraints affecting multiple industries at once worldwide, forcing several vendors to absorb higher component costs for two consecutive fiscal quarters rather than pass the full increase through to defense and industrial customers mid-contract.

Smaller vendors without long-term glass supplier agreements face the sharpest cost pressure during these episodes, since they lack the purchasing volume to secure priority component allocation during shortages. Larger vendors with multi-year supply contracts and diversified sourcing relationships weather these episodes with comparatively minor disruption to production schedules and existing customer delivery commitments across their installed base and regional service territories.
rugged-display-market-cost-volatility-analysis-1790002023825

Diversify display glass and touch sensor sourcing

Several vendors are qualifying alternative glass and touch sensor suppliers outside the traditional Taiwanese supply base, reducing exposure to future capacity disruptions tied to a concentrated set of specialized global producers and shortening emergency procurement timelines across the broader display component supply chain and its regional fabrication partners in China, Southeast Asia, and the United States.

Invest in domestic optical bonding capacity

Larger vendors increasingly invest in domestic optical bonding assembly infrastructure, trading upfront capital investment for long-term supply certainty that protects production schedules during periods of broader global component shortages affecting the wider display manufacturing sector and its major regional suppliers across multiple manufacturing hubs, secondary fabrication sites, and several emerging assembly regions worldwide overall.

Negotiate multi-year glass supply agreements

Vendors are increasingly locking in multi-year fixed-price glass and adhesive supply agreements with key suppliers, trading some near-term flexibility for predictable input cost planning across multi-year customer delivery commitments, internal margin forecasts, and broader product roadmap budgets spanning several fiscal years across the organization, its regional business units, and its entire long-term supplier network.

Portfolio Architecture for Margin Defence

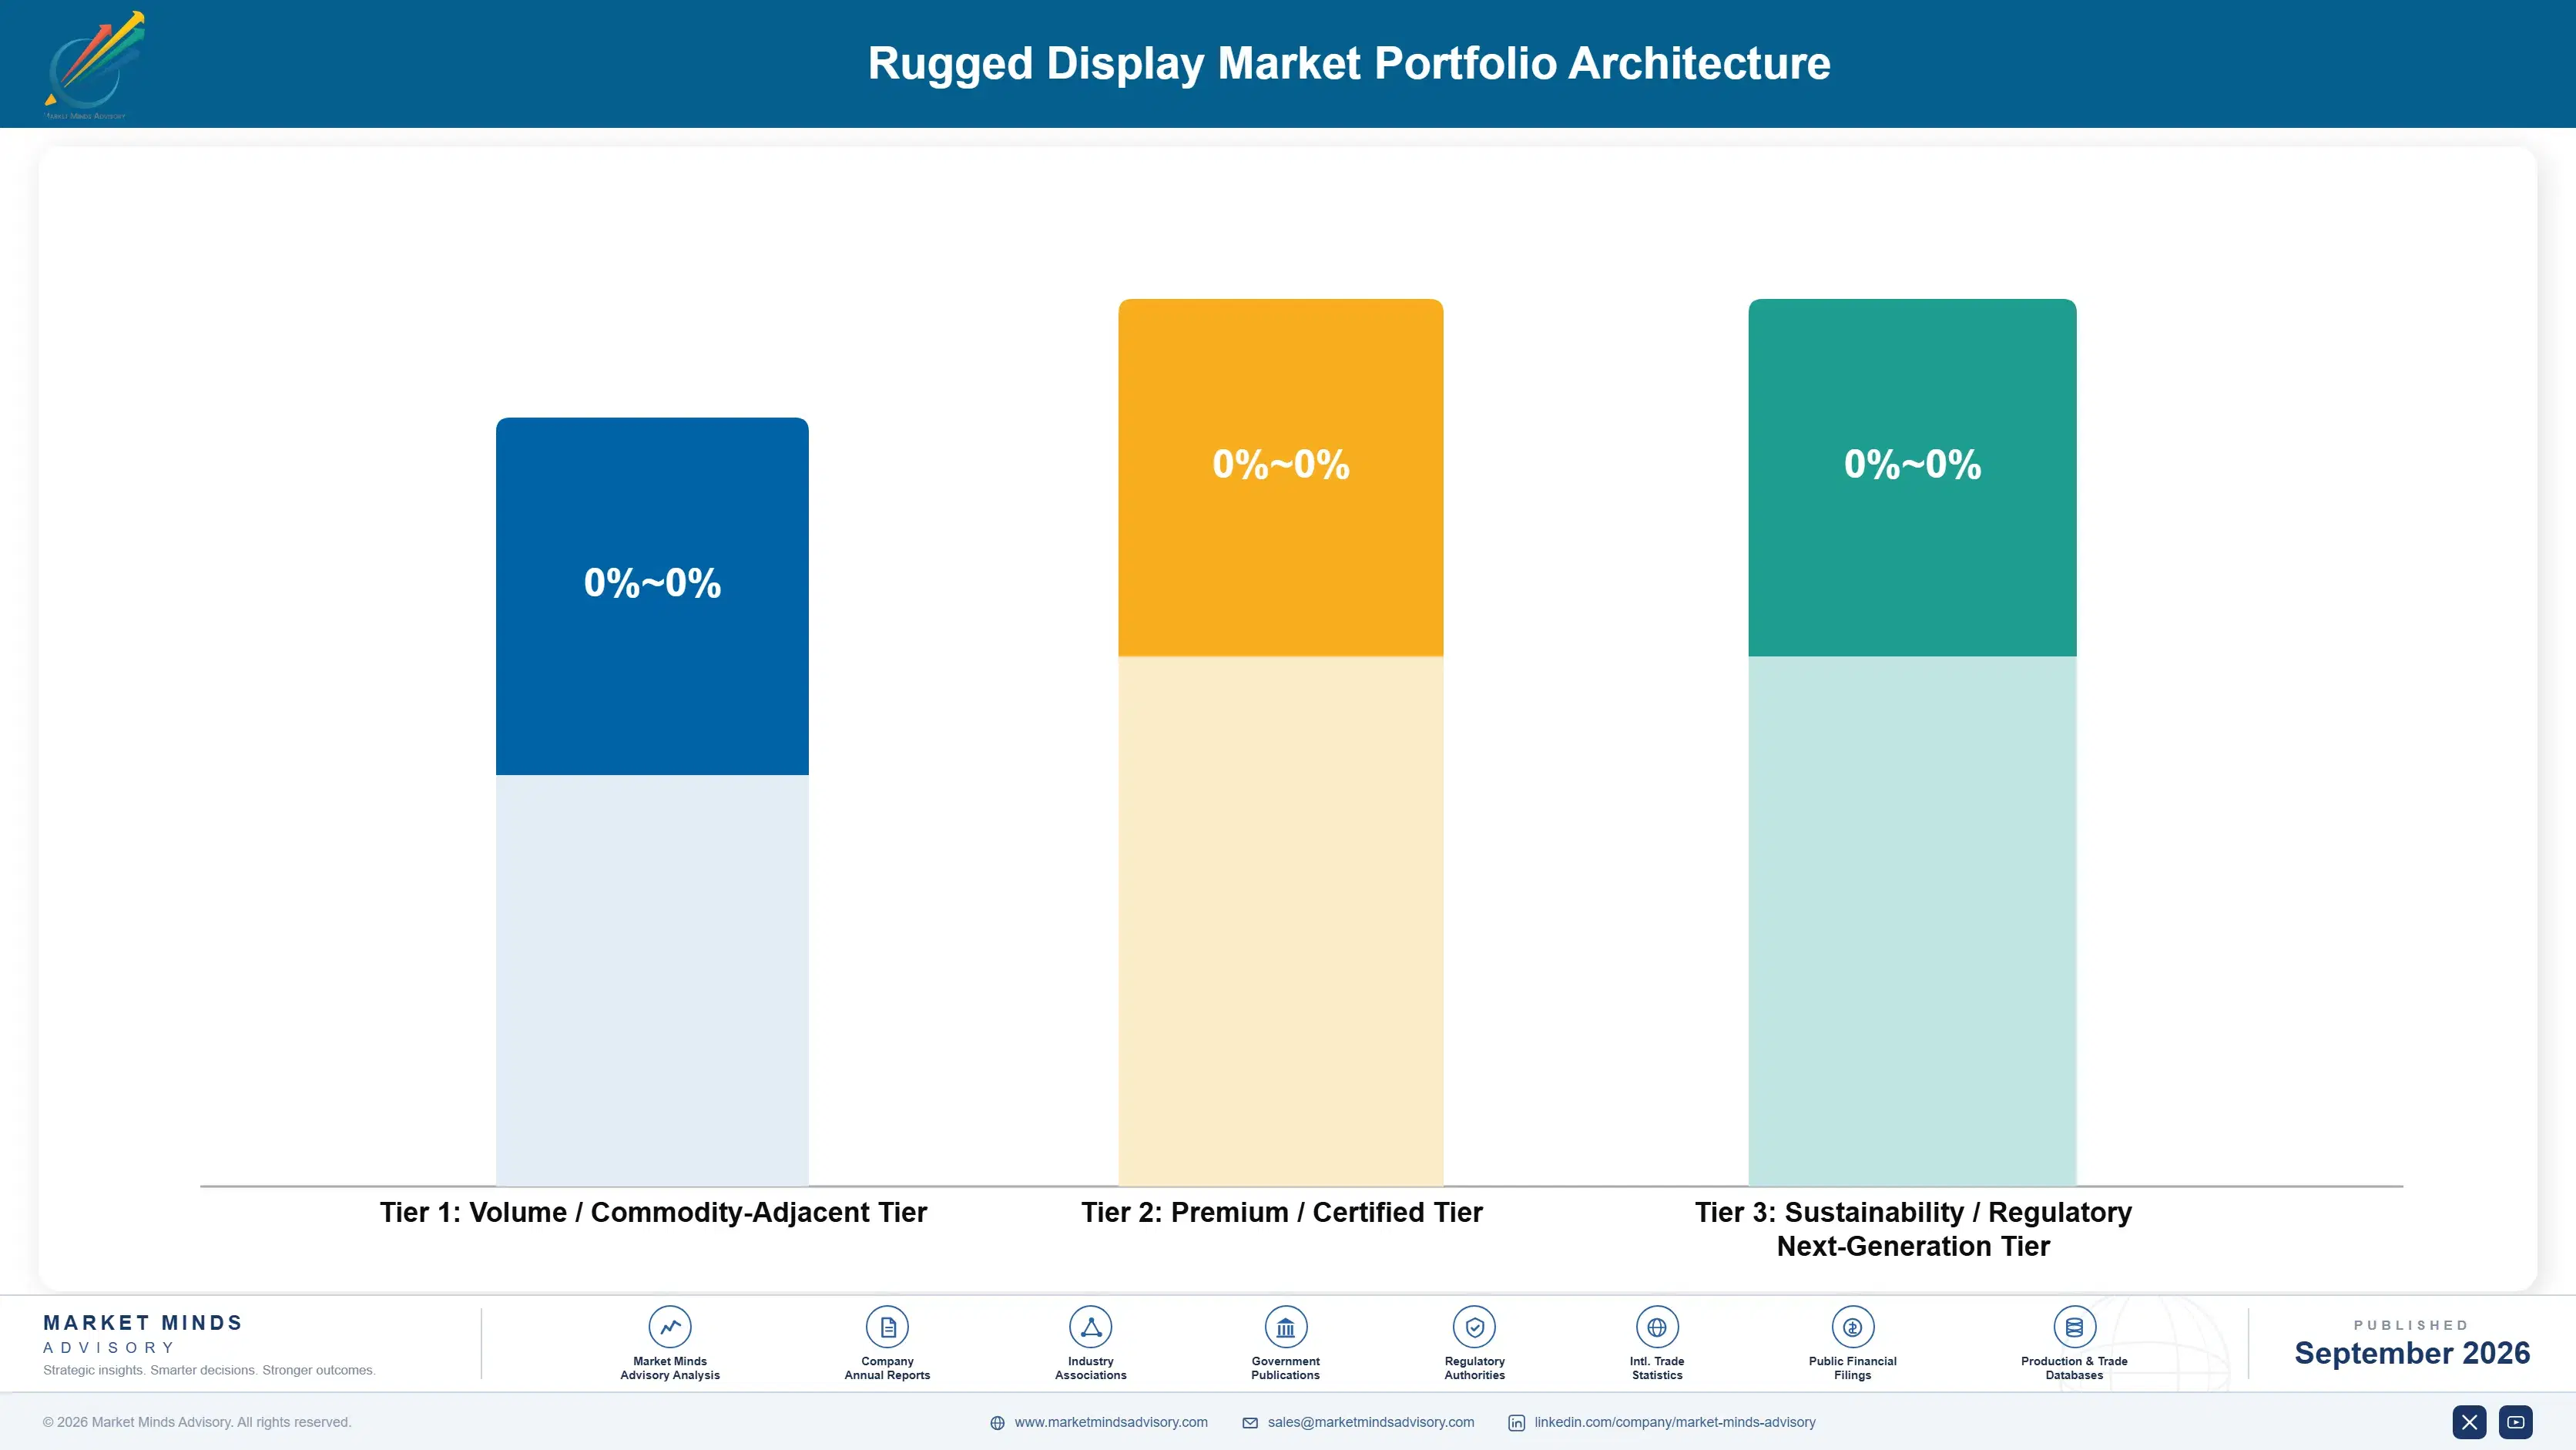
Three tiers structure the rugged display market, separating volume-oriented standard ruggedized panels from premium certified platforms carrying defense and mining reliability value. Gross margin ranges span roughly twenty points between the volume tier and the certified premium tier, reflecting how much value defense and industrial buyers place on environmental certification and optical bonding engineering across demanding operating environments and specialized field applications.
Volume-tier shipments still dominate unit counts across standard industrial and commercial deployments, but premium certified defense and mining platforms capture a disproportionate share of vendor profit pools because government and industrial buyers pay materially more for proven reliability during demanding operating conditions. This tension shapes vendor product roadmaps directly, pushing established players toward higher-margin certified platforms and away from commodity display hardware alone as competition intensifies across the volume tier.

High-value margin pools concentrate specifically around pre-certified reference designs bundled with sustainment subscriptions, since defense and industrial buyers increasingly value the recurring design support and obsolescence management these platforms generate over simple display hardware sales alone, a pattern accelerating as fielded program counts grow across multiple platform families and defense contractor supply chains.

Volume / Commodity-Adjacent Tier

Standard ruggedized displays for routine industrial and commercial deployments, sold largely on price and delivery speed against established regional competitors across mature national markets and secondary procurement tenders open to multiple bidders.
Gross Margin: 27 to 34%

Premium / Certified Tier

Defense and mining-grade display systems carrying environmental hardening certifications, commanding materially higher prices from buyers requiring guaranteed reliability for demanding field operating conditions across multiple climate zones, terrains, and remote deployment locations.
Gross Margin: 40 to 48%

Sustainability / Regulatory / Next-Generation Tier

Energy-efficient display platforms with extended obsolescence management aligned to emerging defense sustainability procurement mandates and long-term fleet operating cost reduction targets across large government operator groups, agencies, and allied trading partners.
Gross Margin: 44 to 53%
rugged-display-market-portfolio-architecture-1790002024847

High-value Sub-segments and Strategic Watch-out

Pre-Certified Reference Design Platforms

Combines the fastest unit growth with the richest margin profile as defense and industrial buyers pair certified hardware with design partnership subscriptions, creating durable recurring revenue streams beyond the initial hardware sale itself and locking customers into multi-year platform relationships across expanding modernization programs and fielded platform families worldwide.
Gross Margin: 45 to 54%

Mining and Heavy Equipment Displays

Commands strong margins from equipment manufacturers seeking certified reliability across regulated environmental hardening standards, though growth trails the fastest reference design segment by a moderate but consistent margin across most fleet procurement budgets and renovation cycles nationwide and across several international mining and construction operations.
Gross Margin: 38 to 46%

Standard Industrial and Commercial Displays

Remains the volume core of the market, anchoring unit shipments across routine commercial and industrial deployments even as margin pressure intensifies from regional low-cost competitors expanding aggressively into adjacent enterprise markets and secondary procurement tenders across multiple continents and several fast-growing emerging market economies worldwide.
Gross Margin: 27 to 33%

Legacy Analog Instrumentation Replacement

Warrants close monitoring as aging analog gauge clusters approach replacement age, creating a swing factor that could either sustain volume-tier demand or accelerate migration toward digital platforms entirely across defense and industrial buyers nationwide over the coming several forecast years and their multi-year budget planning cycles.
Gross Margin: 24 to 30%

Fielded Programs as Recurring Infrastructure

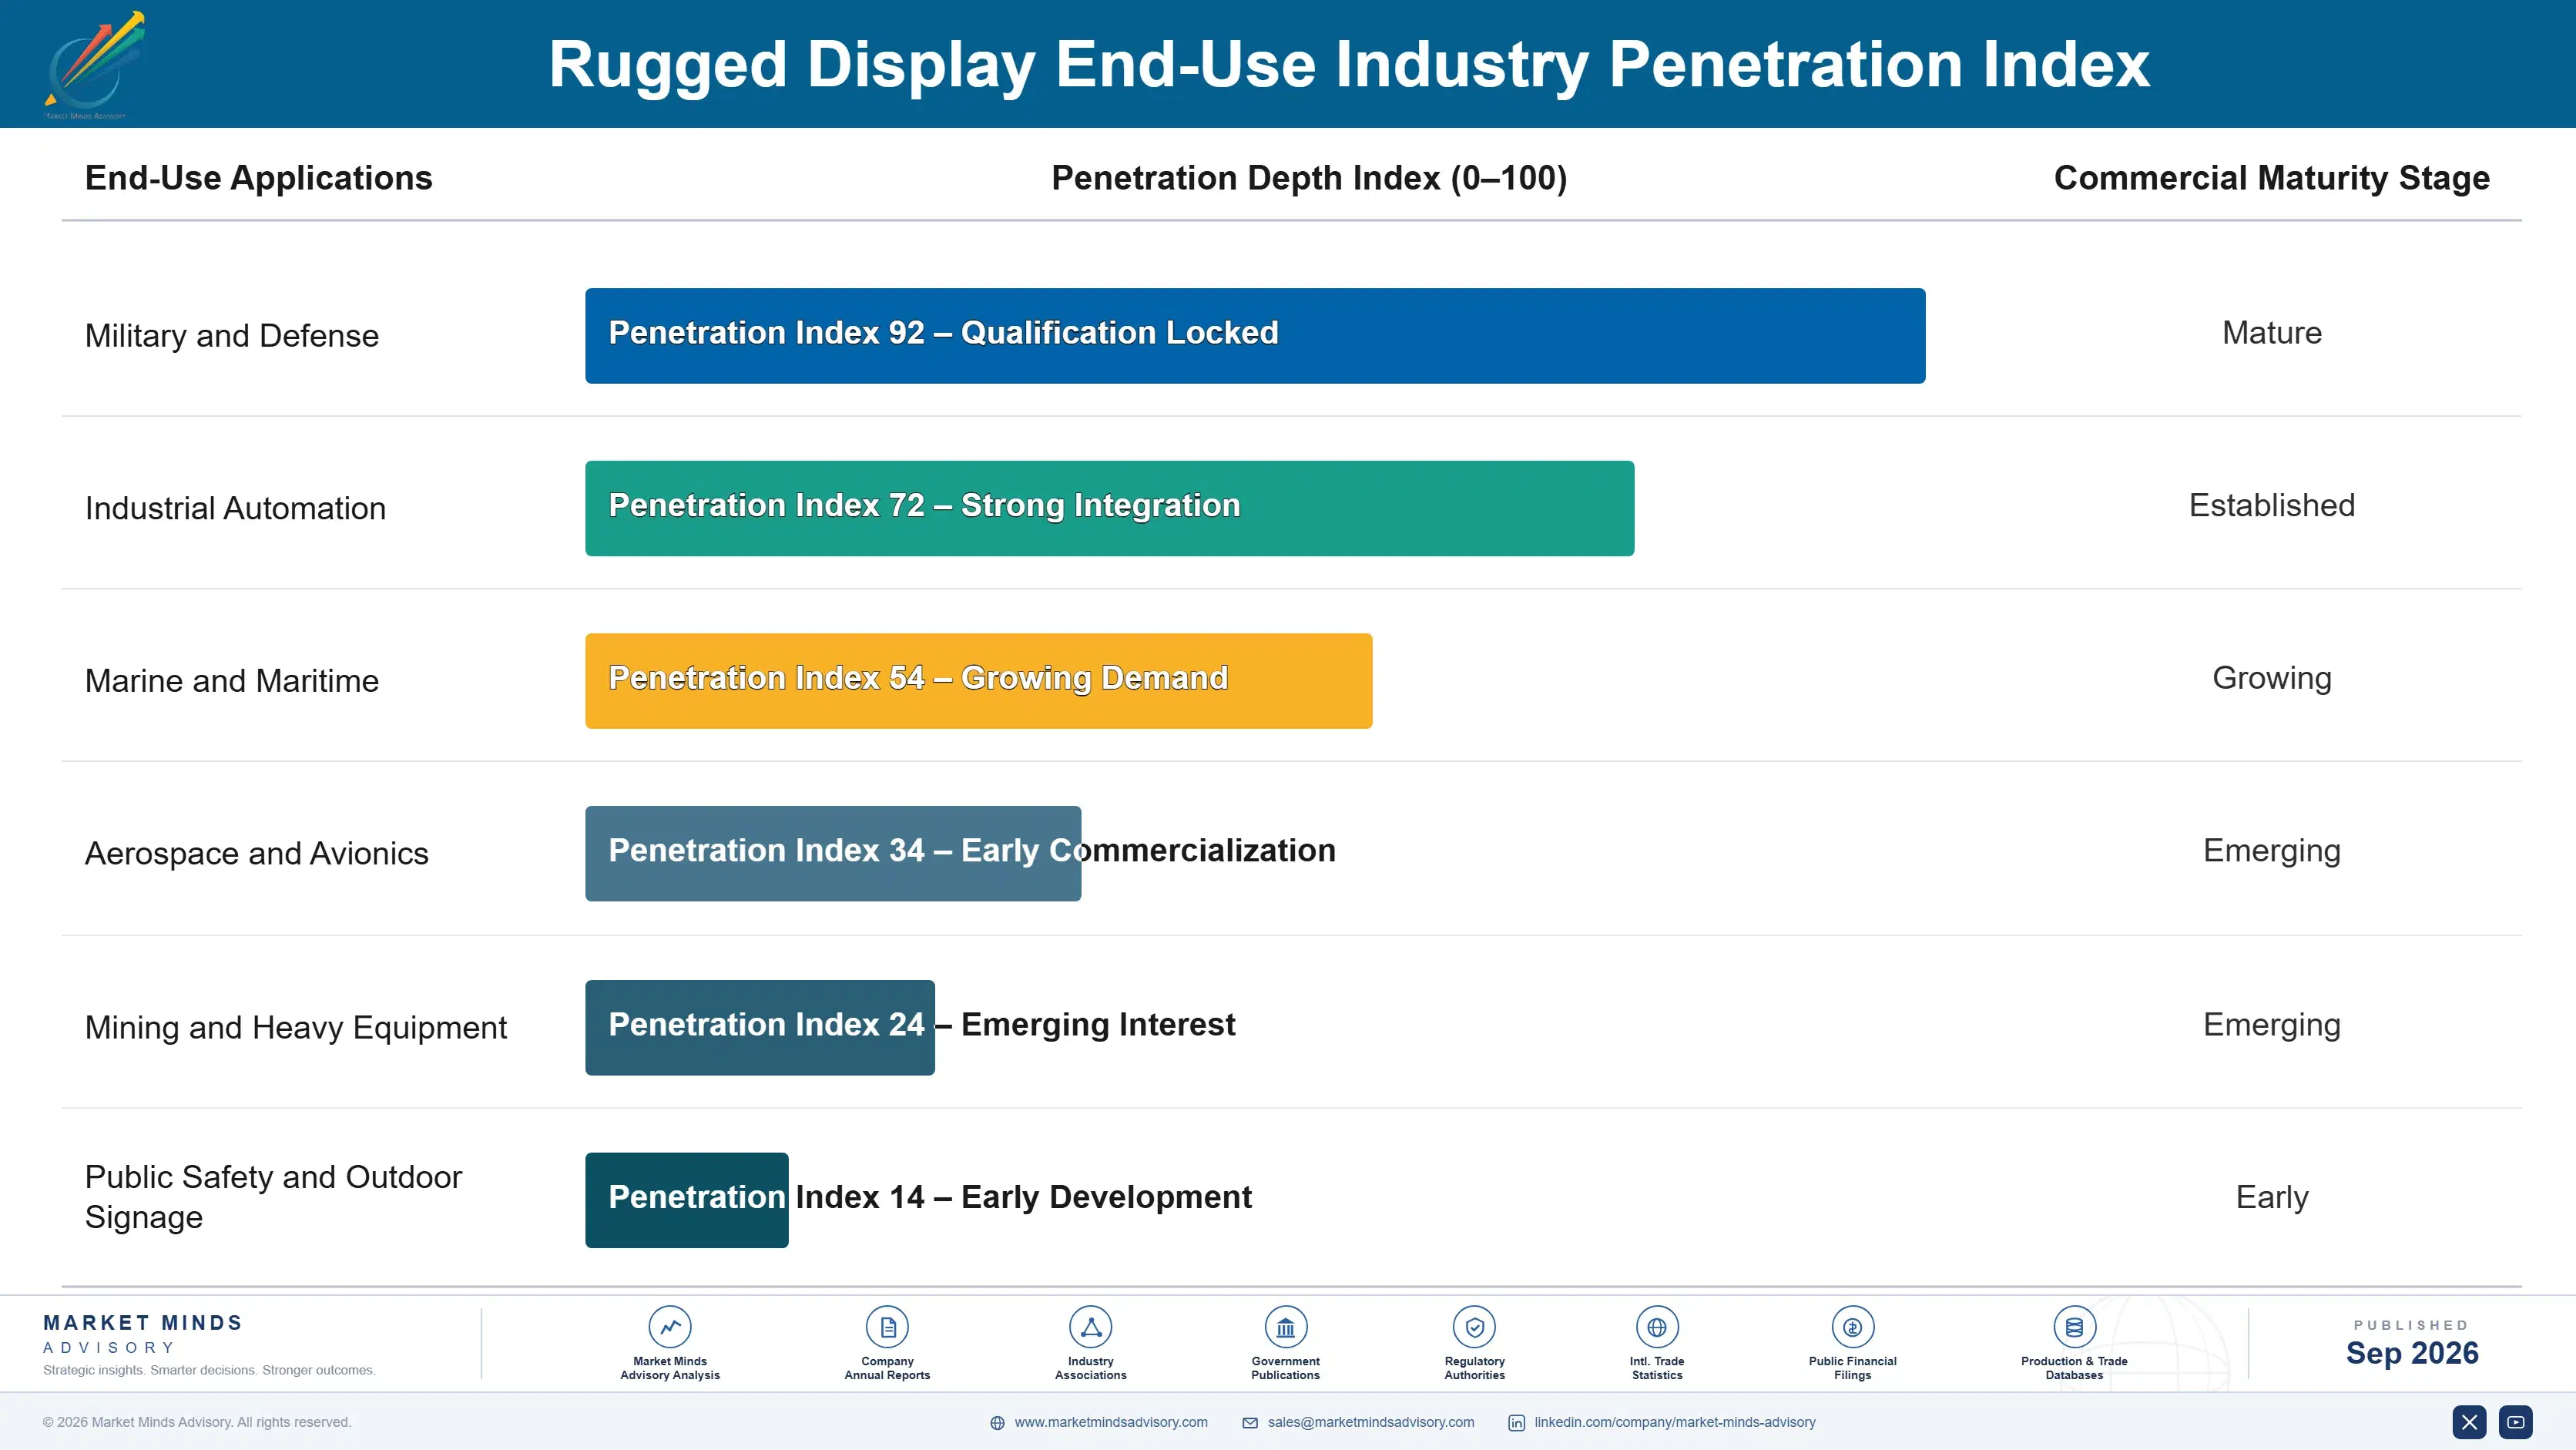
Rugged displays increasingly function as long-lived program infrastructure rather than one-time equipment sales, generating recurring sustainment, obsolescence management, and eventual upgrade revenue across a typical ten to fifteen year fielded service life. Program managers rarely swap vendors mid-program given the integration cost of recertifying a new display design and retraining maintenance personnel, giving incumbent vendors durable annuity-like revenue once a display design wins initial platform selection.
Adoption stickiness varies meaningfully by end-use vertical. Defense programs exhibit the deepest lock-in given multi-decade platform service lives and extensive certification requirements, while industrial automation buyers switch more readily since their deployments carry shorter equipment lifecycles and lower integration complexity across routine refresh cycles. Mining and heavy equipment buyers sit between these two, valuing reliable vendor relationships but retaining flexibility as fleet replacement cycles create natural vendor re-evaluation points.

Buyer profiles are shifting generationally as program managers increasingly favor pre-certified reference designs offering faster time to deployment over legacy custom display development requiring lengthy independent certification cycles. Younger engineering teams entering defense and industrial organizations expect the same rapid iteration capability common across other electronics categories, gradually reshaping vendor selection criteria toward platforms bundling design support alongside core display hardware.
rugged-display-market-end-use-penetration-index-1790002025706

Where Ruggedization Investment Pays Off Next

These are among the four positions where our research anticipates prominent divergence between winners and laggards over the coming forecast period. Each is grounded in the demand model, the regulatory perimeter, and the announced capacity pipeline.
01 / CERTIFICATION INVESTMENT PRIORITY

Prioritize optical bonding certification over incremental features

Vendors still competing primarily on base display specifications face compressing margins as consumer panel overcapacity periodically drives commodity pricing low enough to undercut vendors lacking proven certification pedigree and test documentation. Reallocating engineering investment toward optical bonding and environmental hardening certification captures the disproportionate profit pool tied to defense and mining procurement requirements now determining contract eligibility across most program categories. Firms that delay this shift risk ceding the highest-margin certified contracts to faster-moving rivals within the next several forecast years ahead.
02 / GLASS SUPPLY RESILIENCE

Lock in multi-year display glass supply agreements

Display glass exposure remains concentrated among a small group of Taiwanese and Korean suppliers, leaving vendors without long-term agreements vulnerable during future capacity shortages tied to competing automotive and consumer electronics demand across multiple industries simultaneously and unpredictably. Securing multi-year fixed-price glass contracts protects production schedules against the kind of margin compression seen during the 2025 demand spike, when several vendors absorbed higher costs for two consecutive quarters. This single step meaningfully reduces earnings volatility tied to component pricing swings ahead.
03 / GEOGRAPHIC MARKET PRIORITIZATION

Prioritize North America and India expansion investment

North America anchors regional volume through the world's largest defense modernization budget, while India's faster growth trajectory reflects an earlier stage of defense and industrial automation investment across its expanding manufacturing sector and government localization programs favoring domestic electronics production. Vendors that establish local assembly or service partnerships in these regions gain meaningful cost and delivery advantages over competitors shipping from more distant production bases across other continents. This positioning matters increasingly as buyers favor suppliers who can meet compressed deployment timelines reliably.
04 / RECURRING REVENUE MONETIZATION

Build recurring revenue through sustainment and design contracts

Bundling pre-certified reference designs with subscription-based sustainment and obsolescence management services creates a recurring revenue stream that hardware sales alone cannot replicate across a vendor's installed program base and multi-year defense contracts spanning several decades of fielded service. Vendors making this transition report materially stronger blended margins than peers still selling standard displays as one-time hardware transactions, and several have begun restructuring sales compensation around subscription attachment rates. Building this capability now positions vendors ahead of the broader industry shift toward subscription-based sustainment management.

Engagement Snapshot From the Field

A live engagement with an industry participant carrying material or product regulatory and market exposure ahead of a defining policy shift, showing how our research translates into a defensible multi-year portfolio strategy.
MARKET MINDS ADVISORY · CLIENT ENGAGEMENT SUMMARY
Rugged Display Producer Strategic Portfolio Review and Transition Roadmap 2026·Investment Scenario on Rugged Display Exposure Evaluation 2025-26
CLIENT PROFILE
A regional mining operator running open-pit extraction sites across a mid-sized North American operating region approached MMA to evaluate converting its heavy equipment fleet from analog gauge clusters to digital rugged displays. The operator maintained roughly 340 pieces of heavy mining equipment, with rising maintenance costs and limited diagnostic visibility increasingly constraining fleet uptime across its oldest equipment vintages.
STRATEGIC CHALLENGE
The operator faced a choice between incrementally retrofitting existing equipment with aftermarket digital displays or committing capital to a broader fleet-wide digitization program tied to its next major equipment refresh cycle. Internal teams disagreed on which approach better balanced near-term capital constraints against the diagnostic visibility and predictive maintenance capability that digital displays increasingly enabled.
MMA APPROACH
MMA conducted primary interviews with fleet operations executives and reviewed rugged display vendor specifications against the operator's existing equipment inventory and maintenance history. The team modeled retrofit cost and downtime reduction under three deployment scenarios, benchmarking projected costs against comparable mining fleet modernization programs across similar regional operations and equipment types.
KEY FINDINGS
  1. Roughly thirty-eight percent of the fleet sat within equipment age brackets where digital display retrofit delivered a viable return on investment within a reasonable payback period.
  2. Digital display retrofit on the highest-utilization thirty percent of the fleet delivered the strongest downtime reduction relative to capital committed (client-reported, unverified by MMA).
  3. Phased retrofit reduced peak capital outlay by roughly twenty-four percent compared to a single simultaneous fleet-wide conversion across all equipment (client-reported, unverified by MMA).
  4. Vendor consolidation to a single primary display supplier reduced projected integration and maintenance costs across the operator's equipment service organization and technician training programs meaningfully.
CLIENT PROFILE
A regional mining operator running open-pit extraction sites across a mid-sized North American operating region approached MMA to evaluate converting its heavy equipment fleet from analog gauge clusters to digital rugged displays. The operator maintained roughly 340 pieces of heavy mining equipment, with rising maintenance costs and limited diagnostic visibility increasingly constraining fleet uptime across its oldest equipment vintages.
STRATEGIC CHALLENGE
The operator faced a choice between incrementally retrofitting existing equipment with aftermarket digital displays or committing capital to a broader fleet-wide digitization program tied to its next major equipment refresh cycle. Internal teams disagreed on which approach better balanced near-term capital constraints against the diagnostic visibility and predictive maintenance capability that digital displays increasingly enabled.
MMA APPROACH
MMA conducted primary interviews with fleet operations executives and reviewed rugged display vendor specifications against the operator's existing equipment inventory and maintenance history. The team modeled retrofit cost and downtime reduction under three deployment scenarios, benchmarking projected costs against comparable mining fleet modernization programs across similar regional operations and equipment types.
KEY FINDINGS
  1. Roughly thirty-eight percent of the fleet sat within equipment age brackets where digital display retrofit delivered a viable return on investment within a reasonable payback period.
  2. Digital display retrofit on the highest-utilization thirty percent of the fleet delivered the strongest downtime reduction relative to capital committed (client-reported, unverified by MMA).
  3. Phased retrofit reduced peak capital outlay by roughly twenty-four percent compared to a single simultaneous fleet-wide conversion across all equipment (client-reported, unverified by MMA).
  4. Vendor consolidation to a single primary display supplier reduced projected integration and maintenance costs across the operator's equipment service organization and technician training programs meaningfully.
RECOMMENDED STRATEGY
Phase 1: Phase one prioritized digital display retrofit across the highest-utilization thirty percent of equipment facing the most frequent historical downtime events. Phase 2: Phase two extended retrofit to secondary equipment as budget cycles allowed across the broader fleet and additional operating sites nationwide. Phase 3: Phase three consolidated remaining analog equipment to only the units already scheduled for retirement within the coming several years ahead.
OUTCOME
The operator adopted the phased digital display retrofit approach, reporting a twenty-four percent reduction in peak capital outlay against its original fleet-wide conversion budget (client-reported, unverified by MMA). Equipment downtime across priority units declined meaningfully within the first year of phased deployment across all operating sites.

Frequently Asked Questions

Foundational context covering the market sizes, CAGR, scope, country, region and competition that inform every finding below. This section is provided to cover basics and most often pre-purchase conversations, answered from the MMA Primary Research Dataset.

What is the current size of the Rugged Display Market?

The rugged display market reached an estimated 4.3 billion dollars globally in 2025. Growth reflects accelerating defense modernization and industrial automation investment across most major national markets worldwide.

How large will the Rugged Display Market be by 2036?

MMA projects the market will reach roughly 8.86 billion dollars by 2036 under the base case scenario. That reflects nearly a doubling of 2026 revenue over the eleven-year forecast window.

What is the CAGR for the Rugged Display Market 2026 to 2036?

The base case compound annual growth rate is 6.8 percent across the forecast period. Bull and bear scenarios range from 5.6 percent to 8.0 percent depending on defense procurement pace.

Which segment is growing fastest?

Industrial Automation and HMI leads growth at a 10.5 percent CAGR, roughly 1.54 times the overall market rate. Factory digitization of control panels and machine interfaces drives this pace.

Who are the major companies in the Rugged Display Market?

Getac Technology, Panasonic, Winmate, Advantech, and Curtiss-Wright lead the competitive landscape. Combined, the top five players hold an estimated 42 percent share on a revenue basis.

Which country is growing fastest?

India leads country-level growth at a 9.3 percent CAGR, outpacing the global average as defense modernization and industrial automation investment accelerates. Government localization programs contribute meaningfully to this pace.

Report Segmentation Architecture

The full report scope spans multiple orthogonal segmentation dimensions, with cross-tabulated demand data provided for each dimension pair. Coverage extends further to regional breakdowns, trend trajectories, and the competitive detail needed to support segment-level decision-making.

By Primary Market Dimension

  • Rugged LCD Displays
  • Rugged OLED Displays
  • Rugged Touch Panel Displays
  • Optical Bonding Technology
  • Sunlight-Readable Enhancement Modules
  • Display Enclosure and Mounting Hardware

By End-Use Industry

  • Military and Defense
  • Industrial Automation
  • Marine and Maritime
  • Aerospace and Avionics
  • Mining and Heavy Equipment
  • Public Safety and Outdoor Signage

By Commercial Dimension

  • Direct Defense Procurement
  • Systems Integrator Channel
  • OEM Equipment Manufacturer Supply
  • Distributor and Reseller Channel
  • Aftermarket Retrofit Services
  • Long-Term Sustainment Contracts

By Region

  • North America
  • East Asia
  • Western Europe
  • South Asia and Pacific
  • Latin America
  • Middle East and Africa
  • Eastern Europe

Scope, Methodology, and Coverage

Every figure in this report is reproducible from documented input assumptions. The scope below maps the historical period, the forecast horizon, the segmentation dimensions, and the countries covered, alongside the underlying primary and qualitative methodology.
Historical Period
2020 to 2025
Forecast Period
2026 to 2036
Base Year
2025 (USD billions; MMA Primary Research Dataset, September 2026)
Market Definition
The rugged display market covers ruggedized LCD, OLED, and touch panel displays engineered for shock, vibration, temperature extreme, and sunlight-readability requirements across defense, industrial, marine, aerospace, and mining applications. It excludes consumer and commercial-grade displays without environmental hardening, standalone touch sensor components, and general-purpose computing hardware sold without an integrated ruggedized display.
Quantitative Units
USD Billion
Segmentation Dimensions
Application, End-Use Industry, Commercial Channel, Region
Regions Covered
North America, East Asia, Western Europe, South Asia and Pacific, Latin America, Middle East and Africa, Eastern Europe
Countries Covered
United States, Canada, Germany, United Kingdom, France, China, Japan, South Korea, India, Australia, Brazil, Mexico, Saudi Arabia, United Arab Emirates, Poland
Key Companies Profiled
Getac Technology Corporation, Panasonic Holdings Corporation, Winmate Inc, Advantech Co Ltd, Curtiss-Wright Corporation, Crystal Group Inc, Barco NV, Kontron AG, MilDef Group AB, Elo Touch Solutions Inc, DFI Inc, AUO Display Plus Corporation, Innolux Corporation, Estone Technology Co Ltd, General Dynamics Mission Systems Inc, Cybernet Manufacturing Inc, Zytronic PLC, Havis Inc, Teguar Corporation, Dawar Technologies Inc
Quantitative Methodology
Primary survey, n=3,800 respondents, Q4 2025, six countries; demand-side model with trade association cross-validation
Qualitative Methodology
47 expert interviews, Q4 2025; applied to validate demand model assumptions, identify emerging dynamics, and assess competitive positioning
Report Format
PDF and XLSX data workbook (Word format preview document)
Publisher
Market Minds Advisory
Report Code
MMA-2026-TEC-521
Published
September 2026
Contact
sales@marketmindsadvisory.com | www.marketmindsadvisory.com

Purchase the full Rugged Display Market Report (2026 to 2036).

This report delivers a comprehensive analysis of the global rugged display market across the 2026 to 2036 forecast period. It covers market sizing, segmentation by application and end-use industry, and regional demand dynamics across all seven major world regions. The report profiles twenty leading vendors, benchmarks competitive positioning, and quantifies input cost exposure tied to display glass and optical bonding supply chains. Analysts detail revenue diversification strategies, portfolio margin economics, and the demand mechanisms shaping defense and industrial procurement decisions through the coming decade. A dedicated client case study illustrates how these findings translate into practical fleet modernization decisions.
Seven-region demand and CAGR breakdown analysis
Twenty-company competitive benchmarking and positioning profile
Revenue lever and monetization pathway analysis
Input cost exposure and mitigation strategies
Segment-level growth and margin forecasting detail
Client engagement case study with outcomes

Built For The People Who Decide

From boardroom strategy to bench-side execution, this report is read cover-to-cover by leaders shaping the next decade of their industry, turning demand scenarios, market dynamics and valuation benchmarks into decisions.
CXOs/ Presidents/ VPs/ Managers
M&A and Corporate Development
Strategy Teams and R&D Heads
Procurement and Product Directors
Regulatory and Compliance Leaders
Investor Relations and Equity Analysts