Market Minds Advisory
Robotic Vision Market

Robotic Vision Market: Robotic Vision Market. AI-Powered 3D Perception Redefines Industrial Automation Precision

Robots that once needed parts arranged in precise fixtures can now reach into a jumbled bin and pick exactly what they need, opening automation to tasks manufacturers had written off as too variable to mechanize.

Lead Analyst

Published

September 2026

Make Smarter Decisions with Customized Research Insights

Request a free sample report and evaluate market opportunities, growth trends, and competitive dynamics relevant to your business needs.

2025 MARKET VALUE$5.8BMarket Size 2025
2036 FORECAST VALUE$28.0BBase Case , 2026 to 2036
CAGR 2026 TO 203615.4 %Bull 16.7% / Bear 14.1%
INCREMENTAL OPPORTUNITY$21.3BNet 10- year value creation
EXPANSION MULTIPLE4.19x2036 value over 2026 base
Strategic Levers
M&A Pipeline
Regional Outlook
Country Rankings
Competitive Intelligence
Segmental Deep-dive
Call-Us : 91 93563 13602

Executive Snapshot and Market Trajectory.

Robotic vision has moved from simple presence detection to full 3D scene understanding, as AI-powered perception systems let robots handle unstructured tasks that fixed automation could never reliably address across nearly every manufacturing environment served by operators globally worldwide today. That risk keeps operations leaders up at night.
AI-powered 3D vision and bin-picking systems are pulling capital fastest among manufacturers automating tasks that require handling randomly oriented parts, while traditional 2D machine vision vendors race to add depth-sensing capability before losing design wins entirely to more capable competitors moving faster. Deployment is concentrated heavily among manufacturers across East Asia and increasingly across fast-growing North American reshoring-driven automation programs. Order volume for depth-sensing licenses keeps climbing steadily each quarter across the industry.
Competitive intensity centers on a moderately concentrated field of established machine vision vendors rather than a handful of dominant incumbents, since accuracy across varied lighting and part geometry requires years of accumulated algorithm refinement specific to each application served across the industry. Semiconductor sensor supply constraints are reshaping which vendors can scale camera production to meet surging demand. Rankings could shift. Few can close it quickly.
Market Definition
This report defines the Robotic Vision Market as camera hardware and AI-powered software that enable robots to perceive, interpret, and respond to their physical environment, including 2D and 3D machine vision systems, bin-picking software, and quality inspection platforms. It excludes general industrial cameras without robotic guidance integration, standard barcode scanning systems, and autonomous vehicle perception systems.
Base Year Value
$5.8B in 2025 (MMA Primary Research Dataset, September 2026)
Forecast Period
2026 to 2036, eleven discrete annual values
CAGR
15.4% base case. Bull 16.7%. Bear 14.1%.
Fastest Growth Segment
AI-Powered 3D Vision and Bin-Picking Systems: 23.9% CAGR
Fastest Growth Country
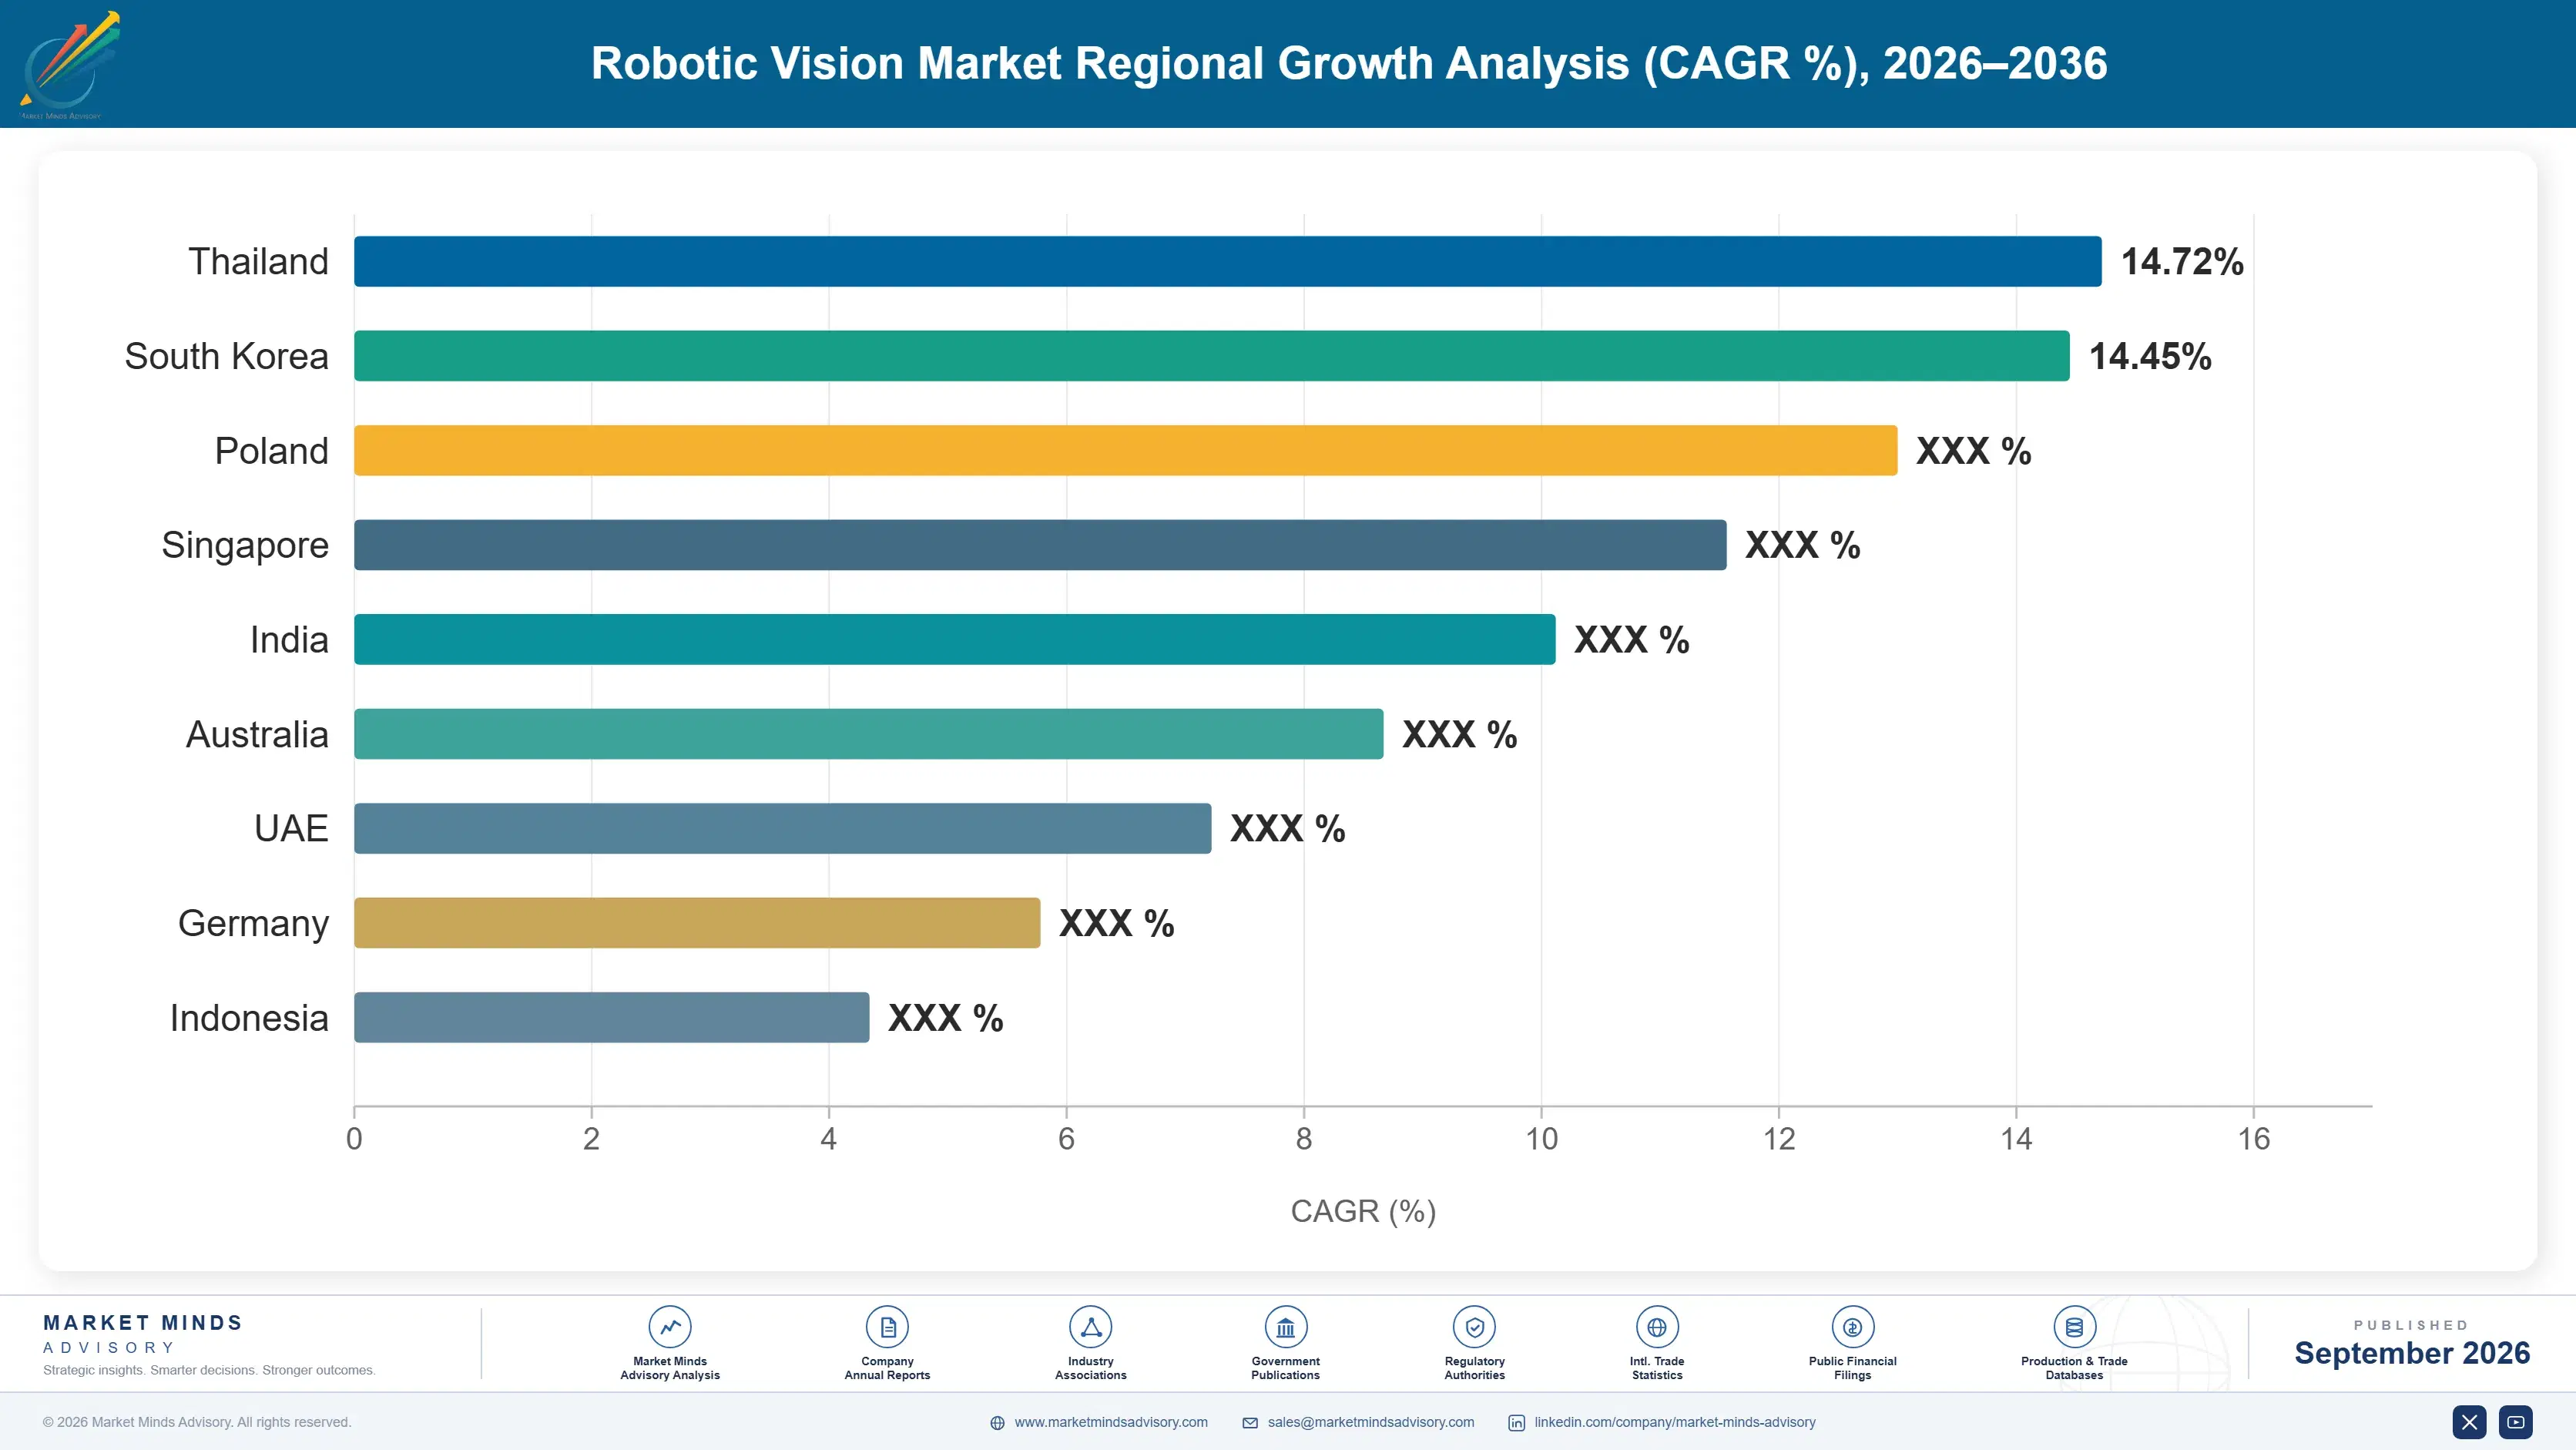
India: 22.0% CAGR
Fastest Growth Region
South Asia and Pacific: 17.4% CAGR
Largest Region
East Asia: 30% of 2025 global value
Market Leaders
Keyence, Cognex, Basler, OMRON, and Zebra Technologies. Source: MMA Analysis based on company disclosures and unit shipment estimates.
Primary Survey
n=3,800 procurement and R&D decision-makers, Q4 2025, six countries
Methodology
Demand-side build-up, cross-validated against public data, 47 expert interviews

Robotic Vision Market Forecast Scenarios

robotic-vision-market-size-forecast-scenario-1789996359542
Between 2020 and 2025, robotic vision grew steadily as basic 2D machine vision expanded across manufacturing quality inspection lines worldwide, though most robots still relied on precisely fixtured parts rather than flexible perception. The category posted a historical CAGR of roughly 14.2% as 3D perception and AI-powered bin-picking capability remained limited to specialized, high-cost implementations.
The base case rests on three commercial mechanisms: manufacturers adopting AI-powered 3D vision to automate randomly-oriented part handling that fixed automation could never address, reshoring-driven automation investment expanding vision system deployment across new facilities, and semiconductor sensor cost declines making advanced depth-sensing accessible to smaller manufacturers. Together these mechanisms support a forecast CAGR of 15.4% through 2036, with 3D vision and bin-picking systems growing considerably faster than traditional 2D inspection tools.
The bull case centers on accelerated reshoring and labor shortage pressure that pulls forward vision-guided automation investment across multiple manufacturing verticals simultaneously. The bear case centers on semiconductor sensor supply constraints that could limit camera production capacity, compressing available supply even as underlying demand for robotic vision continues expanding steadily. That pressure keeps intensifying steadily across the industry. Growth remains steady.

From Fixed Fixtures to Flexible AI Perception

Robotic vision has moved from a quality control checkpoint to the perception layer that determines what tasks robots can physically automate, since 3D depth-sensing now lets robots handle variability that fixed automation could never manage. No manufacturer wants to keep paying for manual sorting labor competitors have already eliminated. Robots must actually see and reason about what they grasp.
MARKET CONCENTRATION50% CR5Top five vendors hold combined global unit shipment share
AVERAGE SYSTEM PRICE$28,000 per unitBlended price across standard and depth-sensing vision system tiers
TOP PRODUCING COUNTRY SHARE26%Japan share of global robotic vision hardware production
3D VISION ADOPTION RATE31%Share of new robotic vision deployments using depth-sensing technology
BIN-PICKING ACCURACY RATE96%Average pick success rate across leading vendor AI platforms
SENSOR COMPONENT COST SHARE38% of COGSShare of system cost tied to imaging sensor components
Bin-picking accuracy has become the primary competitive differentiator among vendors, since manufacturers increasingly select vision systems based on documented pick success rates for their specific part geometries rather than raw camera specifications. Vendors lacking application-specific training data are steadily losing design wins to more specialized competitors. That gap keeps widening every fiscal quarter across the vendor landscape. Order volume for depth-sensing platform licenses keeps climbing steadily.
Sensor component sourcing has become a significant cost and competitive barrier, since advanced imaging sensors require specialized semiconductor fabrication capacity that few suppliers can provide at meaningful scale. That scarcity is reinforcing incumbent advantage even as newer entrants offer meaningfully more advanced AI-native perception software. Few smaller vendors can realistically close that sensor sourcing gap quickly. That gap keeps widening every quarter across the industry.
"Everyone assumed robotic vision was solved once cameras got cheap. Then manufacturers tried automating a bin of randomly tangled parts and discovered the hard problem was never the camera, it was teaching software to actually understand what it saw."
Director, Industrial Automation and Machine Vision Practice · MMA Technology Practice · September 2026

Market Trends

AI-Powered Bin-Picking Becomes Standard for Randomized Handling

Manufacturers automating tasks involving randomly oriented parts are increasingly specifying AI-powered bin-picking systems rather than redesigning fixtures to constrain part orientation, treating flexible perception as more cost-effective than mechanical constraint engineering. Roughly 31% of new robotic vision deployments now use depth-sensing bin-picking technology, up sharply from a modest share just two years ago, and vendor lead times have extended past several months as demand continues outpacing available sensor supply across the industry. Vendors that built adequate sensor supply early now hold a meaningful advantage over slower-moving competitors still expanding manufacturing capacity.
Market Impact: vision automation spending grew 28% yearly

Reshoring Investment Accelerates Automation Deployment Timelines

Manufacturers reshoring production from overseas facilities are deploying robotic vision systems faster than greenfield facility planning would normally allow, treating vision-guided automation as essential infrastructure for new domestic production lines. This shift has pulled roughly 24% of reshoring-related capital expenditure into vision-guided automation systems over the past two years, reshaping how manufacturers prioritize automation investment against other facility modernization needs. Vendors offering the fastest deployment timelines are capturing disproportionate share of this reshoring-driven demand as facility construction schedules remain compressed. That trend is expected to continue as reshoring momentum remains strong nationwide.
Market Impact: fulfillment vision deployment grew 26%

Market Opportunities and Growth Drivers

Manufacturing Labor Shortages Accelerate Automation Investment

Manufacturers facing persistent difficulty hiring workers for repetitive sorting and inspection tasks are accelerating investment in robotic vision to automate roles that traditional recruitment could no longer fill reliably. Vision-guided automation spending grew roughly 28% year over year as manufacturers concluded that automation investment now delivers faster payback than continuing to compete for scarce manual labor across nearly every major manufacturing region served today. That trajectory is expected to continue as labor markets remain tight across multiple manufacturing categories over the coming several years ahead for most operators. Margins for premium systems remain elevated.
Market Impact: extends lead times by 5 months

E-Commerce Fulfillment Growth Expands Vision-Guided Sorting

E-commerce fulfillment operators managing rapidly growing order volumes are deploying vision-guided sorting robots to handle the enormous variety of product shapes and packaging that manual sorting could not scale to match cost-effectively. Fulfillment center vision system deployment grew roughly 26% year over year as operators sought to maintain delivery speed commitments despite persistent labor availability constraints across peak shopping seasons. Vendors offering the most versatile part-handling capability are capturing disproportionate share of this fulfillment-driven demand as order volumes continue expanding steadily. That competitive gap continues widening every fiscal quarter across the sector.
Market Impact: extends deployment by roughly 6 weeks

Market Restraints and Challenges

Imaging Sensor Supply Constraints Limit Production Scale

The core friction point is that advanced imaging sensors require specialized semiconductor fabrication capacity that few suppliers can provide at meaningful scale, rooted in the concentrated global semiconductor manufacturing base that serves multiple competing industries simultaneously. The commercial impact is direct: vision system vendors face allocation constraints and extended lead times even when willing to pay premium pricing for guaranteed supply. Several vendors are responding by qualifying alternative sensor suppliers as a mitigation pathway that reduces single-source dependency. Smaller vendors without existing supplier relationships find themselves further constrained in securing allocation during periods of tight global sensor supply.
Market Impact: 31% of deployments use bin-picking now

Application-Specific Training Data Requirements Slow Deployment

The core friction point is that achieving reliable bin-picking accuracy requires training data specific to each part geometry and material, a constraint rooted in computer vision models transferring poorly across significantly different object shapes and surface properties. The commercial impact falls hardest on manufacturers with highly varied product lines requiring extensive per-application model training before deployment. Several vendors are mitigating exposure by building synthetic data generation tools that accelerate model training considerably. This synthetic data approach adds meaningful upfront engineering investment but has proven effective at reducing deployment timelines for manufacturers with highly varied product catalogs.
Market Impact: 24% of reshoring capex funds vision
4 additional market trends, 4 additional growth drivers, and 3 additional restraints and challenges are covered in the full report. Contact sales@marketmindsadvisory.com to access the complete intelligence.

Segment CAGR and Growth Architecture

Robotic vision segments by core perception technology rather than by end application, since the same underlying camera hardware and AI processing architecture serves quality inspection, bin-picking, and robotic guidance use cases across automotive, electronics, and logistics manufacturing environments regardless of which particular industry, geographic region, or overall company size ultimately deploys the technology today.
robotic-vision-market-market-share-analysis-1789996360102

AI-Powered 3D Vision and Bin-Picking Systems

AI-powered 3D vision and bin-picking systems combine depth-sensing cameras with machine learning models trained to identify and calculate grasp points for randomly oriented parts in unstructured bins, enabling automation that fixed fixturing could never achieve. Demand is concentrated among manufacturers and logistics operators handling high part variety who can justify the platform investment required to replace manual sorting labor at meaningful scale. Growth here runs meaningfully ahead of the broader market as labor availability constraints and reshoring investment continue pushing manufacturers toward flexible automation solutions. Vendors offering the deepest application-specific accuracy are winning the largest manufacturer contracts as this segment continues to outgrow the broader vision category considerably. Order backlogs there now extend well past six months.
CAGR 23.9%

Traditional 2D Machine Vision for Quality Inspection

Traditional 2D machine vision systems for quality inspection and presence detection handle standardized tasks like defect identification, dimensional measurement, and barcode reading that do not require full 3D spatial understanding of part orientation or grasp planning. Demand is concentrated among manufacturers with established, stable production processes where part positioning remains consistent and predictable across production runs. Vendors offering the most reliable, cost-effective inspection accuracy are capturing disproportionate share of this large but slower-growing segment of the market. That reliability advantage compounds as inspection accuracy continues improving generation over generation across the broader manufacturing technology sector. Manufacturers switching to these reliable platforms report meaningfully fewer false rejects than those still relying on older-generation inspection systems lacking modern algorithms.
CAGR 11.2%
Full segment breakdown across 7 segments available in the complete report.

Regional Architecture and Country Demand Map

Deployment concentrates where manufacturing robot density and sensor hardware production are deepest, favoring East Asia, followed closely by North American and Western European markets scaling their own automation infrastructure across expanding manufacturing corridors and secondary technology hubs both nationwide and internationally throughout this current cycle.

East Asia

Japan anchors regional demand through Keyence and OMRON's dominant position in machine vision hardware manufacturing, alongside a broader network of robotics integrators serving global automotive and electronics customers. China's massive manufacturing base is scaling domestic vision technology rapidly to reduce reliance on Japanese and Western suppliers. South Korea's electronics manufacturing sector drives substantial demand for high-precision inspection systems given its concentrated semiconductor and display production. Taiwan's advanced semiconductor foundry base provides critical chip manufacturing support for vision system vendors across the region. Order backlogs for top-tier vision systems there now extend several months given surging manufacturer demand. Vendor consolidation through acquisition remains an active theme. That trend is expected to continue steadily.
Share: 30% | CAGR: 16.5% (2026 to 2036)

North America

The United States anchors North American demand through its concentration of reshoring-driven manufacturing investment and the headquarters of vendors like Cognex and Zebra Technologies. Canada contributes a smaller but growing share as domestic manufacturers extend similar automation programs across their own facilities. Competition here centers heavily on AI-powered bin-picking accuracy given the region's strong e-commerce fulfillment automation demand. Mexico's growing manufacturing sector is beginning to adopt similar vision-guided automation as nearshoring investment continues expanding across the country. Several large domestic manufacturers are building proprietary vision capability rather than relying entirely on third-party vendors. That proprietary approach limits third-party vendor penetration somewhat. Vendor consolidation remains an active theme too. That trend continues steadily.
Share: 26% | CAGR: 15.8% (2026 to 2036)
Regional intelligence for 5 additional markets available in the complete report: Western Europe, South Asia and Pacific, Latin America, Middle East and Africa, Eastern Europe. Contact sales@marketmindsadvisory.com.
robotic-vision-market-country-cagr-analysis-1789996360621

Where Vision Vendors Capture More Automation Revenue

Vendors capture disproportionate margin where application-specific accuracy justifies premium bin-picking pricing and where deep sensor supply relationships let vendors serve manufacturers that thinner, less-connected competitors cannot support at scale across the broader vision market today, tomorrow, and well into the several years ahead for most competing vendors operating currently across the entire global industry.

Application-Specific Accuracy Premium Pricing Programs Overall

Vendors that develop deep, application-specific bin-picking accuracy for particular part geometries can sustain higher pricing than vendors offering generic 3D vision capability across multiple use cases. Application-specific systems now command roughly 33% higher pricing than generic vision platforms, letting vendors capture premium value from manufacturers willing to pay for documented accuracy guarantees on their specific parts. Vendors without this application-specific capability increasingly find themselves competing on price alone within the shrinking generic vision segment of the market. That competitive dynamic keeps widening every fiscal quarter. Margins for premium accuracy tiers remain elevated.
Market Impact: specific systems now earn roughly 33% more value

Guaranteed Sensor Allocation Premium Programs Overall

Vendors offering guaranteed sensor allocation to manufacturers facing extended standard lead times are capturing meaningful price premiums over customers willing to wait in standard supply queues. Priority allocation programs now command roughly 26% higher pricing than standard order queues, and demand for guaranteed delivery timelines continues outpacing available sensor supply across nearly every major vendor. Smaller vendors without manufacturing scale to secure priority sensor supply increasingly find themselves excluded from these premium allocation arrangements entirely. That gap keeps compounding as sensor supply remains tight. Vendors continue expanding priority manufacturing capacity to protect this advantage.
Market Impact: priority allocation now costs roughly 26% more value

Synthetic Training Data Service Subscription Programs

Vendors offering synthetic training data generation services that accelerate model deployment for new part geometries are capturing recurring service revenue that extends well beyond the initial hardware sale and original purchase agreement. Synthetic data subscription attach rates have reached roughly 30% among enterprise accounts, and this recurring revenue stream carries considerably higher margin than the underlying hardware sale itself. Several vendors now treat this synthetic data capability as central to long-term customer retention rather than a secondary feature bundled with core hardware sales. Contract renewal rates for these customers run considerably higher.
Market Impact: synthetic data services now attach at 30% rate

Multi-Year Manufacturing Facility Rollout Programs Overall

Vendors that negotiate multi-year rollout contracts covering successive facility deployments are securing considerably more predictable recurring revenue than vendors relying on single-facility transactional sales subject to competitive rebidding each cycle. Multi-year rollout contracts increase average customer lifetime value by roughly 35% relative to comparable single-facility arrangements, giving vendors meaningfully better visibility into future manufacturing capacity planning needs. Vendors without the relationship depth to negotiate multi-year terms increasingly find themselves losing manufacturing accounts to competitors offering greater pricing certainty. That certainty has become genuinely valuable enough to justify meaningfully higher pricing.
Market Impact: multi-year rollouts now add roughly 35% more value

Who Controls the Margin Pool

The Robotic Vision Market is moderately concentrated, with a CR5 of 50% reflecting unit shipment share among the top five machine vision vendors. Keyence holds a leading position given its decades of industrial sensor manufacturing scale and broad distribution network, and the gap between it and mid-tier challengers has widened as sensor supply constraints raise the bar for smaller vendors attempting to compete at meaningful production volume.
Current competitive activity centers on 3D vision capability expansion and sensor supply securing rather than pricing alone, since demand for bin-picking capability exceeds available qualified supply across nearly every major vendor. Leading vendors are pursuing partnerships with semiconductor manufacturers to secure priority sensor allocation while simultaneously acquiring smaller AI software firms to fill perception capability gaps faster than internal development would allow.

Emerging pressure is coming from AI-native perception software startups building generative and foundation-model-based vision algorithms rather than traditional rule-based computer vision, threatening to win design wins among manufacturers seeking the most flexible, rapidly adaptable perception capability. Rankings could shift meaningfully if any AI-native entrant achieves comparable hardware reliability, since manufacturers increasingly weigh software flexibility alongside camera specifications.
robotic-vision-market-company-positioning-matrix-1789996361152

Competitive Moat and Risk Dimensions

KEYENCE

Moat: Broad Sensor Manufacturing Scale

Keyence's decades of industrial sensor manufacturing scale and broad distribution network give it cost and reach advantages that smaller vendors cannot easily replicate, letting it serve customers across nearly every manufacturing vertical simultaneously. That manufacturing scale advantage compounds as sensor supply constraints tighten industry-wide. Competitors would need years of accumulated distribution reach to match this scale.
KEYENCE

Risk: Slower AI Software Innovation Pace

Keyence's hardware-centric heritage can mean a comparatively slower pace of AI-native perception software innovation relative to newer entrants built software-first around foundation models. If AI-native competitors continue closing the perception software gap, Keyence risks losing the most demanding manufacturing accounts seeking the newest available algorithms.
COGNEX

Moat: Deep Machine Vision Software Expertise

Cognex's exclusive focus on machine vision software and hardware integration, built over decades, gives it depth of specialized perception capability that broader industrial automation vendors often cannot match. That focus advantage matters most in complex, high-precision inspection and bin-picking applications. That specialized depth increasingly wins deals in the most demanding inspection scenarios.
COGNEX

Risk: Narrower Product Portfolio Exposure

Cognex's specialized focus means it lacks the broader robotics, sensor, and automation portfolio that diversified vendors like OMRON can bundle vision sales alongside. Competing against bundled offerings requires continuously demonstrating standalone perception value that justifies a separate vendor relationship. That competitive dynamic becomes more pressing each year bundled offerings expand further.

Players Tracked

Prominent Players

Keyence
Cognex
Basler
OMRON
Zebra Technologies

Other Key Players

SICK AG
Teledyne FLIR
National Instruments
Photoneo
Matrox Imaging
IDS Imaging Development Systems
Datalogic
LMI Technologies
Balluff
Baumer Group
Allied Vision
JAI
ISRA VISION
Roboception
Scandit

Recent Developments

MARCH 2026

Keyence acquired a privately held AI perception software startup to accelerate its foundation-model-based bin-picking roadmap ahead of competitors still developing comparable capability internally. The acquisition brings proprietary grasp-planning algorithms and an engineering team with relevant robotics perception experience. Terms of the transaction were not fully disclosed.
Signal: Signals Keyence is filling an AI perception capability gap through acquisition rather than slower internal development.
NOVEMBER 2025

Cognex signed a multi-year supply agreement with a major semiconductor manufacturer to secure priority allocation of advanced imaging sensors ahead of broader market demand. The agreement includes committed manufacturing capacity reserved specifically for Cognex's 3D vision product line. Financial terms of the agreement were not disclosed.
Signal: Signals vendors are locking in sensor supply years ahead of need given persistent manufacturing bottlenecks industry-wide.
JULY 2025

OMRON expanded its collaborative robotics vision integration through an organic engineering investment aimed at reducing deployment time for manufacturers adding new bin-picking capability across expanding production lines. The expansion adds support for a meaningful number of additional robot arm models previously unsupported. The company plans further expansion next year.
Signal: Signals vendors are prioritizing robot compatibility breadth over premium standalone features given customer demand. Enterprise-focused rivals may face pressure.

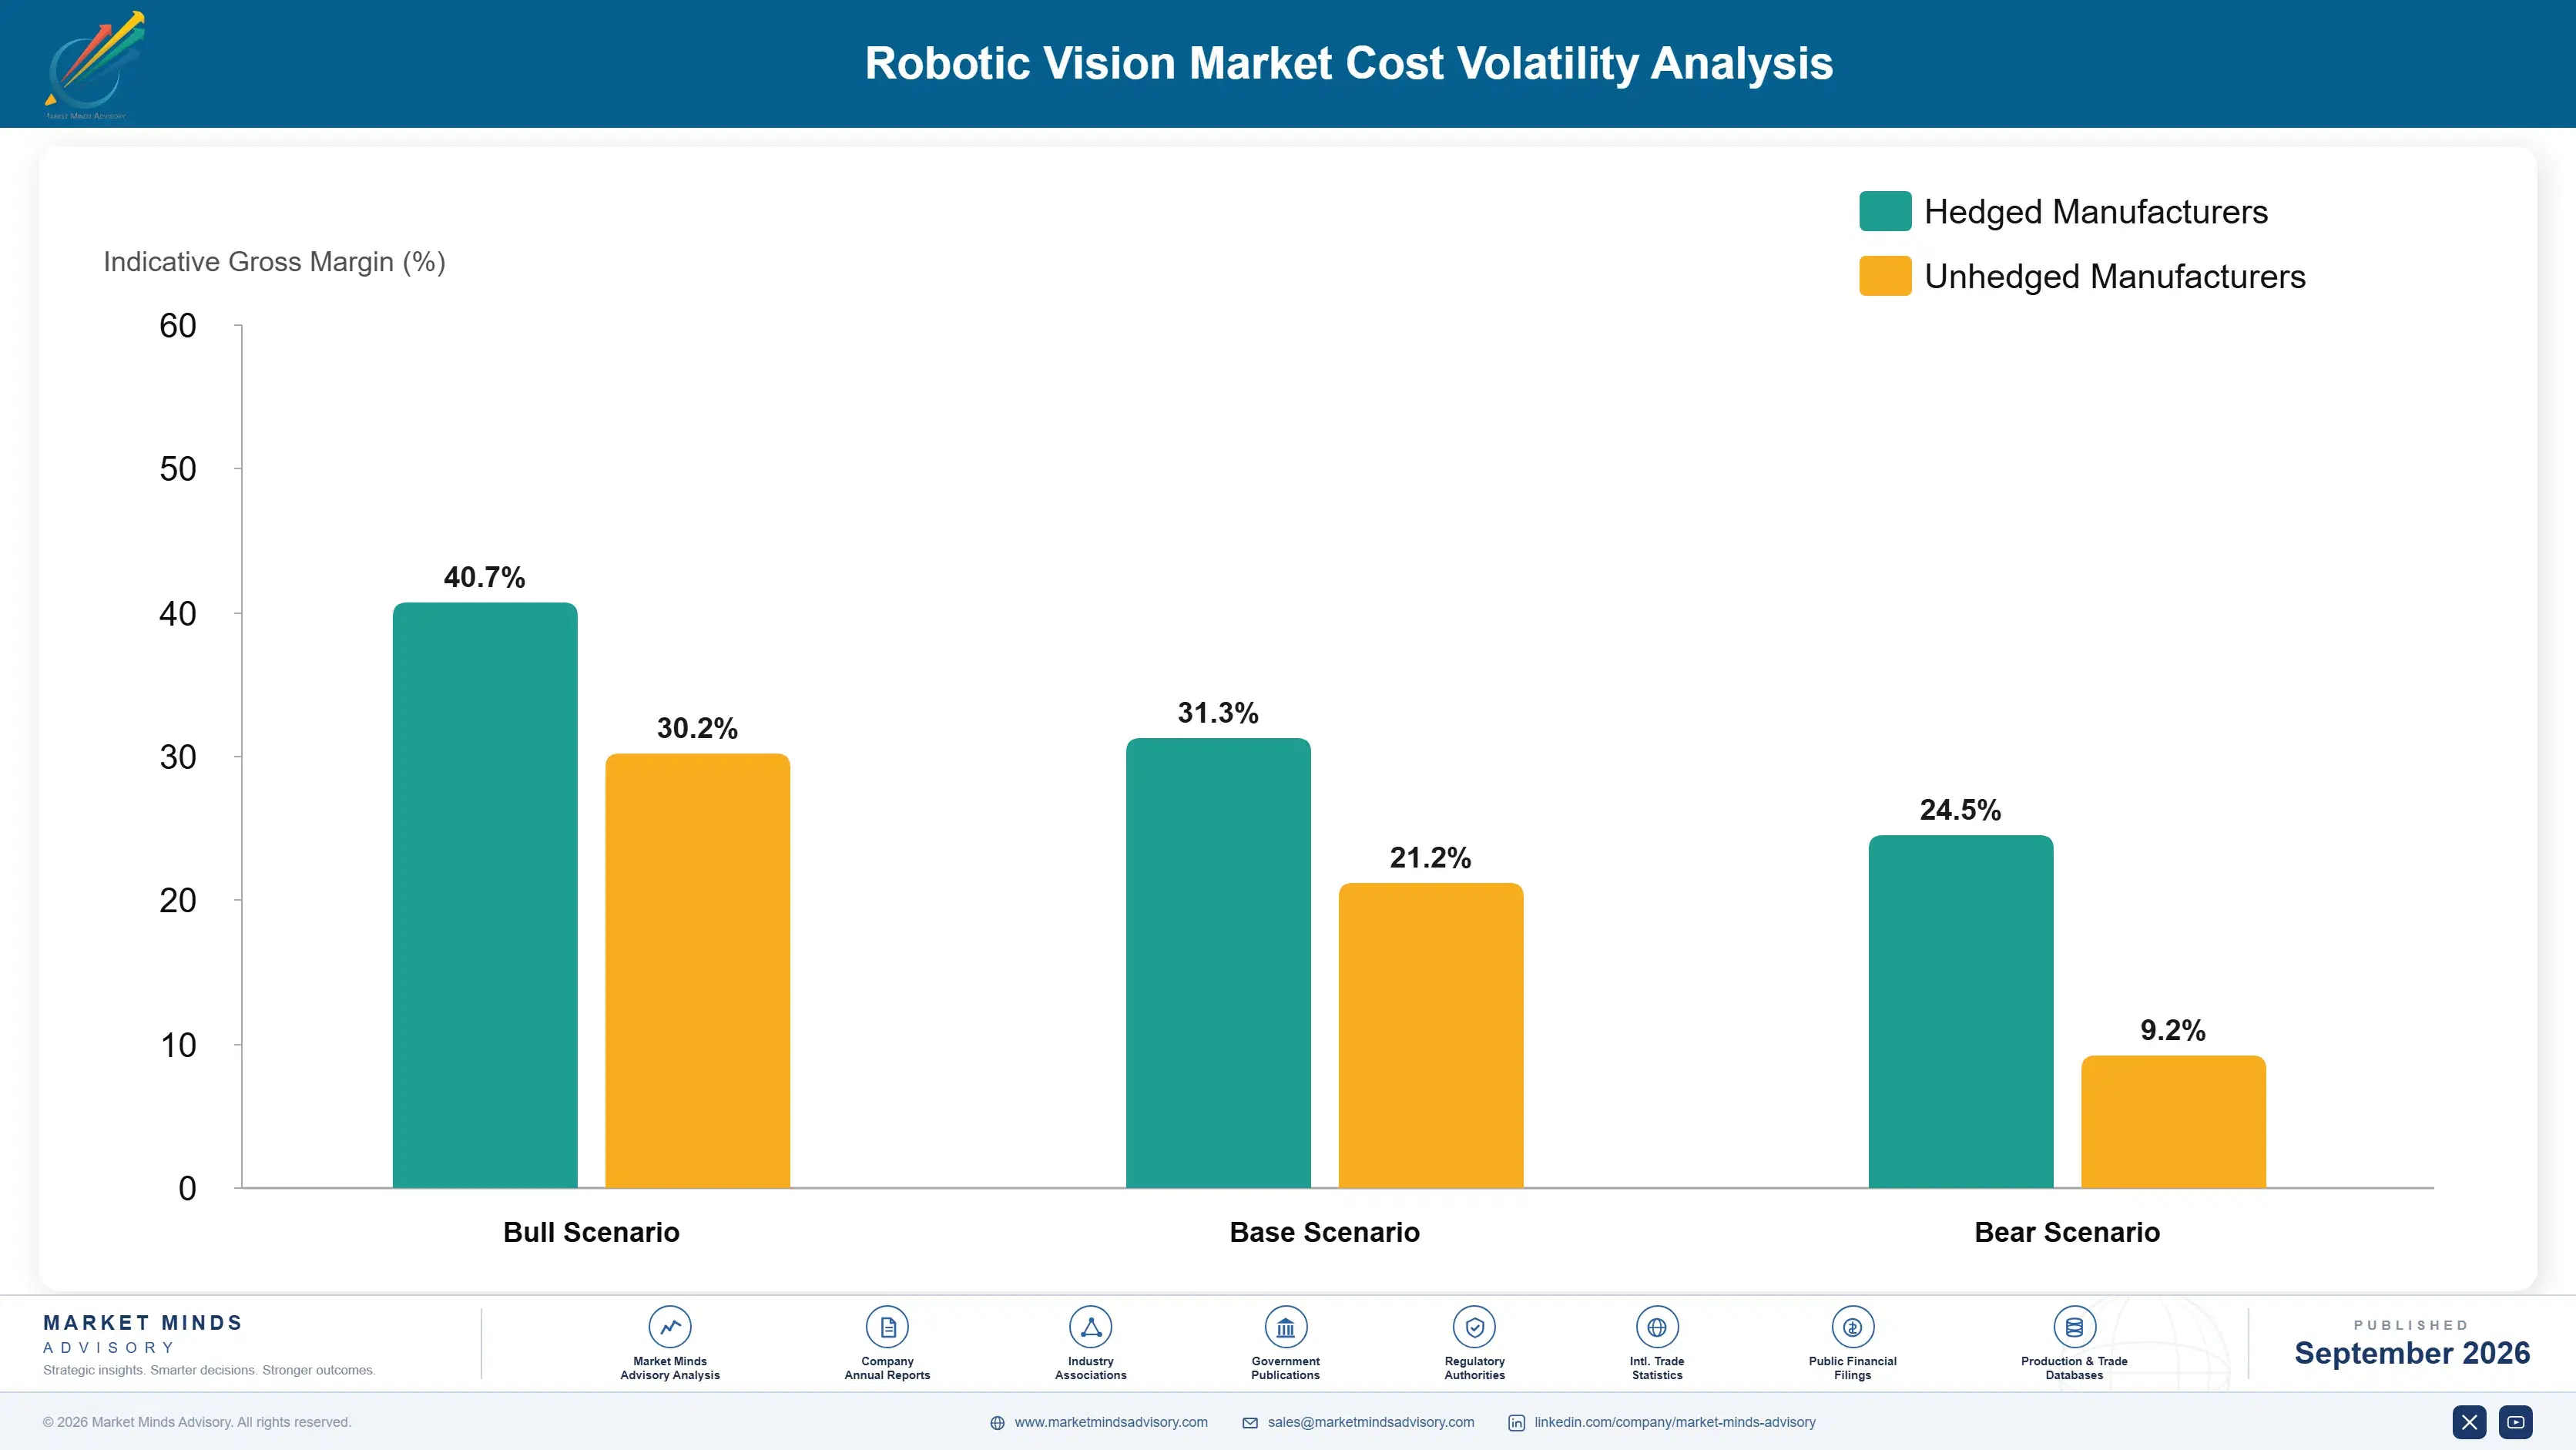
Imaging Sensor and Semiconductor Cost Exposure

Advanced imaging sensors and specialized processing chipsets together represent roughly 38% of vision system cost of goods sold, with sensor fabrication concentrated among a small number of specialized semiconductor manufacturers while processing chipsets depend on general-purpose foundry capacity shared across multiple competing industries worldwide. Rare specialized optical lens components add a further layer of geographic supply concentration.
Imaging sensor prices rose meaningfully through 2025 as robotic vision demand competed with automotive and consumer electronics camera production for the same constrained global sensor supply, according to disclosures in a major imaging sensor supplier's FY2025 Annual Report. Several vision vendors reported margin compression in quarterly filings tied directly to rising sensor input costs during that period of sustained industry-wide demand. on their newest 3D sensor product lines specifically.

Smaller regional vendors lacking long-term sensor supply agreements face a genuine competitive disadvantage against larger vendors like Keyence and Cognex, which can secure priority allocation through scale purchasing relationships with sensor manufacturers. This exposure varies by geography too, since vendors manufacturing in East Asia maintain closer supplier proximity than competitors based in other regions entirely. That gap continues widening steadily.
robotic-vision-market-cost-volatility-analysis-1789996361347

Long-Term Sensor Supply Purchase Agreements

Leading vendors are securing multi-year sensor purchase agreements directly with semiconductor manufacturers to guarantee priority allocation during periods of tight global supply. This approach has measurably reduced input cost variance for vendors with the purchasing scale to negotiate favorable long-term terms. Several vendors have extended these agreements to cover multiple years, locking in predictable input costs across successive product generations.

Dual-Source Sensor Supplier Diversification

Several vendors are qualifying sensors from multiple semiconductor suppliers to reduce dependence on any single source, insulating margins from volatility that smaller competitors lacking this leverage cannot access as easily given limited engineering resources. Several vendors now maintain active relationships with at least two major sensor suppliers to preserve negotiating leverage over time. That redundancy proved valuable during recent disruptions.

Vertical Integration Into Sensor Design

Some of the largest vendors are investing directly in proprietary sensor design capability to reduce dependence on external suppliers entirely, insulating themselves from price volatility that smaller competitors face. This investment requires substantial upfront capital commitment. Several vendors now source a meaningful share of their own sensor needs internally rather than relying entirely on third-party manufacturing.

Portfolio Architecture for Margin Defence

Vision system economics split sharply between 2D inspection hardware with margins in the mid-twenties percent range and AI-powered 3D bin-picking systems commanding margins well above forty-five percent given engineering complexity and constrained sensor supply. That gap continues widening as manufacturers pay premiums for flexible automation capability. Vendors unable to differentiate beyond standard inspection face persistently lower long-term returns.
The tension between standard and flexible capability runs through nearly every vendor's product roadmap right now, since manufacturers with stable production still need affordable 2D tools even as the fastest-growing revenue pool sits squarely in 3D bin-picking applications. Vendors that chase standard inspection volume exclusively risk ceding the higher-margin segment entirely to focused specialists. That risk compounds each year flexible automation demand continues accelerating.

High-value pools concentrate around application-specific accuracy, synthetic training data services, and multi-facility rollout programs, all of which carry meaningfully better margins than standard 2D inspection sales. Vendors positioning early in these pools are capturing outsized profitability relative to their unit volume, a pattern MMA expects to persist through the current flexible automation adoption cycle. Watch this dynamic closely over the coming several years.

Standard 2D machine vision systems for quality inspection sold largely on price and reliability, carrying margins in the mid-twenties percent range across most vendors. Renewal decisions here typically depend on price competition rather than accuracy differentiation.
Gross Margin

AI-powered 3D vision and bin-picking systems engineered for randomized part handling, commanding margins above forty-five percent given engineering complexity and constrained supply. Contract commitments here typically span multiple years of manufacturer relationship depth.
Gross Margin

Synthetic training data services and emerging foundation-model-based perception software carrying the highest margins but still limited adoption scale. Adoption is expanding steadily as vendors add new automation capability to their platforms.
Gross Margin
robotic-vision-market-portfolio-architecture-1789996361850

High-value Sub-segments and Strategic Watch-out

AI-Powered 3D Vision and Bin-Picking Systems

High-value, high-growth segment where demand consistently outpaces vendor sensor supply, commanding premium pricing and the fastest revenue growth of any category tracked in this report. Order backlogs continue extending well past six months for most leading vendors. Capacity remains the binding constraint on further growth.

Traditional 2D Machine Vision for Quality Inspection

Volume core segment generating steady, predictable revenue across nearly every manufacturer account, though growth trails 3D vision given a larger existing installed base. Price competition here remains intense across nearly every vendor segment. Diversification demand keeps growing steadily each quarter here. Margins there remain solid overall.

Synthetic Training Data Generation Services

High-value, moderate-growth segment benefiting from steady deployment acceleration demand, though growth trails hardware sales given a comparatively smaller current customer base. Vendors here increasingly bundle analytics to defend against slower relative growth. Consolidation among smaller vendors appears increasingly likely soon. Volume remains stable. Growth remains steady.

AI-Native Perception Software Startup Entrants

Strategic watch-out segment where foundation-model-based startups are absorbing design wins historically owned by traditional vendors, a shift that could reshape competitive rankings over time. Established vendors increasingly acquire these entrants for this exact reason. Watch this competitive dynamic closely over coming years. Rankings could shift meaningfully.

Vision as a Line-Level Annuity

Robotic vision relationships behave like annuities once a system is deployed on a production line, since part-specific training data and calibration settings become woven into the manufacturing process within months of installation. Switching vendors means retraining perception models and requalifying the entire production line, a cost that keeps renewal rates comfortably above eighty percent across the category even when competitors offer meaningfully lower hardware pricing.
Adoption depth varies considerably by end-use vertical. High-mix manufacturers handling varied part geometries show the deepest platform dependency, since their production flexibility depends directly on continuous, reliable bin-picking accuracy. Standardized production line operators adopt more gradually but at meaningful per-line value once inspection reliability proves out, where consistency matters more than raw feature novelty, giving vendors a long runway of incremental capability adoption over successive facility expansions.

Buyer profiles are shifting generationally as manufacturing engineers who once treated vision systems as simple presence detectors give way to a cohort trained specifically on AI-powered perception and grasp planning from early in their careers. That newer generation increasingly evaluates vision vendors more like strategic automation partners than commodity sensor suppliers, weighing perception software sophistication and sensor supply reliability alongside traditional cost criteria.
robotic-vision-market-end-use-penetration-index-1789996362338

Where MMA Sees the Advantage

These are among the four positions where our research anticipates prominent divergence between winners and laggards over the coming forecast period. Each is grounded in the demand model, the regulatory perimeter, and the announced capacity pipeline.
01 / APPLICATION ACCURACY INVESTMENT

Build application-specific bin-picking accuracy before rivals

Vendors that invest early in application-specific bin-picking accuracy hold a durable edge as manufacturers increasingly select platforms based on documented pick success rates for their specific part geometries and materials. This capability is genuinely difficult to build quickly, which is exactly why vendors without it are steadily losing design wins to more specialized competitors today. MMA expects this gap to widen considerably further before it narrows meaningfully, rewarding vendors willing to invest in accuracy now rather than waiting until much later still.
02 / SENSOR SUPPLY PACKAGING

Bundle guaranteed sensor allocation as a premium tier

Manufacturers facing extended standard lead times pay considerably more for vendors that guarantee sensor allocation than for vendors offering standard delivery alone, and that pricing gap is only growing wider with each passing quarter across the industry. That willingness to pay is not yet fully priced into most vendors' current pricing structures across the category today. Real margin is being left squarely on the table for any vendor willing to formalize this priority allocation into a distinct, clearly marketed tier.
03 / FACILITY ROLLOUT EXPANSION

Pursue multi-year contracts across manufacturer facilities

Manufacturers operating multiple facilities with varied part geometries represent the highest-value expansion opportunity in the entire category, since few competitors have built genuinely convincing multi-facility rollout consistency at truly meaningful scale today across every region they serve. This complexity is exactly why multi-year rollout contracts command considerably higher pricing than single-facility arrangements ever could achieve on their own. MMA sees this segment as considerably underserved relative to its genuine commercial value going forward, and expects competition to intensify quite markedly.
04 / AI-NATIVE ENTRANT RISK

Watch AI-native perception startups win flexible automation wins

AI-native perception software startups building foundation-model-based vision algorithms pose the clearest competitive threat to incumbents relying on traditional rule-based computer vision as a durable advantage over the coming several years ahead. Vendors that fail to modernize meaningfully beyond legacy perception architectures risk losing exactly the most demanding manufacturing accounts that fund their growth today and well into the future. MMA expects this competitive pressure to intensify rather than fade anytime soon across most major markets nationwide and abroad well into the future.

Engagement Snapshot From the Field

A live engagement with an industry participant carrying material or product regulatory and market exposure ahead of a defining policy shift, showing how our research translates into a defensible multi-year portfolio strategy.
MARKET MINDS ADVISORY · CLIENT ENGAGEMENT SUMMARY
Robotic Vision Producer Strategic Portfolio Review and Transition Roadmap 2026·Investment Scenario on Robotic Vision Exposure Evaluation 2025-26
CLIENT PROFILE
The client is a mid-sized automotive parts manufacturer producing precision-machined components across three facilities, facing chronic difficulty hiring workers for manual bin-sorting tasks that fed randomly oriented parts into downstream assembly lines. Approaching a planned facility expansion, leadership sought an independent assessment of which robotic vision platform could most reliably automate part sorting across its varied product catalog spanning dozens of distinct part geometries.
STRATEGIC CHALLENGE
The client's engineering team had piloted two vision system vendors without a clear framework for comparing actual bin-picking success rates across its specific mix of small, irregularly shaped machined parts. Internal stakeholders disagreed on whether to standardize on a single vendor across all three facilities or select different vendors optimized for each facility's specific part mix.
MMA APPROACH
MMA benchmarked three vision system vendors against the client's specific part geometries, running controlled bin-picking accuracy tests using the client's actual production parts across varied lighting and bin fill conditions encountered daily. The engagement combined vendor technical assessments, production engineer interviews, and a total cost of ownership comparison across standardization approaches.
KEY FINDINGS
  1. The leading vendor's system achieved a ninety-four percent bin-picking success rate across the client's most challenging part geometries, meaningfully exceeding the client's prior pilot results with a different vendor.
  2. Standardizing on a single vendor across all three facilities reduced total implementation and training cost considerably relative to running different vendors optimized per facility.
  3. One evaluated vendor showed a measurable accuracy gap on the client's smallest, most reflective machined parts, a limitation not disclosed in the vendor's initial technical presentation.
  4. A phased rollout starting with the facility experiencing the most severe labor shortage delivered the fastest return on investment relative to a simultaneous three-facility deployment.
CLIENT PROFILE
The client is a mid-sized automotive parts manufacturer producing precision-machined components across three facilities, facing chronic difficulty hiring workers for manual bin-sorting tasks that fed randomly oriented parts into downstream assembly lines. Approaching a planned facility expansion, leadership sought an independent assessment of which robotic vision platform could most reliably automate part sorting across its varied product catalog spanning dozens of distinct part geometries.
STRATEGIC CHALLENGE
The client's engineering team had piloted two vision system vendors without a clear framework for comparing actual bin-picking success rates across its specific mix of small, irregularly shaped machined parts. Internal stakeholders disagreed on whether to standardize on a single vendor across all three facilities or select different vendors optimized for each facility's specific part mix.
MMA APPROACH
MMA benchmarked three vision system vendors against the client's specific part geometries, running controlled bin-picking accuracy tests using the client's actual production parts across varied lighting and bin fill conditions encountered daily. The engagement combined vendor technical assessments, production engineer interviews, and a total cost of ownership comparison across standardization approaches.
KEY FINDINGS
  1. The leading vendor's system achieved a ninety-four percent bin-picking success rate across the client's most challenging part geometries, meaningfully exceeding the client's prior pilot results with a different vendor.
  2. Standardizing on a single vendor across all three facilities reduced total implementation and training cost considerably relative to running different vendors optimized per facility.
  3. One evaluated vendor showed a measurable accuracy gap on the client's smallest, most reflective machined parts, a limitation not disclosed in the vendor's initial technical presentation.
  4. A phased rollout starting with the facility experiencing the most severe labor shortage delivered the fastest return on investment relative to a simultaneous three-facility deployment.
RECOMMENDED STRATEGY
Phase 1: Phase one deploys the recommended vendor's system at the facility experiencing the most severe labor shortage to validate accuracy under full production conditions. Phase 2: Phase two extends deployment to the remaining two facilities over the following nine months using validated configuration settings from phase one. Phase 3: Phase three standardizes maintenance and training programs across all three facilities under a single vendor relationship. to simplify long-term vendor management and support.
OUTCOME
The client approved a three-facility deployment budget of approximately $4.5 million (client-reported, unverified by MMA), starting with the highest-priority facility. Internal reporting credited the standardized accuracy testing with avoiding a costly vendor mismatch, and the first facility deployment began on schedule ahead of the planned expansion.

Frequently Asked Questions

Foundational context covering the market sizes, CAGR, scope, country, region and competition that inform every finding below. This section is provided to cover basics and most often pre-purchase conversations, answered from the MMA Primary Research Dataset.

What is the current size of the Robotic Vision Market?

The Robotic Vision Market was valued at approximately $5.8 billion in 2025. That figure covers camera hardware and AI software enabling robots to perceive and respond to their environment.

How large will the Robotic Vision Market be by 2036?

MMA projects the market will reach approximately $28.03 billion by 2036. Growth is driven primarily by manufacturing labor shortages and AI-powered bin-picking adoption worldwide today.

What is the CAGR for the Robotic Vision Market 2026 to 2036?

The market is forecast to grow at a 15.4% compound annual rate between 2026 and 2036. Bull and bear scenarios range from 16.7% down to 14.1% depending on sensor supply pace.

Which segment is growing fastest?

AI-Powered 3D Vision and Bin-Picking Systems is the fastest-growing segment, expanding at roughly 23.9% annually, about 1.55 times the overall market rate. Randomized part handling demand is the primary driver.

Who are the major companies in the Robotic Vision Market?

Keyence, Cognex, Basler, OMRON, and Zebra Technologies lead the category on disclosed unit shipment estimates. Combined, the top five hold roughly 50% of the market.

Which country is growing fastest?

India is the fastest-growing country at approximately 22.0% annually, ahead of the broader South Asia and Pacific region. Rapidly expanding manufacturing investment is the primary factor behind that pace.

Report Segmentation Architecture

The full report scope spans multiple orthogonal segmentation dimensions, with cross-tabulated demand data provided for each dimension pair. Coverage extends further to regional breakdowns, trend trajectories, and the competitive detail needed to support segment-level decision-making.

By Perception Technology Type

  • AI-Powered 3D Vision and Bin-Picking
  • Traditional 2D Machine Vision
  • Depth-Sensing Camera Hardware
  • Perception Software and Algorithms
  • Synthetic Training Data Services

By End-Use Industry

  • Automotive Manufacturing
  • Electronics Assembly
  • Logistics and E-Commerce Fulfillment
  • Food and Beverage Processing

By Commercial Dimension

  • Direct Hardware and Software Sales
  • Multi-Facility Rollout Agreements
  • Training Data Subscription Services
  • Systems Integrator Channels

By Region

  • East Asia
  • North America
  • Western Europe
  • South Asia and Pacific
  • Latin America
  • Middle East and Africa
  • Eastern Europe

Scope, Methodology, and Coverage

Every figure in this report is reproducible from documented input assumptions. The scope below maps the historical period, the forecast horizon, the segmentation dimensions, and the countries covered, alongside the underlying primary and qualitative methodology.
Historical Period
2020 to 2025
Forecast Period
2026 to 2036
Base Year
2025 (USD billions; MMA Primary Research Dataset, September 2026)
Market Definition
This report defines the Robotic Vision Market as camera hardware and AI-powered software that enable robots to perceive, interpret, and respond to their physical environment, including 2D and 3D machine vision systems, bin-picking software, and quality inspection platforms. It excludes general industrial cameras without robotic guidance integration, standard barcode scanning systems, and autonomous vehicle perception systems.
Quantitative Units
USD Billion, CAGR (%), Unit Shipments
Segmentation Dimensions
Perception Technology Type, End-Use Industry, Commercial Dimension, Region
Regions Covered
East Asia, North America, Western Europe, South Asia and Pacific, Latin America, Middle East and Africa, Eastern Europe
Countries Covered
Japan, United States, China, Germany, South Korea, India, Brazil, and 13 additional countries
Key Companies Profiled
Keyence, Cognex, Basler, OMRON, Zebra Technologies, and 15 additional companies
Quantitative Methodology
Primary survey, n=3,800 respondents, Q4 2025, six countries; demand-side model with trade association cross-validation
Qualitative Methodology
47 expert interviews, Q4 2025; applied to validate demand model assumptions, identify emerging dynamics, and assess competitive positioning
Report Format
PDF and XLSX data workbook (Word format preview document)
Publisher
Market Minds Advisory
Report Code
MMA-2026-TEC-260
Published
September 2026
Contact
sales@marketmindsadvisory.com | www.marketmindsadvisory.com

Purchase the full Robotic Vision Market Report (2026 to 2036).

The full Robotic Vision Market report delivers a complete analysis of segment-level growth, regional demand patterns, and competitive positioning across all major vision system vendors worldwide. It includes detailed profiles of the twenty leading companies, quantified trend and driver analysis, and a full regional breakdown across all seven world regions with country-level detail where relevant. Buyers receive input cost exposure modeling and portfolio margin benchmarking that go well beyond what the executive summary alone can provide. The report also includes a proprietary MMA revenue-lever framework identifying where vendors can capture incremental margin.
Full seven-region demand and pricing breakdown
Twenty-company competitive profiles and moat analysis
Segment-level CAGR and market share detail
Input cost exposure and mitigation strategy analysis
Portfolio margin tiering across product categories
Primary survey and expert interview data tables

Built For The People Who Decide

From boardroom strategy to bench-side execution, this report is read cover-to-cover by leaders shaping the next decade of their industry, turning demand scenarios, market dynamics and valuation benchmarks into decisions.
CXOs/ Presidents/ VPs/ Managers
M&A and Corporate Development
Strategy Teams and R&D Heads
Procurement and Product Directors
Regulatory and Compliance Leaders
Investor Relations and Equity Analysts