Market Minds Advisory
Robotaxi Market

Robotaxi Market: Robotaxi Market: Vehicle Supply, Utilisation Economics and Why Removing the Driver Saves Less Than Expected

The driving problem is largely solved inside defined operating areas, and the constraints that remain are vehicle supply, depot operations and a utilisation rate that decides whether any of it makes money.

Lead Analyst

Published

September 2026

Make Smarter Decisions with Customized Research Insights

Request a free sample report and evaluate market opportunities, growth trends, and competitive dynamics relevant to your business needs.

2025 MARKET VALUE$1.1BMarket Size 2025
2036 FORECAST VALUE$6.7BBase Case , 2026 to 2036
CAGR 2026 TO 203617.8 %Bull 19.0% / Bear 16.4%
INCREMENTAL OPPORTUNITY$5.4BNet 10- year value creation
EXPANSION MULTIPLE5.15x2036 value over 2026 base
Strategic Levers
M&A Pipeline
Regional Outlook
Country Rankings
Competitive Intelligence
Segmental Deep-dive
Call-Us : 91 93563 13602

Executive Snapshot and Market Trajectory.

Removing the driver takes out roughly 60% of ride-hail operating cost and puts back remote assistance, depot labour, cleaning, insurance and depreciation on a vehicle costing around USD 78,000. The net saving is real and considerably smaller than the headline implies. Investors funded the first number. Nobody funded the second.
What decides profitability is utilisation, currently near 38% of available vehicle hours, and vehicle supply rather than software capability. Partnering with existing ride-hail platforms grows fastest at 26.7%, half again the market rate of 17.8%, because demand aggregation is the one thing an autonomous operator cannot build quickly. East Asia takes 44% of value on the largest deployed fleets and the fastest city permitting anywhere.
Concentration is high at roughly 74% across the top five on measured value chain revenue, and it reflects capital requirements rather than technology gaps. Each new city needs around 17 months of mapping, validation, approval and depot preparation before a single paid ride. This is an operations and property business that happens to involve autonomy. Depot throughput and demand density decide this, not perception systems. Each new city needs 17 months of preparation first.
Market Definition
This market covers commercial autonomous passenger transport operated without a safety driver, measured across the value chain, spanning owned fleet direct operation, ride-hail platform partnered operation, technology licensing to fleet operators, purpose-built vehicle supply, depot, charging and fleet operations services, and remote assistance and safety operations. Revenue is measured as fares, vehicle supply value, licensing fees and attributable operations services. Driver-supervised testing, personally owned vehicles with driver assistance, autonomous trucking and freight, and low-speed campus shuttles operating below regular traffic speeds are excluded.
Base Year Value
$1.1B in 2025 (MMA Primary Research Dataset, September 2026)
Forecast Period
2026 to 2036, eleven discrete annual values
CAGR
17.8% base case. Bull 19.0%. Bear 16.4%.
Fastest Growth Segment
Ride-Hail Platform Partnered Operation: 26.7% CAGR
Fastest Growth Country
United Arab Emirates: 24.8% CAGR
Fastest Growth Region
South Asia and Pacific: 20.2% CAGR
Largest Region
East Asia: 44% of 2025 global value
Market Leaders
Waymo, Baidu, Pony.ai, WeRide and Zoox lead on measured robotaxi value chain revenue. Source: MMA Primary Research Dataset, July 2026.
Primary Survey
n=3,800 procurement and R&D decision-makers, Q4 2025, six countries
Methodology
Demand-side build-up, cross-validated against public data, 47 expert interviews

Robotaxi Market Forecast Scenarios

robotaxi-market-size-forecast-scenario-1788421809987
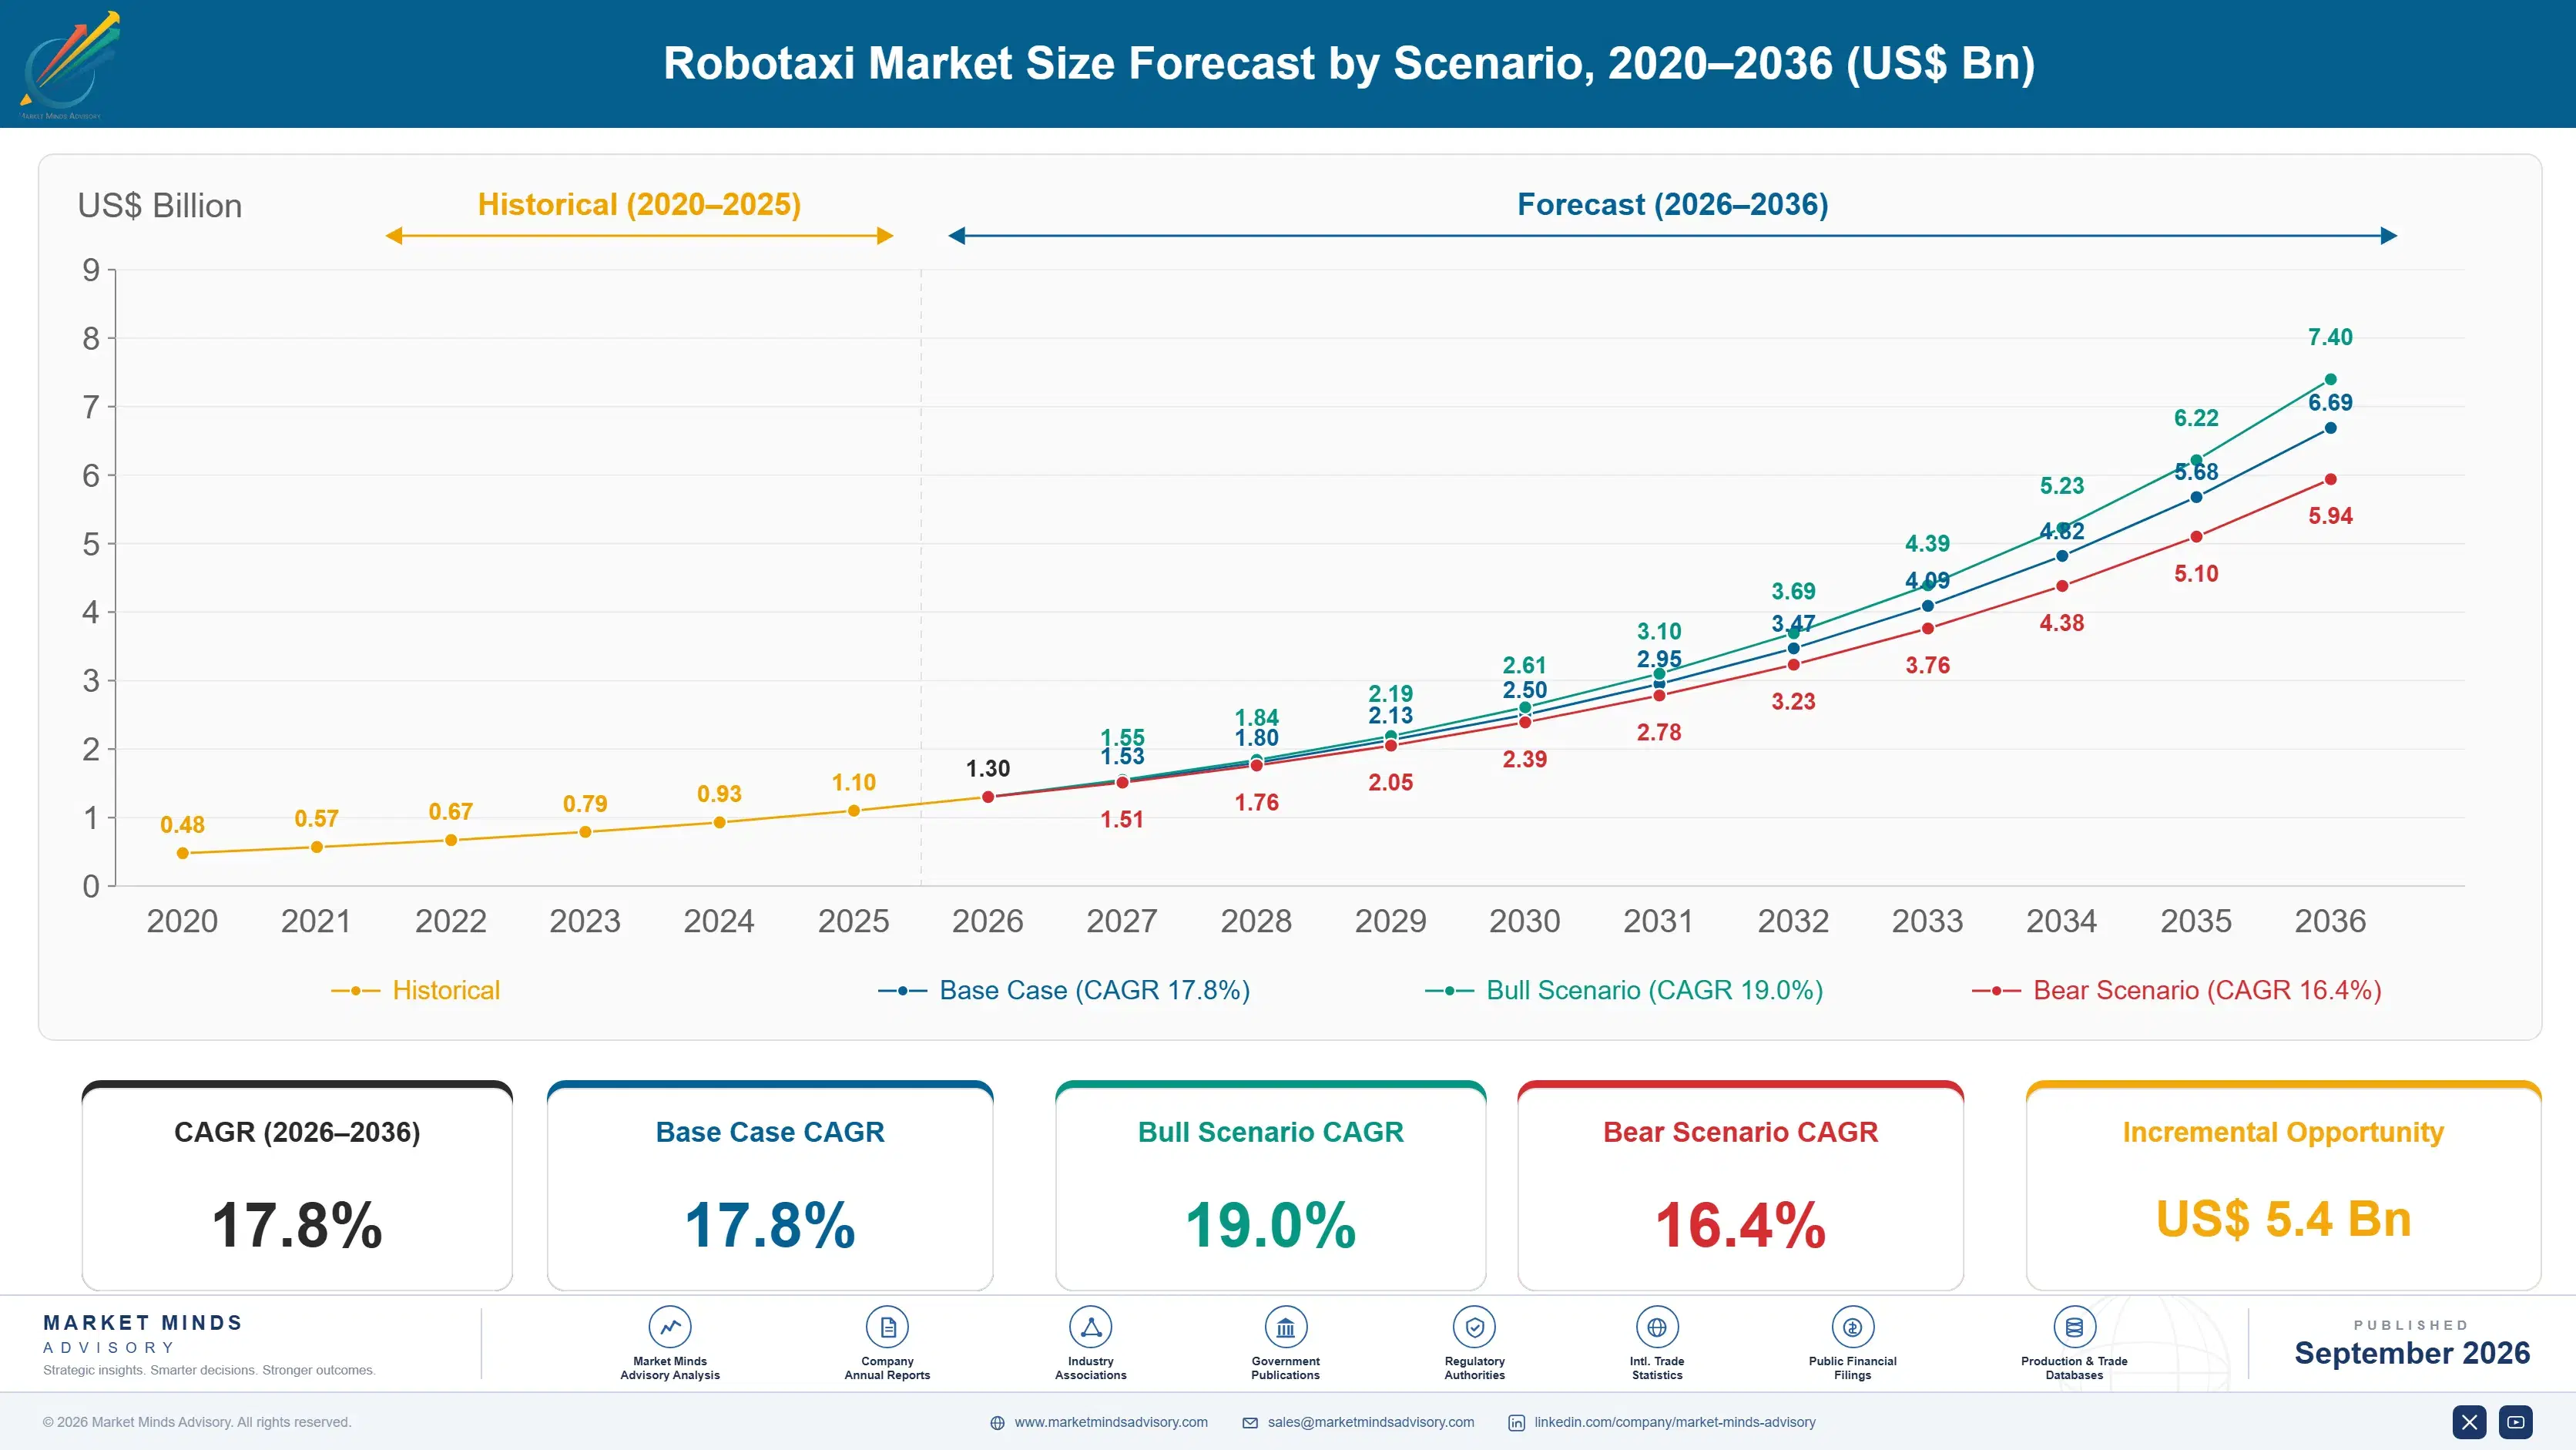
The 2020 to 2025 period grew at 16.6% and the trajectory was interrupted rather than smooth. Several well-funded programmes closed after incidents or capital exhaustion, while others reached genuine driverless commercial operation. The technical question shifted from whether vehicles could drive unsupervised to whether the operation around them could be run at a cost that fares would cover, and most of the industry answered the second question late indeed.
The base case at 17.8% is constrained by supply and launch cadence rather than by demand. Purpose-built vehicle availability limits fleet growth more than capital does, and trade measures have complicated sourcing outside China. Each new city requires roughly 17 months of mapping, validation, regulatory approval and depot preparation before commercial service begins. Third, utilisation near 38% means adding vehicles does not improve economics unless demand density improves alongside. Demand is not the constraint.
The bull case at 19.0% assumes purpose-built vehicle production reaches volume and unit cost falls sharply, which would allow fleet expansion at the pace demand already supports. The bear case at 16.4% is a serious safety incident in a major market triggering suspension of permits, which has happened before and set the industry back by years.

The Driving Was Never the Hard Part Commercially

The arithmetic that attracted capital here was simple and incomplete. A driver represents roughly 60% of ride-hail operating cost, so removing one appeared to transform the economics. What replaced the driver is a remote assistance team supervising a dozen vehicles each, depot staff who clean, charge and inspect, a vehicle costing near USD 78,000 rather than the driver's own, and an insurance position nobody has priced comfortably.
TOP FIVE CONCENTRATION74%Highly concentrated among a few well-funded operating fleets
DRIVER COST REMOVED60%Share of ride-hail operating cost the driver previously represented
REMOTE ASSISTANCE RATIO1 to 12Operators supervising vehicles remotely across an active fleet
FLEET UTILISATION RATE38%Portion of available vehicle hours actually carrying passengers
CITY LAUNCH LEAD TIME17 monthsPreparation before commercial service opens in a new city
PURPOSE-BUILT VEHICLE COSTUSD 78,000Unit cost of a production autonomous passenger vehicle
Utilisation is what decides whether any of it works. Fleets currently carry passengers for about 38% of available vehicle hours, below what a human driver achieves, since drivers position toward demand instinctively and go home when it disappears. An autonomous fleet must be dispatched, repositioned and parked, and every idle hour is depreciation. Utilisation matters more to profitability than any further driving capability.
Expansion is slow for reasons that have nothing to do with software. A new city requires mapping, validation against local conditions, regulatory approval, depot property, charging infrastructure and local remote operations, which together take around 17 months before any paid ride. That makes this a property and operations business with an autonomy component, which is why the field is concentrated among participants who can fund years of preparation.
"The industry spent a decade solving the driving and is now discovering it built a fleet operations company. The people who will win this are the ones who understand depot throughput and demand density, not the ones with the most impressive perception stack."
Director, Autonomous Mobility and Fleet Operations Practice · MMA Automotive Practice · September 2026

Market Trends

Operators Partner With Ride-Hail Platforms Rather Than Compete

Building consumer demand from nothing is expensive and slow, and autonomous operators discovered that the aggregation existing ride-hail platforms already hold is worth more than the customer relationship they were trying to own. Partnering places autonomous vehicles inside apps people already use, fills them faster and improves utilisation from a low base. It grows at 26.7%, faster than any other model here. The trade-off is surrendering pricing and customer data to a platform that also works with competitors, which several operators resisted for years before the utilisation arithmetic settled the argument.
Market Impact: East Asia holds 44% of value
Purpose-Built Vehicle Supply Becomes the Binding Constraint

Fleet growth is limited by how many purpose-built vehicles can be produced and delivered rather than by capital, demand or driving capability. Retrofitting conventional vehicles was always a transitional approach, and purpose-built platforms with redundant systems and no driver controls cost around USD 78,000 at current volumes. Trade measures have complicated sourcing for operators outside China substantially, since the most cost-effective platforms are produced there. Operators without a secured vehicle supply arrangement are constrained regardless of how much capital they hold or how well their systems perform. Capital does not resolve a manufacturing constraint.
Market Impact: Utilisation currently near 38%

Market Opportunities and Growth Drivers

Permissive City Permitting Determines Where Fleets Actually Grow

Autonomous operation requires explicit municipal and state permission in most jurisdictions, and the pace at which those permissions are granted has separated markets more decisively than any technical difference. Chinese cities have issued driverless commercial permits across many municipalities on timescales measured in months, while European approval processes have produced almost no commercial operation at all. East Asia holds 44% of market value largely as a result. Operators concentrate expansion where permitting is predictable, which reinforces the regional divergence rather than correcting it over time. Divergence between markets is widening rather than closing.
Market Impact: Utilisation sits near 38%

Ride-Hail Platform Integration Lifts Utilisation From a Low Base

Vehicles carry passengers for roughly 38% of available hours, and every idle hour is depreciation on an asset costing around USD 78,000. Placing autonomous vehicles inside established ride-hail applications reaches demand that an operator's own app cannot generate, particularly outside the small population of early adopters who sought the service deliberately. Utilisation improvements flow directly to profitability because the cost base is largely fixed. That is why platform partnership has become the fastest growing operating model rather than a strategic concession. Fixed cost bases make every utilisation point unusually valuable here.
Market Impact: Set the industry back 2 years

Market Restraints and Challenges

Utilisation Below Human Driver Levels Undermines the Cost Case

Fleets carry passengers around 38% of available hours against considerably higher figures for human drivers, who position themselves toward demand instinctively and stop working when it disappears. The root cause is that an autonomous fleet is a fixed asset requiring dispatch, repositioning and parking, while a driver is a variable cost that manages itself. Commercially this means adding vehicles worsens economics unless demand density rises alongside. Mitigation runs through platform partnership, dynamic repositioning and concentrating service in dense areas rather than expanding coverage. Dense concentrated service beats wide thin coverage every time.
Market Impact: Fastest model at 26.7% growth

One Serious Incident Can Suspend an Entire Market

Regulatory permission is discretionary and revocable, and a single serious incident has previously ended a well-funded operator's programme and slowed permitting across an entire country. The root cause is that public tolerance for autonomous vehicle harm is far lower than for human error, which is not a rational position but is an entirely real one. Commercially this makes every operator exposed to a competitor's failure. Mitigation runs through conservative operational design domains, transparent incident reporting and regulatory engagement well ahead of any expansion. Every operator is exposed to a competitor's failure as much as to their own.
Market Impact: Vehicles cost USD 78,000 each
3 additional market trends, 4 additional growth drivers, and 2 additional restraints and challenges are covered in the full report. Contact sales@marketmindsadvisory.com to access the complete intelligence.

Segment CAGR and Growth Architecture

Segmentation follows position in the value chain, because participants earn from quite different activities even where they appear to be in the same business. Operating fleets, supplying vehicles, licensing technology and running depots carry different capital requirements and different margins, and very few organisations do more than two of them well. Capital intensity differs enormously.
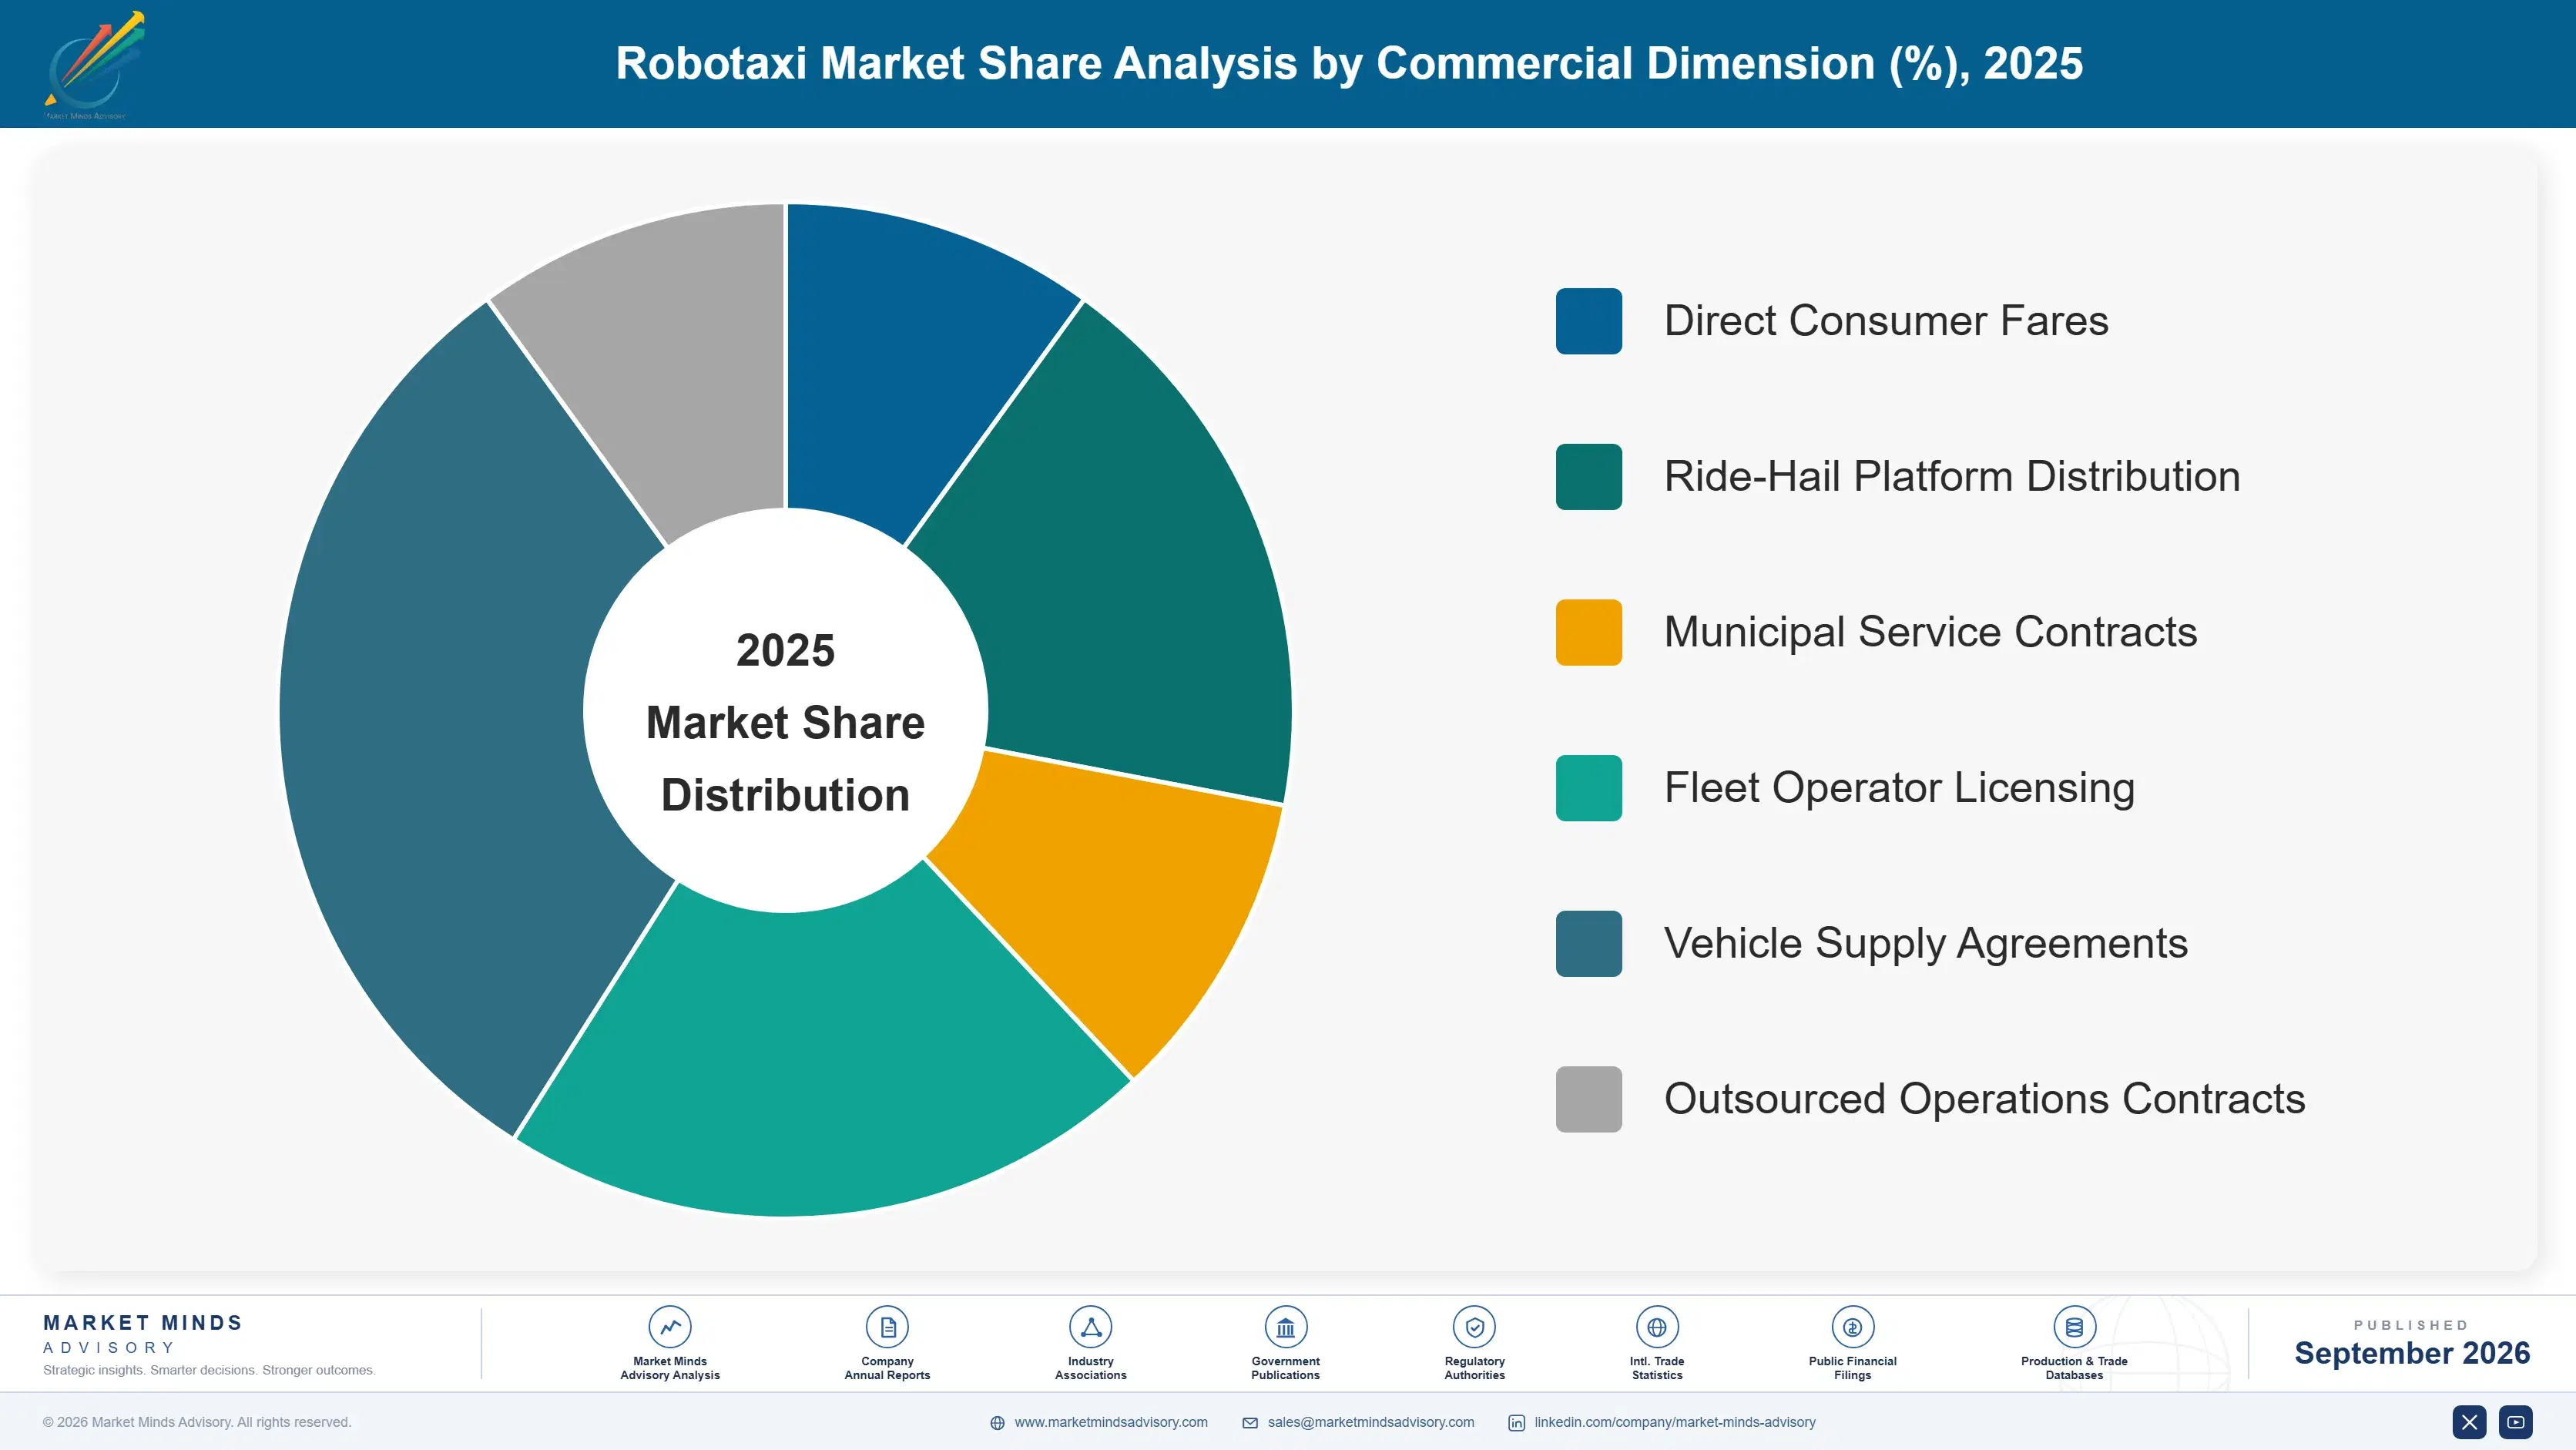
robotaxi-market-market-share-analysis-1788421810525

Ride-Hail Platform Partnered Operation

Partnered operation is the fastest growing model at 26.7%, half again the market rate of 17.8%, and it exists because demand aggregation turned out to be harder to build than autonomy. Placing vehicles inside applications that already hold millions of riders fills them considerably faster than an operator's own app can, and utilisation improvements flow straight to profitability given how fixed the cost base is. The trade-off is real: the platform sets pricing, owns the customer relationship and works with competing operators simultaneously. Several operators resisted this for years on principle and conceded once the utilisation arithmetic became impossible to argue with. Utilisation arithmetic eventually settles this argument for everybody.
CAGR 26.7%

Depot, Charging and Fleet Operations Services

Depot operations cover cleaning, charging, inspection, minor maintenance and vehicle staging, and they grow at 24.6% because every vehicle needs them regardless of who owns it or which technology it runs. This is the part of the business the industry least expected to matter and now spends the most operational attention on, since depot throughput directly limits how many vehicles can be in service. Property near dense demand areas is expensive and scarce, and charging capacity requires grid connections with long lead times. Specialist operators are emerging to run depots for multiple fleets, which is a genuinely different business from developing autonomy. Depot property near dense demand is scarce, expensive and increasingly what operators compete for.
CAGR 24.6%
Full segment breakdown across 6 segments available in the complete report.

Regional Architecture and Country Demand Map

Deployment follows regulatory permission and vehicle supply rather than population or wealth. Cities that grant driverless commercial permits quickly attract fleets, and those with lengthy approval processes have almost no commercial operation regardless of how large their transport markets are. Permission decides deployment almost entirely.

East Asia

East Asia holds 44%, well above the regional band, on two mechanisms that reinforce each other. Chinese municipalities have granted driverless commercial permits across many cities on timescales measured in months rather than years, which allowed operators to scale fleets while others were still negotiating. Purpose-built vehicles are also produced there at unit costs well below what operators elsewhere can source, which compounds the fleet size advantage directly. Several operators run thousands of vehicles across multiple cities. Japanese and Korean deployment is far more cautious, concentrated in limited operational areas with heavy regulatory oversight and modest fleet counts. Regional growth at 19.0% therefore reflects permitting speed and vehicle cost together rather than any technical advantage.
Share: 44% | CAGR: 19.0% (2026 to 2036)

North America

American deployment is concentrated in a small number of cities with favourable weather, clear road markings and state regulatory frameworks that permit driverless commercial operation. Fleet growth has been limited by purpose-built vehicle supply rather than by capital or demand, and trade measures affecting vehicle sourcing have made that constraint sharper. Utilisation is better here than in most markets because deployment concentrated in dense urban areas rather than spreading thinly. Regulatory permission is discretionary at state and municipal level, which means a single incident can suspend operation across an entire market without warning. Regional growth at 17.0% is constrained by vehicle supply rather than by demand, which is an unusual position for any early-stage market to occupy.
Share: 32% | CAGR: 17.0% (2026 to 2036)
Regional intelligence for 5 additional markets available in the complete report: Western Europe, South Asia and Pacific, Middle East and Africa, Latin America, Eastern Europe. Contact sales@marketmindsadvisory.com.
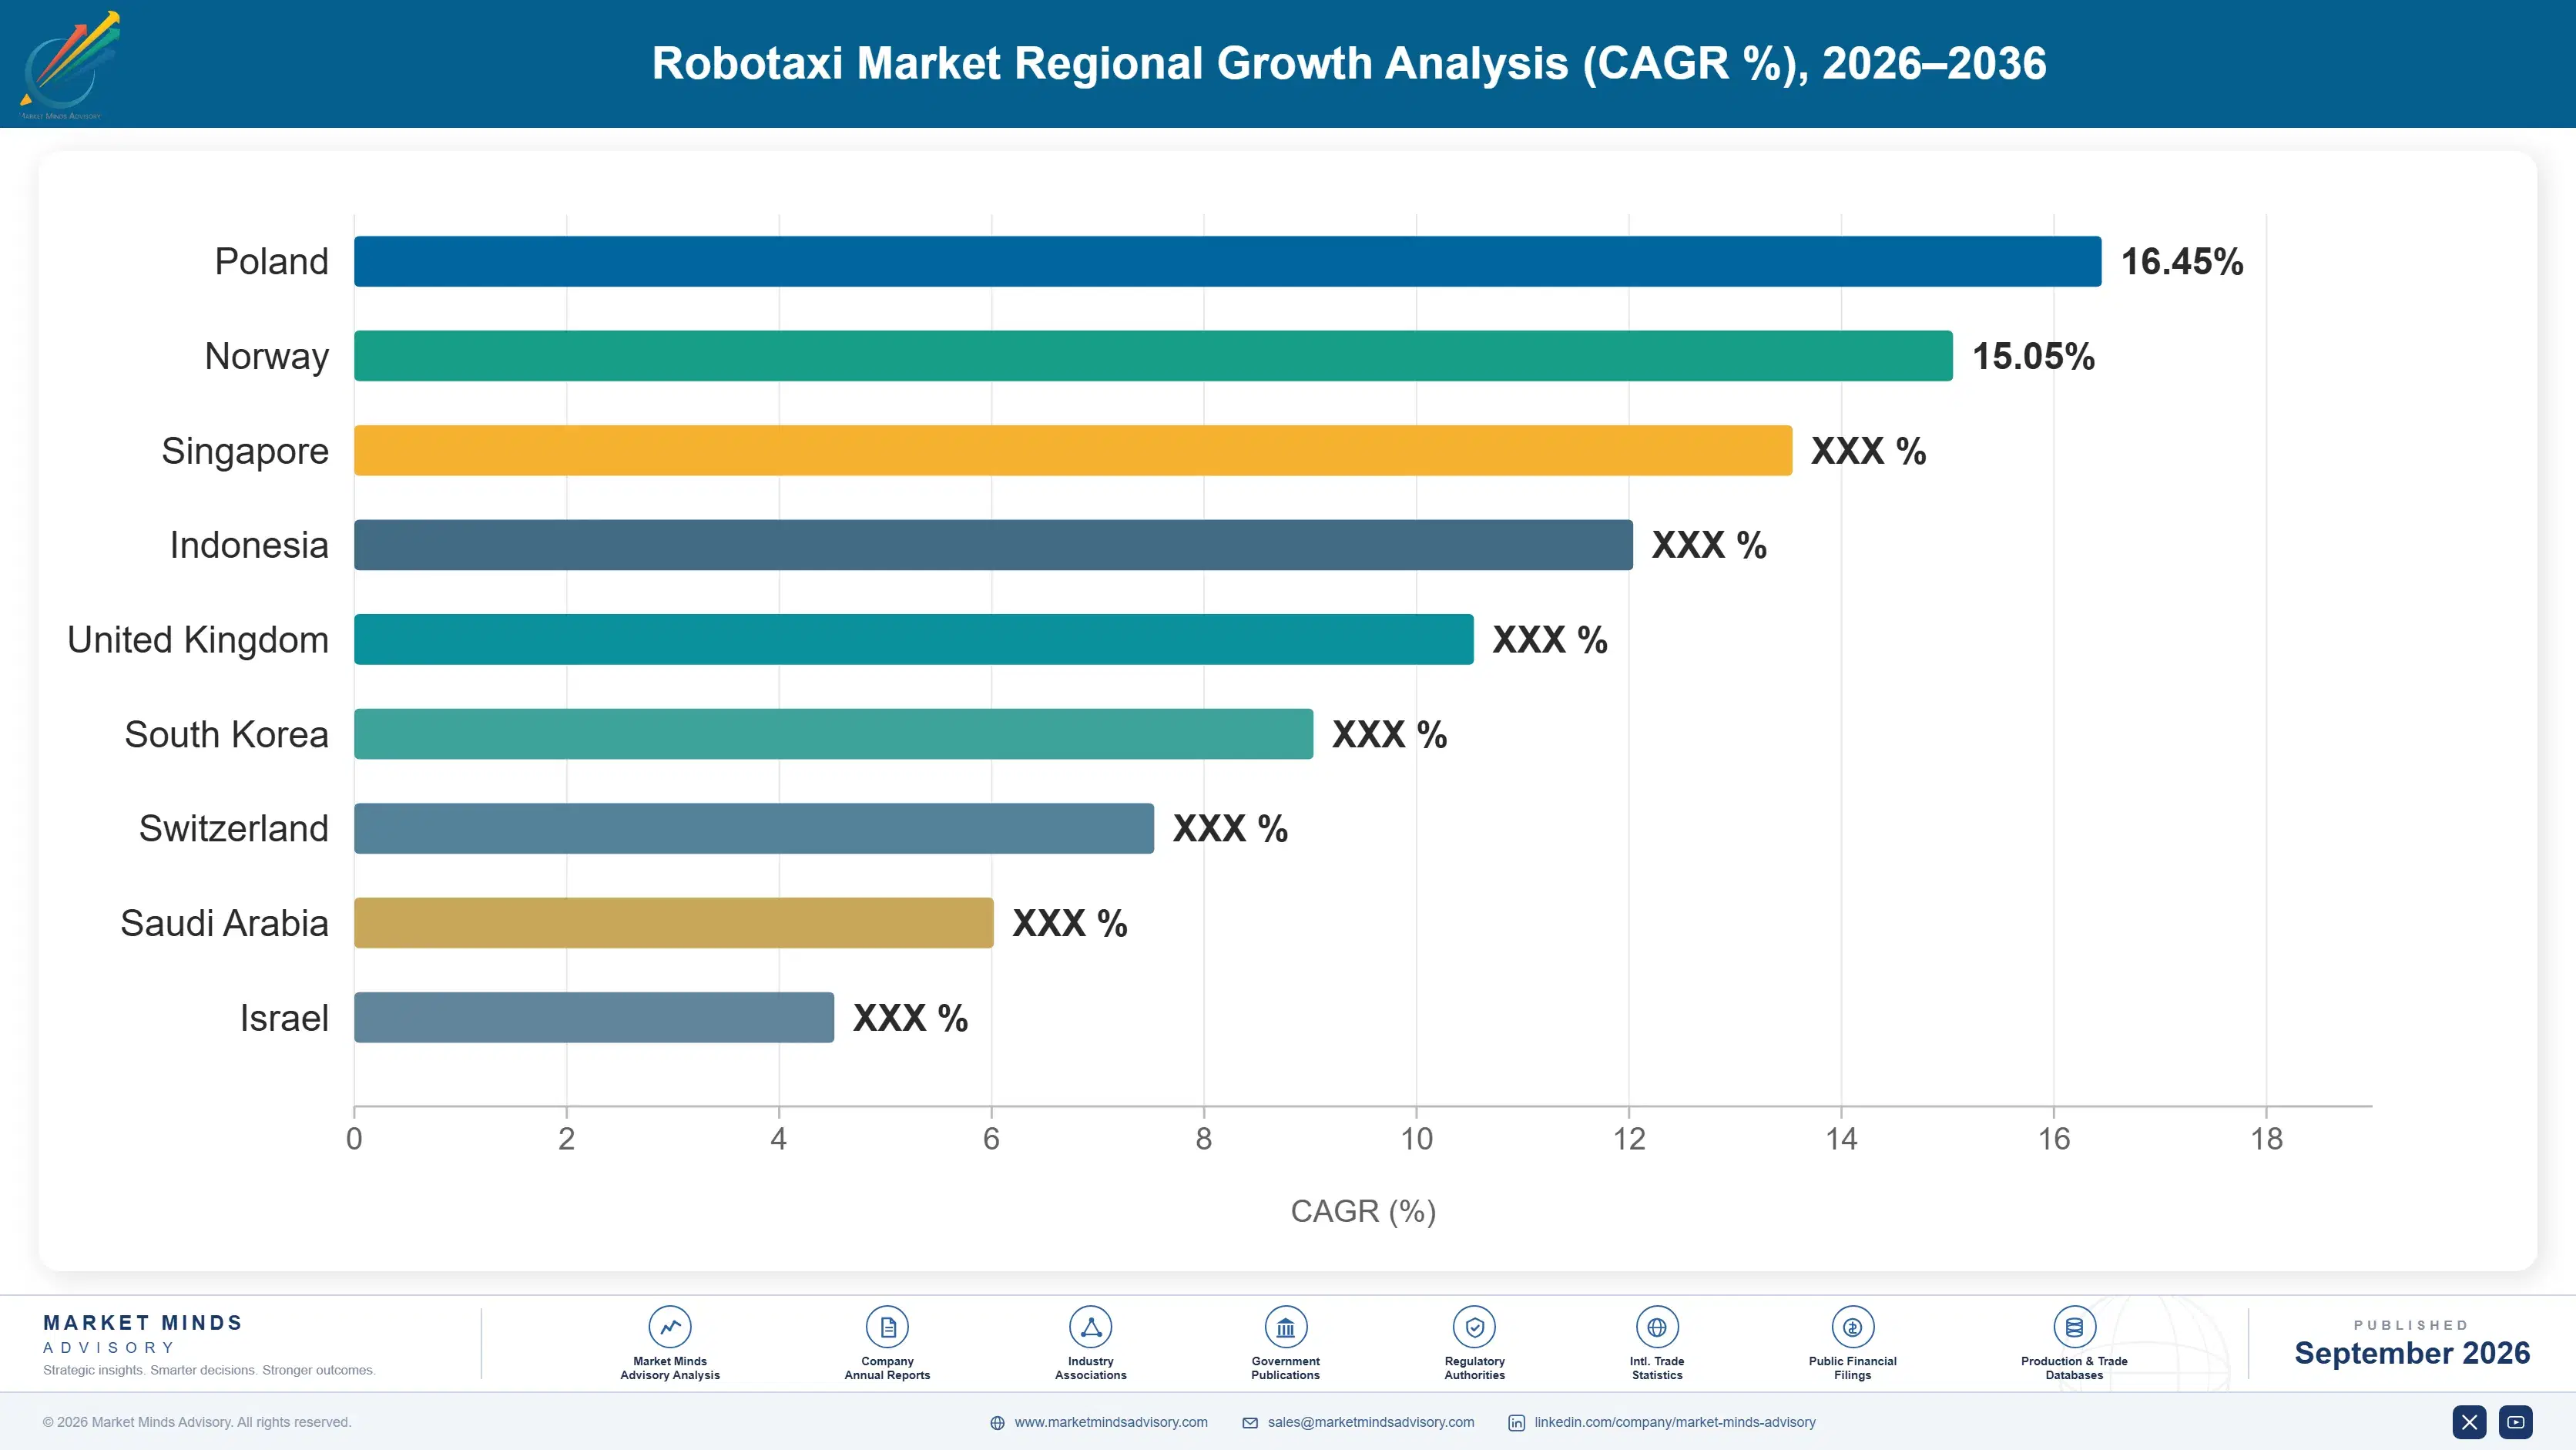
robotaxi-market-country-cagr-analysis-1788421811060

What Actually Makes a Robotaxi Profitable

Removing the driver was necessary and nowhere near sufficient. Profitability is decided by how many hours a vehicle carries passengers, how cheaply it can be bought, how efficiently a depot turns it around, and how many vehicles one remote operator can safely supervise at once. None of that is autonomy research. Autonomy is the solved part.

Fill the Vehicles Before Buying More of Them

Utilisation near 38% of available hours means a fleet is idle most of the time while depreciating on assets costing around USD 78,000 each. Adding vehicles into that condition worsens the economics rather than improving them, which several operators have demonstrated expensively. Concentrating service in dense areas and partnering with ride-hail platforms lifts utilisation by roughly 20 percentage points, and every point flows almost entirely to margin because the cost base is fixed. Coverage expansion is a marketing instinct that the arithmetic does not support. Coverage maps sell better than utilisation figures do.
Market Impact: Lifts utilisation by 20 further percentage points overall

Secure Vehicle Supply Ahead of Fleet Planning

Purpose-built vehicle availability limits fleet growth more than capital, demand or capability does, and trade measures have made sourcing considerably harder for operators outside China. Operators with committed multi-year supply arrangements expand on their own timetable while competitors wait, and the difference compounds because each city launched builds operational capability for the next. Vehicle cost near USD 78,000 also determines the utilisation threshold at which service becomes profitable. Supply strategy deserves the attention that perception engineering currently receives. Each city launched makes the next launch faster, so supply delays compound rather than simply postpone. Supply strategy deserves board attention.
Market Impact: Vehicles now cost around USD 78,000 per unit

Raise the Remote Supervision Ratio Safely

Remote assistance currently runs at roughly one operator to twelve vehicles, and that labour is the single largest operating cost remaining after the driver was removed. Improving intervention prediction, escalation design and operator tooling raises the ratio without reducing safety margin, and each improvement removes cost across the entire fleet simultaneously. Operators reaching one to twenty change the unit economics fundamentally. This is unglamorous human factors and interface work rather than autonomy research, which is precisely why it has received far less attention. Operators reaching 1 operator to 20 vehicles change the unit economics fundamentally.
Market Impact: Improves the supervision ratio beyond 1 to 12

Treat Depot Throughput as a Capacity Constraint

Cleaning, charging, inspection and staging determine how many vehicles can actually be in service, and depot capacity fills long before fleet size does at most operators. Property near dense demand is expensive and scarce, and charging installations need grid connections with lead times measured in years. Operators designing depot throughput deliberately serve roughly 30% more vehicles from the same property. It is a logistics problem that the industry consistently discovers after committing to fleet expansion rather than before. Grid connections take years to secure. The industry keeps learning this after committing capital rather than before.
Market Impact: Serves 30% more vehicles from each depot site

Who Controls the Margin Pool

Concentration is high at roughly 74% across the top five on measured value chain revenue, and it reflects capital intensity rather than any technology moat. Reaching driverless commercial operation requires years of validation, regulatory engagement, depot property and vehicle supply before a single fare is collected, eliminating participants without patient funding. The gap between leaders and challengers is one of accumulated operating permission and fleet scale rather than driving capability, where smaller programmes often perform comparably in limited domains.
Competition runs on three dimensions. Vehicle supply security is first and currently binding, since fleet growth stops without it regardless of anything else. Second is regulatory standing, earned over years and lost in a single incident, which determines where expansion is possible. Third is demand access, where platform partnership has proved more effective than building consumer relationships from nothing.

Two pressures are reshaping positions. Trade measures affecting vehicle sourcing have advantaged operators with domestic manufacturing access and disadvantaged those without, independent of technical merit. Meanwhile ride-hail platforms are positioning themselves as the demand layer across multiple autonomous operators, which captures value without carrying fleet capital. Rankings will move toward operators with secured vehicle supply and depot capability.
robotaxi-market-company-positioning-matrix-1788421811581

Competitive Moat and Risk Dimensions

WAYMO

Moat: Operating permission and validation depth

Waymo holds the longest record of driverless commercial operation and the regulatory standing that comes with it, which is earned over years and cannot be acquired. Its validation data across many millions of driverless miles supports safety cases that newer entrants cannot yet construct. Established depot and operations capability makes each subsequent launch faster, compounding the lead.
WAYMO

Risk: Vehicle supply dependence

Fleet growth has been constrained by purpose-built vehicle availability rather than by capital or demand, and trade measures have complicated the most cost-effective sourcing routes. Building or securing vehicle supply is a manufacturing problem rather than a software one. Operating cost per vehicle also exceeds what fare revenue supports at current utilisation.
BAIDU

Moat: Fleet scale and vehicle cost

Baidu operates one of the largest driverless fleets anywhere across many Chinese cities, benefiting from municipal permitting that moved considerably faster than in Western markets. Purpose-built vehicle cost is a fraction of what operators elsewhere pay, which changes the utilisation threshold at which service becomes viable. Operating scale across many cities produces validation data smaller fleets cannot match.
BAIDU

Risk: Limited international expansion path

The company's position rests substantially on a domestic market where permitting, vehicle cost and operating conditions are favourable, and none of those advantages transfers abroad. International expansion faces regulatory scrutiny of Chinese technology in transport infrastructure across several major markets. Fare levels are also low, so large fleets and high utilisation are needed to match smaller Western revenue.

Players Tracked

Prominent Players

Waymo
Baidu
Pony.ai
WeRide
Zoox

Other Key Players

Uber
Lyft
Tesla
AutoX
Didi Autonomous Driving
Motional
May Mobility
Nuro
Aurora
Hyundai Motor
Zeekr
Toyota
Mobileye
Wayve
Beep

Recent Developments

MARCH 2025

Autonomous operators expand ride-hail platform partnerships across multiple cities

Several operators placed vehicles inside established ride-hail applications rather than relying on their own consumer apps, citing demand access and utilisation rather than any technical requirement. The arrangements were commercial partnerships rather than acquisitions or equity transactions between the parties. Operator applications continued running alongside the partnerships.
Signal: Demand aggregation proved harder to build than autonomy, which reversed a strategic position operators had defended for years.
AUGUST 2025

Trade measures complicate purpose-built autonomous vehicle sourcing

Tariff and import arrangements affecting vehicles and connected vehicle technology raised the cost and complexity of sourcing purpose-built autonomous platforms for operators outside their manufacturing regions. Fleet expansion plans were revised at several operators as a direct result of the change. Domestic sourcing options were pursued in response.
Signal: Vehicle supply became a strategic constraint that no amount of software capability or available capital can resolve.
NOVEMBER 2025

Gulf transport authorities open commercial driverless service in partnership with operators

Transport authorities in the United Arab Emirates opened commercial driverless passenger service with international operators, under regulatory arrangements developed specifically to accommodate the deployment. Fleet sizes were modest initially with defined expansion targets attached to performance. Safety reporting obligations accompanied the permissions granted, with published performance thresholds attached to expansion.
Signal: Purpose-built regulation moves faster than adapting existing frameworks, which is why permissive markets keep pulling ahead.

What a Driverless Ride Actually Costs

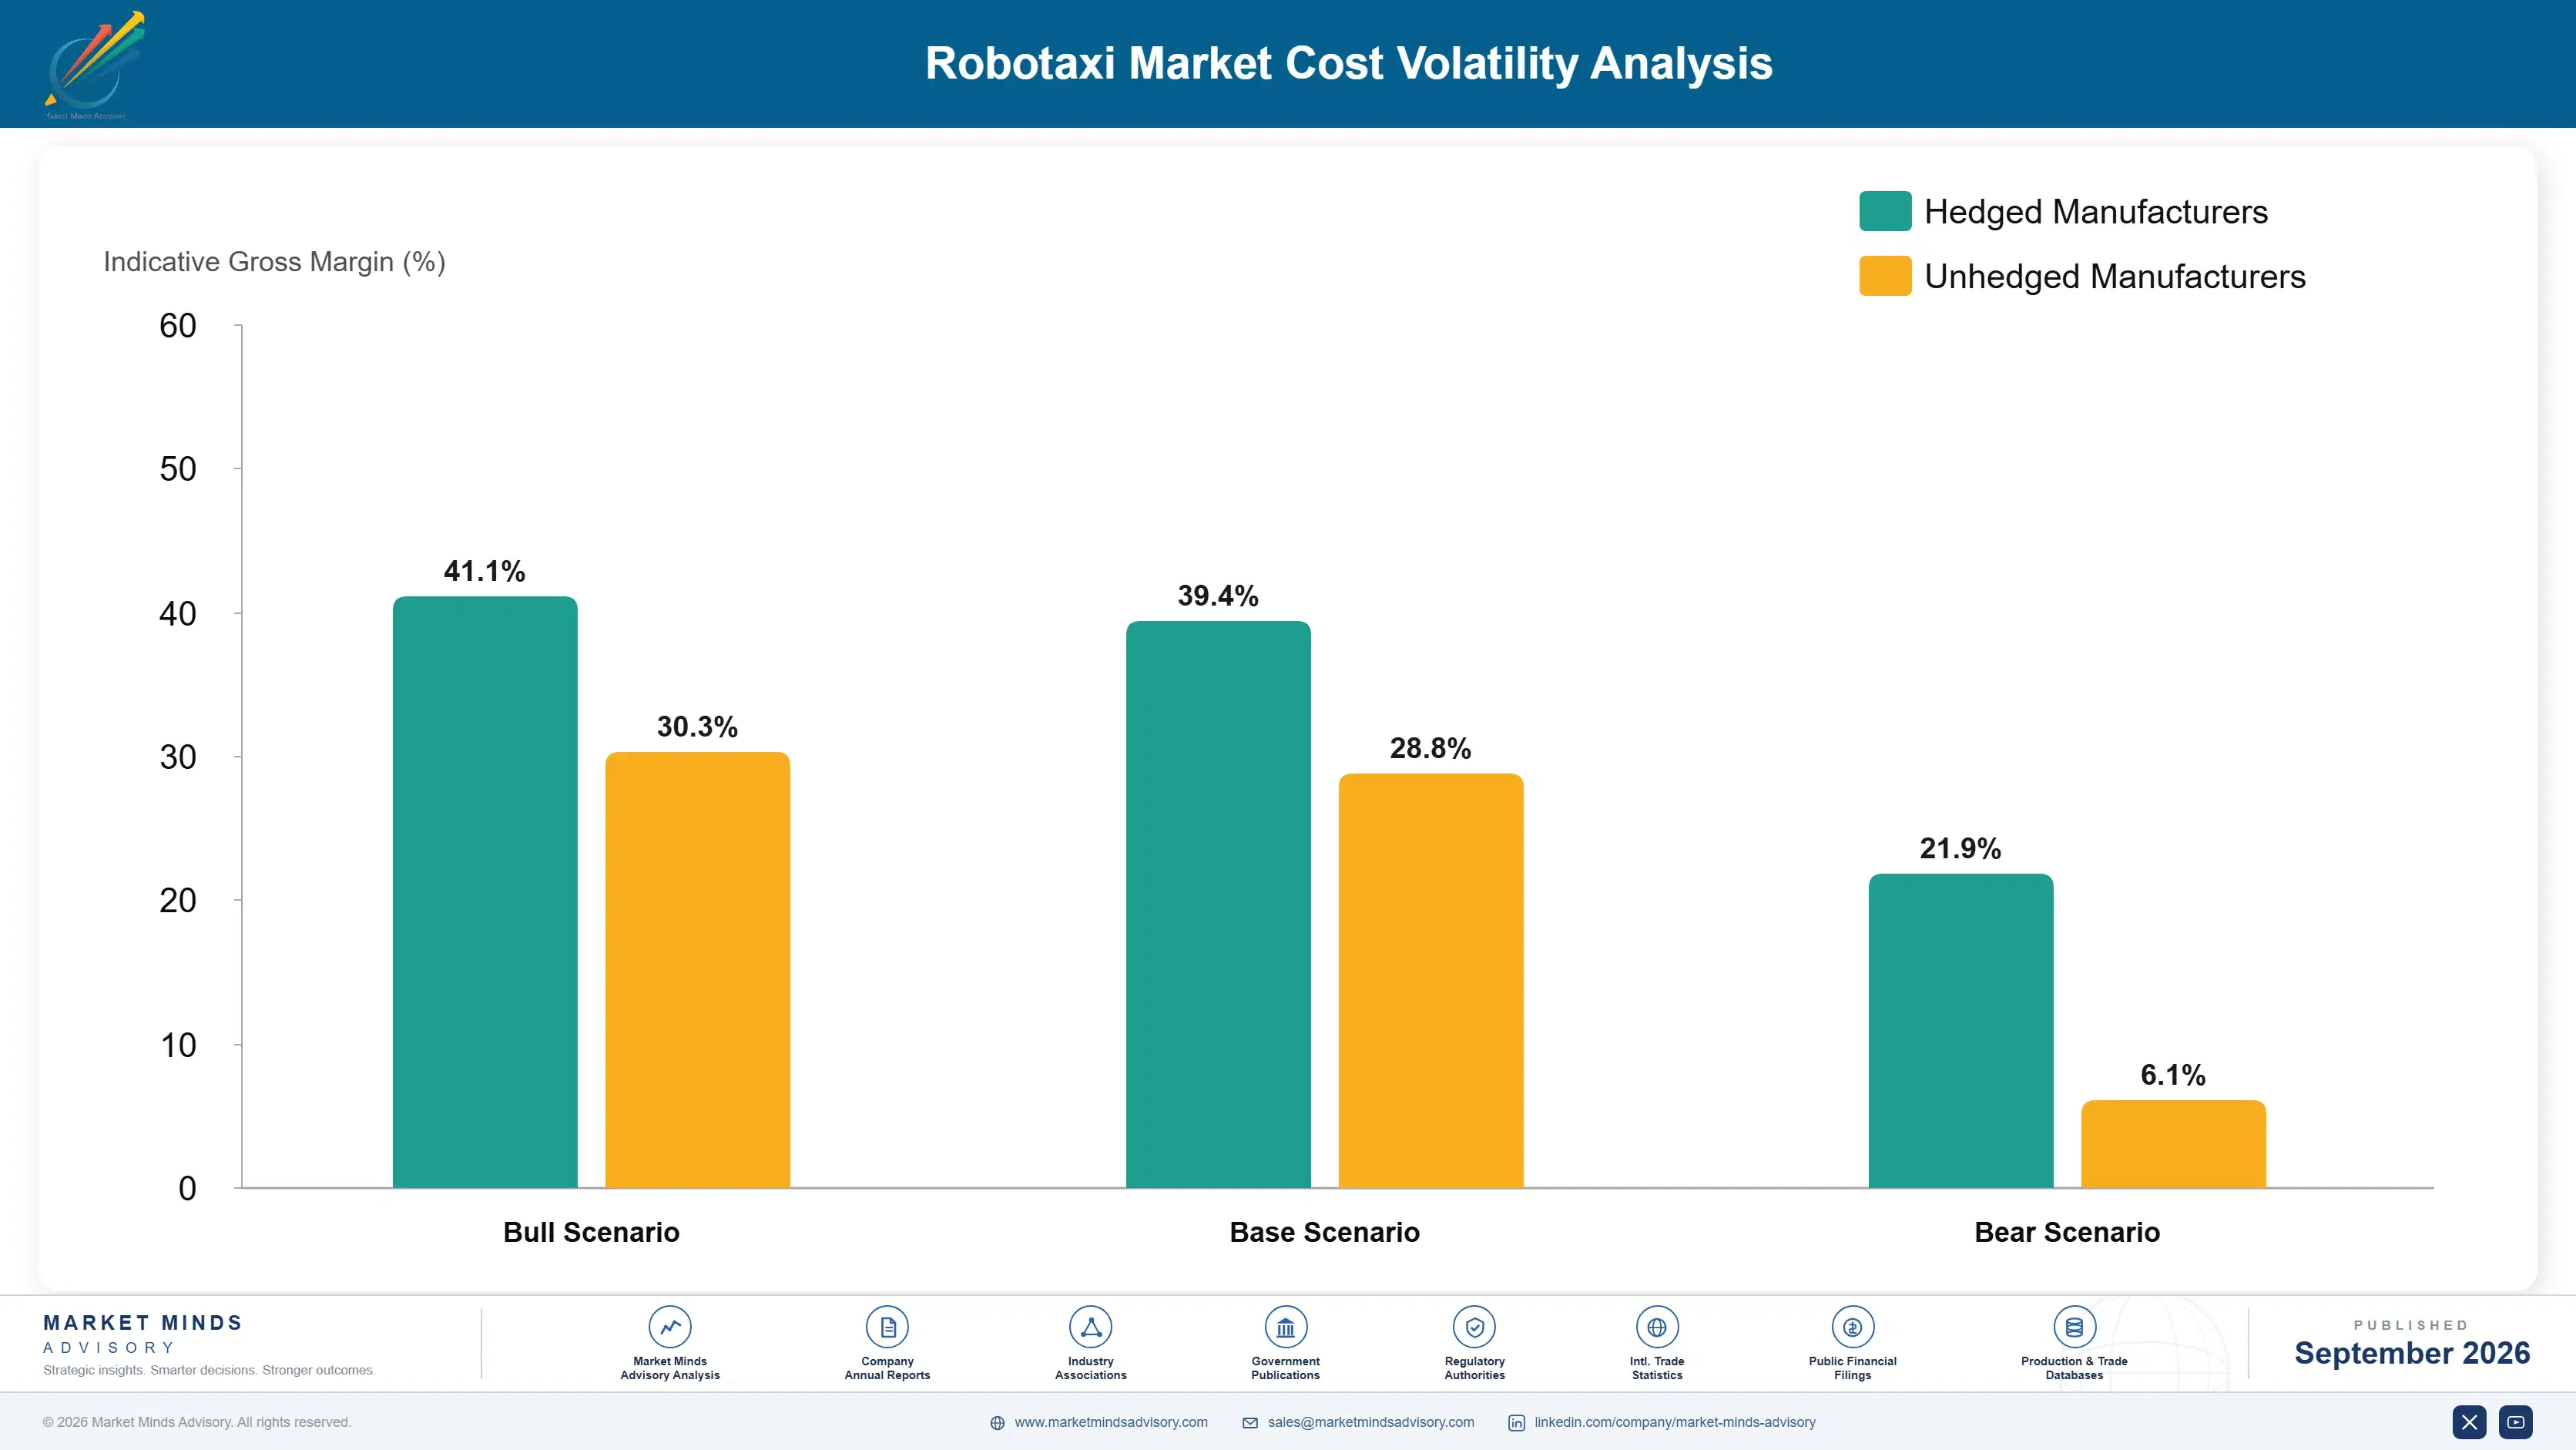
Vehicle capital dominates the cost structure once the driver is removed. Depreciation and financing on a purpose-built vehicle costing around USD 78,000 runs between 31% and 44% of operating cost depending on utilisation, since that charge spreads across fewer rides in a lightly used fleet. Remote assistance adds roughly 19%, depot operations 17%, insurance 11%, and energy and maintenance the balance. Utilisation moves all of those percentages.
Vehicle sourcing has been the sharpest recent pressure and it arrived through trade policy rather than through manufacturing. Tariff and import arrangements affecting vehicles and connected vehicle technology raised acquisition cost and lengthened supply for operators outside their manufacturing regions through 2025. Alphabet and Baidu both referenced autonomous vehicle deployment conditions in recent annual reporting. Operators with domestic manufacturing access were unaffected, widening a substantial cost gap.

Exposure varies by fleet position rather than by scale. Operators owning vehicles carry full depreciation and utilisation risk, severe at 38% and comfortable well above it. Those licensing technology to fleet owners avoid vehicle capital entirely and capture far less of the fare. Platform partners improve utilisation and surrender pricing control. Smaller operators carry vehicle capital without the density that makes depot and remote operations efficient.
robotaxi-market-cost-volatility-analysis-1788421811776

Concentrate fleets before extending coverage

Spreading a fleet across a wider service area lowers utilisation, raises repositioning distance and worsens depot logistics simultaneously, which is the opposite of what coverage expansion intends. Concentrating vehicles in dense demand areas raises utilisation materially and improves every cost line at once. It is unappealing because coverage maps sell better than utilisation figures to investors and city authorities.

Design depots for throughput rather than storage

Depot capacity limits how many vehicles can be in service long before fleet size or demand does, and property near dense demand is scarce and expensive. Designing for cleaning and charging throughput rather than parking density serves roughly 30% more vehicles from the same site. Grid connection lead times mean charging capacity must be secured well before vehicles are ordered.

Invest in remote operator tooling before fleet expansion

Remote assistance at roughly one operator to twelve vehicles is the largest labour cost remaining, and it scales linearly with fleet size unless the ratio improves. Better intervention prediction, escalation design and operator interfaces raise the ratio safely, and the saving applies fleet-wide. It is human factors work rather than autonomy research, which is why it attracts so little investment.

Portfolio Architecture for Margin Defence

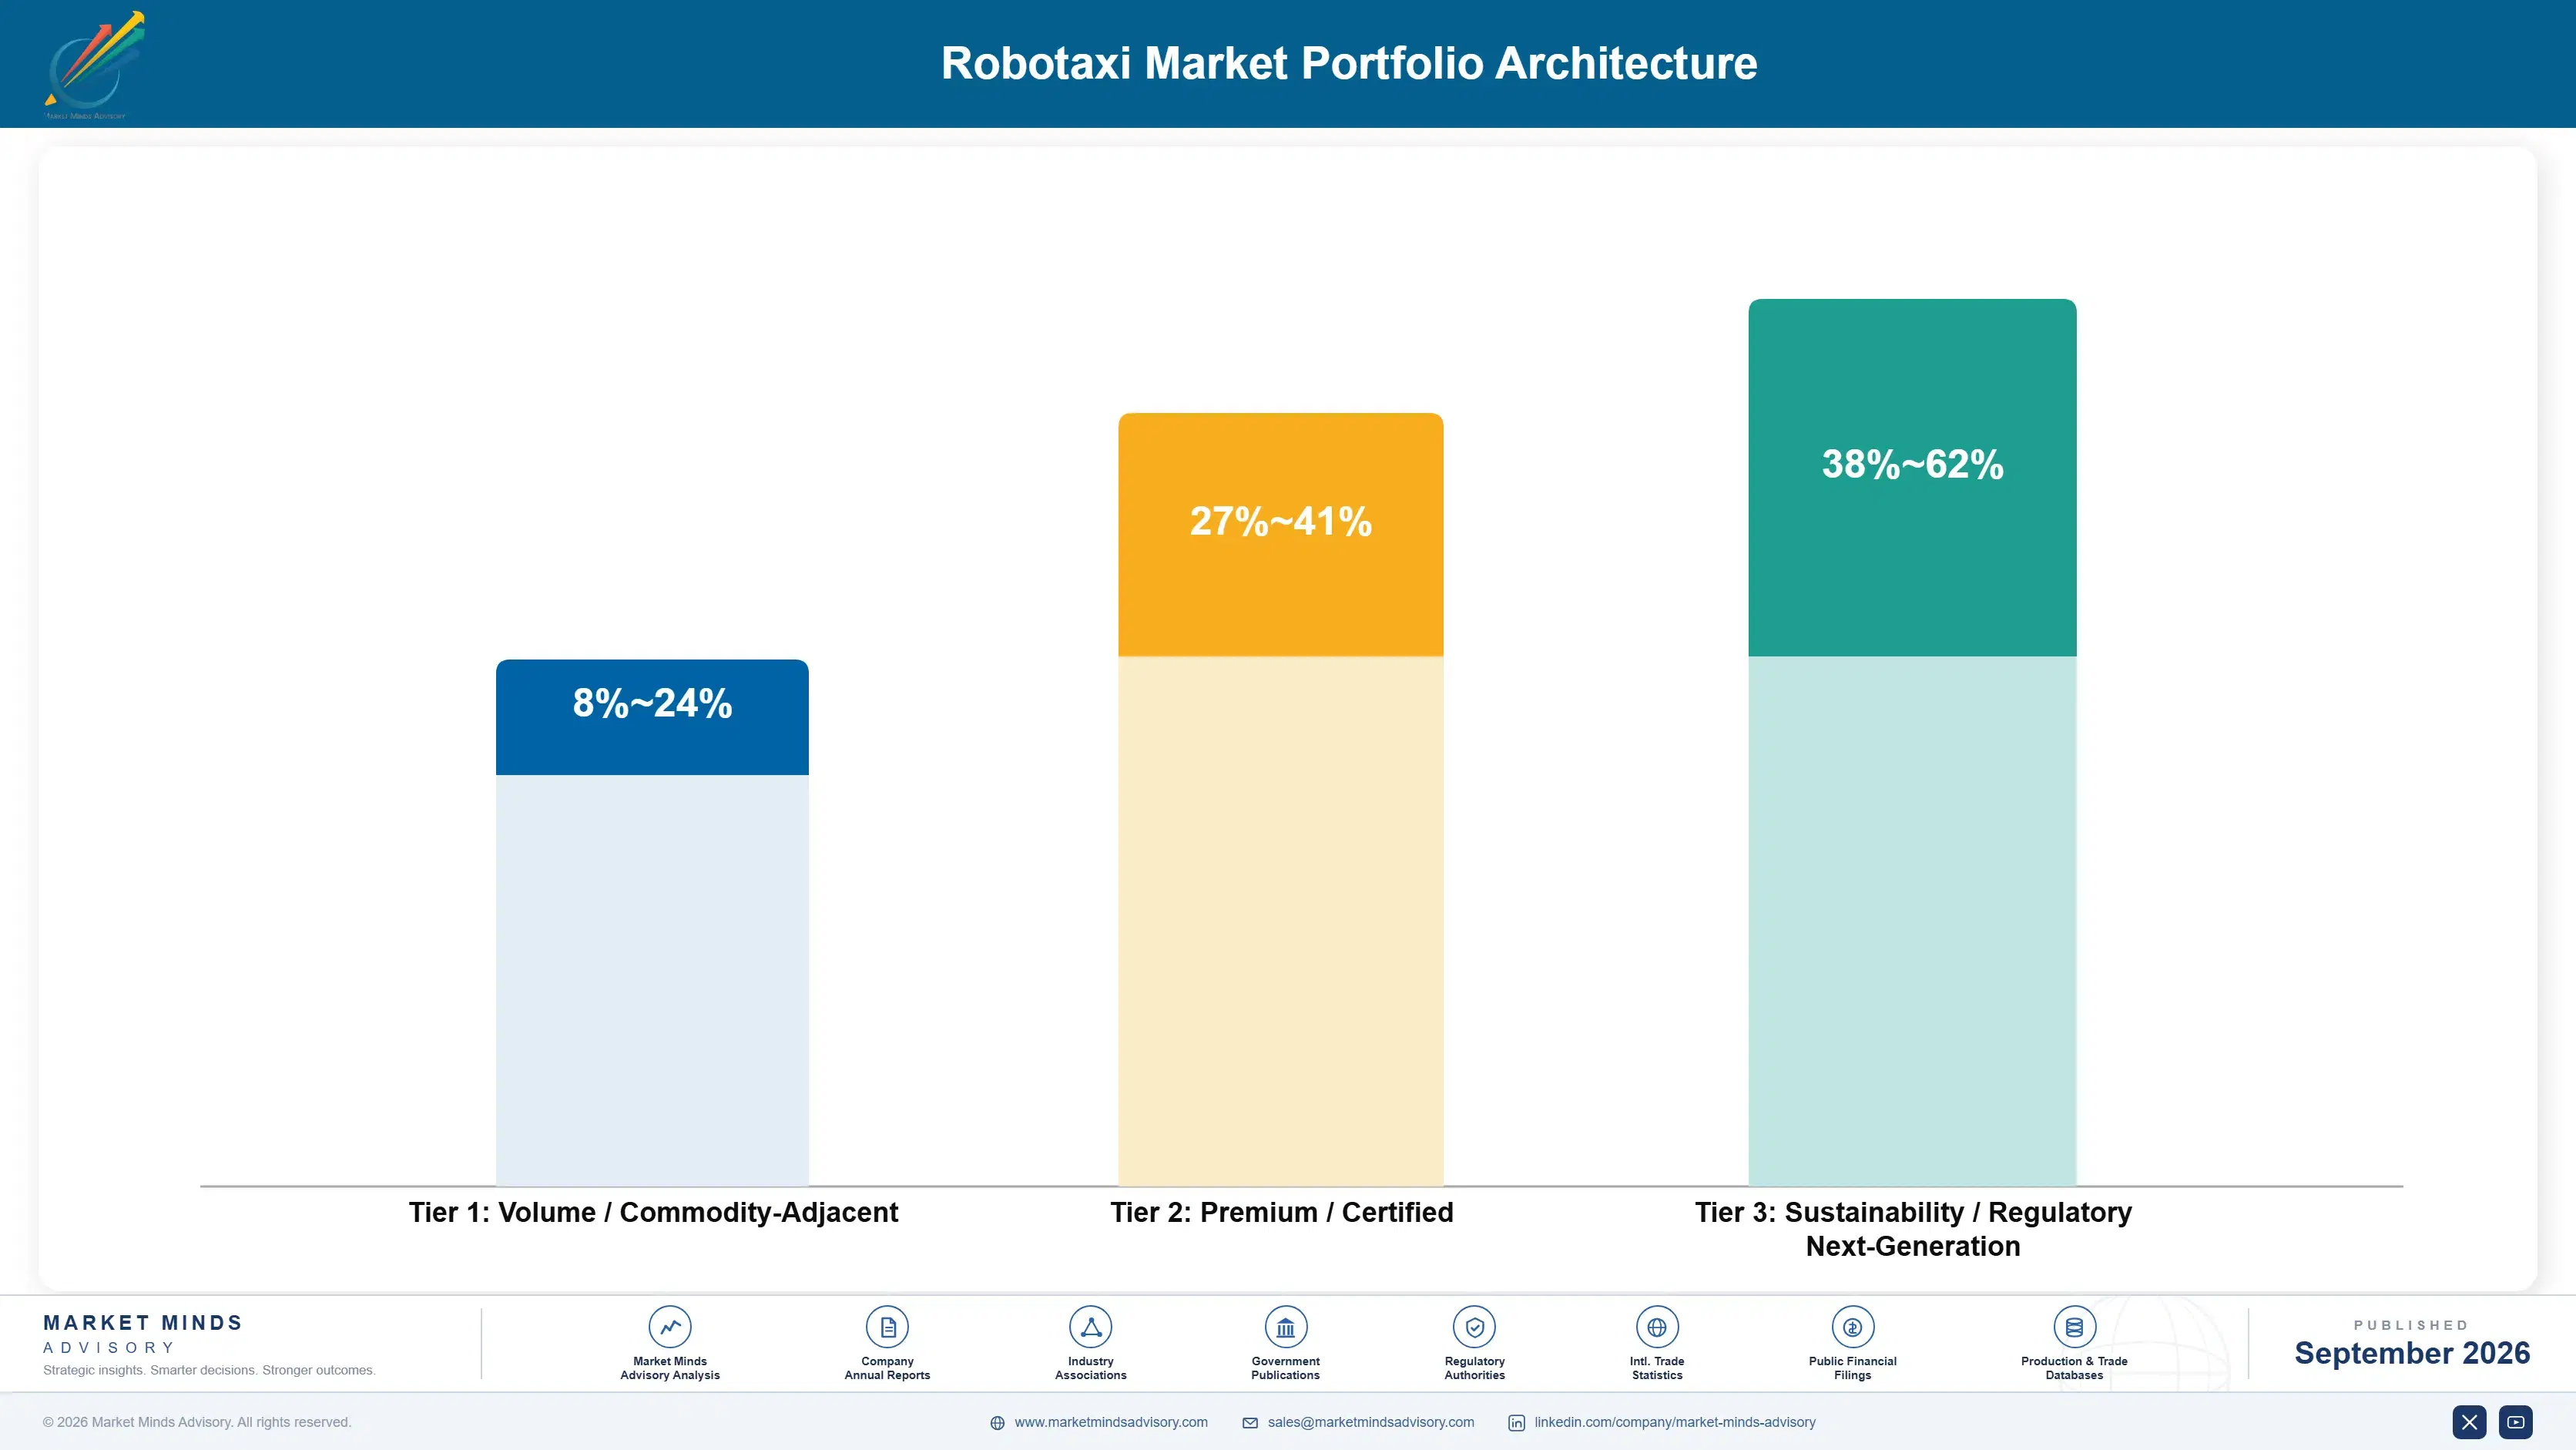
Margin architecture separates on who carries the vehicle. Operating a fleet means owning depreciation, insurance and utilisation risk on assets costing around USD 78,000 each, which produces thin and utilisation-dependent margins until density is achieved. Licensing technology to fleet owners avoids all of that and captures a small fraction of the fare. Depot and remote operations services sit between the two, earning steady margins on activity that every fleet requires regardless of whose technology it runs.
The volume tension is between coverage and density. Wide service areas look impressive to city authorities and to investors, and they lower utilisation, lengthen repositioning and complicate depot logistics all at once. Dense concentrated service produces better economics and a less compelling map. Operators generally chose coverage under investor and municipal pressure; those that resisted have better economics and smaller headlines.

High-value revenue concentrates in depot and fleet operations services and in technology licensing, both of which avoid vehicle capital. Fare revenue occupies the volume position, carries the depreciation and utilisation exposure, and is where nearly all the invested capital has gone. That imbalance is the central commercial problem here, and it resolves only as utilisation rises.

Volume / Commodity-Adjacent

Owned fleet passenger service carrying full vehicle depreciation, insurance and utilisation risk. The wide range reflects utilisation, which moves every cost line at once and varies enormously between concentrated and dispersed deployments. Margin turns positive only well above current fleet utilisation levels.
Gross Margin: 8-24%

Premium / Certified

Platform partnered operation and purpose-built vehicle supply, where demand access or manufacturing scale improves the position. Margin holds better because utilisation is higher or capital risk is transferred. Pricing control sits with the platform rather than the operator in partnered arrangements.
Gross Margin: 27-41%

Sustainability / Regulatory / Next-Generation

Technology licensing, depot and fleet operations services, and remote assistance provision. The widest range in the portfolio, since licensing carries almost no capital while depot operations carry property and labour. Highest margin and no vehicle depreciation exposure anywhere in the tier.
Gross Margin: 38-62%
robotaxi-market-portfolio-architecture-1788421812272

High-value Sub-segments and Strategic Watch-out

Depot and Fleet Operations Services

High value and high growth together, because every vehicle needs cleaning, charging, inspection and staging regardless of whose technology it runs. The margin range reflects property cost and automation of depot processes. Throughput capacity limits fleet size before demand does, which makes this genuinely strategic rather than administrative.
Gross Margin: 34-48%

Autonomy Technology Licensing

High value with strong growth, capturing fare share without carrying vehicle capital, depreciation or utilisation risk of any kind. The range reflects how much operational support accompanies the licence. It is the most capital-efficient position available, though it captures a small share of the value the fleet actually generates.
Gross Margin: 46-62%

Owned Fleet Passenger Service

The volume core of the market and where nearly all invested capital sits, carrying vehicle depreciation against utilisation near 38% of available hours. It generates the operating data and regulatory standing everything else depends on. Margins turn acceptable only at densities that few deployments have yet reached.
Gross Margin: 7-23%

Ride-Hail Platform Value Capture

The strategic watch-out, carried at zero because it represents fare value accruing to demand aggregators rather than to fleet operators. Platforms hold the riders and carry none of the vehicle capital. Operators treating them purely as distribution partners are misreading who ends up holding the customer relationship.
Gross Margin: 0-0%

How This Revenue Builds

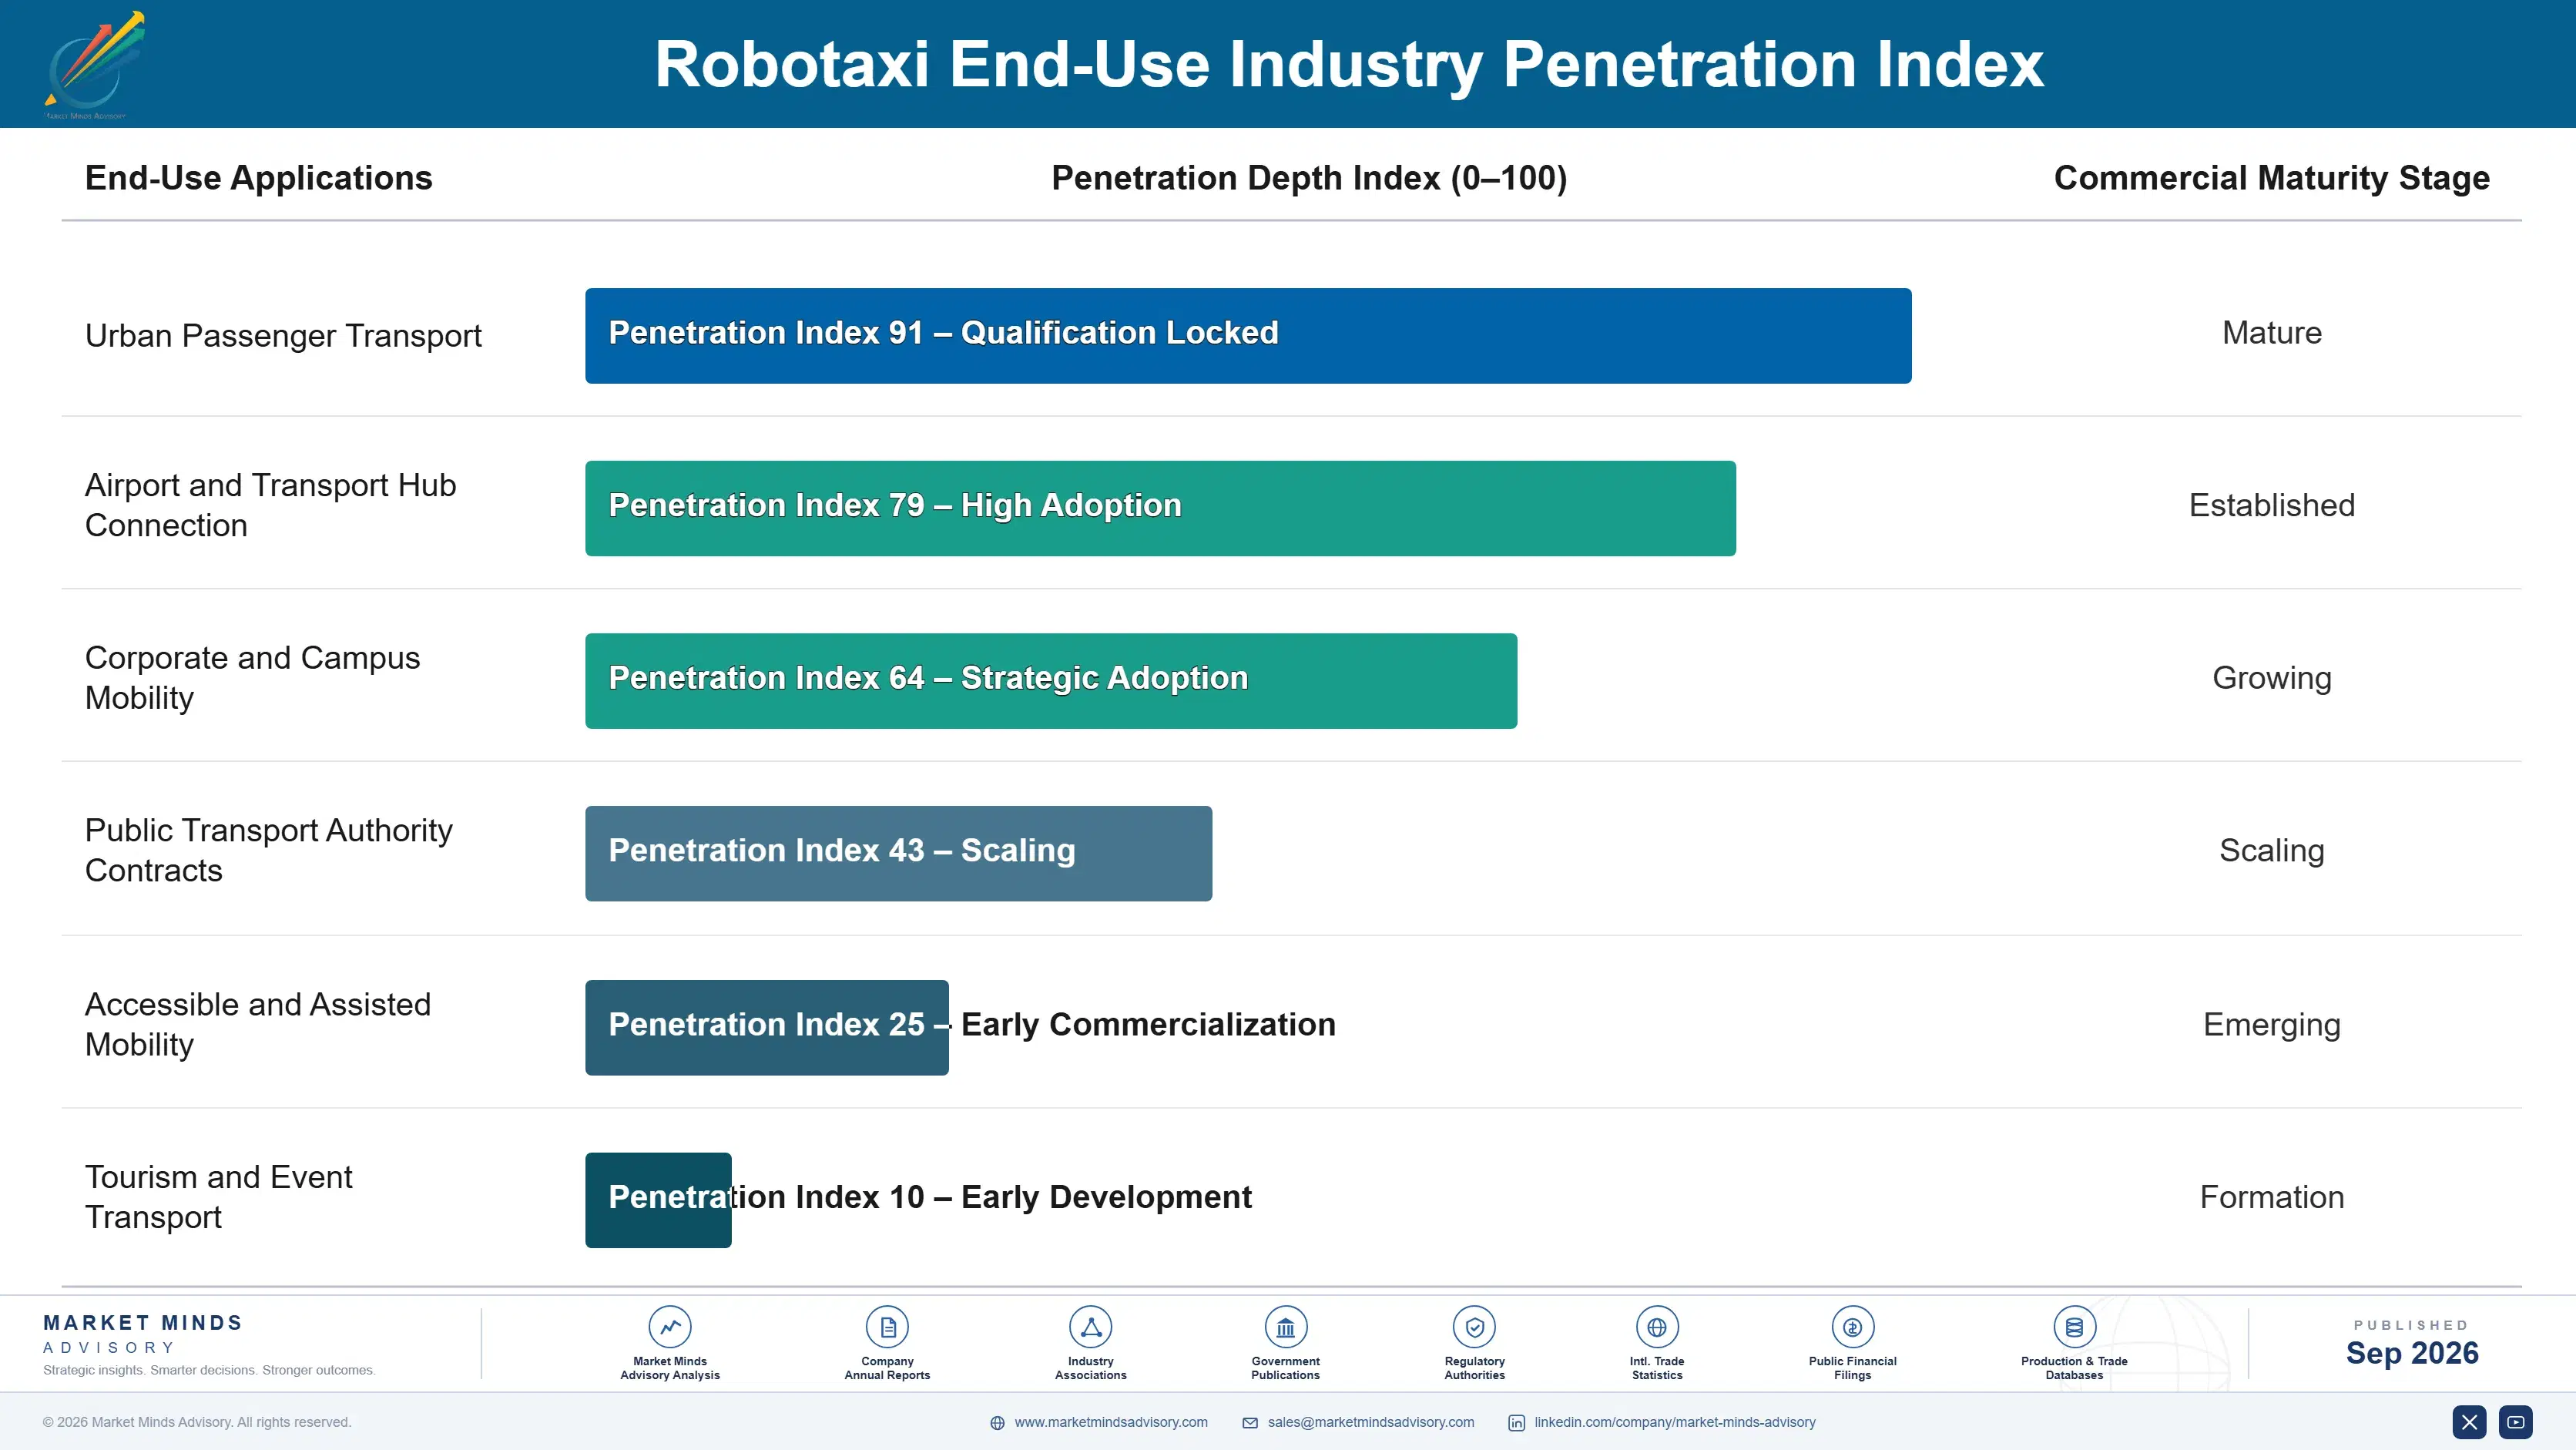
Revenue builds city by city rather than accumulating continuously, and each city takes roughly 17 months of mapping, validation, approval and depot preparation before the first paid ride. That makes forward revenue a function of how many launches are in preparation rather than of demand anywhere. Once a city is operating, revenue grows with fleet size and utilisation, and utilisation matters far more, since the cost base barely moves when a vehicle carries more passengers.
Adoption depth varies sharply by trip type. Short dense urban trips are served well and profitably where fleets concentrate. Airport connections work commercially because trip values are higher and demand is predictable. Night and off-peak service beats human-driven supply, since no driver preference is involved. Suburban and low-density coverage remains uneconomic at current vehicle costs. Accessible transport is feasible and commercially unproven, with municipalities the likely buyer.

The buyer profile is broadening beyond the rider. Individual passengers pay fares and are increasingly reached through ride-hail platforms rather than directly. Municipalities are becoming purchasers where autonomous service fills coverage gaps that commercial transport abandoned. Employers and property developers buy campus and site connections. Operators organised around consumer fares ignore buyers whose payment is considerably more predictable.
robotaxi-market-end-use-penetration-index-1788421812767

What Decides Robotaxi Economics

These are among the four positions where our research anticipates prominent divergence between winners and laggards over the coming forecast period. Each is grounded in the demand model, the regulatory perimeter, and the announced capacity pipeline.
01 / UTILISATION BEFORE EXPANSION

Fill the vehicles you have before buying any more

Fleets currently carry passengers around 38% of their available hours while depreciating on assets costing roughly USD 78,000 each, which means adding more vehicles into that condition makes the economics worse rather than any better. Concentrating service in dense demand areas and partnering with ride-hail platforms lifts utilisation by roughly 20 percentage points, and nearly all of that flows to margin because the cost base is fixed. Coverage expansion satisfies investors and city authorities while quietly damaging the underlying unit economics.
02 / VEHICLE SUPPLY SECURITY

Secure the vehicles, because software will not scale alone

Fleet growth is constrained by purpose-built vehicle availability rather than by capital, by demand or by driving capability, and trade measures have made sourcing considerably harder for operators outside their manufacturing regions. Vehicle cost near USD 78,000 also sets the utilisation threshold at which any service becomes profitable in the first place. Operators holding committed multi-year supply arrangements expand on their own timetable while competitors wait, and that advantage compounds, because each city launched makes the following one faster to open.
03 / REMOTE SUPERVISION RATIO

Improve the operator ratio, not the perception stack

Remote assistance at roughly one operator to twelve vehicles is the largest labour cost remaining once the driver is gone, and it scales linearly with fleet size unless the ratio itself improves. Better intervention prediction, escalation design and operator interfaces raise it without reducing safety margin, and every improvement removes cost across each vehicle in the fleet simultaneously. It is human factors and interface engineering rather than autonomy research, which is precisely why it receives so little of the investment attention.
04 / DEPOT THROUGHPUT PLANNING

Design the depot before committing to the fleet

Cleaning, charging, inspection and staging determine how many vehicles can actually be in service, and depot capacity fills well before fleet size or demand does at most operators. Property near dense demand is scarce and expensive, and charging installations need grid connections with lead times measured in years rather than months. Operators designing for throughput rather than storage serve roughly 30% more vehicles from the same site, and this industry keeps discovering that only after it has committed to expansion.

Engagement Snapshot From the Field

A live engagement with an industry participant carrying material or product regulatory and market exposure ahead of a defining policy shift, showing how our research translates into a defensible multi-year portfolio strategy.
MARKET MINDS ADVISORY · CLIENT ENGAGEMENT SUMMARY
Robotaxi Producer Strategic Portfolio Review and Transition Roadmap 2026·Investment Scenario on Robotaxi Exposure Evaluation 2025-26
CLIENT PROFILE
An autonomous vehicle operator running roughly 340 driverless vehicles across three metropolitan markets with commercial permits in each (client-reported, unverified by MMA). The company operated its own consumer application, owned all of its vehicles outright, and had committed to launching in two additional cities within eighteen months under an expansion plan its investors had already approved.
STRATEGIC CHALLENGE
Fleet utilisation averaged 31% of available hours and contribution margin was negative in two of three markets (client-reported, unverified by MMA). The board had approved further city launches on a coverage growth argument, while the operations team believed the existing markets were being served too thinly to reach profitability at any fleet size.
MMA APPROACH
MMA rebuilt unit economics by service zone rather than by city, which the operator had never separated, and modelled utilisation against vehicle density in each zone. We interviewed 15 internal stakeholders, two ride-hail platforms, three depot property agents and one vehicle supplier. Expansion options were evaluated against contribution margin at achievable utilisation rather than against addressable population figures.
KEY FINDINGS
  1. Three dense zones representing 22% of the service area generated 61% of completed rides, and contribution margin was positive in all three at existing vehicle counts.
  2. Peripheral zones lowered fleet-wide utilisation by roughly 9 percentage points through repositioning distance alone, before any other cost line was counted into the calculation at all.
  3. Depot throughput would have capped the fleet at approximately 400 vehicles regardless of how many additional vehicles were purchased, delivered or financed.
  4. Platform partnership modelling indicated utilisation improvement of 18 to 24 percentage points, at a revenue share the operator had previously rejected on principle.
CLIENT PROFILE
An autonomous vehicle operator running roughly 340 driverless vehicles across three metropolitan markets with commercial permits in each (client-reported, unverified by MMA). The company operated its own consumer application, owned all of its vehicles outright, and had committed to launching in two additional cities within eighteen months under an expansion plan its investors had already approved.
STRATEGIC CHALLENGE
Fleet utilisation averaged 31% of available hours and contribution margin was negative in two of three markets (client-reported, unverified by MMA). The board had approved further city launches on a coverage growth argument, while the operations team believed the existing markets were being served too thinly to reach profitability at any fleet size.
MMA APPROACH
MMA rebuilt unit economics by service zone rather than by city, which the operator had never separated, and modelled utilisation against vehicle density in each zone. We interviewed 15 internal stakeholders, two ride-hail platforms, three depot property agents and one vehicle supplier. Expansion options were evaluated against contribution margin at achievable utilisation rather than against addressable population figures.
KEY FINDINGS
  1. Three dense zones representing 22% of the service area generated 61% of completed rides, and contribution margin was positive in all three at existing vehicle counts.
  2. Peripheral zones lowered fleet-wide utilisation by roughly 9 percentage points through repositioning distance alone, before any other cost line was counted into the calculation at all.
  3. Depot throughput would have capped the fleet at approximately 400 vehicles regardless of how many additional vehicles were purchased, delivered or financed.
  4. Platform partnership modelling indicated utilisation improvement of 18 to 24 percentage points, at a revenue share the operator had previously rejected on principle.
RECOMMENDED STRATEGY
Phase 1: Withdraw from peripheral service zones and concentrate the existing fleet in the three dense zones where contribution margin is already positive. Phase 2: Enter a ride-hail platform partnership in at least one market to test the utilisation improvement before committing further capital to new cities. Phase 3: Defer both planned city launches until depot throughput and platform partnership economics have both been demonstrated in the existing three markets.
OUTCOME
Fleet utilisation reached 49% within nine months and contribution margin turned positive in all three markets (client-reported, unverified by MMA). Both city launches were deferred by a year, and the platform partnership was extended to a second market after the first performed ahead of the modelled improvement.

Frequently Asked Questions

Foundational context covering the market sizes, CAGR, scope, country, region and competition that inform every finding below. This section is provided to cover basics and most often pre-purchase conversations, answered from the MMA Primary Research Dataset.

What is the current size of the Robotaxi Market?

The market was worth USD 1.1 billion in 2025 and reaches USD 1.30 billion in 2026, measured across the whole value chain. Fare revenue accounts for the majority of that figure.

How large will the Robotaxi Market be by 2036?

MMA forecasts USD 6.69 billion by 2036, an expansion of 5.15 times over the forecast period. That represents USD 5.39 billion of incremental annual revenue against 2026.

What is the CAGR for the Robotaxi Market 2026 to 2036?

The base case is 17.8% compound annual growth, with a bull case at 19.0% and a bear case at 16.4%. Vehicle supply and city launch cadence constrain the base case rather than demand.

Which segment is growing fastest?

Ride-hail platform partnered operation grows at 26.7%, half again the market rate of 17.8%. Demand aggregation proved harder for autonomous operators to build than autonomy itself was.

Who are the major companies in the Robotaxi Market?

Waymo, Baidu, Pony.ai, WeRide and Zoox lead on measured value chain revenue. Together they hold roughly 74%, which reflects capital intensity rather than any technology moat.

Which country is growing fastest?

The United Arab Emirates grows fastest at 24.8%, on government transport strategies with explicit autonomous service targets and regulation designed specifically to accommodate deployment quickly.

Report Segmentation Architecture

The full report scope spans multiple orthogonal segmentation dimensions, with cross-tabulated demand data provided for each dimension pair. Coverage extends further to regional breakdowns, trend trajectories, and the competitive detail needed to support segment-level decision-making.

By Primary Market Dimension

  • Owned Fleet Direct Operation
  • Ride-Hail Platform Partnered Operation
  • Technology Licensing to Fleet Operators
  • Purpose-Built Vehicle Supply
  • Depot, Charging and Fleet Operations Services
  • Remote Assistance and Safety Operations

By End-Use Industry

  • Urban Passenger Transport
  • Airport and Transport Hub Connection
  • Corporate and Campus Mobility
  • Public Transport Authority Contracts
  • Accessible and Assisted Mobility
  • Tourism and Event Transport

By Commercial Dimension

  • Direct Consumer Fares
  • Ride-Hail Platform Distribution
  • Municipal Service Contracts
  • Fleet Operator Licensing
  • Vehicle Supply Agreements
  • Outsourced Operations Contracts

By Region

  • East Asia
  • North America
  • Western Europe
  • South Asia and Pacific
  • Middle East and Africa
  • Latin America
  • Eastern Europe

Scope, Methodology, and Coverage

Every figure in this report is reproducible from documented input assumptions. The scope below maps the historical period, the forecast horizon, the segmentation dimensions, and the countries covered, alongside the underlying primary and qualitative methodology.
Historical Period
2020 to 2025
Forecast Period
2026 to 2036
Base Year
2025 (USD billions; MMA Primary Research Dataset, September 2026)
Market Definition
This market covers commercial autonomous passenger transport operated without a safety driver on board, measured across the value chain and spanning owned fleet direct operation, ride-hail platform partnered operation, technology licensing to fleet operators, purpose-built vehicle supply, depot, charging and fleet operations services, and remote assistance and safety operations. Revenue is measured as passenger fares, vehicle supply value, technology licensing fees and directly attributable operations service value. Driver-supervised testing and pilot operation, personally owned vehicles with driver assistance systems, autonomous trucking and freight, delivery robots, and low-speed campus shuttles operating below regular traffic speeds are excluded.
Quantitative Units
USD billions, fares, vehicle supply, licensing and operations service revenue
Segmentation Dimensions
Value chain position, service application, commercial model, region
Regions Covered
East Asia, North America, Western Europe, South Asia and Pacific, Middle East and Africa, Latin America, Eastern Europe
Countries Covered
United States, Canada, Mexico, Brazil, United Kingdom, Germany, France, Netherlands, Sweden, Switzerland, Poland, Czechia, China, Japan, South Korea, Taiwan, Singapore, India, Australia, New Zealand, United Arab Emirates, Saudi Arabia, Qatar, South Africa
Key Companies Profiled
Waymo, Baidu, Pony.ai, WeRide, Zoox, Uber, Lyft, Tesla, AutoX, Didi Autonomous Driving, Motional, May Mobility, Nuro, Aurora, Hyundai Motor, Zeekr, Toyota, Mobileye, Wayve, Beep
Quantitative Methodology
Primary survey, n=3,800 respondents, Q4 2025, six countries; demand-side model with trade association cross-validation
Qualitative Methodology
47 expert interviews, Q4 2025; applied to validate demand model assumptions, identify emerging dynamics, and assess competitive positioning
Report Format
PDF and XLSX data workbook (Word format preview document)
Publisher
Market Minds Advisory
Report Code
MMA-2026-AUT-131
Published
September 2026
Contact
sales@marketmindsadvisory.com | www.marketmindsadvisory.com

Purchase the full Robotaxi Market Report (2026 to 2036).

The full MMA report examines why removing the driver saves less than the arithmetic first suggested, and what actually determines whether a driverless fleet makes money. It sizes the market to 2036 across six value chain positions, seven regions and 24 countries, with segment growth rates and regional demand mechanisms set out in full. Competitive analysis covers 20 participants assessed on measured value chain revenue, including moat and risk assessment for the two leaders. The report quantifies cost structure, utilisation economics and margin architecture across three portfolio tiers. It closes with four strategic verdicts and an anonymised fleet operator engagement.
Six value chain positions sized to 2036
Seven regions with demand mechanism analysis
Twenty participants on consistent revenue basis
Utilisation and vehicle cost benchmarks by market
Margin architecture across three portfolio tiers
Anonymised autonomous fleet deployment economics engagement

Built For The People Who Decide

From boardroom strategy to bench-side execution, this report is read cover-to-cover by leaders shaping the next decade of their industry, turning demand scenarios, market dynamics and valuation benchmarks into decisions.
CXOs/ Presidents/ VPs/ Managers
M&A and Corporate Development
Strategy Teams and R&D Heads
Procurement and Product Directors
Regulatory and Compliance Leaders
Investor Relations and Equity Analysts