Market Minds Advisory
Riot Control Equipment Market

Riot Control Equipment Market: Riot Control Equipment: Protective Spend, Accountability Requirements and Export Licensing Pressure

Protective gear takes most of the budget in this market while the contested items carry nearly all the legal risk, and tenders are now written around defending a deployment afterwards.

Lead Analyst

Published

September 2026

Make Smarter Decisions with Customized Research Insights

Request a free sample report and evaluate market opportunities, growth trends, and competitive dynamics relevant to your business needs.

2025 MARKET VALUE$4.6BMarket Size 2025
2036 FORECAST VALUE$8.8BBase Case , 2026 to 2036
CAGR 2026 TO 20366.0 %Bull 7.2% / Bear 4.8%
INCREMENTAL OPPORTUNITY$3.9BNet 10- year value creation
EXPANSION MULTIPLE1.80x2036 value over 2026 base
Strategic Levers
M&A Pipeline
Regional Outlook
Country Rankings
Competitive Intelligence
Segmental Deep-dive
Call-Us : 91 93563 13602

Executive Snapshot and Market Trajectory.

Most of the money in this market goes on protective equipment, not on anything that gets fired. Helmets, visors, suits and respiratory protection take the bulk of procurement, and nobody argues about them. The contested items are a minority of spend and carry nearly all the legal and reputational risk.
Two forces set the commercial pace. Agencies increasingly have to defend a deployment afterwards, in court or before an oversight body, and tenders now specify recording, logging and munition traceability because of it. Export licensing under European Union rules and national human-rights due diligence then decide which suppliers can sell where. Accountability and recording systems grow fastest at 9.0%, half again the market rate of 6.0%.
The supplier field is the most fragmented in public safety equipment, with five firms holding 29%, because protective gear comes from textile and helmet specialists, vehicles from fire appliance builders, and munitions from a separate industry again. Nothing links them commercially. What is consolidating is the accountability layer: agencies want recording, deployment logs and traceable munition batches from one vendor, and firms able to supply that across categories hold the first genuine cross-category position here.
Market Definition
This market covers equipment procured by law enforcement and public order agencies for managing crowds and civil disturbance. Scope includes body protection suits and limb guards, helmets with visors and shields, respiratory and eye protection, less-lethal launchers and their munitions, public order vehicles including water cannon, and deployment accountability systems covering recording, logging and munition traceability. Excluded are firearms and conventional ammunition, military equipment procured by armed forces, general police uniforms and duty gear, custodial and detention equipment, surveillance systems not tied to public order deployment, and training services.
Base Year Value
$4.6B in 2025 (MMA Primary Research Dataset, September 2026)
Forecast Period
2026 to 2036, eleven discrete annual values
CAGR
6.0% base case. Bull 7.2%. Bear 4.8%.
Fastest Growth Segment
Deployment Accountability And Recording Systems: 9.0% CAGR
Fastest Growth Country
India: 9.4% CAGR
Fastest Growth Region
South Asia and Pacific: 8.2% CAGR
Largest Region
East Asia: 28% of 2025 global value
Market Leaders
Safariland Group, Combined Systems, Avon Protection, Rosenbauer International, Condor Non-Lethal Technologies. Source: MMA Analysis based on unit shipment volume and contracted procurement value, July 2026.
Primary Survey
n=3,800 procurement and R&D decision-makers, Q4 2025, six countries
Methodology
Demand-side build-up, cross-validated against public data, 47 expert interviews

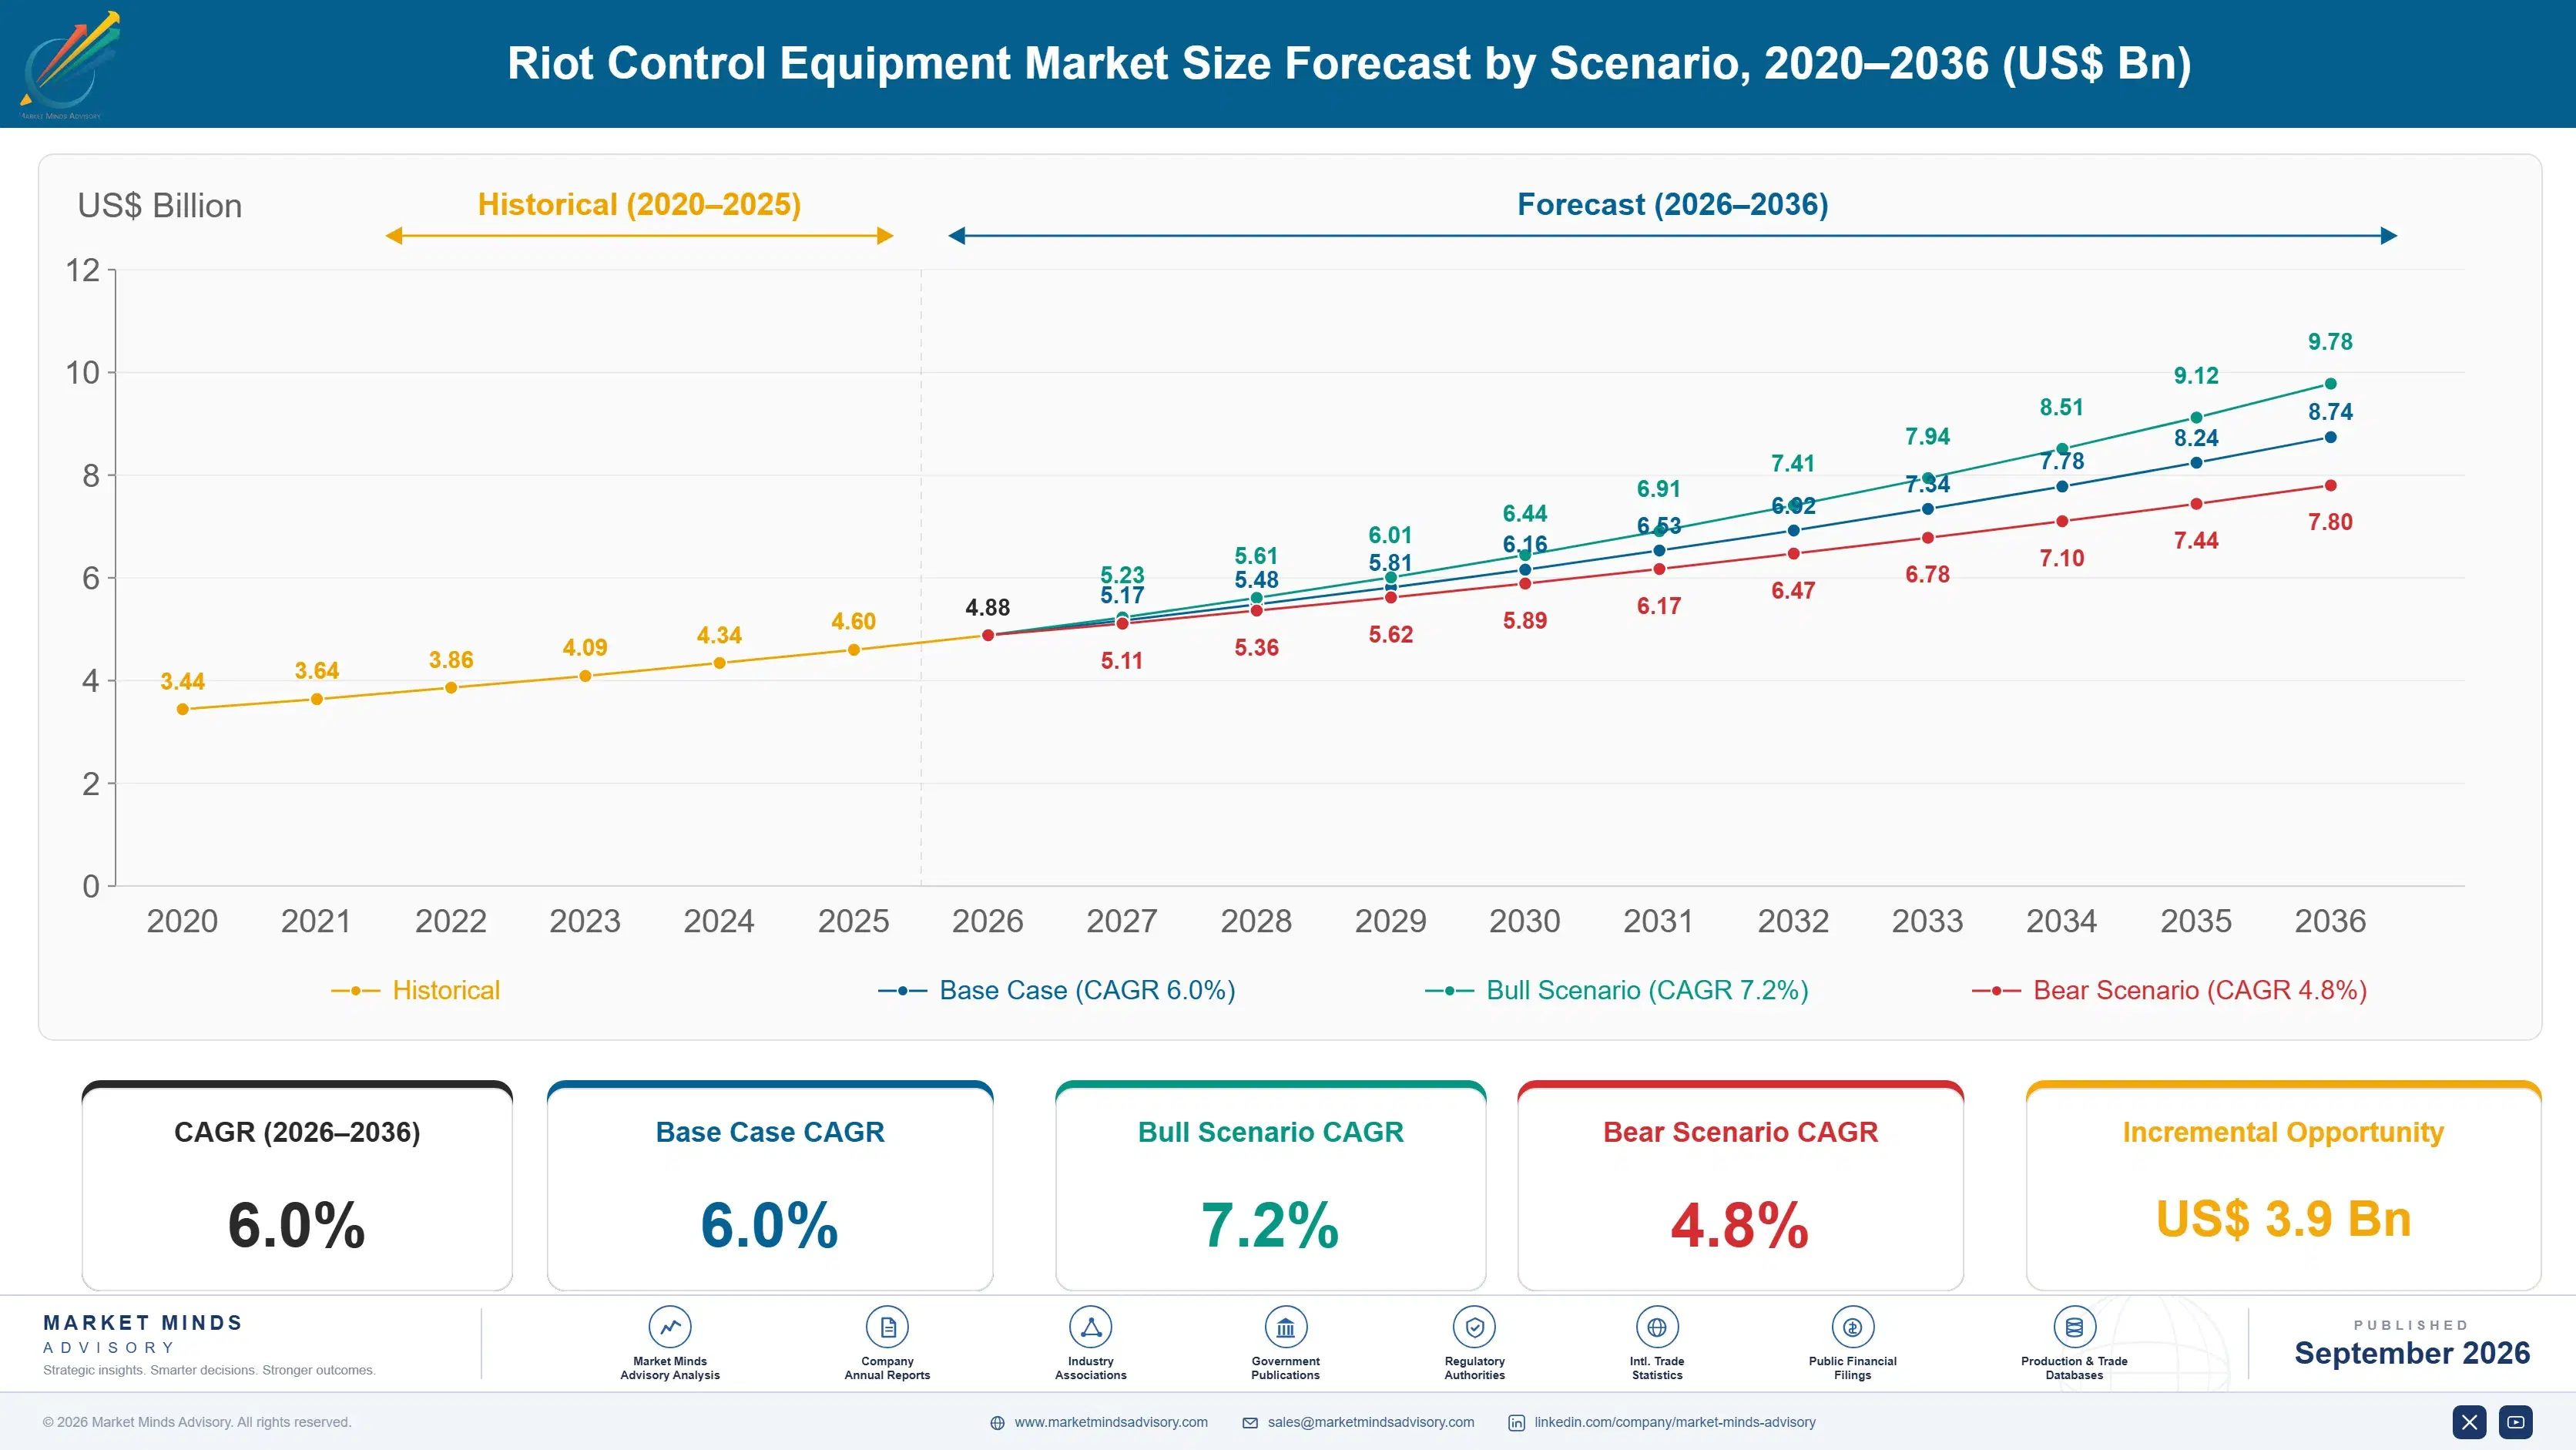
Riot Control Equipment Market Forecast Scenarios

riot-control-equipment-market-size-forecast-scenario-1790025800332
Growth averaged 5.1% across 2020 to 2025, and demand was unusually lumpy inside that period. Protective equipment orders spiked in 2020 and 2021 as agencies across several regions replaced worn stocks under sudden pressure, then fell back sharply. What persisted was a governance change rather than a volume one: oversight reviews in several countries produced procurement standards that now shape tenders more than product catalogues do.
Base case growth of 6.0% rests on three mechanisms. Accountability requirements written into tenders create a product category that barely existed in 2020, covering recording, deployment logging and munition batch traceability. Fleet renewal of public order vehicles across East Asia and South Asia adds high-value units on long replacement cycles. And protective equipment standards revision, particularly around respiratory protection and impact ratings, obsoletes existing agency stock and forces replacement ahead of natural wear.
The bull case at 7.2% assumes accountability content becomes a standard tender requirement across most procuring jurisdictions rather than a leading-edge one, pulling replacement forward. The bear case at 4.8% follows from oversight working the other way: agencies facing political scrutiny defer procurement altogether, export licensing tightens further, and suppliers lose addressable markets faster than accountability content replaces the revenue.

Where the Budget Goes and Where the Risk Sits

The spending pattern surprises anyone following this market only through its controversies. Personal protective equipment accounts for roughly 54% of procurement, and its buyers are occupational safety functions as much as operational ones, since an injured officer is a compensation claim. Helmet impact ratings, visor optical standards and respiratory certification drive those purchases, and they are dull, technical and uncontested.
FIVE-FIRM CONCENTRATION29%Separate supply industries keep this field unusually fragmented
PROTECTIVE EQUIPMENT SHARE54%Portion of procurement spend on personal protective items
AVERAGE VEHICLE UNIT PRICEUSD 610kPublic order vehicles including all water cannon variants
AGENCY REPLACEMENT CYCLE8.4 yearsTypical interval for protective equipment stock renewal cycles
ACCOUNTABILITY CONTENT PENETRATION23%Share of tenders specifying recording and traceability requirements
EXPORT LICENCE REFUSAL RATE11%Applications declined or withdrawn across all reporting jurisdictions
Accountability is the fastest-moving requirement and it changed the product, not just the paperwork. Agencies now need to reconstruct what happened during a deployment: which munition batch, discharged when, by whom, recorded how. That has pulled logging hardware, batch marking and recording integration into tenders that previously listed equipment alone. Around 23% of tenders now carry such requirements, and the share is rising in every jurisdiction with an active oversight body.
Export control is the constraint few suppliers discuss openly. European Union rules restrict trade in certain law enforcement goods and require authorisation for others, and national due diligence varies widely on top. Roughly 11% of licence applications are declined or withdrawn across reporting jurisdictions. The practical effect is that addressable market differs by supplier nationality for identical products, which distorts competition in a way no procurement officer can correct.
"This market gets discussed entirely through its most contested products, which are a minority of the spend. The procurement officers I talk to are mostly arguing about helmet certification and whether the batch numbers will survive an inquiry."
Director, Public Safety Equipment Practice · MMA Public Safety Equipment / Law Enforcement Procurement Practice · September 2026

Market Trends

Tenders Now Specify Traceability And Deployment Recording

Agencies facing oversight review need to reconstruct a deployment in detail, and that requirement has moved from policy documents into procurement specifications. Tenders increasingly call for munition batch marking, discharge logging, recording integration and data retention that meets evidentiary standards. Suppliers who treated equipment and record-keeping as separate businesses are finding that agencies want them bundled from one vendor with one audit trail. Around 23% of tenders now carry accountability requirements, and in jurisdictions with an active oversight body the figure is considerably higher. Single-vendor audit trails are now the requirement.
Market Impact: Renews 1,900 vehicles over period

Protective Standards Revision Obsoletes Existing Agency Stock

Revisions to helmet impact, visor optical and respiratory protection standards have made stock that remains physically serviceable no longer compliant, which forces replacement ahead of wear. National institute standards in the United States and European harmonised standards both moved within the last five years, and agencies cannot deploy non-compliant equipment without accepting liability. The commercial effect is a replacement wave independent of usage, worth roughly 19% of annual protective equipment demand, and it favours suppliers certified early against the new standards. Replacement here is compliance-driven rather than wear-driven in any sense.
Market Impact: Protective items reach 54% of spend

Market Opportunities and Growth Drivers

Asian Public Order Vehicle Fleet Renewal Adds High-Value Units

Public order vehicles including water cannon variants are the highest-value items in the category, and fleets across East Asia and South Asia are reaching replacement age simultaneously. Units acquired in the 2000s are being retired, and replacements carry far more content: onboard recording, water management systems, communications integration and improved crew protection. Average unit pricing sits around USD 610,000, so each fleet decision moves regional figures noticeably. Roughly 1,900 vehicles across the two regions are due for replacement over the forecast period. Each fleet award reshapes a regional figure on its own.
Market Impact: Refuses 11% of licence applications

Officer Injury Liability Drives Protective Equipment Specification Upward

Agencies carry workers compensation and civil liability exposure when officers are injured in public order deployments, and that exposure has driven specification upward faster than operational requirements alone would justify. Occupational safety functions now participate in procurement, and they specify against certified impact and respiratory standards rather than against operational preference. The effect is a shift toward higher-cost certified equipment and shorter replacement intervals, currently averaging 8.4 years. Protective equipment already accounts for roughly 54% of category spend. Safety functions now specify against certified standards rather than any operational preference.
Market Impact: Defers decisions 14 months typically

Market Restraints and Challenges

Export Licensing Makes Addressable Market Supplier-Dependent

European Union rules restrict trade in certain law enforcement goods and require authorisation for others, and national due diligence practice adds further variation. Roughly 11% of licence applications are declined or withdrawn across reporting jurisdictions. The root cause is that the same product can be assessed differently depending on the exporting state's policy, so addressable market depends on supplier nationality rather than on product characteristics. Suppliers are responding through in-country manufacturing arrangements, portfolio segmentation by licence category, and concentrating on uncontested protective categories instead. Product characteristics have little to do with the outcome.
Market Impact: Accountability appears in 23% of tenders

Political Scrutiny Defers Agency Procurement Decisions Indefinitely

Procurement in this category attracts public and legislative attention that most equipment purchases do not, and agencies facing scrutiny frequently defer rather than defend a decision. The root cause is that the purchase itself is read as a statement of intent, independent of what the equipment is. Commercially this makes pipeline forecasting unusually unreliable, with deferrals often measured in years rather than quarters. Suppliers are mitigating by weighting portfolios toward protective and occupational safety categories, and by supplying accountability content that makes a procurement easier to defend publicly. Forecasting pipeline here is genuinely unreliable.
Market Impact: Adds 19% of protective demand
3 additional market trends, 4 additional growth drivers, and 2 additional restraints and challenges are covered in the full report. Contact sales@marketmindsadvisory.com to access the complete intelligence.

Segment CAGR and Growth Architecture

Equipment is segmented here by category, because category determines the supplier industry, the certification regime and the buying function inside an agency. Mixing category with deployment scenario or agency type creates groups that no procurement document recognises. Six categories cover the field from body protection through to accountability systems, and both growth rates and margins differ sharply across them.
riot-control-equipment-market-market-share-analysis-1790025800887

Deployment Accountability And Recording Systems

Growing at 9.0%, half again the market rate of 6.0%, this category existed only as separate record-keeping practice five years ago. It exists as equipment now because agencies must reconstruct deployments for oversight bodies and courts, which requires munition batch marking, discharge logging, recording integration and evidentiary data retention. The buyers are legal and professional standards functions as often as operational ones, which changes the sale entirely. Margins are the best in the category because pricing is compared against litigation exposure rather than against hardware. Suppliers from the protective equipment and munitions industries are both poorly equipped to build this, which has opened the field to technology entrants. Pricing logic here has no hardware comparator.
CAGR 9.0%

Public Order Vehicles And Water Cannon

These are the highest-value items procured in the category, averaging around USD 610,000 per unit, and growth of 7.1% reflects fleet renewal across East Asia and South Asia rather than any expansion in fleet size. Replacement units carry considerably more content than those they succeed: onboard recording, water management and metering, communications integration and improved crew protection. The supplier base comes from fire appliance and specialist vehicle building rather than from protective equipment, and the two industries barely compete with each other. Procurement cycles are long and politically visible, which makes individual awards slow but the resulting fleet relationships durable. Fleet relationships here outlast any individual award by a considerable margin.
CAGR 7.1%
Full segment breakdown across 6 segments available in the complete report.

Regional Architecture and Country Demand Map

Demand follows agency size and procurement cycle rather than population. East Asia leads because public security agencies there operate the largest equipped forces and are renewing vehicle fleets acquired two decades ago, while Western markets spend more per officer on certified protective equipment. Both patterns matter commercially.

East Asia

Scale of equipped force puts this region first. Chinese public security agencies maintain the largest equipped establishment anywhere and are working through a vehicle fleet renewal cycle covering units acquired in the 2000s, which alone represents substantial value at current unit pricing. Domestic manufacturers supply almost all of it, and the market is effectively closed to external participants, which matters for how the addressable figure should be read. Japanese and South Korean procurement is smaller but technically demanding, weighted toward certified protective equipment and recording integration. Growth of 7.1% sits above the market rate, driven by vehicle renewal and domestic manufacturing capability expanding into export markets. Domestic supply remains effectively closed to outsiders.
Share: 28% | CAGR: 7.1% (2026 to 2036)

North America

Liability rather than operational demand drives spending here. United States agencies face civil and workers compensation exposure that has pushed protective equipment specification upward and replacement intervals downward, and occupational safety functions now sit in procurement decisions alongside operational commanders. Accountability content has advanced furthest in this region, with recording integration and deployment logging appearing in tenders well ahead of other markets, largely because litigation makes the business case obvious. Canadian procurement follows similar standards on a smaller scale. Growth of 5.5% is slightly below the market rate, reflecting a well-equipped base where replacement rather than expansion drives volume. Litigation makes the accountability business case obvious here in a way it is not elsewhere.
Share: 24% | CAGR: 5.5% (2026 to 2036)
Regional intelligence for 5 additional markets available in the complete report: Western Europe, South Asia and Pacific, Latin America, Middle East and Africa, Eastern Europe. Contact sales@marketmindsadvisory.com.
riot-control-equipment-market-country-cagr-analysis-1790025801407

Where Equipment Suppliers Actually Earn Margin

Unit volume is the visible revenue in this market and rarely the profitable part. Certification timing, accountability content and licence-clean portfolio structure decide delivered margin instead. The four levers below reflect positions participants have used to improve economics measurably rather than to win volume on price. Certification is where most of it starts. Volume rarely decides it.

Certify Against Revised Standards Before Competitors Do

Standards revisions obsolete serviceable agency stock and force replacement, and the supplier certified first sells into a window where alternatives are not yet available. That window is worth roughly 19% of annual protective equipment demand. Suppliers certifying early have realised pricing around 16% above the level reached once competitors caught up, and they captured framework agreements that then ran for years. The requirement is monitoring standards committees and funding test programmes against requirements that are not yet mandatory, which most competitors will not do. Framework agreements won in that window then run for years.
Market Impact: Early certification pricing runs roughly 16% higher overall

Bundle Accountability Content Across Equipment Categories

Agencies want munition batch traceability, discharge logging and recording integration from one vendor with one audit trail, and almost no supplier can deliver that across categories today. Firms that can do it price against litigation exposure rather than against hardware, which is a fundamentally different conversation. Bundled accountability content has raised programme value by roughly 27% on comparable equipment scope. The obstacle is that protective equipment and munitions suppliers both lack the software capability, so this generally requires acquisition or partnership rather than internal development. Neither industry holds the software capability internally at all.
Market Impact: Bundled programme value rises roughly 27% higher overall

Structure The Portfolio Around Licence-Clean Categories

Roughly 11% of export licence applications are declined or withdrawn, and the assessment attaches to product category and destination rather than to supplier conduct. Suppliers who separate licence-sensitive lines from uncontested protective and occupational safety products can pursue markets that a mixed portfolio closes off entirely. Participants doing this report addressable market roughly 31% larger than competitors whose catalogue triggers refusal at the category level. The cost is organisational complexity and forgoing revenue in the contested lines. Whole geographies open or close on this one organisational decision, which is a larger prize than the forgone contested revenue.
Market Impact: Addressable market widens by roughly 31% or more

Sell Through Occupational Safety Rather Than Operations

Protective equipment purchases are increasingly justified by injury liability and workers compensation exposure rather than by operational preference, and occupational safety functions now participate in specification. Suppliers who sell on certified injury reduction data reach a budget that is easier to defend publicly and less exposed to political deferral. Programmes sold through this route have closed roughly 2.2 times faster than equivalent operationally-led procurements. It requires injury and certification evidence that most suppliers have never assembled. Agencies defending a purchase publicly much prefer a safety justification to an operational one.
Market Impact: Procurement cycles close roughly 2.2 times faster overall

Who Controls the Margin Pool

Concentration is the lowest in public safety equipment, with the top five holding 29% of unit shipment volume and contracted procurement value, the basis used throughout this section. Fragmentation here has industrial origins rather than transitional ones: protective gear comes from textile and helmet industries, vehicles from fire appliance builders, and munitions from a separate manufacturing base, and none of those industries has any commercial reason to consolidate with the others.
Competitive activity currently turns on three dimensions. Certification timing against revised standards decides who sells during replacement windows. Accountability capability decides who can meet the requirements now appearing in around 23% of tenders. And licence-clean portfolio structure decides which markets a supplier can address at all. Established participants are generally strong on the first, weak on the second, and highly variable on the third depending on nationality.

Rankings will move through the accountability layer, and the entrants are not traditional competitors. Recording, logging and traceability are software and systems problems that protective equipment and munitions manufacturers are poorly placed to solve internally. Technology firms already selling recording systems to law enforcement hold the natural advantage, and several incumbents have begun partnering rather than attempting to build the capability themselves.
riot-control-equipment-market-company-positioning-matrix-1790025801937

Competitive Moat and Risk Dimensions

SAFARILAND GROUP

Moat: Breadth Across Certified Protective Categories

Safariland covers more certified protective categories than any competitor, which matters because agencies increasingly prefer single-vendor framework agreements covering helmets, body protection and duty equipment together. That breadth also spreads certification test costs across a wide catalogue, giving the firm better economics on each standards revision than a single-category specialist can achieve.
SAFARILAND GROUP

Risk: Thin Accountability Systems Capability

The company's strength is in physical protective equipment, and the fastest-growing requirement is recording, logging and traceability software that sits well outside that competence. Building it internally means competing with technology firms already embedded in law enforcement recording, and partnering means conceding the highest-margin content in the category to somebody else.
AVON PROTECTION

Moat: Respiratory Certification Depth

Avon Protection's position rests on respiratory protection certification across multiple national regimes, which is among the most demanding technical qualifications in the category and one that agencies will not compromise on. Certification depth here creates genuine switching cost, because an agency that has trained and fit-tested against one system does not change it casually or cheaply.
AVON PROTECTION

Risk: Narrow Category Exposure

Concentration in respiratory protection means the firm depends on a single category's replacement cycle and standards calendar, with limited ability to offset a slow year elsewhere. It also leaves the company outside the framework agreements that reward breadth, and outside the accountability content that is reshaping how agencies structure procurement altogether.

Players Tracked

Prominent Players

Safariland Group
Combined Systems
Avon Protection
Rosenbauer International
Condor Non-Lethal Technologies

Other Key Players

Axon Enterprise
Byrna Technologies
PepperBall
NonLethal Technologies
Verney-Carron
Rheinmetall
MSA Safety
Point Blank Enterprises
Paulson Manufacturing
Damascus Protective Gear
Albert Ziegler
Katmerciler
Streit Group
Norinco
ISPRA

Recent Developments

JUNE 2025

Major agency framework agreement specifies munition traceability and deployment logging

A large metropolitan agency awarded a multi-year framework agreement requiring batch-level munition traceability and deployment logging alongside equipment supply. The award was a competitive procurement rather than any corporate transaction, and it made accountability content a scored evaluation criterion rather than optional additional scope for bidders.
Signal: Scoring accountability content directly rewards suppliers who can deliver it and penalises those treating it as an option
OCTOBER 2024

Protective equipment maker partners with recording systems firm on integrated tenders

A protective equipment manufacturer formed a commercial partnership with a law enforcement recording systems provider to bid integrated accountability and equipment packages. The arrangement was a partnership rather than a merger or acquisition, and it acknowledges that neither industry holds the other's capability internally at all today.
Signal: Confirms that incumbents will partner for accountability capability rather than attempt to build it themselves from scratch
FEBRUARY 2025

European harmonised standard revision triggers agency protective stock replacement

A revised European harmonised standard for public order helmets and visors took effect, rendering serviceable existing stock non-compliant for new deployment. This was a regulatory development rather than any corporate event, and it created a replacement window for suppliers already certified against the new revision requirements.
Signal: Standards revisions now drive more replacement volume than physical wear does across European agency protective stock today

What Drives Delivered Equipment Cost

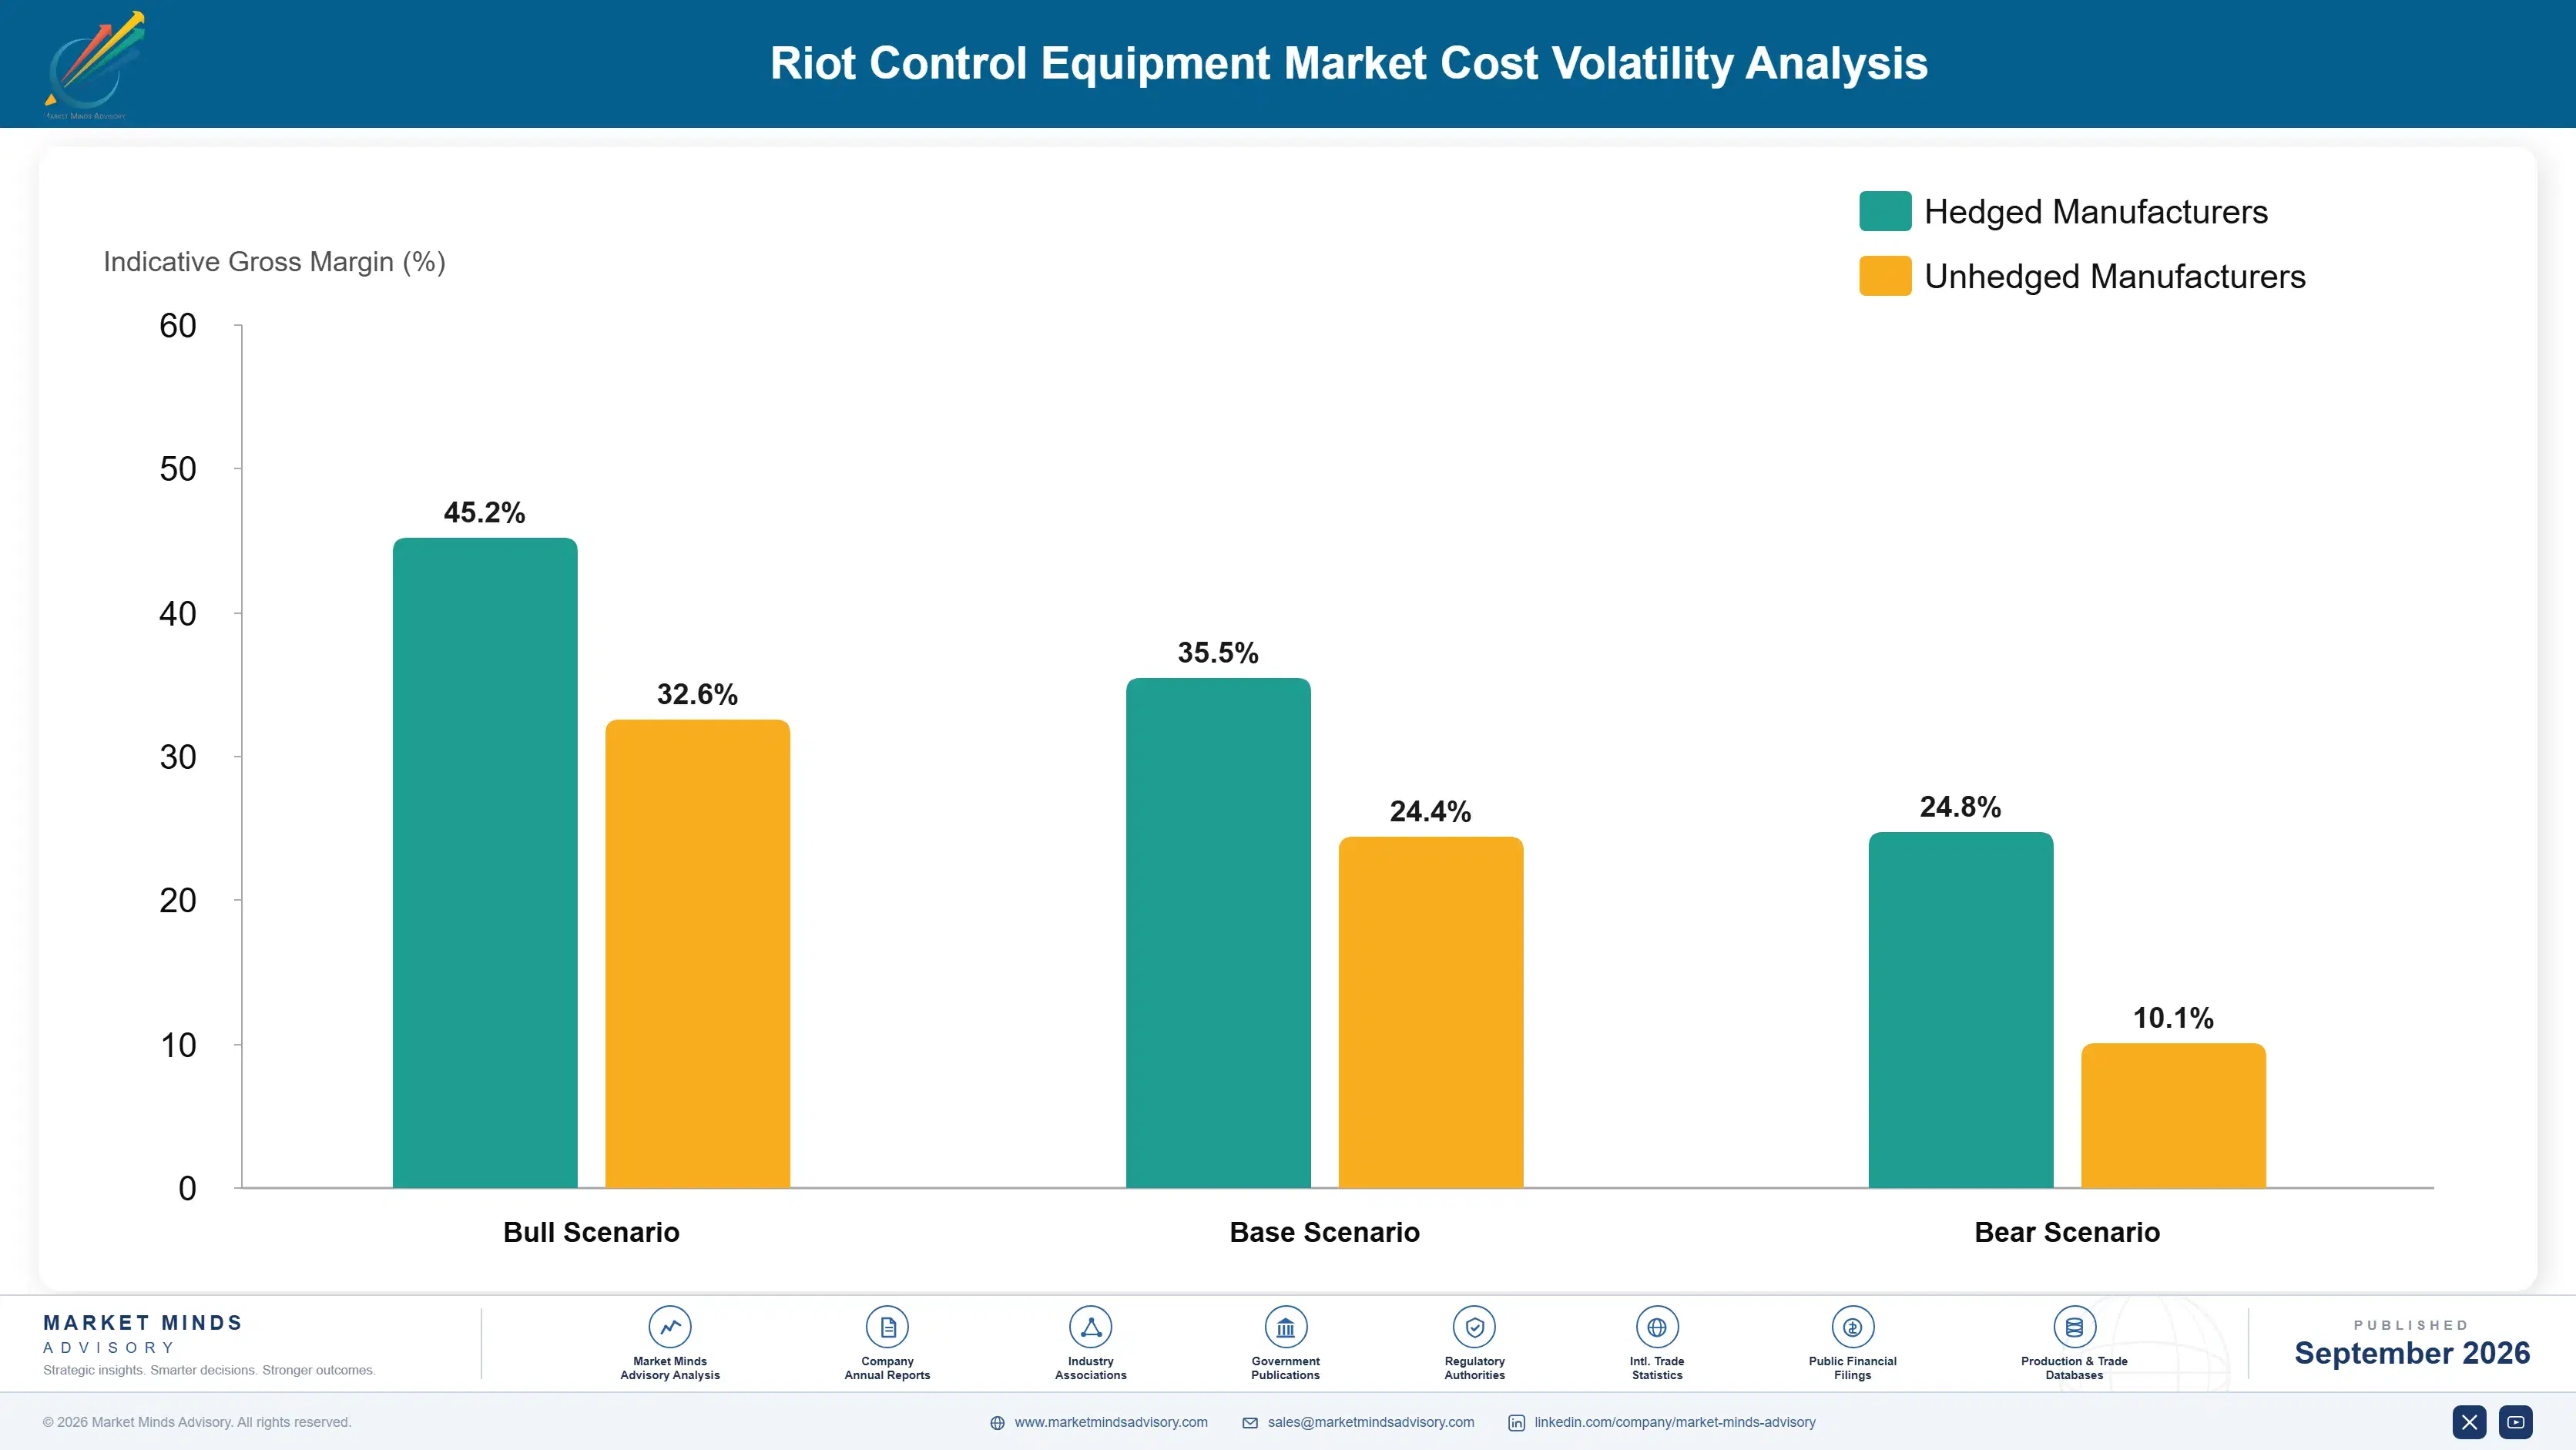
Four inputs dominate. Polycarbonate for visors and shields runs roughly 18% of cost of goods sold. Aramid and high-performance fibre about 21%, vehicle chassis and hydraulic content close to 14% on the vehicle lines, and assembly plus certification testing labour the remaining 47%. Polymer and fibre production sits in Western Europe, the United States, Japan and China, with European output the most energy-exposed.
European energy costs produced the clearest recent squeeze. Polycarbonate and aramid production are both energy-intensive, and the gas and electricity price movements through 2022 and 2023 shown in EIA data pushed resin and fibre pricing up sharply for European converters in particular. MSA Safety and Rosenbauer both discussed input cost and supply conditions in annual reporting. Agencies buying on fixed-price framework agreements were largely insulated, so suppliers absorbed it.

Exposure separates by product mix and by manufacturing location, which is the competitive point. Suppliers weighted toward visors, shields and body protection carry polymer and fibre cost directly under framework pricing. Vehicle builders carry chassis and hydraulic cost but pass more through on long-lead contracts. European manufacturers face higher energy-linked cost than Asian competitors, which shows as margin compression rather than price movement because framework pricing is fixed.
riot-control-equipment-market-cost-volatility-analysis-1790025802134

Index framework agreements to published polymer and fibre indices

Agency framework agreements are traditionally fixed price across three to five years, which places every input movement on the supplier. Indexation to published resin and fibre indices shifts that risk back, and energy-driven increases since 2022 have made procurement officers more receptive. Resistance comes from budget rules that require price certainty, which is a genuine constraint, not a negotiating position.

Qualify secondary polymer and fibre sources across regions

Qualifying alternative resin and fibre suppliers in different regions removes the single-origin exposure that energy cost movements create. Certification makes this slower than in most industries, because a material change on a certified helmet or visor requires retesting against the standard. Suppliers who qualified secondary sources before 2022 held pricing while competitors renegotiated, which is the clearest evidence it pays.

Shift mix toward accountability content with minimal material exposure

Recording, logging and traceability content carries almost no polymer or fibre exposure and better gross margin than the equipment it attaches to. Moving mix in that direction hedges input cost and improves earnings quality simultaneously. The barrier is capability rather than intent: protective equipment and munitions manufacturers generally have to partner or acquire to obtain the software content at all.

Portfolio Architecture for Margin Defence

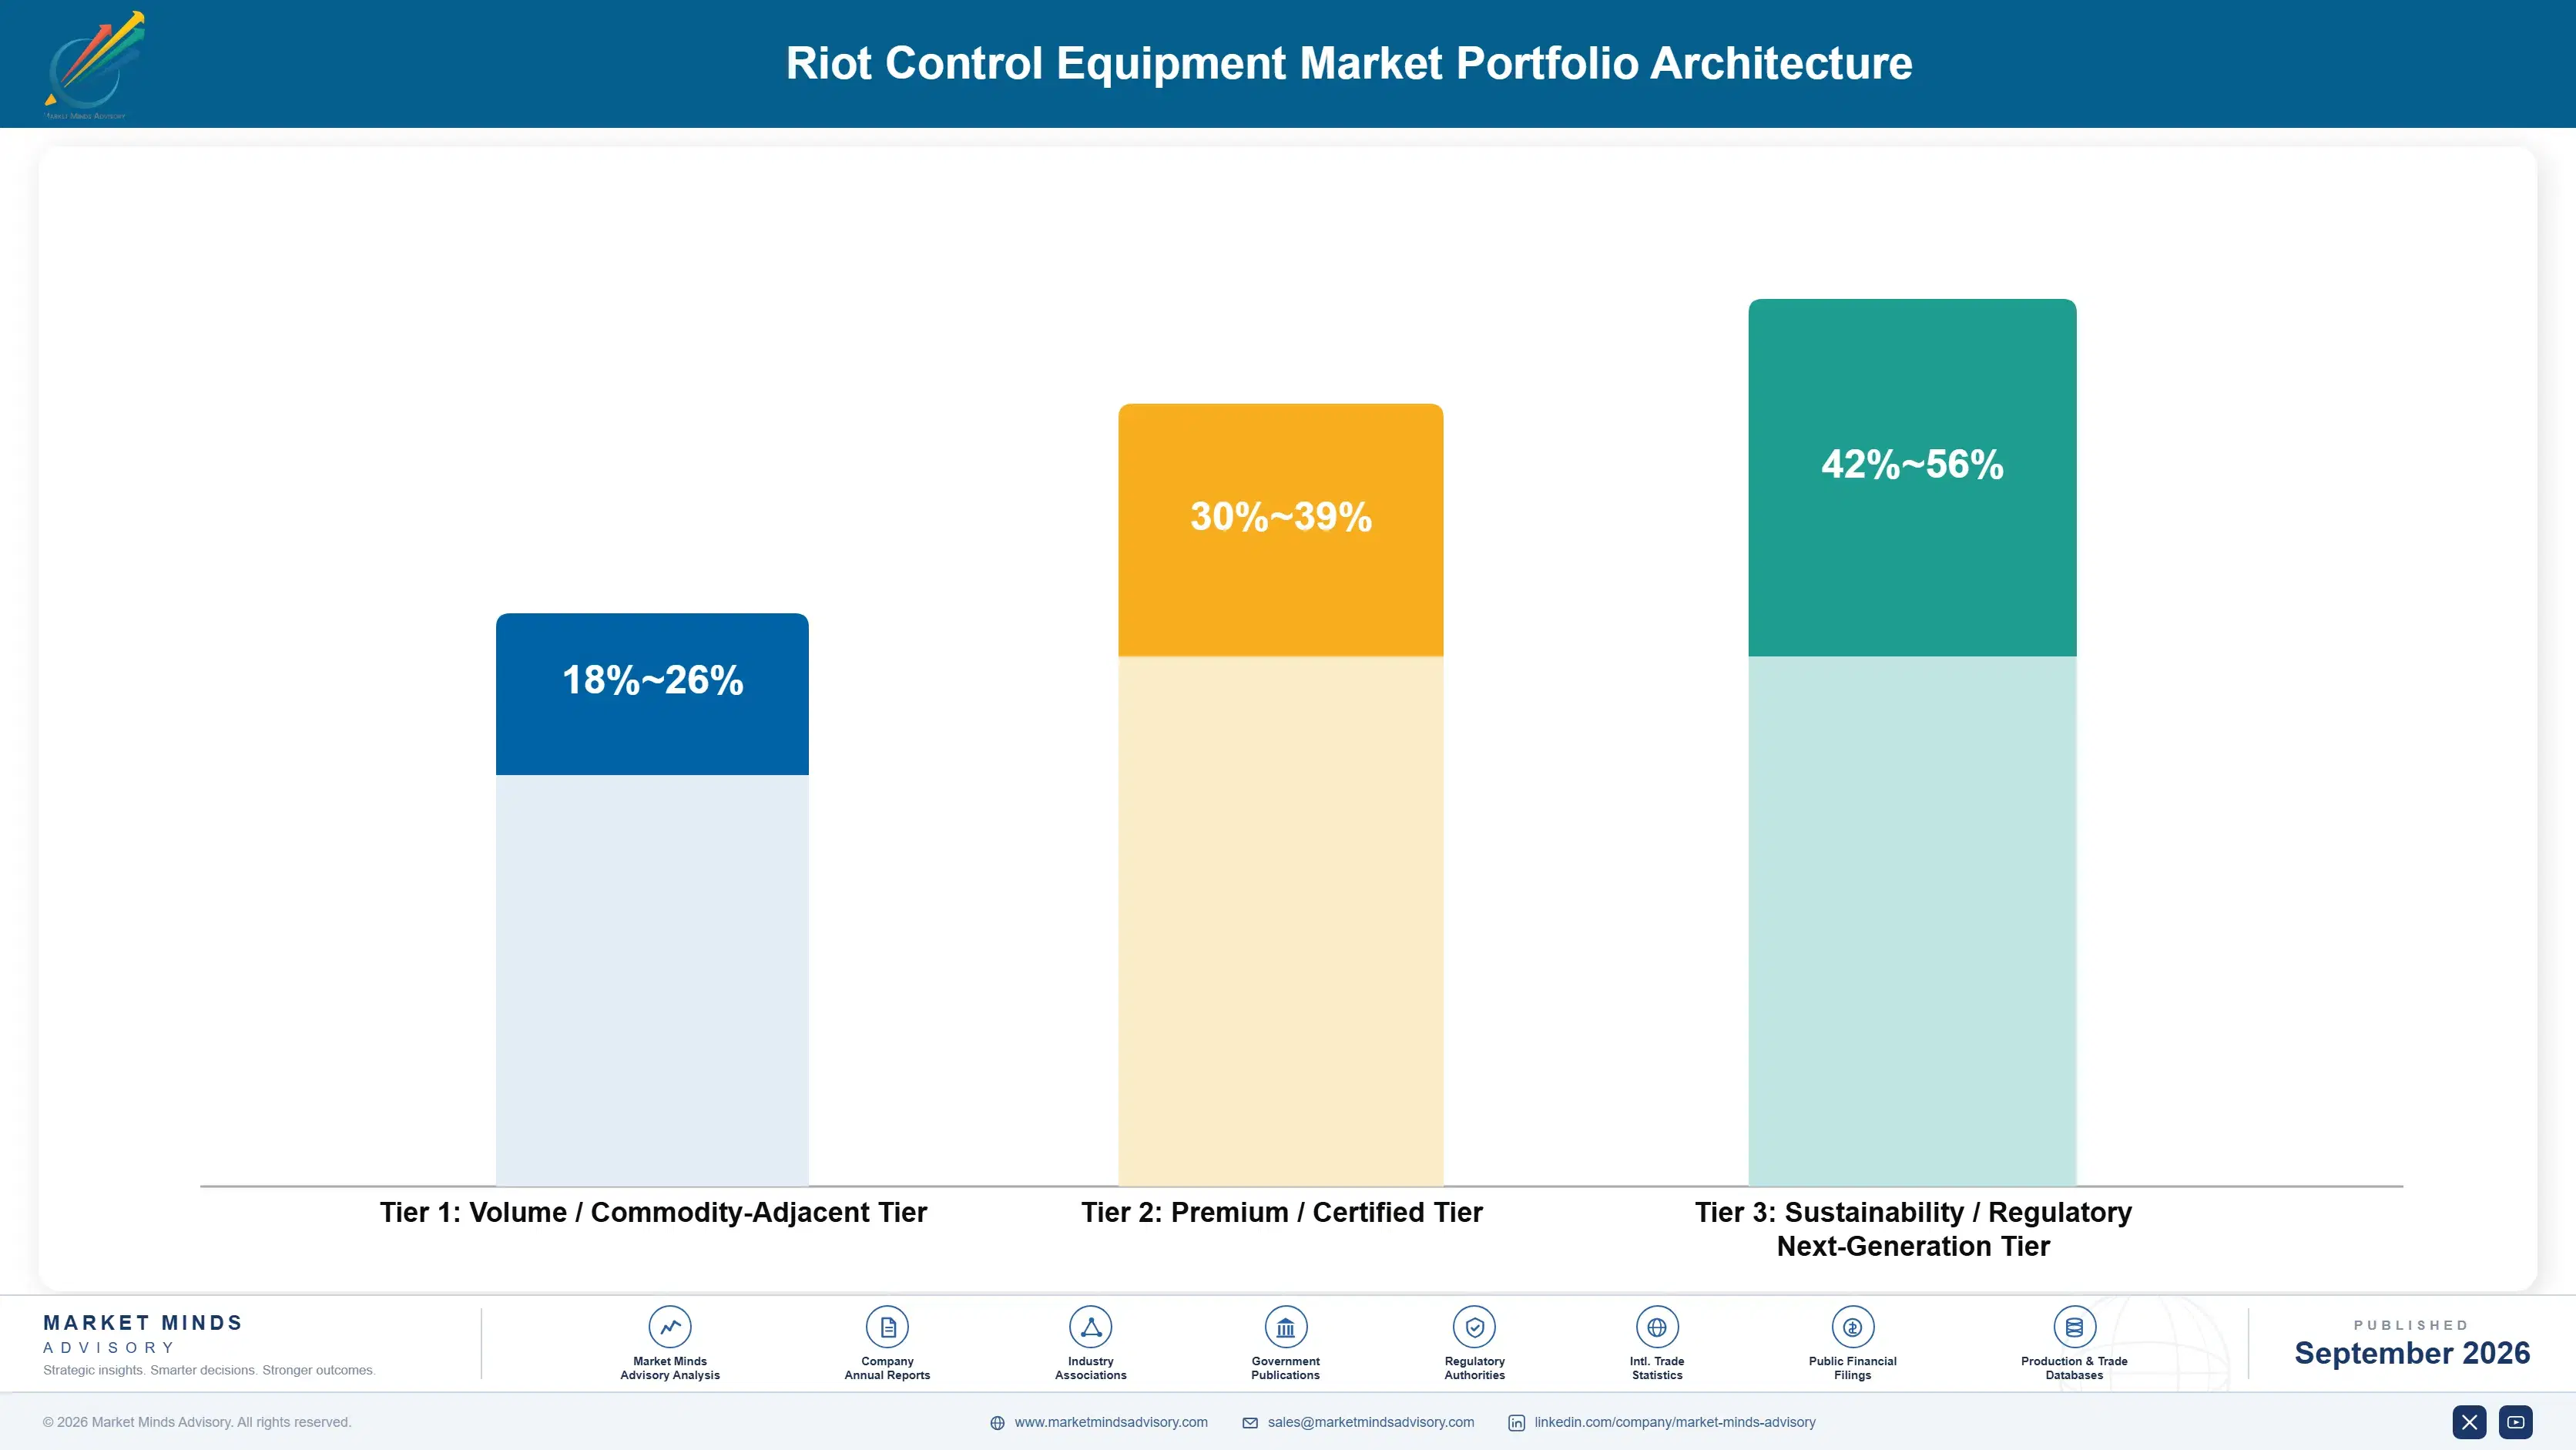
Margin architecture here sorts by certification and by how the buyer justifies the purchase. Commodity protective items and standard munitions sit at the bottom, competitive on price against published specifications. Certified helmets, respiratory protection and public order vehicles sit in the middle at better economics, defended by qualification depth and switching cost. Accountability content sits at the top, priced against litigation exposure rather than against hardware cost.
The volume-versus-premium tension runs along an unusual axis. Volume means protective equipment bought in quantity against standards, where many suppliers qualify and framework pricing is fixed for years. Premium means accountability content and certified respiratory systems, both of which require capability most participants do not hold: software in one case, multi-regime certification in the other. Very few suppliers are credible in both, and the ones attempting breadth have generally bought their way in.

High-value pools concentrate in three places: accountability systems where pricing is compared against legal exposure, respiratory protection where certification depth creates real switching cost, and public order vehicles where fleet relationships outlast individual awards. None of the three is decided on unit price, which is precisely why the margins hold up.

Volume / Commodity-Adjacent Tier

Body protection suits, limb guards, shields and standard munitions bought in quantity against published specifications. Many qualified suppliers and fixed framework pricing compress margin. The eight point range reflects whether the supplier converts its own materials or buys finished components in.
Gross Margin: 18-26%

Premium / Certified Tier

Certified helmets and visors, respiratory and eye protection, and public order vehicles. Certification depth and training investment create genuine switching cost here. The nine point range tracks how many national certification regimes a supplier holds, which changes both addressable market and pricing power.
Gross Margin: 30-39%

Sustainability / Regulatory / Next-Generation Tier

Deployment accountability systems, munition traceability and recording integration. Pricing is compared against litigation exposure rather than hardware cost, and few suppliers hold the capability. The fourteen point range reflects immature pricing across a small number of delivered programmes with no benchmark.
Gross Margin: 42-56%
riot-control-equipment-market-portfolio-architecture-1790025802636

High-value Sub-segments and Strategic Watch-out

Deployment Accountability Systems

Highest margin in the category and fastest growing at 9.0%, bought by legal and professional standards functions rather than by operational ones. Pricing is set against litigation exposure rather than hardware cost. The twelve point range reflects genuinely immature pricing across very few delivered programmes to date anywhere.
Gross Margin: 44-56%

Certified Respiratory Protection

Strong margin with steady growth at 5.9%, protected by multi-regime certification and by fit-testing and training that agencies will not repeat casually. Switching cost here is the highest in the category. The eight point range reflects how many national certification regimes the supplier actually holds.
Gross Margin: 34-42%

Certified Helmets And Visors

The volume core of profitable revenue, growing at 4.8% but repeatedly accelerated by standards revisions that obsolete serviceable stock. Early certification against a revision is worth roughly 16% on pricing. Margin depends on whether the supplier converts its own polymer or buys finished visor components in.
Gross Margin: 28-36%

Standard Less-Lethal Munitions

Growing at 6.3% but carrying the category's export licensing exposure and nearly all of its reputational risk for a minority of total spend. Several suppliers are now deliberately reducing their weight here. The eight point range reflects how differently licensing compliance cost is absorbed across different exporting jurisdictions.
Gross Margin: 20-28%

What Agencies Keep Buying

The annuity here is replacement driven by standards rather than by wear. Protective equipment stock turns over on roughly 8.4 year cycles, and standards revisions repeatedly shorten that by making serviceable equipment non-compliant. Agencies cannot deploy non-compliant protective gear without accepting liability, so the replacement is not discretionary. Suppliers holding current certification and a framework agreement capture it without competing, which makes certification the most durable revenue position available.
Adoption depth varies sharply by agency type. Large metropolitan agencies with oversight bodies run the full range, buying certified protective equipment, vehicles and accountability content continuously because each element helps them defend deployments afterwards. Smaller municipal and regional forces buy protective equipment only, replace it late, and treat accountability content as unaffordable. National gendarmerie and central police organisations sit differently again: large fleet purchases, long cycles, and procurement driven by government capital programmes rather than operational budgets.

The buying function has shifted markedly. Equipment was once specified by operational commanders assessing what worked in deployment. Occupational safety and legal functions now sit in the decision, and their questions are about certified injury data and evidentiary record-keeping, which no operational catalogue was ever written to answer.
riot-control-equipment-market-end-use-penetration-index-1790025803141

Where Suppliers Should Commit

These are among the four positions where our research anticipates prominent divergence between winners and laggards over the coming forecast period. Each is grounded in the demand model, the regulatory perimeter, and the announced capacity pipeline.
01 / CERTIFICATION TIMING DISCIPLINE

Certify against pending standards before they become mandatory

Standards revisions obsolete serviceable agency stock and force replacement independently of wear, and that replacement wave is worth roughly 19% of annual protective equipment demand each time it occurs. Suppliers certified first sell into a window where competitors have no compliant product, realising pricing around 16% above the level once the field catches up. The requirement is monitoring standards committees and funding test programmes against requirements that are not yet mandatory, which most competitors simply decline to fund at all.
02 / ACCOUNTABILITY CAPABILITY ACCESS

Partner for recording and traceability rather than building it

Accountability systems grow at 9.0%, half again the market rate of 6.0%, and they carry the best margins in the category because agencies price them against litigation exposure rather than hardware cost. Protective equipment and munitions manufacturers have no software capability and cannot build it in the time the market allows. Partnership or acquisition with firms already supplying law enforcement recording is the only realistic route, and bundled accountability content has raised programme value by roughly 27% on comparable scope.
03 / LICENCE PORTFOLIO STRUCTURE

Separate licence-sensitive lines from uncontested protective products

Around 11% of export licence applications are declined or withdrawn, and the assessment attaches to product category and destination rather than to supplier conduct. Suppliers who separate licence-sensitive lines from protective and occupational safety products can address markets that a mixed catalogue closes off entirely, reporting addressable market roughly 31% larger than competitors without that separation. The cost is organisational complexity and forgone revenue in contested lines, which is a considerably smaller price to pay than losing whole geographies outright.
04 / BUYING FUNCTION ALIGNMENT

Sell through occupational safety, not operational command

Protective equipment now accounts for roughly 54% of total category spend, and it is increasingly justified through injury liability and workers compensation exposure rather than through operational preference. Suppliers presenting certified injury reduction evidence reach a budget that is far easier to defend publicly and much less exposed to political deferral. Programmes sold this way have closed roughly 2.2 times faster than operationally-led procurements, and the requirement is certified injury evidence that most suppliers have simply never assembled at all.

Engagement Snapshot From the Field

A live engagement with an industry participant carrying material or product regulatory and market exposure ahead of a defining policy shift, showing how our research translates into a defensible multi-year portfolio strategy.
MARKET MINDS ADVISORY · CLIENT ENGAGEMENT SUMMARY
Riot Control Equipment Producer Strategic Portfolio Review and Transition Roadmap 2026·Investment Scenario on Riot Control Equipment Exposure Evaluation 2025-26
CLIENT PROFILE
A European manufacturer of protective equipment and less-lethal products with roughly USD 180 million in annual revenue (client-reported, unverified by MMA), split about 62% protective and 38% munitions and launchers (client-reported, unverified by MMA). The company held certifications across three national regimes but had seen export licence refusals close off several markets entirely, including two where its protective products alone would have been uncontroversial.
STRATEGIC CHALLENGE
Management treated the licence refusals as a political problem outside its control and had absorbed the lost revenue. The commercial reality was that the refusals attached to catalogue categories, not to the company's conduct, so a commercial separation might reopen markets for the protective line. The board also had no answer to accountability requirements appearing in domestic tenders.
MMA APPROACH
MMA reviewed licence outcomes by destination and product category across three exporting jurisdictions, modelled addressable market under a separated portfolio structure, and assessed build, partner and acquire routes to accountability capability. Expert interviews with agency procurement and professional standards staff established how accountability content was actually being scored in tender evaluations.
KEY FINDINGS
  1. Licence refusals attached to munitions categories in every case examined, and the protective line alone would have been authorised in six of the eight closed destinations.
  2. Separating the two businesses commercially would reopen addressable market worth roughly USD 44 million annually, most of it in protective products the company already manufactures.
  3. Accountability content was scored in nine of eleven recent domestic tenders reviewed, and the client had lost four of those on that criterion alone without recognising why.
  4. Building recording and traceability capability internally was assessed at around 34 months, considerably longer than the commercial window the tender evidence allowed for.
CLIENT PROFILE
A European manufacturer of protective equipment and less-lethal products with roughly USD 180 million in annual revenue (client-reported, unverified by MMA), split about 62% protective and 38% munitions and launchers (client-reported, unverified by MMA). The company held certifications across three national regimes but had seen export licence refusals close off several markets entirely, including two where its protective products alone would have been uncontroversial.
STRATEGIC CHALLENGE
Management treated the licence refusals as a political problem outside its control and had absorbed the lost revenue. The commercial reality was that the refusals attached to catalogue categories, not to the company's conduct, so a commercial separation might reopen markets for the protective line. The board also had no answer to accountability requirements appearing in domestic tenders.
MMA APPROACH
MMA reviewed licence outcomes by destination and product category across three exporting jurisdictions, modelled addressable market under a separated portfolio structure, and assessed build, partner and acquire routes to accountability capability. Expert interviews with agency procurement and professional standards staff established how accountability content was actually being scored in tender evaluations.
KEY FINDINGS
  1. Licence refusals attached to munitions categories in every case examined, and the protective line alone would have been authorised in six of the eight closed destinations.
  2. Separating the two businesses commercially would reopen addressable market worth roughly USD 44 million annually, most of it in protective products the company already manufactures.
  3. Accountability content was scored in nine of eleven recent domestic tenders reviewed, and the client had lost four of those on that criterion alone without recognising why.
  4. Building recording and traceability capability internally was assessed at around 34 months, considerably longer than the commercial window the tender evidence allowed for.
RECOMMENDED STRATEGY
Phase 1: Phase 1 (seven months): Separate the protective and munitions businesses commercially and file licence applications for protective products in the six viable destinations. Phase 2: Phase 2 (13 months): Partner with a law enforcement recording systems provider and bid integrated accountability packages in domestic tenders. Phase 3: Phase 3 (22 months): Certify the protective range against pending standards revisions ahead of mandatory dates and reprice framework agreements accordingly.
OUTCOME
Separation reopened four destinations within eleven months, adding roughly USD 21 million in protective revenue in the first year (client-reported, unverified by MMA). The recording partnership won two domestic tenders the company would previously have lost, and early certification against one pending standard secured a framework agreement at improved pricing.

Frequently Asked Questions

Foundational context covering the market sizes, CAGR, scope, country, region and competition that inform every finding below. This section is provided to cover basics and most often pre-purchase conversations, answered from the MMA Primary Research Dataset.

What is the current size of the Riot Control Equipment Market?

The market was worth USD 4.6 billion in 2025 and reaches USD 4.9 billion in 2026. That covers protective equipment, respiratory protection, less-lethal launchers and munitions, public order vehicles and accountability systems.

How large will the Riot Control Equipment Market be by 2036?

MMA forecasts USD 8.8 billion by 2036, an increase of USD 3.9 billion over the 2026 base. That represents an expansion multiple of 1.80 times across the forecast period.

What is the CAGR for the Riot Control Equipment Market 2026 to 2036?

The base case CAGR is 6.0%, with a bull case of 7.2% if accountability content becomes a standard tender requirement across most jurisdictions. The bear case of 4.8% assumes scrutiny defers procurement instead.

Which segment is growing fastest?

Deployment accountability and recording systems grow at 9.0%, half again the market rate of 6.0%. Agencies need to reconstruct deployments for oversight bodies, which requires batch traceability, logging and evidentiary data retention.

Who are the major companies in the Riot Control Equipment Market?

Safariland Group, Combined Systems, Avon Protection, Rosenbauer International and Condor Non-Lethal Technologies lead on unit shipment volume and contracted procurement value. Axon Enterprise, MSA Safety and Rheinmetall follow.

Which country is growing fastest?

India leads at 9.4%, driven by state police and central armed police organisations equipping at scale under indigenous procurement rules. Domestic producers have entered categories previously served by imports.

Report Segmentation Architecture

The full report scope spans multiple orthogonal segmentation dimensions, with cross-tabulated demand data provided for each dimension pair. Coverage extends further to regional breakdowns, trend trajectories, and the competitive detail needed to support segment-level decision-making.

By Equipment Category

  • Body Protection Suits And Limb Guards
  • Helmets, Visors And Shields
  • Respiratory And Eye Protection
  • Less-Lethal Launchers And Munitions
  • Public Order Vehicles And Water Cannon
  • Deployment Accountability And Recording Systems

By End-Use Industry

  • Metropolitan Police Agencies
  • National Gendarmerie And Central Police Organisations
  • Regional And Municipal Forces
  • Correctional And Custodial Services
  • Private Security And Critical Site Operators

By Commercial Dimension

  • Multi-Year Framework Agreements
  • Competitive Single Award Tenders
  • Government Capital Fleet Programmes
  • Export Sale Under Licence

By Region

  • North America
  • Western Europe
  • East Asia
  • South Asia and Pacific
  • Latin America
  • Middle East and Africa
  • Eastern Europe

Scope, Methodology, and Coverage

Every figure in this report is reproducible from documented input assumptions. The scope below maps the historical period, the forecast horizon, the segmentation dimensions, and the countries covered, alongside the underlying primary and qualitative methodology.
Historical Period
2020 to 2025
Forecast Period
2026 to 2036
Base Year
2025 (USD billions; MMA Primary Research Dataset, September 2026)
Market Definition
This report covers equipment procured by law enforcement and public order agencies for managing crowds and civil disturbance. Scope includes body protection suits and limb guards, helmets with visors and shields, respiratory and eye protection, less-lethal launchers and munitions, public order vehicles including water cannon, and deployment accountability systems covering recording, logging and munition batch traceability. Excluded are firearms and conventional ammunition, equipment procured by armed forces, general police uniforms and duty gear, custodial equipment, surveillance systems not tied to public order deployment, and training services.
Quantitative Units
USD billions (current prices); unit shipment volumes; vehicle unit pricing; agency replacement cycle length
Segmentation Dimensions
By Equipment Category; By End-Use Industry; By Commercial Dimension; By Region
Regions Covered
North America, Western Europe, East Asia, South Asia and Pacific, Latin America, Middle East and Africa, Eastern Europe
Countries Covered
USA, China, Germany, France, UK, Japan, South Korea, India, Australia, Canada, Brazil, Mexico, Indonesia, Vietnam, Thailand, Malaysia, UAE, Saudi Arabia, South Africa, Nigeria, Turkey, Poland, Netherlands, Italy, Spain, Sweden, Switzerland, Argentina, Colombia, Singapore, and additional markets relevant to this sector
Key Companies Profiled
Safariland Group, Combined Systems, Avon Protection, Rosenbauer International, Condor Non-Lethal Technologies, Axon Enterprise, Byrna Technologies, PepperBall, NonLethal Technologies, Verney-Carron, Rheinmetall, MSA Safety, Point Blank Enterprises, Paulson Manufacturing, Damascus Protective Gear, Albert Ziegler, Katmerciler, Streit Group, Norinco, ISPRA
Quantitative Methodology
Primary survey, n=3,800 respondents, Q4 2025, six countries; demand-side model with trade association cross-validation
Qualitative Methodology
47 expert interviews, Q4 2025; applied to validate demand model assumptions, identify emerging dynamics, and assess competitive positioning
Report Format
PDF and XLSX data workbook (Word format preview document)
Publisher
Market Minds Advisory
Report Code
MMA-2026-CON-907
Published
September 2026
Contact
sales@marketmindsadvisory.com | www.marketmindsadvisory.com

Purchase the full Riot Control Equipment Market Report (2026 to 2036).

The full report sizes riot control equipment across six categories and all seven regions, with unit shipment volumes and pricing behind every figure. It separates protective equipment spend from contested product categories throughout, because the two carry entirely different growth rates, buying functions and regulatory exposure. Competitive analysis covers 20 participants on shipment volume and contracted procurement value, including certification coverage by national regime. Export licensing outcomes are assessed by product category and destination, since addressable market in this sector depends on supplier nationality as much as on product. Accountability content is modelled as a distinct category with its own buyers and pricing logic.
Six-category sizing with unit shipment volumes
Protective spend separated from contested categories
Certification coverage mapped by national regime
Export licensing outcomes by category and destination
Accountability content modelled as distinct category
Twenty-participant assessment on shipments and procurement value

Built For The People Who Decide

From boardroom strategy to bench-side execution, this report is read cover-to-cover by leaders shaping the next decade of their industry, turning demand scenarios, market dynamics and valuation benchmarks into decisions.
CXOs/ Presidents/ VPs/ Managers
M&A and Corporate Development
Strategy Teams and R&D Heads
Procurement and Product Directors
Regulatory and Compliance Leaders
Investor Relations and Equity Analysts