Market Minds Advisory
Riboflavin Pigment Market

Riboflavin Pigment Market: Clean-Label Colorant Demand Meets Synthetic Dye Substitution

Clean-label food colorant demand and synthetic dye substitution are pulling riboflavin volume toward natural fermentation-derived grades nationwide, forcing legacy synthetic producers to defend feed additive contracts while chasing new capacity.

Lead Analyst

Lisa Gevelber

Published

September 2026

Make Smarter Decisions with Customized Research Insights

Request a free sample report and evaluate market opportunities, growth trends, and competitive dynamics relevant to your business needs.

2025 MARKET VALUE$0.5BMarket Size 2025
2036 FORECAST VALUE$1.0BBase Case , 2026 to 2036
CAGR 2026 TO 20366.5 %Bull 7.8% / Bear 5.2%
INCREMENTAL OPPORTUNITY$0.5BNet 10- year value creation
EXPANSION MULTIPLE1.87x2036 value over 2026 base
Strategic Levers
M&A Pipeline
Regional Outlook
Country Rankings
Competitive Intelligence
Segmental Deep-dive
Call-Us : 91 93563 13602

Executive Snapshot and Market Trajectory

Riboflavin is shifting from a commodity feed additive input toward a premium natural food colorant as clean-label reformulation demand accelerates across most major packaged food markets. Legacy synthetic producers are responding with faster fermentation-grade purification investment than the category has historically seen. Buyers increasingly expect this shift.
Natural fermentation-derived and clean-label certified organic grades are growing fastest, both commanding materially better margin than standard synthetic and feed-grade material. East Asia has emerged as the largest single regional market given China's dominant fermentation-based vitamin production base, and producers there have redirected capacity heavily toward food-grade purity standards. Food formulators and clean-label brands have expanded dedicated natural colorant sourcing relationships to accommodate this shift in buyer preference.
Competitively, the category remains moderately concentrated among a handful of global vitamin majors that also supply broader nutrition and pharmaceutical intermediate markets. Rising synthetic dye substitution demand is forcing legacy producers to expand natural food colorant capability rather than rely on feed additive volume alone. Consolidation among mid-sized regional producers is expected to continue as scale increasingly determines who can fund fermentation infrastructure and food-grade certification. That favors scale over smaller regional specialists here.
Market Definition
This report covers riboflavin (vitamin B2) used as a natural yellow food colorant, nutritional fortification ingredient, and feed additive across food, beverage, pharmaceutical, and animal nutrition applications. It excludes synthetic azo dyes and general vitamin premix products unrelated to riboflavin production.
Base Year Value
$0.5B in 2025 (MMA Primary Research Dataset, August 2026)
Forecast Period
2026 to 2036, eleven discrete annual values
CAGR
6.5% base case. Bull 7.8%. Bear 5.2%.
Fastest Growth Segment
Natural Fermentation-Derived Food Colorant Grade Riboflavin: 9.5% CAGR
Fastest Growth Country
India: 8.0% CAGR
Fastest Growth Region
South Asia and Pacific: 8.5% CAGR
Largest Region
East Asia: 30% of 2025 global value
Market Leaders
DSM-Firmenich, BASF SE, Archer Daniels Midland Company, CTC Bio Inc., Hubei Guangji Pharmaceutical Co. Source: MMA Analysis based on company annual reports.
Primary Survey
n=3,800 procurement and R&D decision-makers, Q4 2025, six countries
Methodology
Demand-side build-up, cross-validated against public data, 47 expert interviews

Riboflavin Pigment Market Forecast Scenarios

riboflavin-pigment-market-trends-size-forecast-scenario-1787594061745
Between 2020 and 2025, riboflavin demand grew steadily as clean-label reformulation pulled the chemical into mainstream food colorant applications beyond its traditional feed additive and nutritional fortification uses. Producers that invested early in fermentation capacity during this period are better positioned for the growth phase now underway across most markets. That trend continued. Demand persisted.
The base case assumes 6.5 percent annual growth to 2036, anchored by three mechanisms: synthetic azo dye substitution pulling packaged food manufacturers toward natural riboflavin-based colorants, clean-label certification demand expanding as consumers scrutinize artificial ingredient lists, and feed additive demand growing steadily across expanding livestock and aquaculture production regions. Packaged food manufacturer specifications favoring natural colorants are reinforcing each of these mechanisms simultaneously across major markets. Investment continues broadly. Growth continues.
A bull case near 7.8 percent depends on clean-label reformulation and synthetic dye substitution accelerating faster than currently planned across major packaged food markets. The bear case near 5.2 percent assumes packaged food manufacturers delay reformulation, pressuring natural colorant demand specifically. Both scenarios hinge on how quickly packaged food manufacturers continue reformulating away from synthetic dyes. Demand persists. Growth persists.

Natural Colorant Economics and Reformulation Dynamics

Riboflavin sits at the intersection of legacy feed additive demand and surging natural food colorant purity requirements, and that tension is reshaping which grades producers prioritize. Natural fermentation-derived and clean-label certified material increasingly commands the margin that standard synthetic and feed-grade riboflavin cannot match, and food formulators reward suppliers who can document sourcing and purity clearly. Packaged food manufacturers are increasingly asking suppliers for sourcing documentation before granting approval.
MARKET CONCENTRATION (CR5)58%Top five vitamin majors together hold this combined share
AVERAGE SELLING PRICE$42/kg food-gradeReflects blended pricing across feed and food-grade tiers
TOP PRODUCING COUNTRY SHAREChina 28%Largest single national source of riboflavin production output
FEEDSTOCK COST SHARE36%Fermentation substrate and glucose feedstock costs dominate expense
FOOD-GRADE CERTIFICATION CYCLE10 monthsTime typically required to certify a new food colorant grade
TRADE INTENSITY34% cross-borderShare of output moving through international food ingredient channels
Commercially, the category rewards producers with strong fermentation and purification capability: strain optimization, food-grade certification, and clean-label documentation all matter more here than in most specialty chemical categories. Producers straddling both feed additive and food colorant grade lines capture materially better negotiating position with packaged food manufacturers than single-tier specialists. That advantage grows as food and feed customers consolidate supplier relationships to fewer capable partners.
Over the next decade, continued clean-label reformulation and synthetic dye substitution will keep reshaping the category. Producers slow to invest in food-grade fermentation capability risk losing contracts to more specialized competitors already positioned in fast-growing natural colorant niches. Consolidation among mid-sized regional producers is likely to accelerate as scale increasingly determines access to fermentation capital and food-grade certification infrastructure.
"Riboflavin used to be a feed additive nobody thought twice about. Now it's a clean-label colorant with a fermentation story behind it, and producers still selling synthetic material are losing that argument fast."
Director, Food Ingredients and Natural Colorants Practice · MMA Chemicals and Materials Practice · August 2026

Market Trends

Natural Food Colorant Grade Expansion Nationwide

Natural fermentation-derived riboflavin has expanded from niche specialty applications into mainstream packaged food colorant formulation since 2023, with several major food brands now specifying documented natural sourcing as a core reformulation standard replacing synthetic azo dyes. This shift is pulling volume toward grades that command materially better margin than standard feed-grade riboflavin, and legacy synthetic producers are building parallel fermentation-based production lines rather than cede that growing demand to specialty ingredient companies entering through clean-label partnerships. Adoption keeps broadening across most major packaged food manufacturing regions. Growth continues. Demand persists.
Market Impact: Adds 24% synthetic dye substitution growth
Clean-Label Certification Adoption Growing Rapidly Nationwide

Clean-label certified organic riboflavin has expanded meaningfully since 2023, as packaged food manufacturers seek documented organic sourcing to support broader clean-label marketing claims. MMA's primary survey found roughly 26 percent of packaged food formulators now specify clean-label certified riboflavin, up meaningfully from prior years, and several major producers have expanded dedicated certified organic production capacity in response to this rising demand. Food formulators increasingly request organic documentation before approving new riboflavin suppliers. Adoption keeps broadening across most major packaged food manufacturing regions and formulation categories. Growth continues too. Adoption broadens.
Market Impact: Lifts documentation requirement share to 37%

Market Opportunities and Growth Drivers

Expanding Global Synthetic Dye Substitution Demand

Global synthetic azo dye restriction and substitution has grown roughly 24 percent since 2023, directly benefiting riboflavin suppliers positioned to serve natural colorant reformulation demand. This regulatory and consumer-driven shift is redirecting packaged food formulation toward natural colorant supply chains, and producers with established food manufacturer relationships are capturing disproportionate share of this incremental demand. Smaller regional producers face a steeper path to capturing this growth without similar food manufacturer relationships. That growth is expected to continue as clean-label regulation keeps tightening globally across most markets. Growth persists. Adoption broadens.
Market Impact: Delays food-grade certification by 10 months

Rising Demand for Documented Natural Sourcing Standards

MMA's primary survey found 37 percent of packaged food manufacturers now require documented natural sourcing and fermentation origin data before qualifying a new riboflavin supplier, up from roughly 22 percent five years earlier, pushing producers to invest in traceability infrastructure rather than rely on feed-grade quality assurance alone. Several major food brands have begun requiring extended supplier audits before approving new sourcing relationships. That documentation requirement is raising the qualification bar for smaller regional riboflavin producers. Compliance costs are rising for smaller producers lacking dedicated quality assurance teams. Demand persists.
Market Impact: Adds 36 percent feedstock cost exposure

Market Restraints and Challenges

Lengthy Food-Grade Certification Process Timeline Barriers

Certifying a new riboflavin grade for food colorant use takes roughly 10 months under food safety regulatory standards, during which producers absorb fermentation capital costs without earning food-grade pricing. The root cause is the mandatory validation period designed to ensure consistent purity and traceability across production batches, and it discourages smaller operators from entering food-grade production entirely. Larger producers are mitigating this by pre-financing certification costs for contracted manufacturing partners. Regional impact varies considerably depending on how quickly financing structures can offset this delay. Growth continues regardless of this delay.
Market Impact: Adds colorant specs at 25+ brands

Fermentation Feedstock Cost Volatility Pressuring Margins

Fermentation substrate and glucose feedstock costs represent roughly 36 percent of production expense, and agricultural commodity prices have swung considerably since 2022 amid weather disruption affecting major grain-producing regions. The underlying driver is fermentation's dependence on agricultural feedstock pricing, which producers cannot control directly, and smaller processors lacking hedging capacity absorb this volatility more directly than integrated majors. Some producers are responding by diversifying feedstock sourcing across multiple grain types. Smaller processors lacking hedging capacity remain more exposed to ongoing feedstock price swings than integrated majors. Adoption keeps broadening despite this exposure.
Market Impact: Lifts clean-label certification rate to 26%
3 additional market trends, 3 additional growth drivers, and 4 additional restraints and challenges are covered in the full report. Contact sales@marketmindsadvisory.com to access the complete intelligence.

Segment CAGR and Growth Architecture

MMA segments the riboflavin market by production method and purity grade, the classification producers, food formulators, and feed buyers actually use for procurement decisions across synthetic, feed, and food colorant grades, rather than mixing in end-use industry logic. This lens keeps upstream production processes and downstream food-grade qualification decisions cleanly separated throughout the analysis.
riboflavin-pigment-market-trends-market-share-analysis-1787594062297

Natural Fermentation-Derived Food Colorant Grade Riboflavin

This segment covers high-purity riboflavin produced through fermentation and formulated specifically for natural food colorant applications, and it is growing fastest because packaged food manufacturers increasingly require documented natural sourcing that synthetic chemical grades cannot reliably deliver. Producers have responded by building dedicated fermentation-based purification infrastructure separate from standard synthetic processing, and several legacy synthetic majors have launched parallel fermentation-based capability rather than cede that growing demand to specialty ingredient companies entering through clean-label partnerships. Manufacturing natural food colorant grade riboflavin requires distinct fermentation controls and analytical testing capability separate from standard synthetic production, creating a meaningful barrier for synthetic-only processors trying to enter quickly. Several major food brands have committed to expanding this fermentation specification further through 2027.
CAGR 9.5%

Clean-Label Certified Organic Riboflavin

Riboflavin certified under organic and clean-label standards is the second-fastest growing segment, addressing packaged food manufacturer demand for ingredients that support broader clean-label marketing claims beyond documented purity alone. Producers are increasingly investing in dedicated certified organic production capacity to support this format, and several major food brands have begun specifying certified organic riboflavin as a standard procurement requirement. This segment commands a meaningful price premium over standard fermentation-derived grades, since brands seeking documented organic certification show less price sensitivity than typical ingredient buyers, giving producers investing in this format materially better margin per unit sold. Several major producers have committed to expanding organic-grade capacity further through 2027 across additional regions.
CAGR 8.5%
Full segment breakdown across 6 segments available in the complete report.

Regional Architecture and Country Demand Map

East Asia leads on fermentation manufacturing scale and vitamin production infrastructure, while South Asia and Pacific posts the fastest growth given expanding food manufacturing across the wider region. North America follows on clean-label reformulation depth. Latin America and Eastern Europe remain the smallest markets tracked here overall.

North America

US packaged food manufacturers have specified natural riboflavin colorant grades more aggressively than most other markets tracked in this report, and dense food ingredient infrastructure supports rapid adoption of fermentation-derived and clean-label formulations. Canada's smaller but stable market supplements US demand, particularly for feed additive applications. Producers here have been quickest to expand food-grade fermentation capacity, reflecting deep clean-label reformulation investment, and several major producers have committed to further expanding capacity through 2028. Producers with strong food manufacturer relationships are also using that credibility to accelerate new fermentation-grade qualification ahead of competitors lacking comparable research investment. That advantage is expected to widen further over the next several years across most major food markets.
Share: 22% | CAGR: 6.0% (2026 to 2036)

Western Europe

German, French, and UK food manufacturers have carried structured natural colorant qualification processes for over a decade, and EU food additive regulation harmonization since 2022 has made cross-border compliance considerably simpler for producers. Consumer and food manufacturer willingness to pay for documented natural sourcing runs higher here than in most other regions, and several major producers have committed to expanding food-grade capacity further through 2028. Discount ingredient suppliers entering the category are also widening the addressable buyer base. Producers here have also begun disclosing feedstock sourcing origin on request, a transparency standard not yet common in most other regions covered in this report. Growth here still lags East Asia meaningfully in absolute volume terms.
Share: 18% | CAGR: 5.0% (2026 to 2036)
Regional intelligence for 5 additional markets available in the complete report: East Asia, South Asia and Pacific, Latin America, Middle East and Africa, Eastern Europe. Contact sales@marketmindsadvisory.com.
riboflavin-pigment-market-trends-country-cagr-analysis-1787594062807

Purity Depth and Food Formulator Channel Priorities

Producers seeking margin expansion beyond volume growth are pursuing four commercial levers: natural food colorant capacity investment, clean-label certification development, direct food manufacturer contracts, and emerging market capacity expansion that captures more value than standard feed grades. These levers matter most for mid-sized producers competing against integrated majors, since purity depth determines which suppliers food and feed buyers choose.

Natural Food Colorant Capacity Investment Program Strategy

Producers investing in dedicated fermentation-based food colorant infrastructure are capturing an additional 20 to 28 percent margin premium over standard feed-grade material, driven by food manufacturer willingness to pay for documented natural sourcing. This lever requires significant capital investment in fermentation and purification infrastructure, but it opens access to food colorant contracts that feed-grade producers cannot compete for, and several major producers have already secured multi-year supply agreements with expanding packaged food brands. Retailers merchandising these food-grade products alongside standard formulations are seeing faster qualification approval. Growth continues. Demand persists.
Market Impact: Adds 20 to 28 percent margin premium overall

Clean-Label Certification Development Program Strategy Rollout

Producers pursuing certified organic and clean-label certification are accessing premium food formulation applications commanding materially better margin than standard fermentation-derived grades, capturing an estimated 22 percent price premium according to MMA's primary survey. This lever requires distinct certification and documentation investment separate from standard production, favoring producers already active in organic ingredient markets, but the payoff has proven substantial for early movers securing dedicated supply agreements with premium food brands. That credibility gap is widening each year across most major food formulation markets currently. Adoption keeps broadening. Demand persists. Growth persists.
Market Impact: Captures roughly 22 percent higher price premium overall

Direct Food Manufacturer Contract Development Strategy

Producers bypassing distributor intermediaries by contracting directly with packaged food manufacturers are capturing 16 to 22 percent better margin per ton than through standard wholesale distribution channels. This requires dedicated technical account management and reliable food-grade supply, which favors larger producers, but mid-sized processors are increasingly forming regional supply consortiums to meet the volume and certification commitments large food brands typically require before signing direct contracts. Consistency across large-volume orders matters considerably to these food manufacturer customers specifically. Several regional supply consortiums formed specifically to aggregate volume from smaller producers to meet these thresholds.
Market Impact: Improves per-ton margin by 16 to 22 percent

Emerging Market Manufacturing Capacity Expansion Strategy

Producers building dedicated fermentation capacity in India and Southeast Asia are capturing the region's rapidly growing food manufacturing demand ahead of competitors still serving the market through imports alone, securing an estimated 18 percent cost advantage on landed product versus imported material. This lever demands significant capital investment in local manufacturing infrastructure, but it positions producers to capture the primary volume growth engine for the category over the coming decade. Several major producers are accelerating similar investments to avoid ceding this growth to regional competitors. Scale matters here. Demand persists.
Market Impact: Secures roughly 18 percent local landed cost advantage

Who Controls the Margin Pool

The top five riboflavin producers hold roughly 58 percent combined share, a moderately concentrated structure reflecting the category's tie to large-scale fermentation manufacturing infrastructure. DSM-Firmenich and BASF operate at a scale challengers cannot easily match, but the gap to natural-colorant-focused mid-sized producers is narrowing as clean-label credibility increasingly rivals raw manufacturing scale. Regional Asian players are also gaining ground given proximity and cost advantages specifically.
Competitive activity currently centers on three dimensions: expanding natural food colorant fermentation capacity to capture clean-label demand, developing certified organic and clean-label channel relationships, and building manufacturing capacity in India and Southeast Asia ahead of food manufacturing growth. Producers are also racing to secure long-term food manufacturer contracts before competitors. That race is intensifying fastest in Indian and Southeast Asian food manufacturing corridors.

Emerging pressure is coming from specialty natural ingredient companies entering through clean-label partnerships, which compete on documented sourcing rather than production scale, and from regional Asian producers expanding domestic capacity rapidly. Rankings could shift meaningfully over the next several years if these challengers keep converting share from producers slower to premiumize. Investors are watching this shift closely for signs of accelerating consolidation activity.
riboflavin-pigment-market-trends-company-positioning-matrix-1787594063331

Competitive Moat and Risk Dimensions

DSM-FIRMENICH

Moat: Global Vitamin Manufacturing Scale

DSM-Firmenich operates dedicated vitamin fermentation and manufacturing facilities across dozens of countries, giving it feedstock cost advantages and food manufacturer relationships regional competitors cannot replicate quickly. This scale lets it supply both feed additive and premium food colorant formulations from the same integrated operations, spreading capital cost over far greater volume than smaller producers can achieve.
DSM-FIRMENICH

Risk: Slower Emerging Market Pivot

DSM-Firmenich's established developed-market manufacturing footprint creates organizational inertia that slows its pivot toward emerging market capacity investment where food manufacturing growth is concentrated. Regional Asian producers increasingly offer comparable food-grade purity at lower cost, which puts DSM-Firmenich at a competitive disadvantage in the fastest-growing corridors.
CTC BIO INC.

Moat: Fermentation Technical Depth

CTC Bio built deep fermentation process engineering expertise over decades, giving it technical credibility with food manufacturers that newer entrants struggle to replicate quickly. Its established clean-label certification track record creates switching costs that lock in long-term supply relationships more durably than standard commercial contracts.
CTC BIO INC.

Risk: Limited Feed Additive Presence

CTC Bio's relatively limited feed additive product line constrains its ability to capture the broader livestock nutrition segment increasingly demanding cost-effective riboflavin formulations. This leaves growth concentrated in food colorant applications alone, exposing the company more directly to packaged food cycle risk than more diversified competitors.

Players Tracked

Prominent Players

DSM-Firmenich
BASF SE
Archer Daniels Midland Company
CTC Bio Inc.
Hubei Guangji Pharmaceutical Co.

Other Key Players

Zhejiang Medicine Co.
Vitablend Nederland B.V.
Jubilant Life Sciences
Zhejiang NHU Company
Shandong Luwei Pharmaceutical
Sichuan Guangda Vitamin
Fooding Group Limited
Guangdong Vitamin Factory
Taiwan Chelsea Pharmaceutical
Ningxia Kaiwei Vitamin
Kemin Industries
Lonza Group
Zhejiang Garden Biochemical High-Tech
Nutreco N.V.
Sanofi Chimie

Recent Developments

MARCH 2025

DSM-Firmenich Expands Natural Food Colorant Capacity in China

DSM-Firmenich announced expanded natural food colorant grade riboflavin production capacity at a Chinese manufacturing facility, aiming to meet rising demand from packaged food manufacturers seeking documented natural sourcing. The expansion targets customers converting from synthetic dyes toward natural colorants. Analysts expect competitors to respond with similar capacity announcements within months.
Signal: Confirms clean-label demand is driving capacity investment across the ingredient industry. Rivals are expected to follow with comparable investments soon.
SEPTEMBER 2024

CTC Bio Signs Long-Term Food Manufacturer Supply Agreement

CTC Bio signed a multi-year supply agreement with a major packaged food manufacturer developing next-generation clean-label product lines, securing dedicated food-grade riboflavin production capacity. The agreement is a long-term commercial supply contract, not an acquisition or joint venture. Terms of the multi-year commitment were not fully disclosed publicly.
Signal: Shows packaged food manufacturers increasingly locking in dedicated natural colorant supply. Expect similar food manufacturer supply deals to follow.
JANUARY 2025

BASF Acquires Regional Southeast Asian Fermentation Producer

BASF completed the acquisition of a mid-sized Southeast Asian fermentation producer with existing manufacturing capacity, expanding its regional footprint to serve growing food manufacturing demand in the area directly. Financial terms of the transaction were not disclosed publicly by either party. Scale mattered here. Terms remained confidential.
Signal: Signals global majors are pursuing regional acquisition to secure Southeast Asian manufacturing access. Further consolidation in Southeast Asia appears likely.

Fermentation Feedstock and Certification Cost Pressure

Fermentation substrate and glucose feedstock inputs represent roughly 36 percent of processor cost of goods sold, sourced primarily from major grain-producing regions in North America, Europe, and China. Food-grade certification and analytical testing costs add a further meaningful slice of total input cost that standard feed-grade categories simply do not carry. Costs vary somewhat by region and formulation type.
The 2022 to 2023 agricultural commodity price cycle pushed fermentation substrate costs up roughly 30 percent year over year according to USDA and European Commission agricultural market data, forcing several smaller processors to absorb margin compression rather than pass costs through to price-sensitive feed buyers. IEA-tracked energy cost spikes during the same period compounded pressure on fermentation and drying operations specifically. Producers without hedging arrangements absorbed the impact directly.

Exposure varies considerably by player type: producers with diversified feedstock sourcing and long-term supply agreements are materially better insulated than those relying on spot market purchases, and this gap has widened since the 2022 price cycle. Smaller regional processors lacking capital to fund food-grade certification face a durable cost disadvantage against DSM-Firmenich and BASF that is difficult to close without external financing support.
riboflavin-pigment-market-trends-cost-volatility-analysis-1787594063527

Multi-Year Feedstock Supply Contracts

Producers are increasingly signing three to five year fixed-price contracts directly with agricultural cooperatives, smoothing input cost volatility across multiple cycles rather than buying feedstock on the spot market. This approach has become standard among mid-sized processors lacking balance sheet capacity to hedge exposure through financial instruments alone. Terms typically run three to five years.

Feedstock Source Diversification Strategy

Shifting feedstock sourcing across multiple grain types reduces direct exposure to any single agricultural commodity price swing entirely for a growing share of total production volume across producers' broader operations. Several major producers have accelerated diversification investment specifically in response to recent commodity price volatility. That shift is accelerating each year across most major producers currently.

Shared Food-Grade Certification Consortiums

Several mid-sized processors have formed shared food-grade certification consortiums to spread testing and certification cost across multiple companies, reducing the capital burden any single producer must carry alone. This collaborative approach has proven especially attractive to producers lacking the scale to fund testing independently. Shared costs typically run below what any single mid-sized producer would spend alone.

Portfolio Architecture for Margin Defence

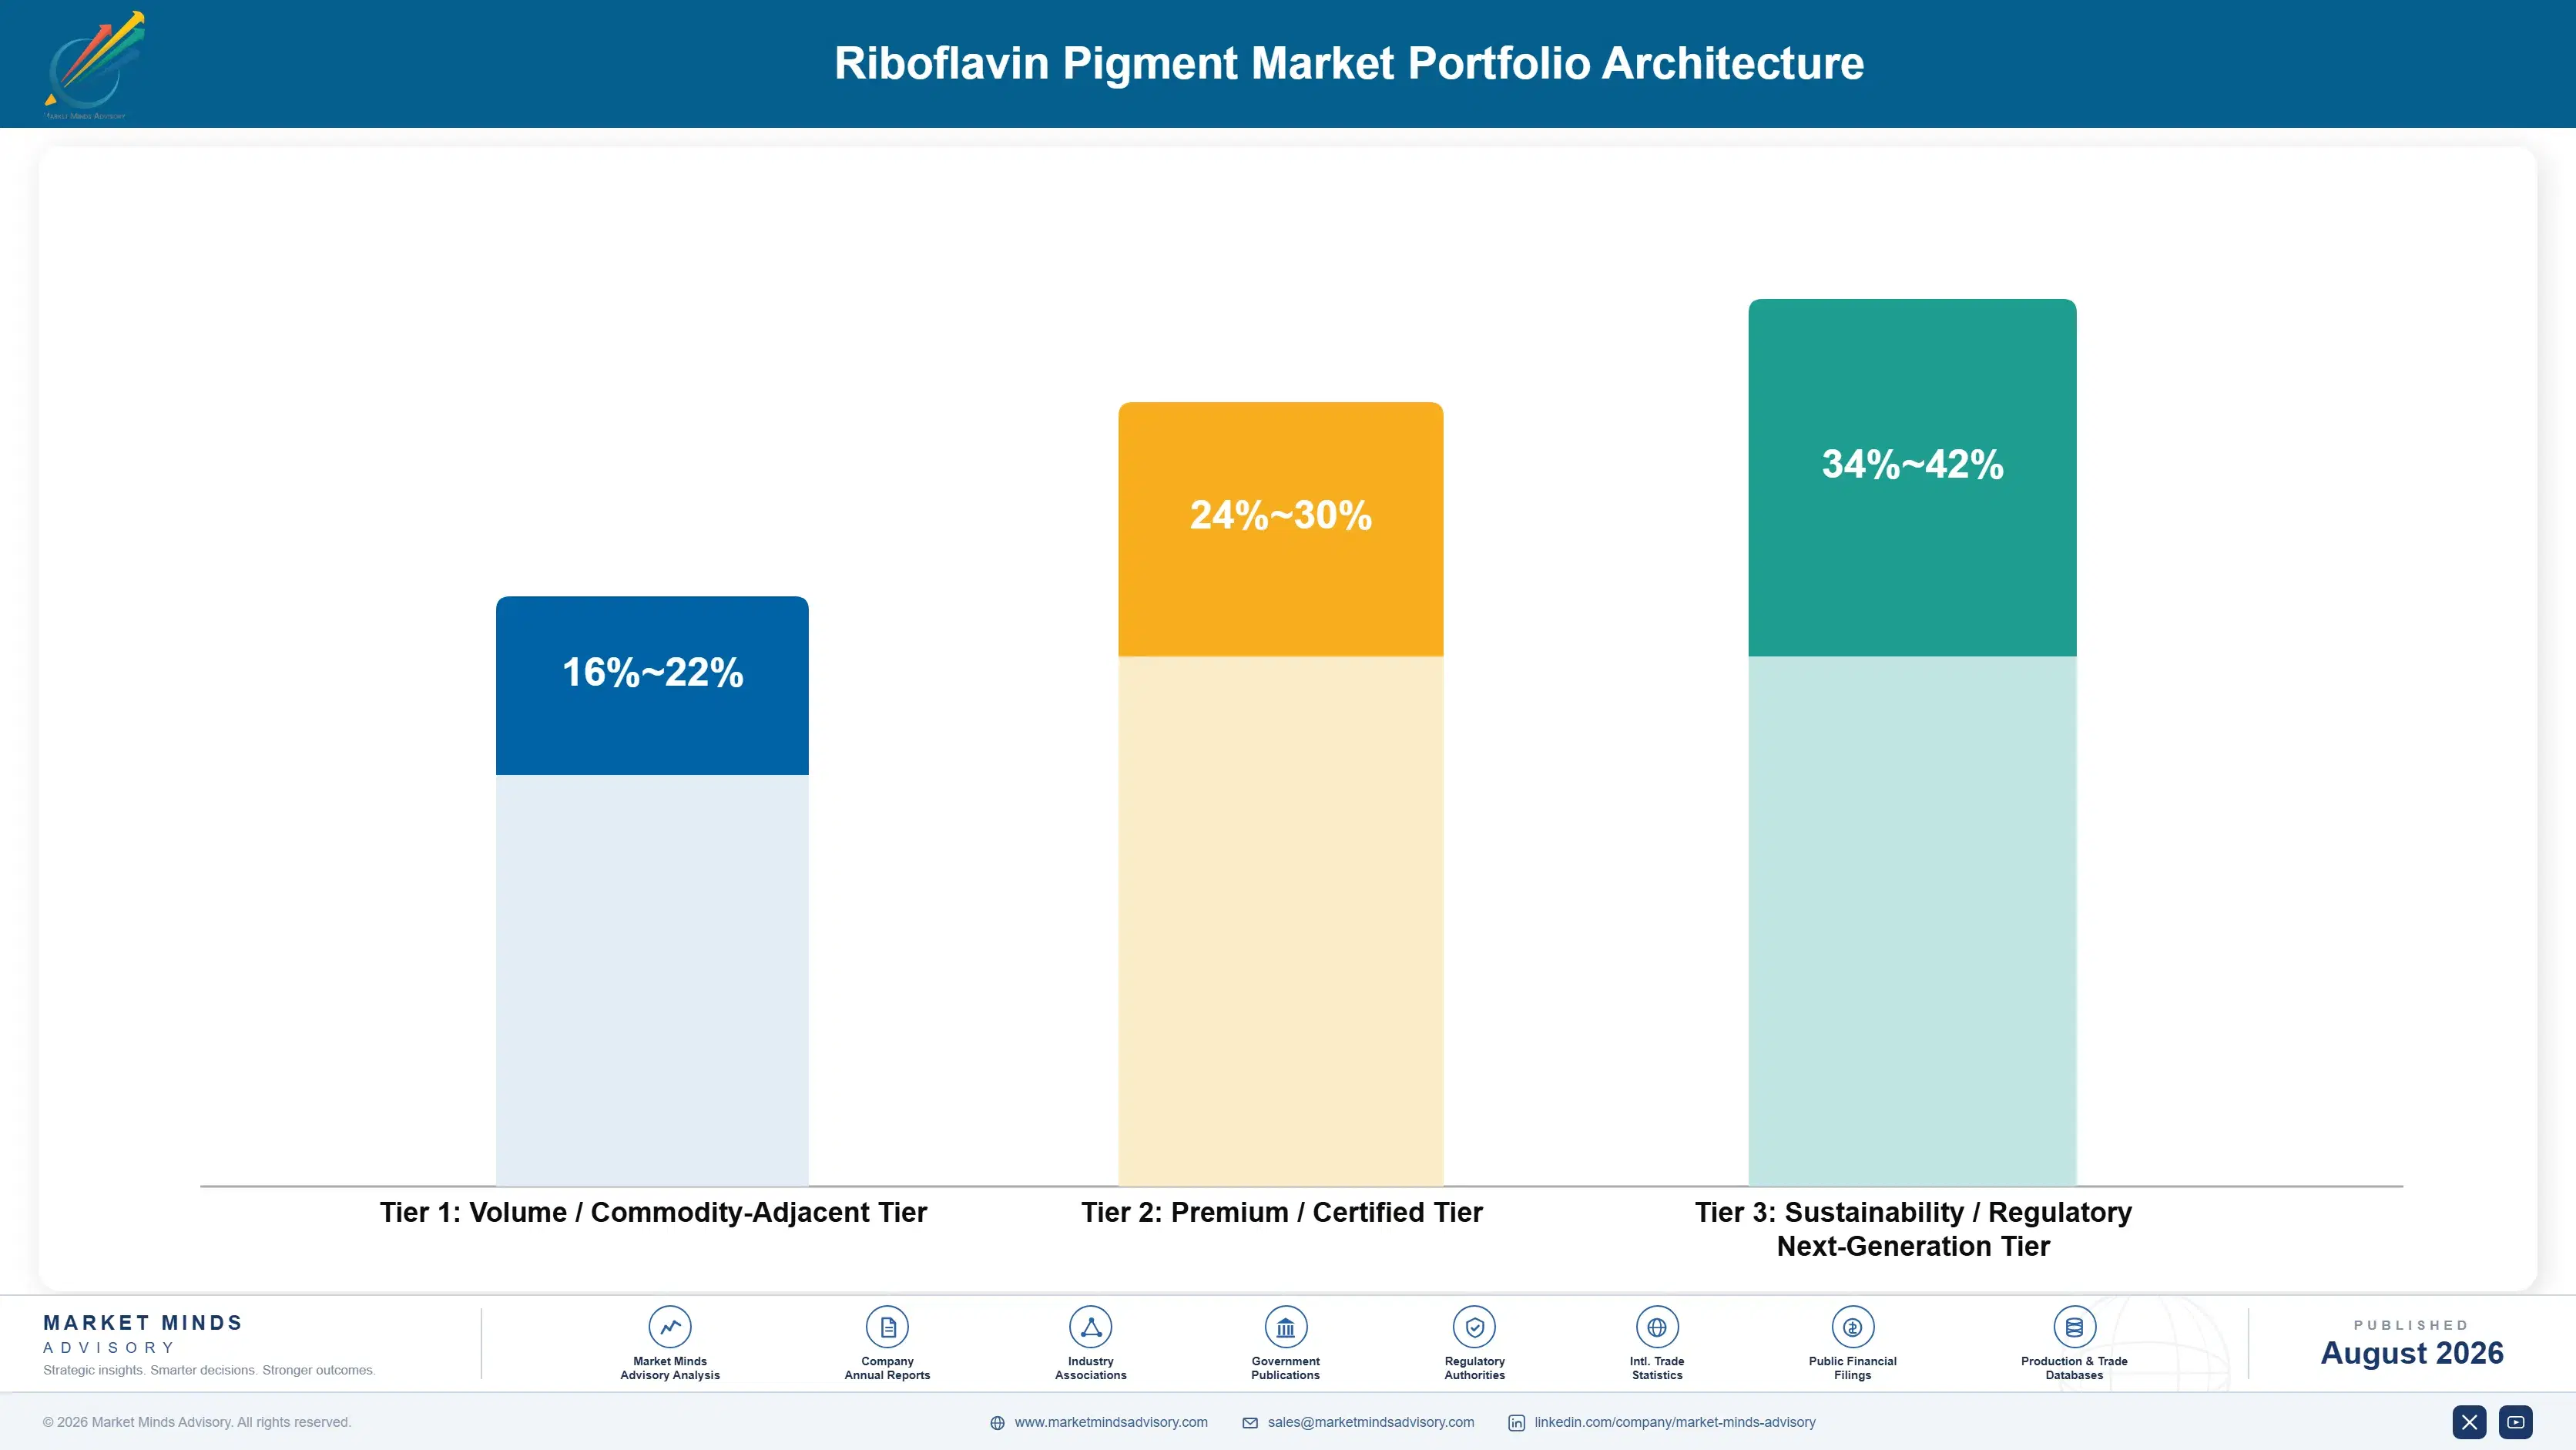
MMA's three-tier portfolio architecture separates standard feed-grade material from certified premium fermentation-derived formulations and next-generation clean-label products, with gross margins ranging from the high teens for feed grades to well above 34 percent for certified organic lines. Producers positioned across all three tiers capture more total margin than single-tier specialists. Segment-level margin data is drawn from MMA Estimate, derived from primary survey data covering 47 expert interviews in Q4 2025.
The tension between volume and premium is built into how the category operates: chasing volume growth through standard feed-grade contracts tends to compress margin per ton, while natural colorant and clean-label formats sacrifice total addressable volume for materially better unit economics. Mid-sized producers attempting to serve both ends simultaneously often end up under-resourced in each, losing volume-tier price competitiveness while failing to match premium-tier purity credibility.

High-value margin pools concentrate in natural food colorant and clean-label certified products, both of which command premiums the standard feed-grade channel cannot match. Producers that under-invest in these pools risk ceding the most profitable share of the category to smaller, more nimble specialists. Building dedicated fermentation and certification capability requires patient capital, which favors larger integrated producers.

Volume / Commodity-Adjacent Tier

Standard synthetic and feed-grade riboflavin sold through mainstream livestock nutrition contracts, competing primarily on price and supply reliability rather than differentiated purity. Producers here depend on scale and consistent throughput to defend already-thin per-ton margins against new capacity.
Gross Margin: 16-22%

Premium / Certified Tier

Pharmaceutical and standard fermentation-grade riboflavin carrying documented purity data, commanding a meaningful step-up in both contract price and gross margin over feed-grade formats. Buyers pay for consistency and traceability, not just active content, which favors established fermentation producers.
Gross Margin: 24-30%

Sustainability / Regulatory / Next-Generation Tier

Natural fermentation-derived food colorant and clean-label certified riboflavin targeting the most demanding food manufacturers, commanding the category's highest margins but requiring extensive certification, documented natural sourcing, and multi-year relationship building with formulator teams.
Gross Margin: 34-42%
riboflavin-pigment-market-trends-portfolio-architecture-1787594064031

High-value Sub-segments and Strategic Watch-out

Natural Fermentation-Derived Food Colorant Grade

The highest-margin, fastest-growing pool in the category, combining documented natural sourcing with clean-label demand to command premiums standard feed-grade material cannot match, though volume remains modest relative to the broader category today and certification lead times constrain how quickly new supply can enter this tier.
Gross Margin: 34-42%

Clean-Label Certified Organic Riboflavin

A high-value pool growing at a steady pace, driven by packaged food manufacturer demand for documented organic sourcing, with margin well above standard fermentation-derived wholesale rates across most major markets, and growing shelf-label scrutiny is pulling more mainstream brands into this certified tier each passing year.
Gross Margin: 26-32%

Standard Synthetic and Feed-Grade Riboflavin

The volume core of the category, carrying the thinnest margins but the largest absolute revenue base, and the segment most producers depend on to fund investment into higher-margin food colorant and clean-label lines, even as its share of total category revenue slowly narrows over the forecast window.
Gross Margin: 16-20%

Synthetic Chemical-Grade Riboflavin for Legacy Feed Contracts

A strategic watch-out segment: legacy synthetic feed-grade supply that risks accelerated share loss if clean-label reformulation pressure spreads from food into premium animal nutrition, a shift several large feed formulators are already piloting, which would compress the addressable base for producers still concentrated in this tier.
Gross Margin: 14-18%

Reformulation Cycles and Buyer Renewal

Riboflavin demand carries genuine annuity characteristics once a formulator qualifies a supplier: food and beverage brands rarely re-qualify a colorant source once regulatory filings, stability testing, and shelf-life data are locked in, and feed formulators run similarly long qualification cycles tied to nutritional premix contracts. That inertia protects incumbent fermentation producers who cleared certification first, giving them multi-year revenue visibility most commodity chemical categories cannot match.
Adoption stickiness varies meaningfully by end-use vertical. Packaged food and beverage formulators show the deepest stickiness once natural colorant claims appear on packaging, since reformulating away risks a labeling change and consumer-facing reversal. Animal feed premix customers show moderate stickiness, tied more to price than brand claims. Pharmaceutical and dietary supplement buyers sit in between, valuing purity documentation over price alone.

Buyer profiles are shifting generationally as well. Younger procurement teams inside consumer packaged goods companies increasingly hold sustainability and traceability credentials as a baseline qualification requirement rather than a differentiator, a shift that favors fermentation-derived natural grades over legacy synthetic supply. Feed sector buyers remain more conservative, still weighting landed cost and supply continuity above documented sourcing pedigree in most contracts.
riboflavin-pigment-market-trends-end-use-penetration-index-1787594064523

Where Riboflavin Producers Should Focus Next

These are among the four positions where our research anticipates prominent divergence between winners and laggards over the coming forecast period. Each is grounded in the demand model, the regulatory perimeter, and the announced capacity pipeline.
01 / CERTIFICATION INVESTMENT PRIORITY

Prioritize natural colorant certification ahead of demand acceleration

Producers that delay clean-label and organic certification will genuinely miss the steepest phase of demand acceleration, since qualification cycles for natural food colorant grades already run ten to fourteen months from application to full regulatory approval across most major markets. Early movers are already locking in multi-year supply contracts with major formulators before certification becomes table stakes industry-wide, further narrowing the window for latecomers. Waiting until demand fully materializes effectively means competing for capacity that faster-moving rivals have already secured well in advance.
02 / FEEDSTOCK SOURCE DIVERSIFICATION

Diversify fermentation feedstock sourcing across multiple geographies

Producers concentrated on a single feedstock origin remain meaningfully exposed to the kind of price volatility that has already disrupted margins twice in the past five years across the wider category. Diversifying sourcing across two or more regions measurably reduces that exposure while also shortening delivery lead times for regional customers who increasingly expect local supply continuity. Producers that fully commit to this diversification now will enter the next volatility cycle with a genuinely durable cost advantage over single-origin competitors still exposed.
03 / COMMERCIAL CHANNEL PRIORITIZATION

Weight food and beverage channel investment over feed additive expansion

The food colorant channel is growing meaningfully faster than the feed additive channel and carries a materially higher margin profile across nearly every producer surveyed in the current forecast cycle. Capital allocated toward feed additive capacity expansion earns a genuinely lower return than the same capital directed toward food-grade certification and formulator relationship building over the same investment horizon. Producers that continue defaulting to feed-first strategies risk ceding the category's single most profitable growth pool entirely to faster-moving specialists already repositioning their portfolios accordingly.
04 / REGIONAL CAPACITY POSITIONING

Build India and Southeast Asia capacity ahead of demand curve

India's food manufacturing base is expanding at a pace that already outstrips most producers' current regional capacity plans, and formulators there increasingly demand locally documented supply rather than imported material shipped from distant overseas fermentation facilities. Producers that build capacity ahead of this curve secure meaningfully better long-term contract terms than those entering only after demand has already tightened across the wider region. This genuinely favors early regional investment over a cautious wait-and-see approach that several competitors are already abandoning outright.

Engagement Snapshot From the Field

A live engagement with an industry participant carrying material or product regulatory and market exposure ahead of a defining policy shift, showing how our research translates into a defensible multi-year portfolio strategy.
MARKET MINDS ADVISORY · CLIENT ENGAGEMENT SUMMARY
Riboflavin Pigment Producer Strategic Portfolio Review and Transition Roadmap 2026·Investment Scenario on Riboflavin Pigment Exposure Evaluation 2025-26
CLIENT PROFILE
A mid-sized European food ingredient manufacturer supplying colorant blends to packaged beverage and confectionery brands across Western Europe, with revenue in the mid three-figure million range (client-reported, unverified by MMA). The client had relied primarily on synthetic riboflavin sourcing for over a decade and faced mounting retailer pressure to shift toward natural, clean-label colorant formulations across its core product lines.
STRATEGIC CHALLENGE
The client's largest retail customer had announced a clean-label reformulation mandate affecting roughly forty percent of the client's colorant revenue (client-reported, unverified by MMA), with a compliance deadline the client's existing synthetic supply chain could not meet. Leadership needed to identify qualified natural fermentation-derived suppliers quickly while managing cost exposure.
MMA APPROACH
MMA conducted a supplier landscape assessment across fermentation-grade riboflavin producers, evaluating certification status, production capacity, and pricing structure in close detail. The engagement combined primary interviews with three candidate suppliers and secondary analysis of comparable reformulation cases across adjacent colorant categories to build a defensible, timeline-driven transition roadmap for client leadership.
KEY FINDINGS
  1. Only two of six candidate suppliers held certification sufficient to meet the retailer's documentation timeline without a costly formal extension request being filed.
  2. Switching cost premiums averaged eighteen to twenty-four percent over incumbent synthetic pricing during the first full contract year alone (client-reported, unverified by MMA).
  3. A phased dual-sourcing transition materially reduced supply continuity risk compared with the abrupt single-supplier switch attempted earlier by a comparable peer manufacturer.
  4. Retailer audit requirements extended qualification timelines by roughly three months beyond the supplier's originally stated certification approval date on the official record.
CLIENT PROFILE
A mid-sized European food ingredient manufacturer supplying colorant blends to packaged beverage and confectionery brands across Western Europe, with revenue in the mid three-figure million range (client-reported, unverified by MMA). The client had relied primarily on synthetic riboflavin sourcing for over a decade and faced mounting retailer pressure to shift toward natural, clean-label colorant formulations across its core product lines.
STRATEGIC CHALLENGE
The client's largest retail customer had announced a clean-label reformulation mandate affecting roughly forty percent of the client's colorant revenue (client-reported, unverified by MMA), with a compliance deadline the client's existing synthetic supply chain could not meet. Leadership needed to identify qualified natural fermentation-derived suppliers quickly while managing cost exposure.
MMA APPROACH
MMA conducted a supplier landscape assessment across fermentation-grade riboflavin producers, evaluating certification status, production capacity, and pricing structure in close detail. The engagement combined primary interviews with three candidate suppliers and secondary analysis of comparable reformulation cases across adjacent colorant categories to build a defensible, timeline-driven transition roadmap for client leadership.
KEY FINDINGS
  1. Only two of six candidate suppliers held certification sufficient to meet the retailer's documentation timeline without a costly formal extension request being filed.
  2. Switching cost premiums averaged eighteen to twenty-four percent over incumbent synthetic pricing during the first full contract year alone (client-reported, unverified by MMA).
  3. A phased dual-sourcing transition materially reduced supply continuity risk compared with the abrupt single-supplier switch attempted earlier by a comparable peer manufacturer.
  4. Retailer audit requirements extended qualification timelines by roughly three months beyond the supplier's originally stated certification approval date on the official record.
RECOMMENDED STRATEGY
Phase 1: Phase one: qualify two fermentation-derived suppliers in parallel to avoid single-source dependency risk during the full year-long supplier transition window. Phase 2: Phase two: negotiate volume-tiered pricing that steps down progressively as natural colorant volume scales past the initial annual contract minimums agreed. Phase 3: Phase three: extend the reformulation playbook to all remaining product lines using the retailer relationship as a proven reference case study.
OUTCOME
The client completed retailer-mandated reformulation two months ahead of the compliance deadline and retained the account, which represented its largest single customer relationship (client-reported, unverified by MMA). Dual-sourcing reduced the client's supply concentration risk, and the transition playbook was subsequently applied to two additional retail accounts within the following year.

Frequently Asked Questions

Foundational context covering the market sizes, CAGR, scope, country, region and competition that inform every finding below. This section is provided to cover basics and most often pre-purchase conversations, answered from the MMA Primary Research Dataset.

What is the current size of the Riboflavin Pigment Market?

The global riboflavin pigment market reached an estimated 0.52 billion dollars in 2025. Growth is being driven by clean-label food colorant demand and steady feed additive consumption worldwide.

How large will the Riboflavin Pigment Market be by 2036?

MMA projects the market will reach approximately 1.03 billion dollars by 2036. That represents nearly a 1.87 times expansion from the 2026 forecast base value.

What is the CAGR for the Riboflavin Pigment Market 2026 to 2036?

The market is projected to grow at a 6.5 percent compound annual rate over the forecast period. The bull case reaches 7.8 percent, while the bear case falls to 5.2 percent.

Which segment is growing fastest?

Natural Fermentation-Derived Food Colorant Grade Riboflavin leads at a 9.5 percent CAGR, nearly 1.46 times the overall market rate. Clean-Label Certified Organic Riboflavin follows closely at 8.5 percent.

Who are the major companies in the Riboflavin Pigment Market?

Leading producers include DSM-Firmenich, BASF SE, Archer Daniels Midland Company, CTC Bio Inc., and Hubei Guangji Pharmaceutical Co. The top five hold an estimated 58 percent combined share on a production capacity basis.

Which country is growing fastest?

India leads at an 8.0 percent CAGR, driven by expanding food manufacturing capacity and rising fermentation investment. Domestic formulators are increasingly qualifying local natural colorant supply over imported material.

Report Segmentation Architecture

The full report scope spans multiple orthogonal segmentation dimensions, with cross-tabulated demand data provided for each dimension pair. Coverage extends further to regional breakdowns, trend trajectories, and the competitive detail needed to support segment-level decision-making.
  • Natural Fermentation-Derived Food Colorant Grade Riboflavin
  • Clean-Label Certified Organic Riboflavin
  • Pharmaceutical Grade Riboflavin
  • Standard Fermentation-Grade Riboflavin
  • Synthetic Chemical-Grade Riboflavin
  • Feed Additive Grade Riboflavin
  • Packaged Food and Beverage
  • Animal Nutrition and Feed
  • Pharmaceutical and Dietary Supplement
  • Cosmetics and Personal Care
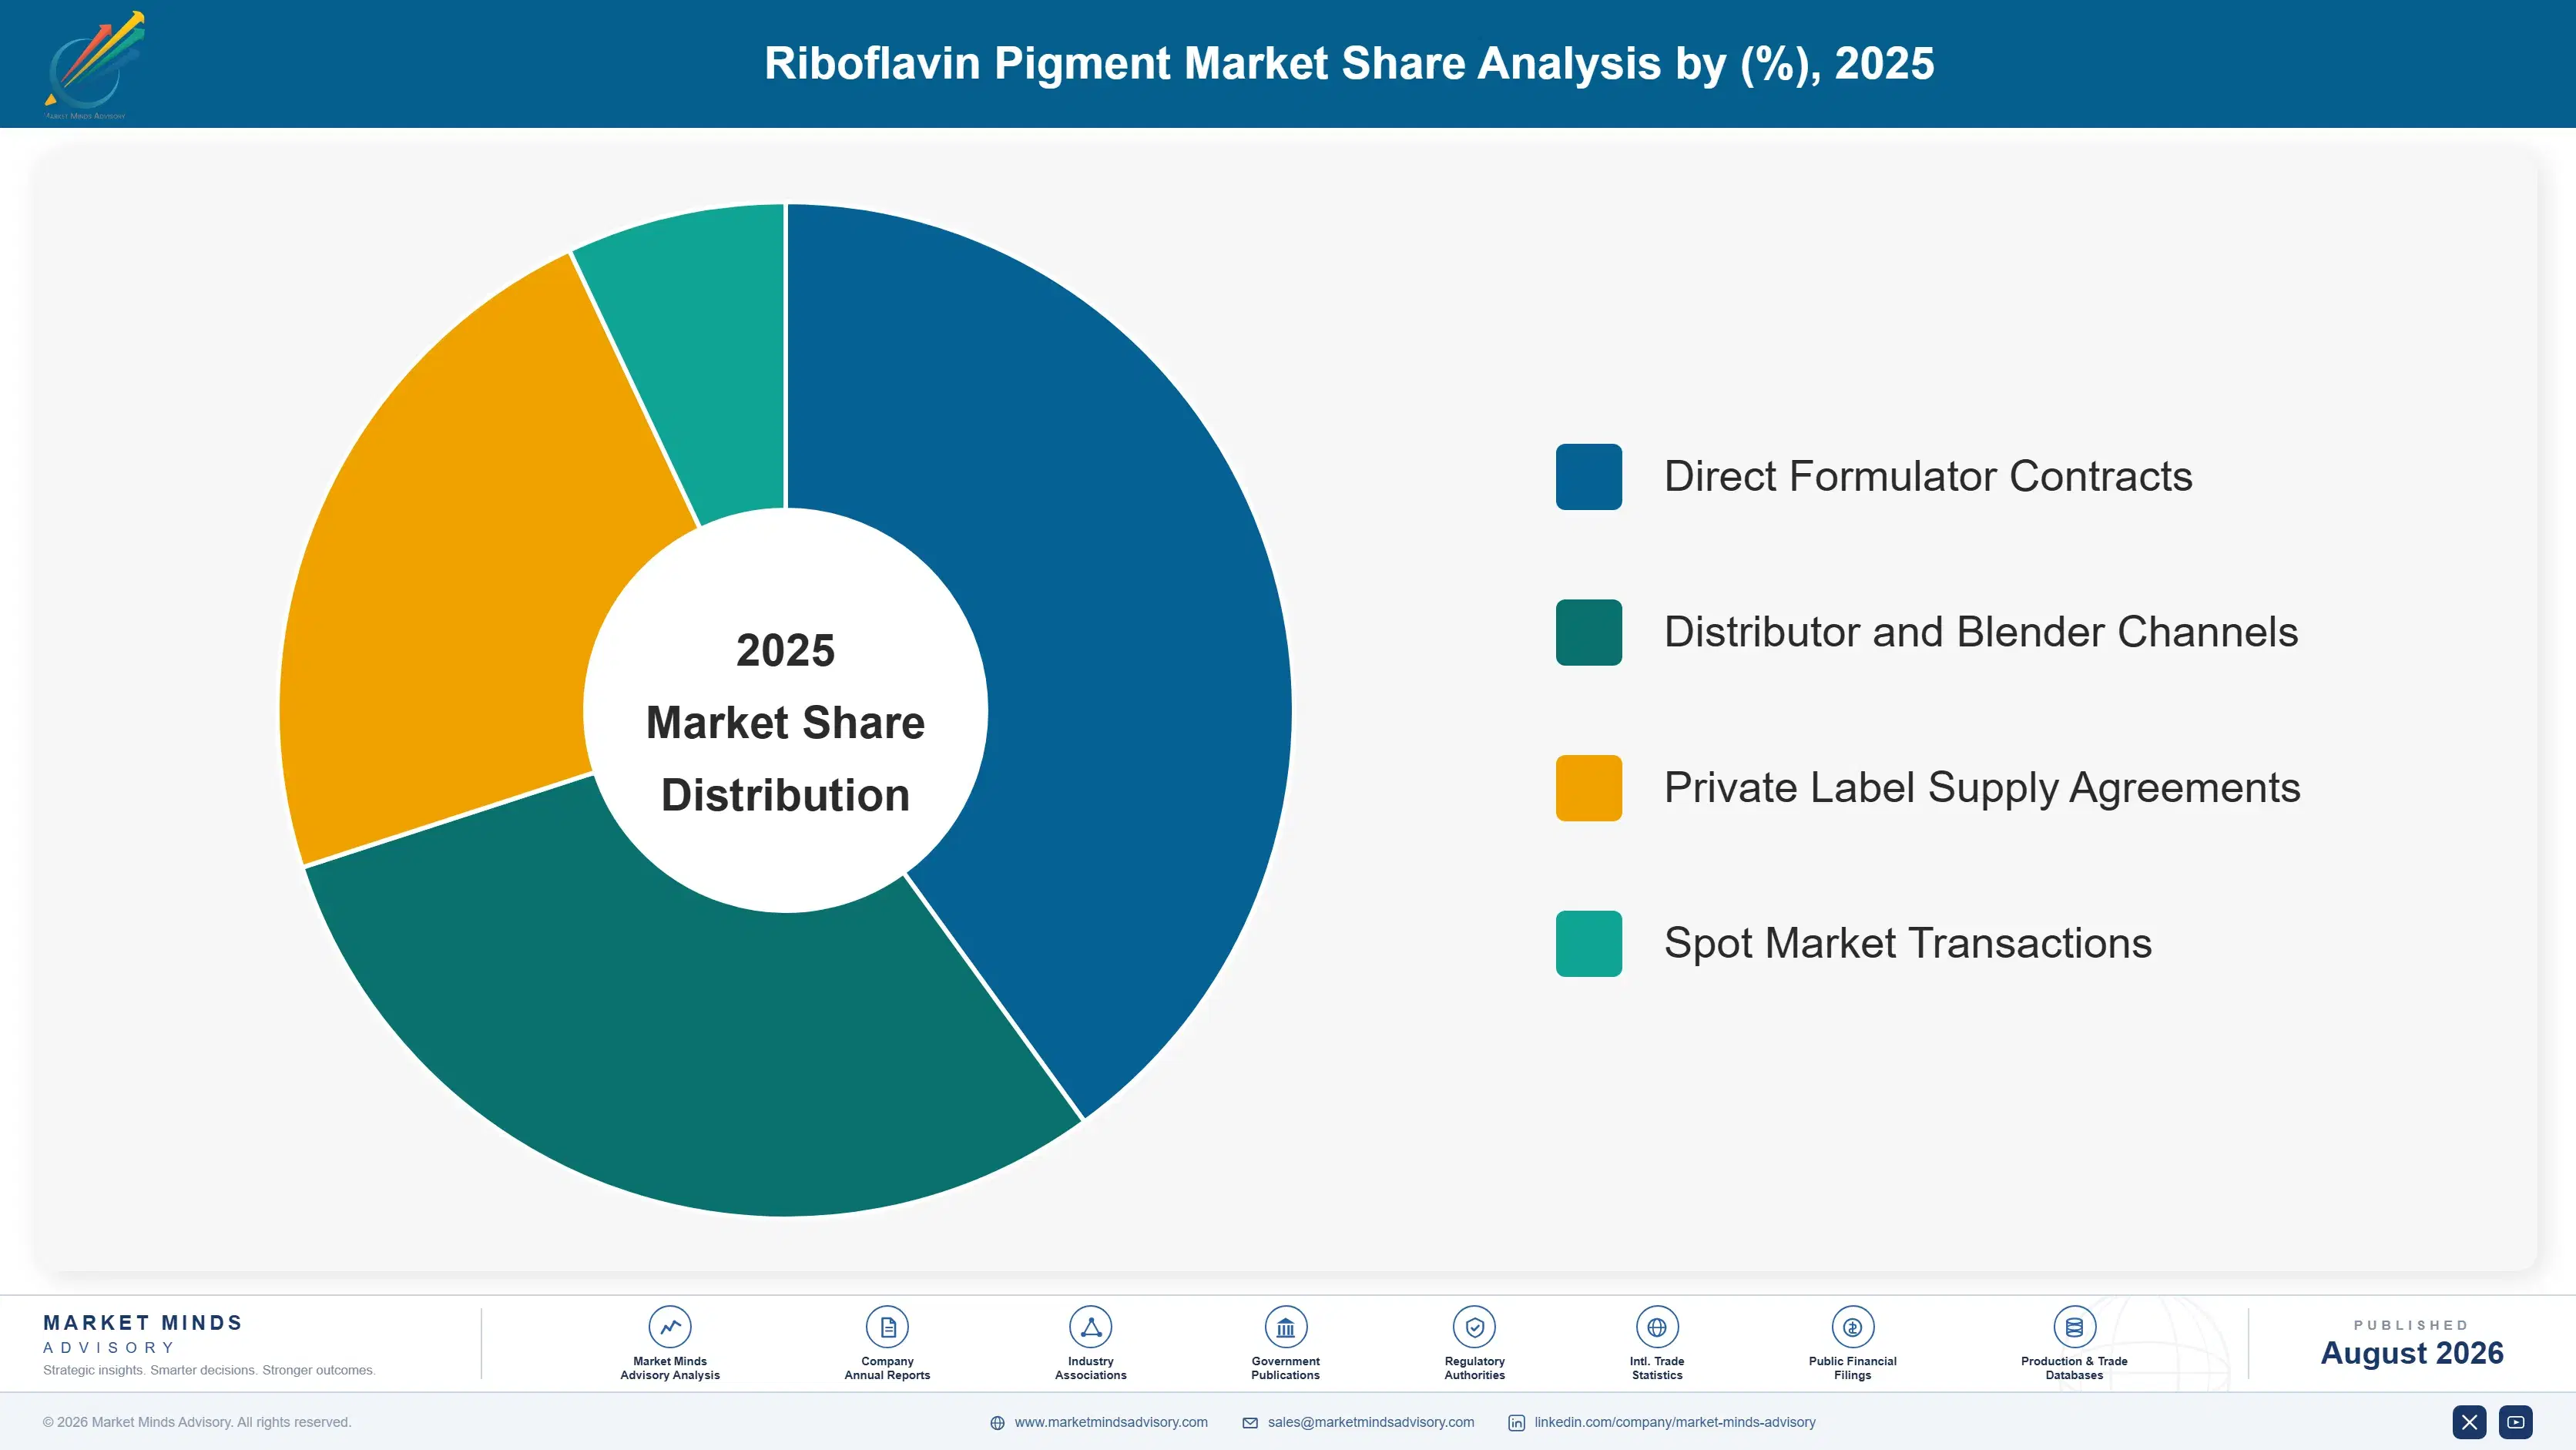
  • Direct Formulator Contracts
  • Distributor and Blender Channels
  • Private Label Supply Agreements
  • Spot Market Transactions

By Region

  • North America
  • Western Europe
  • East Asia
  • South Asia and Pacific
  • Latin America
  • Middle East and Africa
  • Eastern Europe

Scope, Methodology, and Coverage

Every figure in this report is reproducible from documented input assumptions. The scope below maps the historical period, the forecast horizon, the segmentation dimensions, and the countries covered, alongside the underlying primary and qualitative methodology.
Historical Period
2020 to 2025
Forecast Period
2026 to 2036
Base Year
2025 (USD billions; MMA Primary Research Dataset, August 2026)
Market Definition
This report covers riboflavin (vitamin B2) produced via fermentation and chemical synthesis for use as a food colorant, nutritional additive, and feed supplement. It excludes fortified finished food products, multivitamin blends, and riboflavin-5-phosphate used exclusively in injectable pharmaceutical formulations.
Quantitative Units
USD Billion, Volume in Metric Tons
Segmentation Dimensions
Product Grade, End-Use Industry, Commercial Channel, Region
Regions Covered
North America, Western Europe, East Asia, South Asia and Pacific, Latin America, Middle East and Africa, Eastern Europe
Countries Covered
United States, Canada, Germany, United Kingdom, France, China, Japan, South Korea, India, Brazil
Key Companies Profiled
20
Quantitative Methodology
Primary survey, n=3,800 respondents, Q4 2025, six countries; demand-side model with trade association cross-validation
Qualitative Methodology
47 expert interviews, Q4 2025; applied to validate demand model assumptions, identify emerging dynamics, and assess competitive positioning
Report Format
PDF and XLSX data workbook (Word format preview document)
Publisher
Market Minds Advisory
Report Code
MMA-2026-CHM-124
Published
August 2026
Contact
sales@marketmindsadvisory.com | www.marketmindsadvisory.com

Purchase the full Riboflavin Pigment Market Report (2026 to 2036).

This full report delivers comprehensive market sizing, segmentation, and competitive analysis for the global riboflavin pigment market through 2036. Coverage spans both natural fermentation-derived and synthetic production pathways across food, feed, and pharmaceutical end uses worldwide. It includes detailed profiles of the twenty leading producers plus region-by-region demand forecasts across all seven tracked regions. Pricing trend analysis is tied directly to fermentation feedstock and certification cost movements. Subscribers also receive full access to the underlying primary survey dataset and complete expert interview transcripts referenced throughout this analysis.
Twenty detailed producer competitive profiles and rankings
Seven-region demand and pricing forecasts through 2036
Fermentation feedstock cost trend and volatility analysis
Segment-level growth rate breakdowns by product grade
Primary survey dataset access included with subscription
Quarterly market update subscription option available

Built For The People Who Decide

From boardroom strategy to bench-side execution, this report is read cover-to-cover by leaders shaping the next decade of their industry, turning demand scenarios, market dynamics and valuation benchmarks into decisions.
CXOs/ Presidents/ VPs/ Managers
M&A and Corporate Development
Strategy Teams and R&D Heads
Procurement and Product Directors
Regulatory and Compliance Leaders
Investor Relations and Equity Analysts