Market Minds Advisory
Ribbon Board Display Market

Ribbon Board Display Market: Ribbon Board Display Market. Fine-Pitch LED Signage for Stadiums, Arenas, and Sponsorship Advertising

Global stadium construction tied to major tournament hosting and rising sponsorship advertising demand are pushing venue operators toward fine-pitch LED ribbon boards, reshaping decades-old perimeter signage procurement across professional and collegiate sports venues worldwide.

Lead Analyst

Published

September 2026

Make Smarter Decisions with Customized Research Insights

Request a free sample report and evaluate market opportunities, growth trends, and competitive dynamics relevant to your business needs.

2025 MARKET VALUE$1.1BMarket Size 2025
2036 FORECAST VALUE$2.8BBase Case , 2026 to 2036
CAGR 2026 TO 20368.8 %Bull 10.0% / Bear 7.5%
INCREMENTAL OPPORTUNITY$1.6BNet 10- year value creation
EXPANSION MULTIPLE2.33x2036 value over 2026 base
Strategic Levers
M&A Pipeline
Regional Outlook
Country Rankings
Competitive Intelligence
Segmental Deep-dive
Call-Us : 91 93563 13602

Executive Snapshot and Market Trajectory.

Stadium operators are upgrading to fine-pitch LED ribbon boards faster than expected, as sponsorship advertising demand and broadcast picture quality expectations push perimeter signage from static branding toward dynamic, high-resolution display infrastructure. Venue operators slow to upgrade risk losing sponsorship revenue to competitors already offering dynamic advertising inventory.
Commercially, international stadium construction tied to major tournament hosting is emerging as a sustained growth driver alongside domestic venue refresh cycles, since new stadium builds increasingly specify ribbon board infrastructure from the outset rather than retrofitting it later. North America and East Asia concentrate the bulk of near-term spending given mature professional sports league density and expanding venue construction happening simultaneously. Vendors offering bundled content management increasingly command premium pricing over point-solution competitors today.
The competitive field remains concentrated among a handful of display technology majors with deep LED manufacturing expertise, though integrated sponsorship management software increasingly separates credible bidders from basic panel vendors serving narrower collegiate and amateur venue budget categories. Venue operators are also demanding longer-term maintenance and content management commitments as ribbon boards shift procurement conversations toward continuous display platform relationships. Vendors investing early win the largest venue agreements.
Market Definition
This market covers LED ribbon board displays and associated content management software installed along stadium and arena perimeters for scoring, sponsorship advertising, and broadcast enhancement purposes. It excludes large-format scoreboard displays sold as standalone centerhung units, stadium video wall systems unrelated to perimeter signage, and general outdoor digital billboard advertising infrastructure.
Base Year Value
$1.1B in 2025 (MMA Primary Research Dataset, September 2026)
Forecast Period
2026 to 2036, eleven discrete annual values
CAGR
8.8% base case. Bull 10.0%. Bear 7.5%.
Fastest Growth Segment
Fine-Pitch LED Ribbon Board Technology: 14.0% CAGR
Fastest Growth Country
Saudi Arabia: 13.5% CAGR
Fastest Growth Region
South Asia and Pacific: 10.8% CAGR
Largest Region
North America: 32% of 2025 global value
Market Leaders
Daktronics, Panasonic, Samsung Electronics, LG Electronics, ANC Sports Enterprises. Source: MMA Analysis based on company annual reports.
Primary Survey
n=3,800 procurement and R&D decision-makers, Q4 2025, six countries
Methodology
Demand-side build-up, cross-validated against public data, 47 expert interviews

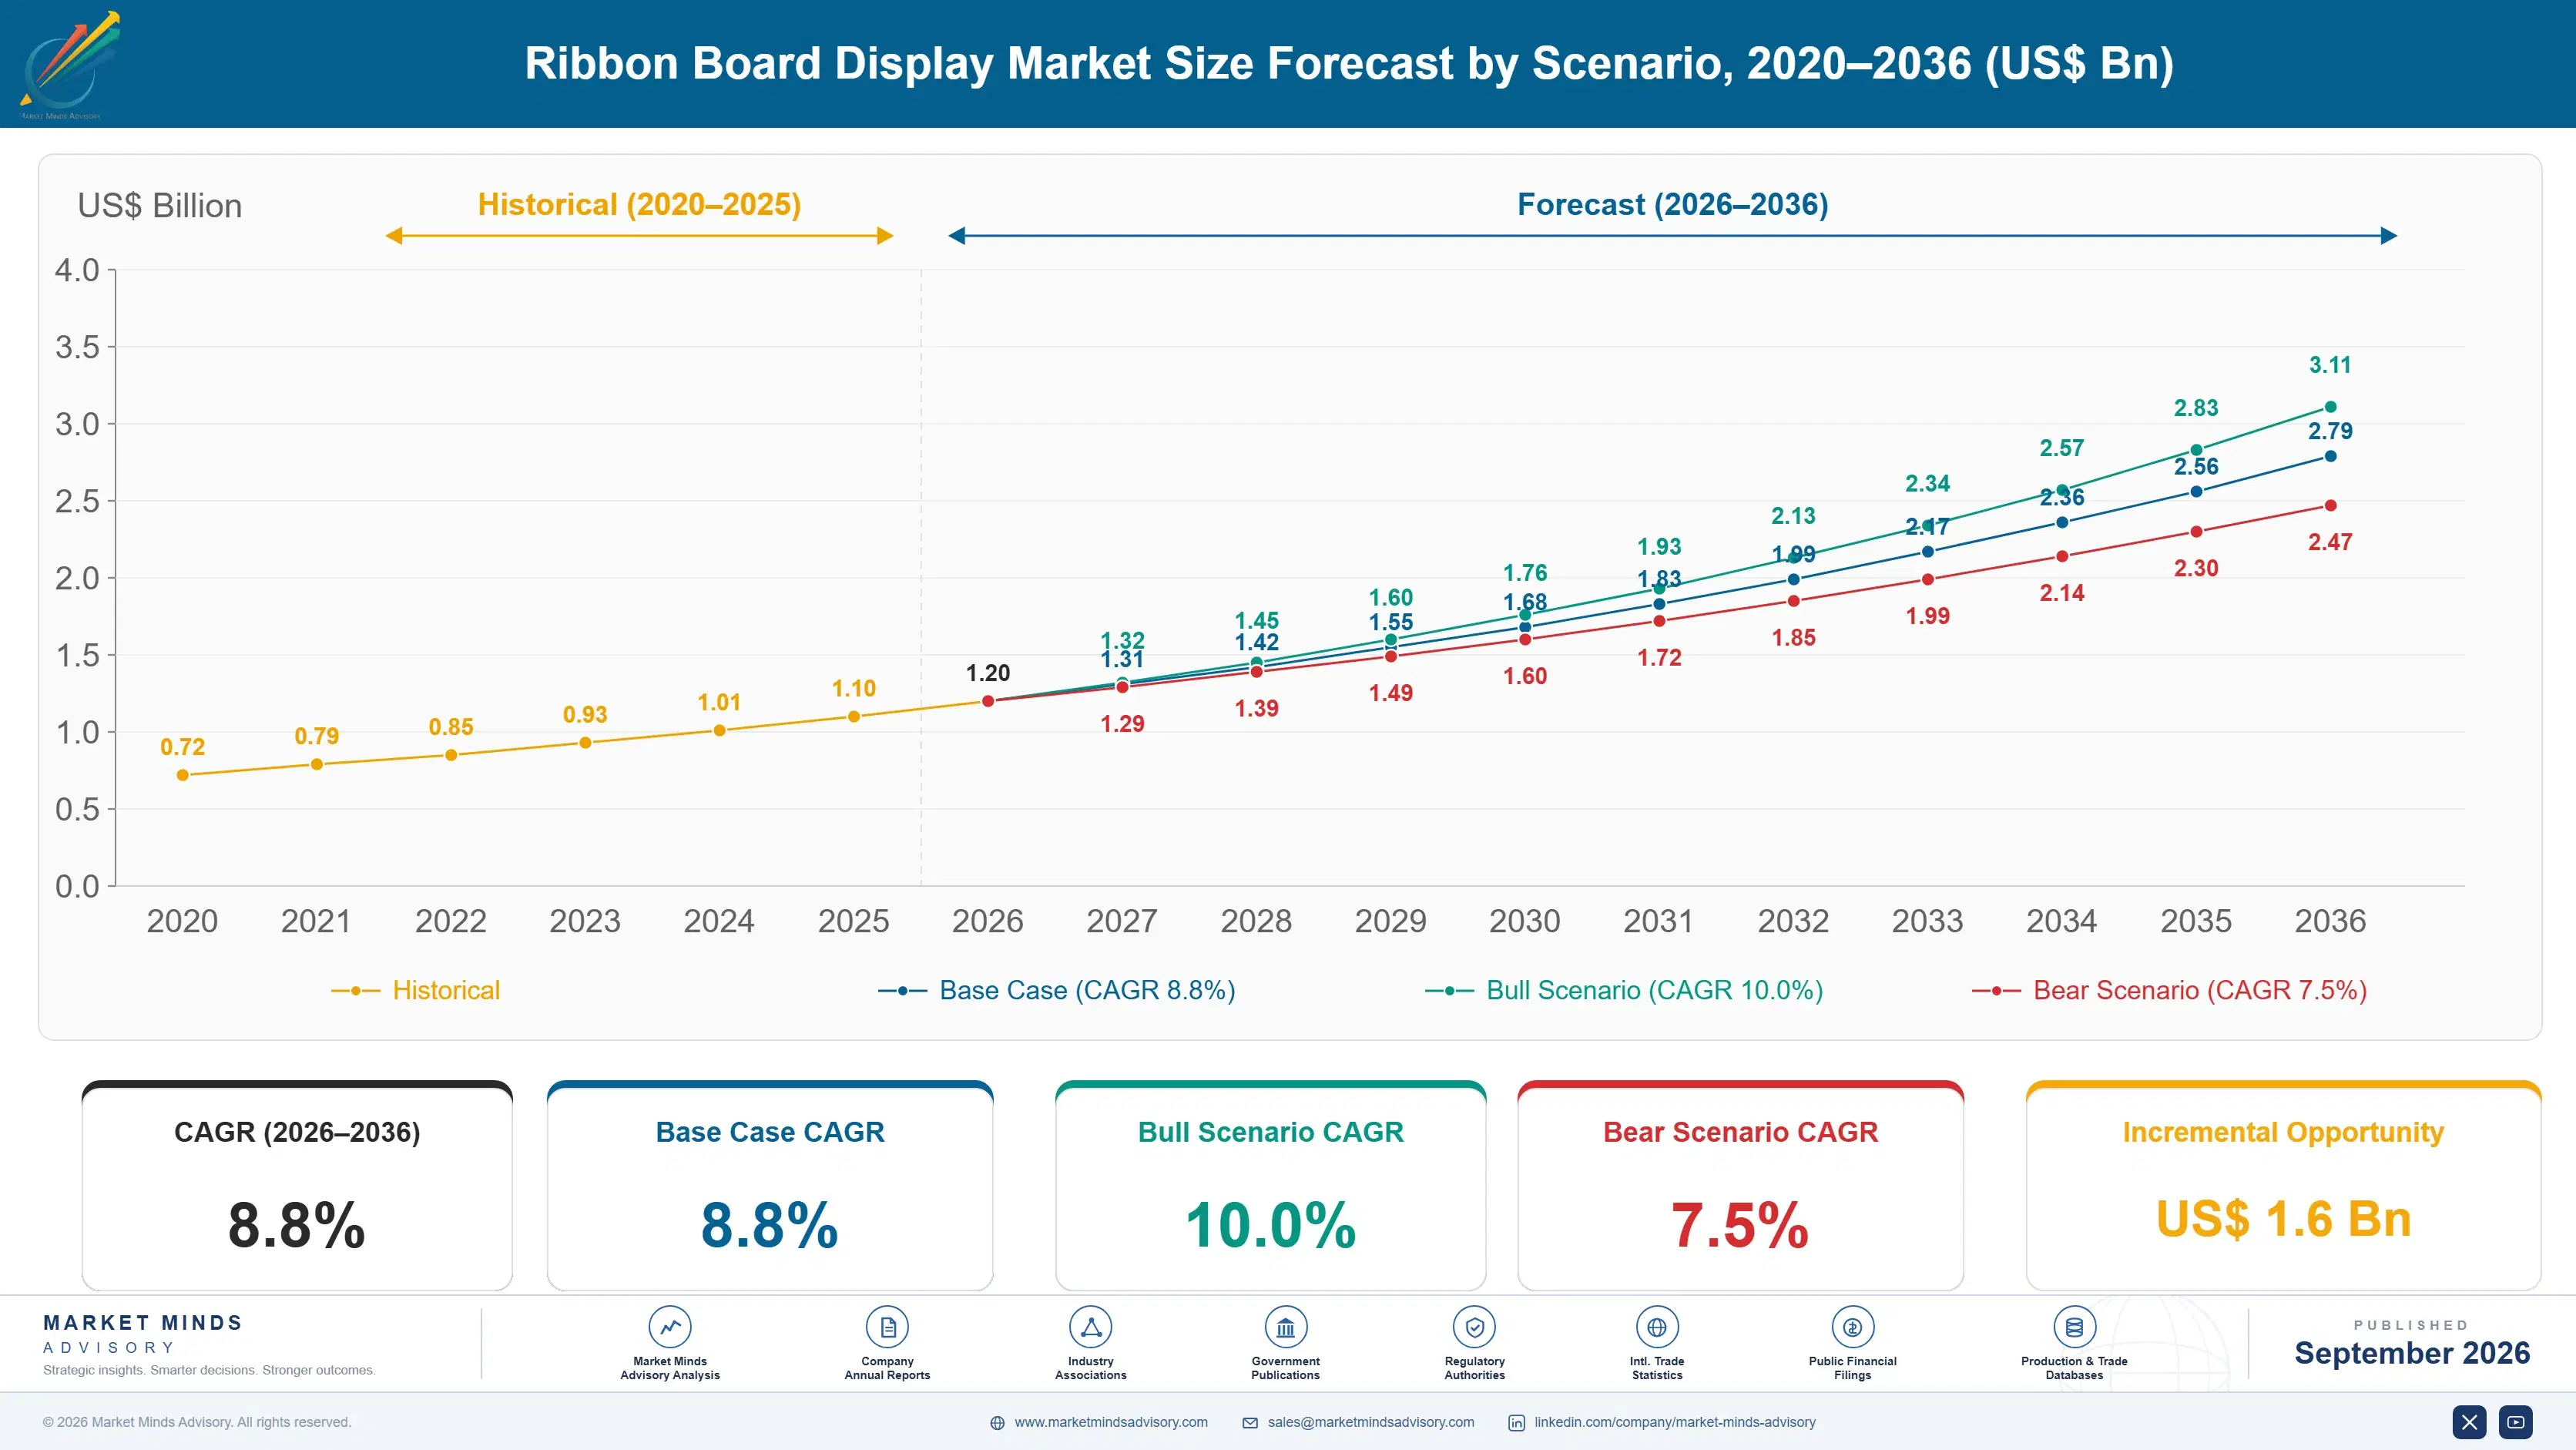
Ribbon Board Display Market Forecast Scenarios

ribbon-board-display-market-size-forecast-scenario-1788415239724
Ribbon board display demand grew steadily between 2020 and 2025 as stadium construction tied to major tournament hosting and rising sponsorship advertising rates pushed venue operators toward expanded LED infrastructure across most major sports markets, with the historical growth rate holding near 7.5 percent annually. Venues that invested early in fine-pitch technology report meaningfully stronger sponsorship revenue relative to laggard competitors.
The base case assumes continued international stadium construction tied to major tournament hosting cycles, expanding sponsorship advertising demand favoring dynamic display formats, and fine-pitch technology adoption reaching maturity across most developed professional sports markets. These three commercial mechanisms together sustain a forecast compound annual growth rate of 8.8 percent through 2036, with fine-pitch adoption rising fastest across tracked segments. Vendors offering integrated content platforms increasingly win preferred status among the largest venue modernization programs.
A bull scenario assumes accelerating tournament-driven stadium construction and faster-than-expected fine-pitch cost reduction, pushing growth toward 10.0 percent. A bear scenario assumes construction delays and venue capital budget constraints slowing deployment timelines, pulling growth down toward 7.5 percent across the most affected regional sports markets. Both scenarios assume the underlying tournament construction trend continues broadly on schedule across major sports markets.

Fine-Pitch Technology Redefines Signage Economics

Three converging forces define this market today: international tournament hosting requirements compounding new stadium construction demand, sponsorship advertising rates that increasingly favor dynamic over static signage formats, and fine-pitch resolution technology compounding demand across most developed professional sports markets simultaneously. Venues that fail to modernize signage risk losing sponsorship revenue to competitors already offering dynamic, broadcast-quality advertising inventory nationwide.
MARKET CONCENTRATION42% CR5combined share held by five leading LED display vendors globally
FINE-PITCH ADOPTION RATE36%share of new installations specifying fine-pitch resolution today
SPONSORSHIP REVENUE SHARE28%share of venue signage budget tied to sponsorship advertising
AVERAGE PANEL REPLACEMENT CYCLE9 yearstypical service life before display panel upgrade needed
BROADCAST-ENHANCED VENUE SHARE31%share of venues specifying broadcast-grade display resolution today
TOP COUNTRY SHARE26%United States share of global ribbon board shipment volume
Commercially, the business increasingly resembles digital media platform procurement rather than pure panel supply, with content management flexibility, broadcast integration quality, and sponsorship yield optimization determining which vendors win the largest multi-year venue framework agreements over purely transactional panel sales. Vendors offering bundled sponsorship yield analytics alongside core content management increasingly command premium pricing over point-solution competitors selling panels alone.
Over the next decade, AI-assisted dynamic sponsorship targeting and higher refresh rate broadcast integration will reshape which vendors remain competitive, while venue operators increasingly demand interoperability across multi-vendor content management environments rather than accepting proprietary single-vendor lock-in architectures that dominated the prior generation of stadium signage. Vendors that resist open content standards risk losing large venue accounts to more interoperable competitors over the coming decade today.
"Venues used to buy a scoreboard accessory. Now they are buying a sponsorship revenue engine that happens to display the score as a side effect."
Director, Sports Venue Technology and Media Practice · MMA Sports Venue LED Display and Sponsorship Signage Technology Practice · September 2026

Market Trends

Fine-Pitch Resolution Becomes Standard Broadcast Requirement

Fine-pitch LED technology is shifting from a premium upgrade into standard specification across broadcast-enhanced venues, since higher resolution meets tightening picture quality requirements that standard-pitch panels increasingly cannot satisfy for close-up broadcast camera shots. Venue operators increasingly specify fine-pitch panels as a baseline requirement for new construction rather than an optional upgrade, opening budget that previously constrained deployment scale considerably across affected venue categories. Roughly 36 percent of new installations now specify fine-pitch resolution, a figure that continues climbing each successive construction cycle. Vendors serving this segment increasingly maintain dedicated fine-pitch engineering account teams.
Market Impact: Commands 15 percent higher broadcast fees
Dynamic Sponsorship Content Expands Beyond Flagship Venues

Dynamic, algorithmically targeted sponsorship content is moving beyond flagship professional venues into mainstream collegiate and mid-tier arena installations, as cost reduction and simplified content management tools address early adoption barriers that limited deployment to premium venues through the previous several years. Several major sponsorship networks have standardized on dynamic content specifications across their venue partnership portfolios. This segment is growing steadily as component costs fall, well ahead of the pace legacy static signage formats are being phased out. Cost curves for dynamic content continue falling as adoption scale expands across major sponsorship networks.
Market Impact: 28 percent funds sponsorship displays

Market Opportunities and Growth Drivers

Tournament Hosting Requirements Sustain Construction Demand

Major international tournaments increasingly require documented broadcast-grade display infrastructure as a condition of hosting eligibility, pushing host nations to specify ribbon board infrastructure from the outset of new stadium construction projects rather than retrofitting it after venue completion. Saudi Arabia's 2034 World Cup hosting commitment alone is driving a substantial multi-venue construction pipeline requiring fine-pitch signage across numerous new and renovated stadiums, according to national sports infrastructure planning disclosures. Compliant venues can command meaningfully higher broadcast rights fees relative to venues lacking documented display infrastructure today. Vendors serving this pipeline increasingly maintain dedicated tournament infrastructure account teams.
Market Impact: Slows adoption among 30 percent

Sponsorship Advertising Revenue Sustains Signage Investment

Rising sponsorship advertising rates across professional and collegiate sports increasingly favor dynamic display formats over static signage, since dynamic ribbon boards let venues sell rotating advertising inventory to multiple sponsors rather than a single fixed placement across an entire season. Roughly 28 percent of total venue signage budgets now flow toward sponsorship-linked display infrastructure specifically, according to MMA primary survey data collected from venue operator respondents, with adoption concentrated among the largest professional sports markets. This creates a sustained multi-year revenue stream for vendors with proven yield optimization capability nationwide.
Market Impact: 18 percent longer multi-sponsor timelines

Market Restraints and Challenges

High Fine-Pitch Cost Slows Collegiate Adoption Pace

Fine-pitch LED panels cost considerably more upfront than standard-pitch alternatives, and collegiate and amateur venue operators without access to major sponsorship revenue often defer full fine-pitch integration despite the sponsorship yield benefits higher resolution provides over standard displays. The root cause is a component cost premium that has not yet reached the scale economics standard-pitch alternatives achieved years ago, making the investment case less compelling for cost-sensitive smaller venues. This slows adoption meaningfully among smaller institutions. Vendors increasingly offer financing partnerships as a mitigation pathway to spread upfront cost over time.
Market Impact: 36 percent of installations specify fine-pitch

Content Management Complexity Complicates Multi-Sponsor Deployment

Venues managing dynamic advertising across dozens of rotating sponsors face content scheduling and rights management complexity that basic display software cannot adequately handle, requiring dedicated content management platforms that extend implementation timelines and raise costs well beyond static signage deployment estimates. The root cause is the absence of a single harmonized content standard across the sponsorship advertising industry, forcing vendors to pursue custom integration approaches for venues with different sponsor relationship structures. This delays deployment for venues with complex multi-sponsor advertising portfolios. Some vendors are pooling content standardization through industry consortiums as a mitigation pathway.
Market Impact: 28 percent revenue tied sponsorship
4 additional market trends, 3 additional growth drivers, and 3 additional restraints and challenges are covered in the full report. Contact sales@marketmindsadvisory.com to access the complete intelligence.

Segment CAGR and Growth Architecture

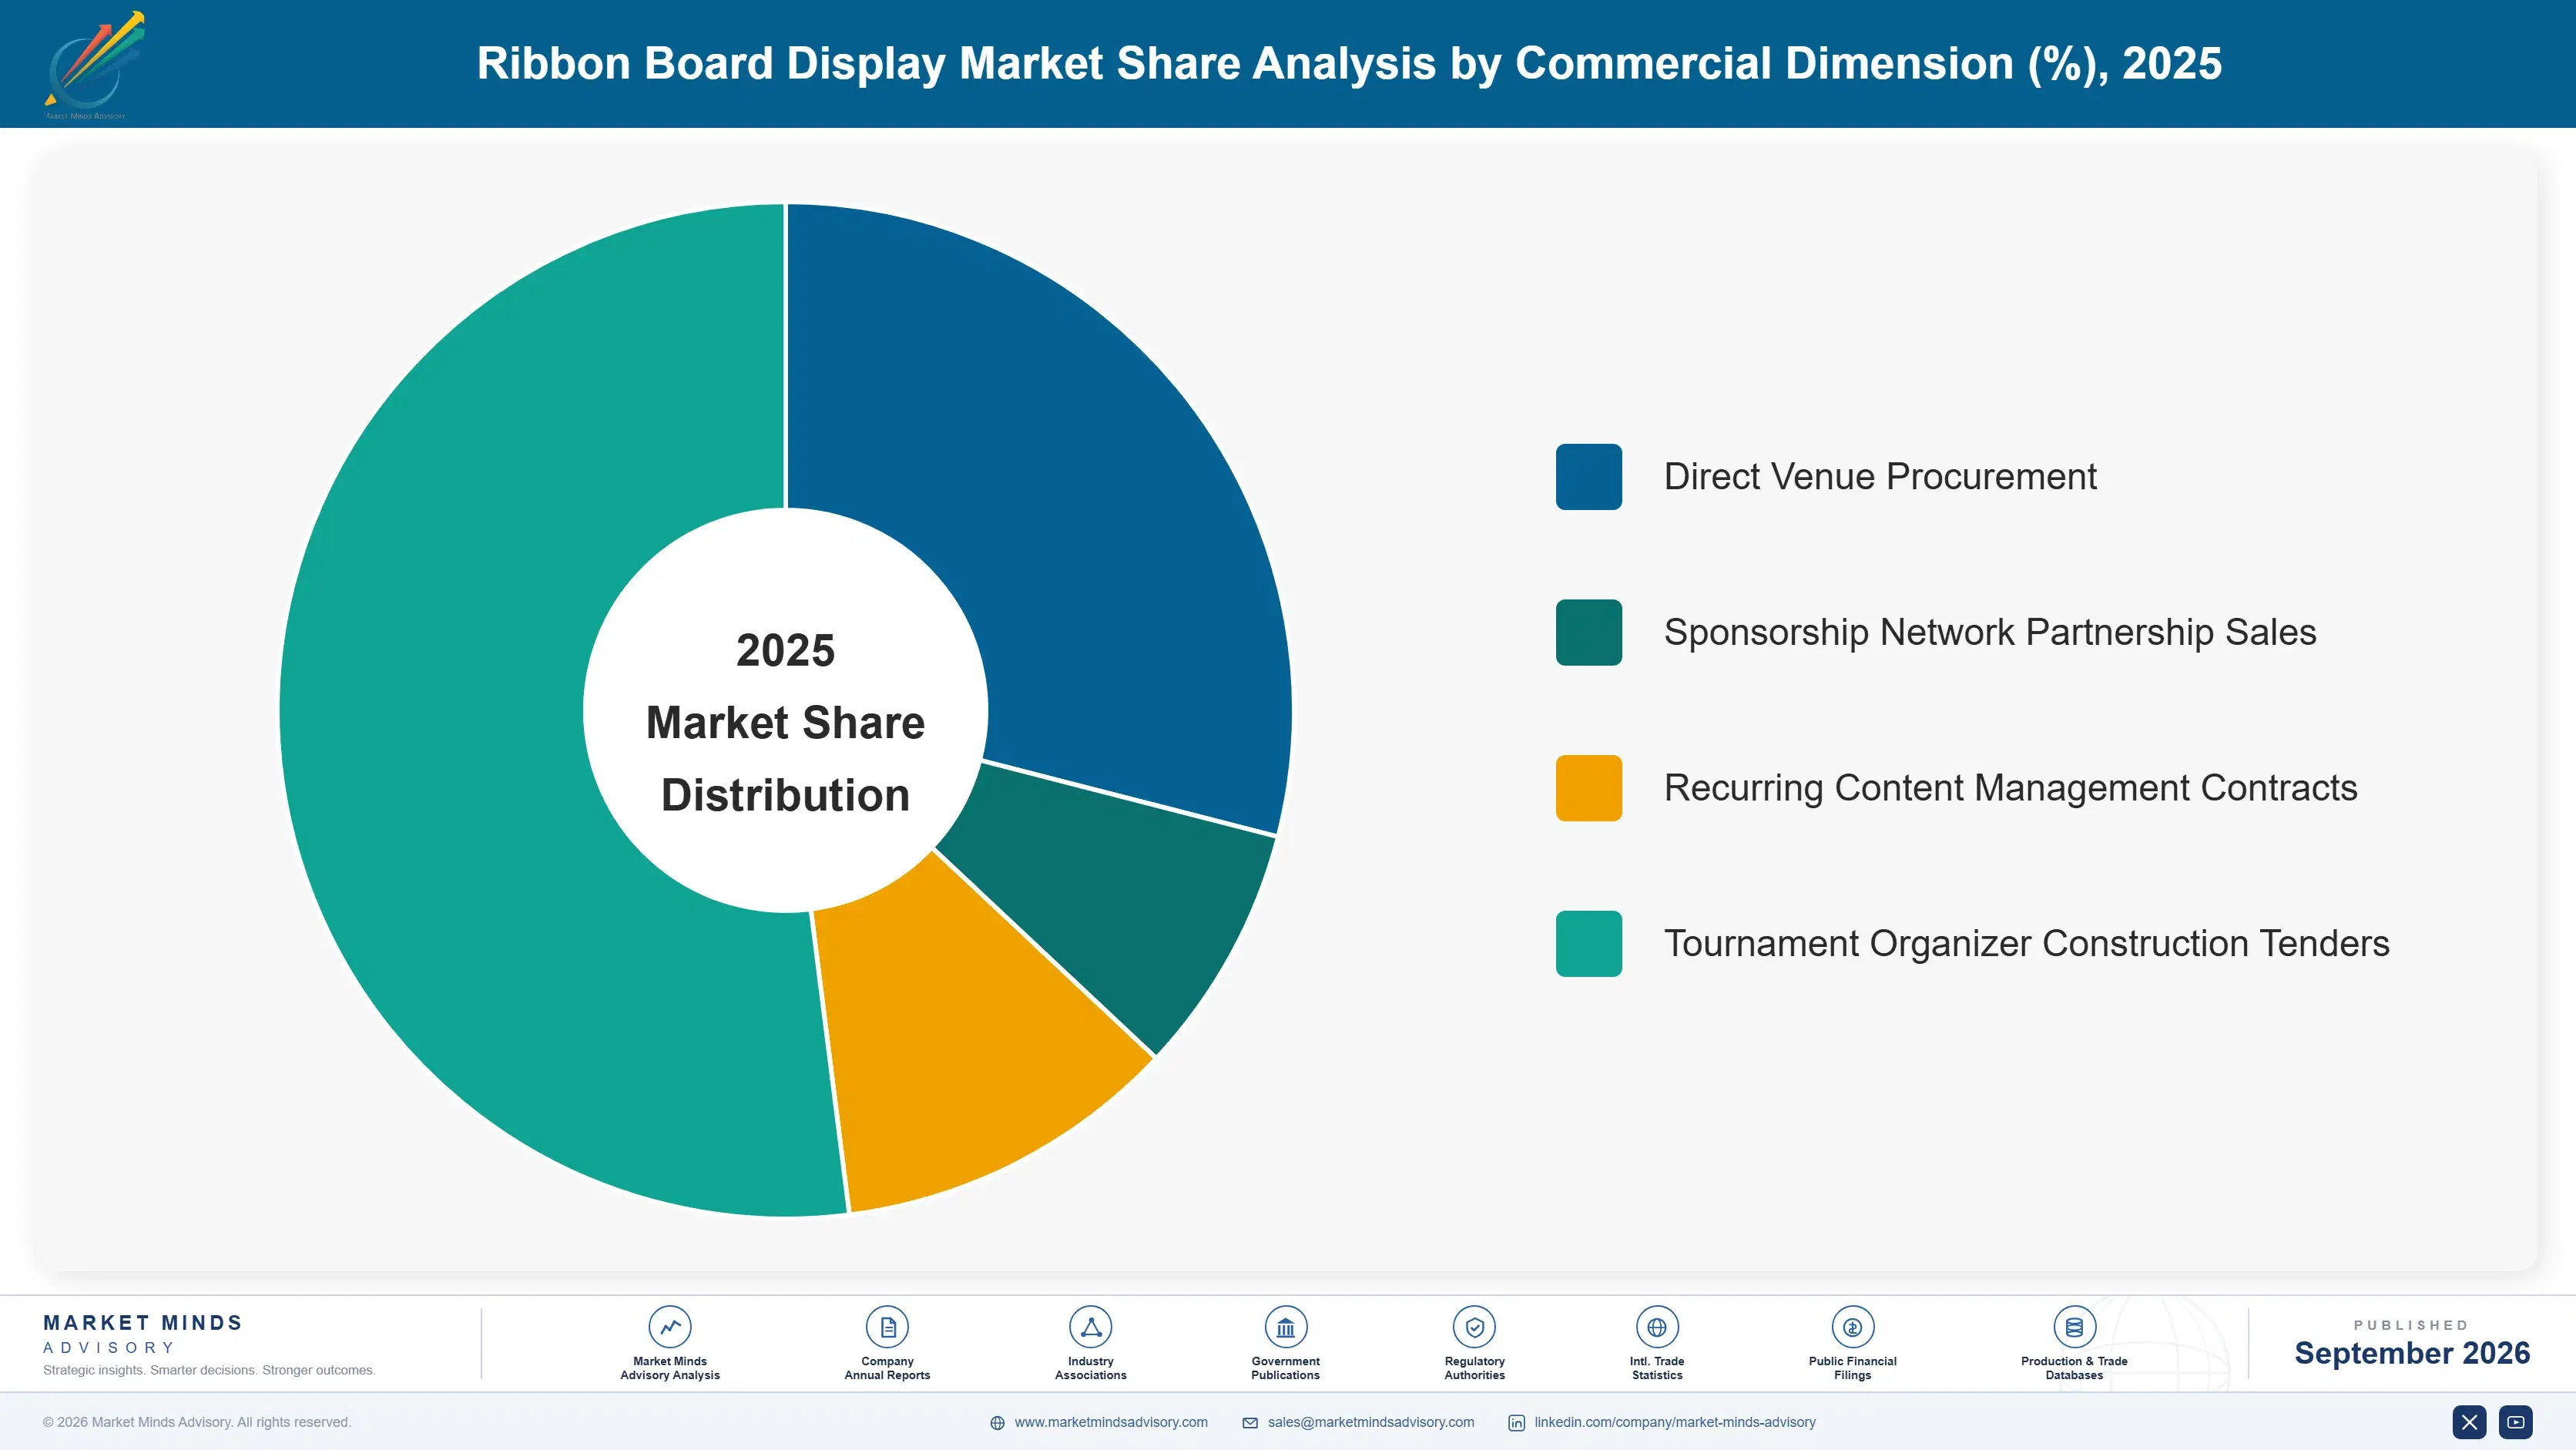
MMA segments this market by technology and geographic maturity, since resolution requirements, sponsorship revenue models, and procurement cycles differ meaningfully by category rather than by venue sport or ownership model alone, making technology tier the most commercially decisive lens for demand analysis. Six categories together span demand from basic collegiate signage through broadcast-grade fine-pitch installations.
ribbon-board-display-market-market-share-analysis-1788415240257

Fine-Pitch LED Ribbon Board Technology

This segment covers high-resolution LED panels with tighter pixel pitch than standard displays, meeting broadcast-grade picture quality requirements that standard-pitch panels increasingly cannot satisfy for close-up camera coverage. Demand here is expanding fastest of any category as declining panel costs and simplified content management tools address early adoption barriers that limited deployment to flagship professional venues through the previous several years. Broadcasters increasingly treat fine-pitch resolution as a standard hosting requirement rather than an optional premium feature, given growing evidence of measurable sponsorship revenue benefits from higher-quality dynamic content. Vendors serving this segment increasingly maintain dedicated broadcast integration engineering teams separate from traditional standard-pitch panel sales organizations nationwide and internationally today.
CAGR 14.0%

International and Emerging Market Stadium Installations

This segment covers new stadium construction in emerging sports markets and countries pursuing major tournament hosting rights, where ribbon board infrastructure is specified from the outset of construction rather than retrofitted into existing venues. Growth here tracks closely with tournament hosting commitments, and host nations increasingly treat broadcast-grade signage as essential infrastructure rather than an optional accommodation for domestic-only competitions. Vendors with proven large-scale multi-venue delivery capability increasingly win preferred status among nations managing the largest, most time-sensitive tournament construction pipelines, where delivery delays create meaningful reputational and financial risk for hosting commitments. Insurance carriers increasingly offer reduced premiums for host nations with documented delivery guarantees across their construction pipeline.
CAGR 11.5%
Full segment breakdown across 6 segments available in the complete report.

Regional Architecture and Country Demand Map

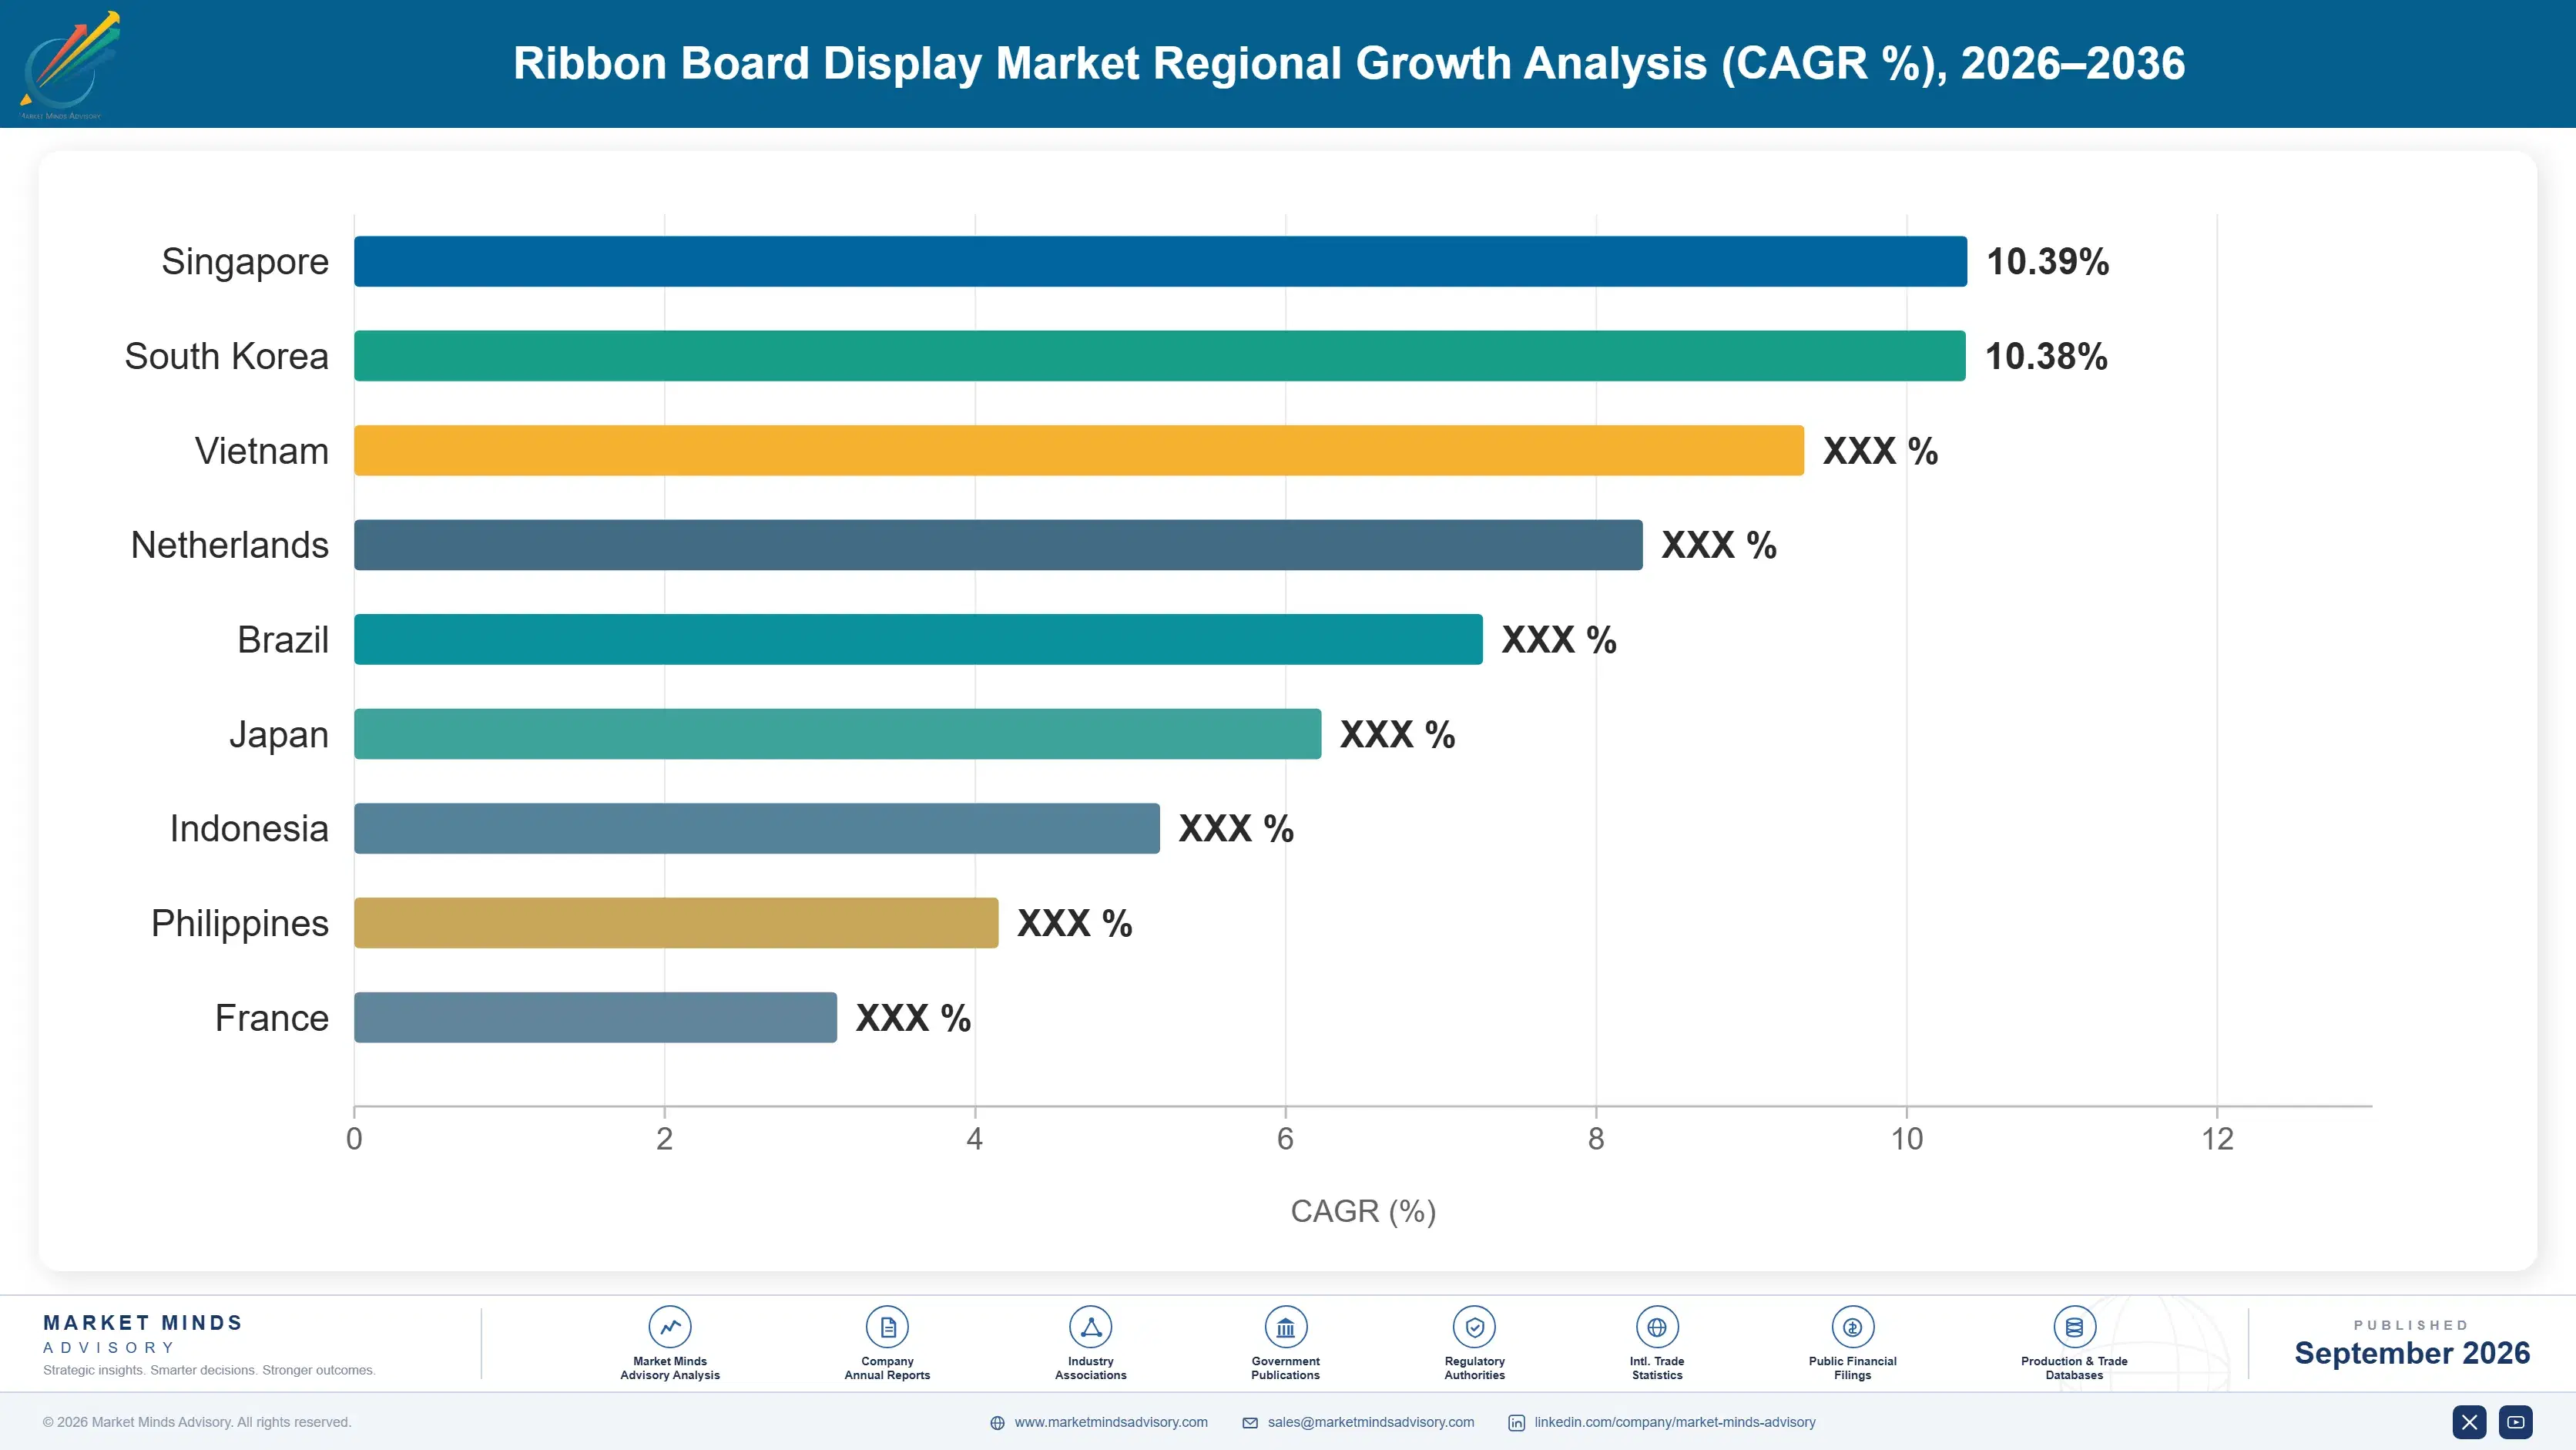
North America leads global demand given its mature professional sports league density, with the Middle East posting outsized regional spending well above its population share, driven by Gulf state tournament hosting infrastructure investment. South Asia and Pacific posts the fastest regional growth rate. Regional adoption patterns vary meaningfully by sport.

North America

North America's demand reflects two forces operating simultaneously: the deepest professional sports league density among major economies, sustaining ongoing venue refresh cycles across dozens of major and minor league stadiums, and rising sponsorship advertising rates that increasingly favor dynamic display formats over static signage. Regional venue operators face mounting pressure to modernize signage ahead of broadcast quality expectations, and ribbon board spending has moved from a minor facilities line to a core sponsorship revenue priority across most major professional sports categories. Vendors serving this region increasingly maintain dedicated sponsorship yield optimization teams given the complex, league-specific broadcast requirements many professional sports organizations now demand ahead of season openers. Canada contributes steadily growing demand tied to comparable league expansion.
Share: 32% | CAGR: 8.5% (2026 to 2036)

Western Europe

Western European demand centers on top-tier football league stadiums that command among the highest sponsorship advertising rates globally, sustaining continuous ribbon board upgrade cycles tied to broadcast rights renewal negotiations across most major domestic leagues. Regulatory harmonization efforts across the European Union have accelerated content management interoperability standard adoption relative to other regions, giving vendors with certified interoperable platforms a meaningful competitive advantage over proprietary architecture competitors. Fine-pitch adoption is especially advanced here, since several flagship stadiums have already completed initial upgrade cycles. Growth trails the global average given the region's comparatively mature signage infrastructure base. The United Kingdom contributes comparable upgrade activity across its Premier League venues. Germany contributes comparable activity across its Bundesliga venue network.
Share: 20% | CAGR: 7.2% (2026 to 2036)
Regional intelligence for 5 additional markets available in the complete report: East Asia, South Asia and Pacific, Latin America, Middle East and Africa, Eastern Europe. Contact sales@marketmindsadvisory.com.
ribbon-board-display-market-country-cagr-analysis-1788415240772

Where Display Vendors Can Capture Margin

Beyond core panel sales growth, several commercial mechanisms let vendors capture disproportionate margin as venue operators shift procurement from one-time panel purchases toward continuous sponsorship content platform relationships over the coming decade across most major sports markets worldwide. These mechanisms span analytics bundling, account structure, financing, and standardization, rewarding vendors who invest ahead of visible demand signals.

Expand Sponsorship Yield Optimization Service Offerings

Vendors that bundle sponsorship yield optimization software into ribbon board contracts capture recurring revenue streams that pure panel competitors miss entirely once initial installation is complete. Daktronics and Panasonic have both expanded yield optimization offerings, covering at least 27 percent of forecast segment revenue through recurring analytics subscriptions rather than one-time panel sales. This shifts vendor economics toward the higher-margin, stickier revenue profile venue operators increasingly prefer for long-term sponsorship budget planning. Venue operators evaluating platform ROI increasingly require documented sponsorship yield gains before approving expanded licensing commitments nationwide today.
Market Impact: Covers 27 percent of segment revenue via analytics

Build Dedicated Tournament Construction Account Teams

International tournament construction remains a fast-growing demand channel yet is often served through generalist venue sales teams built for domestic customers rather than the faster, more complex delivery cycles multi-venue tournament construction requires. A dedicated account structure converts episodic construction projects into standing multi-year framework agreements with better margin retention and forecast visibility. Vendors serving this channel increasingly maintain separate sales organizations entirely, recognizing the distinct commercial rhythm tournament procurement now requires relative to conventional venue sales cycles. Vendors report roughly 27 percent faster contract closure once dedicated tournament account structures replace generalist venue sales coverage.
Market Impact: Closes contracts 27 percent faster than generalist teams

Offer Financing Partnerships for Collegiate Venues

Vendors offering financing partnerships that spread the higher upfront cost of fine-pitch panels over several years capture collegiate and amateur venues who would otherwise defer upgrade given constrained near-term facility budgets. This shifts the purchase decision from an upfront capital constraint toward a manageable monthly payment comparison against sponsorship revenue gains. Vendors offering financing report meaningfully higher conversion rates among collegiate venues, covering at least 23 percent of collegiate-segment revenue through financed transactions. Smaller venues lacking financing partnerships increasingly struggle to compete for continued sponsorship approval. Early movers in this niche capture disproportionate share.
Market Impact: Covers at least 23 percent of segment revenue

Pursue Content Standardization Consortium Partnerships Directly

Vendors that help venues navigate multi-sponsor content standardization through industry consortium participation can accelerate deployment timelines meaningfully relative to competitors dependent on custom point-to-point integration for every sponsor relationship. This positions vendors as strategic partners in the broader content interoperability conversation itself rather than simply panel suppliers waiting for integration requests to arrive. Vendors with proven consortium engagement expertise increasingly win preferred status among venues managing the largest, most complex multi-sponsor advertising portfolios. This approach has shortened deployment timelines by roughly 22 percent among the earliest vendor adopters pursuing this structure.
Market Impact: Shortens deployment timelines by 22 percent for adopters

Who Controls the Margin Pool

The top five players hold a combined 42 percent share on a shipment value basis, a moderate gap separating global display technology majors with integrated content platforms from smaller regional panel vendors serving narrower collegiate budget categories. Basis of assessment is annual shipment value, held consistently across all companies profiled. This gap has widened as broadcast quality requirements filter out under-resourced regional vendors from the largest tenders.
Current competitive activity centers on three dimensions simultaneously: fine-pitch resolution capacity expansion racing ahead of broadcast quality expectations, sponsorship yield optimization software development targeting recurring revenue, and tournament construction positioning as vendors navigate increasingly complex multi-venue delivery requirements across multiple regional hosting commitments. Several vendors are also piloting AI-assisted dynamic sponsorship targeting to maximize yield on complex multi-sponsor rotation schedules.

Emerging pressure is coming from Chinese domestic manufacturers scaling rapidly on price within their home market and increasingly bidding on international tournament construction contracts, compressing margins for global majors in price-sensitive emerging market tenders. Rankings could shift as vendors pursuing content standardization partnerships begin capturing share previously reserved for the largest five majors. Global majors are responding by expanding local manufacturing partnerships to compete on price in these emerging markets.
ribbon-board-display-market-company-positioning-matrix-1788415241303

Competitive Moat and Risk Dimensions

DAKTRONICS

Moat: Integrated Content Platform Depth

Daktronics holds deep expertise combining fine-pitch panel manufacturing with integrated sponsorship content management software, giving it credibility with venue operators evaluating long-term revenue platform roadmaps rather than near-term unit pricing alone across competing vendor proposals. This depth of integration matters enormously to venue operators managing dozens of interconnected sponsorship relationships across multiple broadcast partnerships and seasons.
DAKTRONICS

Risk: Slower International Delivery Scale

Daktronics's domestic manufacturing base sometimes creates delivery timeline challenges for large international tournament construction projects, creating openings for competitors with established global manufacturing footprints in the fastest-growing tournament construction segments of the market. Daktronics has responded by expanding international manufacturing partnerships to improve its delivery position in fast-growing tournament markets.
PANASONIC

Moat: Global Manufacturing Scale Reach

Panasonic operates vertically integrated manufacturing spanning component fabrication through finished panel assembly across multiple continents, giving it cost and delivery scale advantages that smaller competitors relying on single-region production cannot easily replicate for large international projects. This manufacturing depth increasingly translates into multi-year framework agreements with tournament organizers who prioritize delivery reliability over marginal upfront cost differences.
PANASONIC

Risk: Currency and Regional Concentration Risk

Panasonic's global footprint exposes it to currency volatility and regional demand concentration risk that more geographically focused competitors avoid, potentially compressing margins relative to vendors serving fewer, more predictable regulatory jurisdictions simultaneously. Panasonic has responded by expanding regional manufacturing partnerships to reduce its currency and supply chain exposure over time.

Players Tracked

Prominent Players

Daktronics
Panasonic
Samsung Electronics
LG Electronics
ANC Sports Enterprises

Other Key Players

Absen
Unilumin
Leyard Optoelectronic
NEC Display Solutions
Barco
Christie Digital Systems
Mitsubishi Electric
Sony
Nevco
Trans-Lux Corporation
Yaham Optoelectronics
Vantage LED
Watchfire Signs
Prismview
Formetco

Recent Developments

JANUARY 2026

Daktronics Expands Fine-Pitch Manufacturing Capacity

Daktronics announced a major fine-pitch panel manufacturing capacity expansion at its domestic production facilities, adding output specifically to serve growing tournament construction demand ahead of upcoming international hosting infrastructure deadlines. The expansion follows growing tournament organizer demand for guaranteed manufacturing capacity ahead of tightening delivery timelines across multiple venues.
Signal: Signals accelerating vendor investment in capacity ahead of anticipated tournament construction demand nationwide today overall today
SEPTEMBER 2025

Panasonic Acquires Sponsorship Analytics Software Firm

Panasonic acquired a specialized sponsorship yield analytics software developer to strengthen its content management portfolio, extending its offering without the multi-year cost of building comparable capability entirely in-house. The acquisition strengthens Panasonic's position bidding on the largest sponsorship-driven venue programs across North America and Europe.
Signal: Reflects growing vendor preference for acquisition over organic technology development broadly today broadly today overall today
MAY 2025

Samsung Signs Tournament Construction Partnership

Samsung entered a multi-venue supply partnership with a major tournament organizing committee to provide fine-pitch ribbon boards across a dozen new and renovated stadiums, addressing a persistent delivery scheduling barrier smaller vendors face in large tournament programs. The agreement addresses persistent scheduling constraints that have delayed comparable tournament construction programs.
Signal: Indicates growing vendor focus on tournament partnerships to accelerate large-scale delivery commitments across large-scale tournament programs

LED Chip and Aluminum Housing Exposure

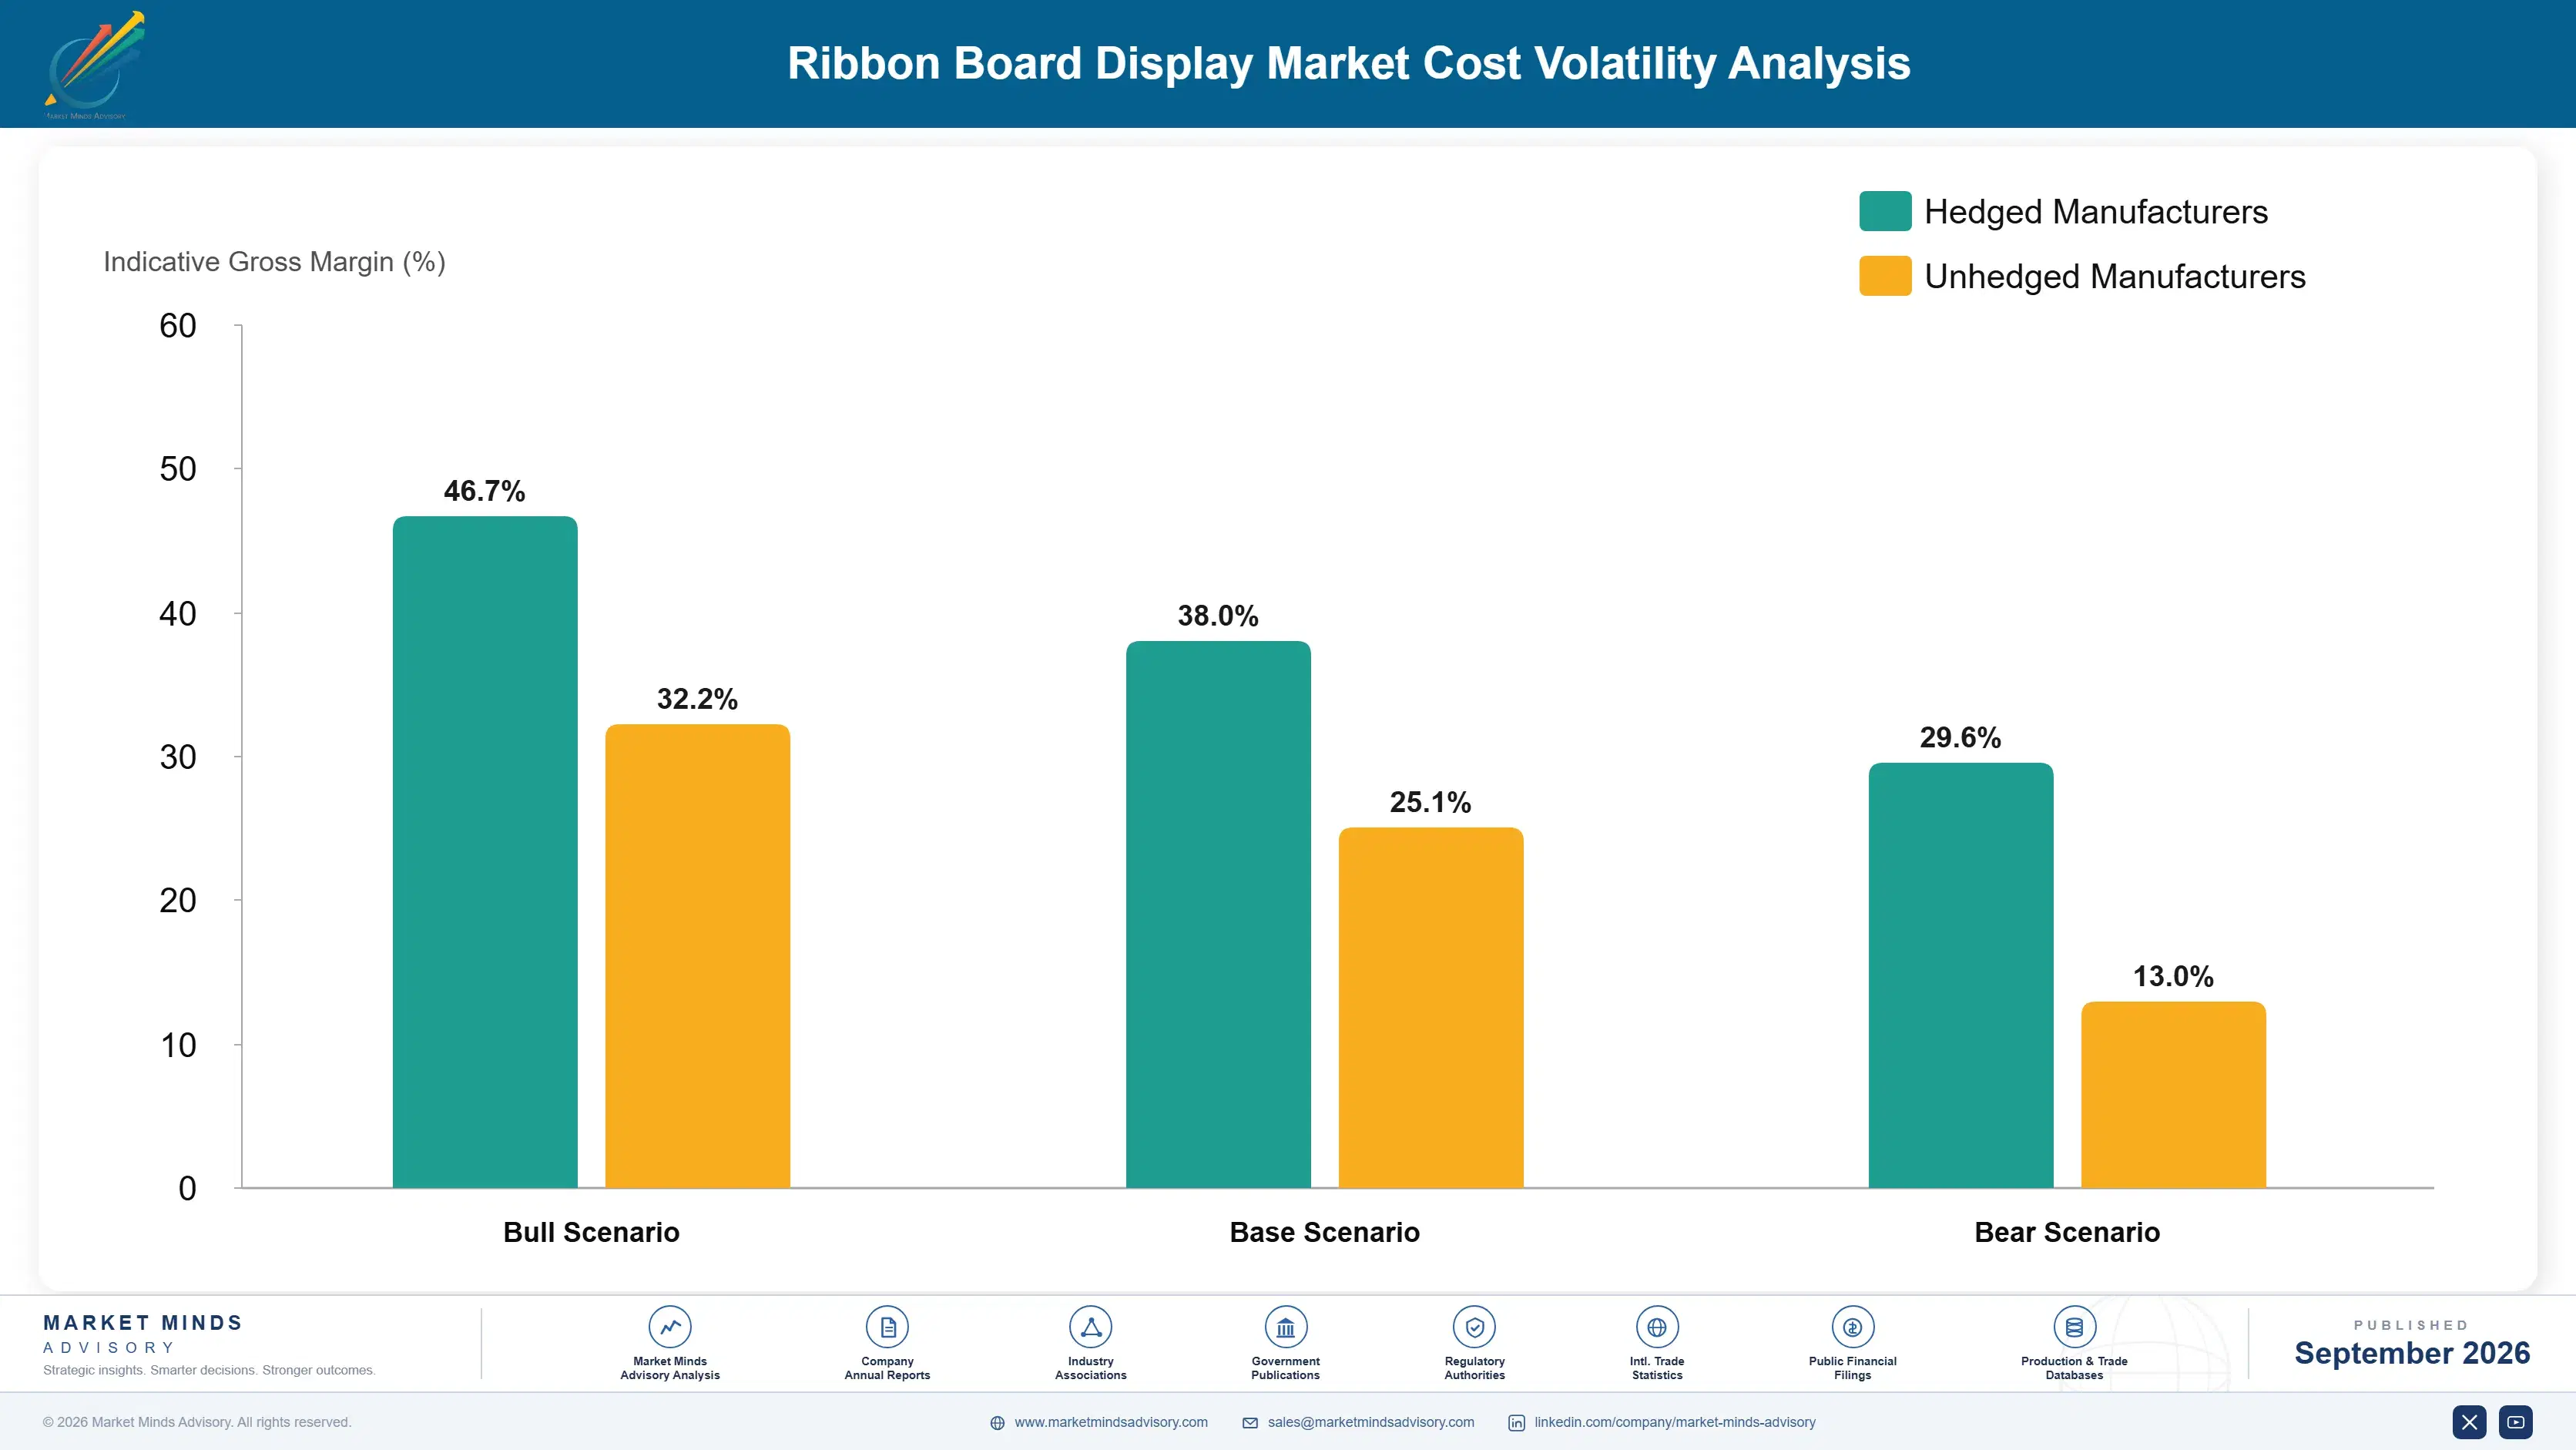
LED chip components and aluminum panel housing together represent roughly 34 percent of total cost of goods sold for ribbon board manufacturers, sourced through global semiconductor and metals supply chains concentrated in a small number of advanced production facilities. Circuit board assembly and power supply components round out the remainder, at smaller cost proportions relative to core LED chip content.
LED chip prices spiked more than 25 percent within a six-month window during 2021 following global semiconductor supply chain disruption, according to company annual reports and industry electronics component pricing disclosures, forcing several manufacturers to renegotiate long-term supply contract terms mid-cycle across affected production lines. Manufacturers without diversified supplier relationships bore the full brunt of that swing directly, damaging customer relationships built over years of consistent quoting.

This exposure disadvantages smaller regional manufacturers lacking direct chip supplier relationships far more than global majors with dedicated procurement teams and long-term allocation agreements, since smaller firms typically source through distributors and absorb allocation shortages directly into extended customer delivery timelines rather than negotiated priority access. MMA's primary survey confirms this pattern held consistently across every region tracked during the disruption period and its lingering aftermath.
ribbon-board-display-market-cost-volatility-analysis-1788415241500

Multi-Source LED Chip Procurement Strategy

Manufacturers qualify LED chips from multiple semiconductor suppliers rather than relying on a single source, reducing exposure to localized fabrication disruptions and improving negotiating leverage during periods of tight allocation across the industry. This approach is increasingly standard among manufacturers serving the largest, most demanding venue framework agreements. This diversification also reduces single-point-of-failure risk.

Direct Long-Term Chip Allocation Agreements

Larger manufacturers increasingly negotiate direct long-term allocation agreements with semiconductor fabricators, securing priority access during shortage periods that smaller competitors sourcing through distributors typically cannot obtain. This capital-intensive approach favors the largest manufacturers with sufficient purchasing scale to justify long-term commitments. Manufacturers with strong treasury functions increasingly formalize this into a dedicated hedging desk.

Recycled Aluminum and Vertical Integration

Larger manufacturers increasingly source recycled aluminum alongside forward-contracted virgin material, reducing exposure to primary aluminum market volatility that has affected panel housing pricing repeatedly. Manufacturers report meaningfully more stable margins after adopting this dual-sourcing approach broadly. Manufacturers investing early in this approach report meaningfully lower per-panel cost structures overall. This flexibility increasingly differentiates vendors during scarcity periods.

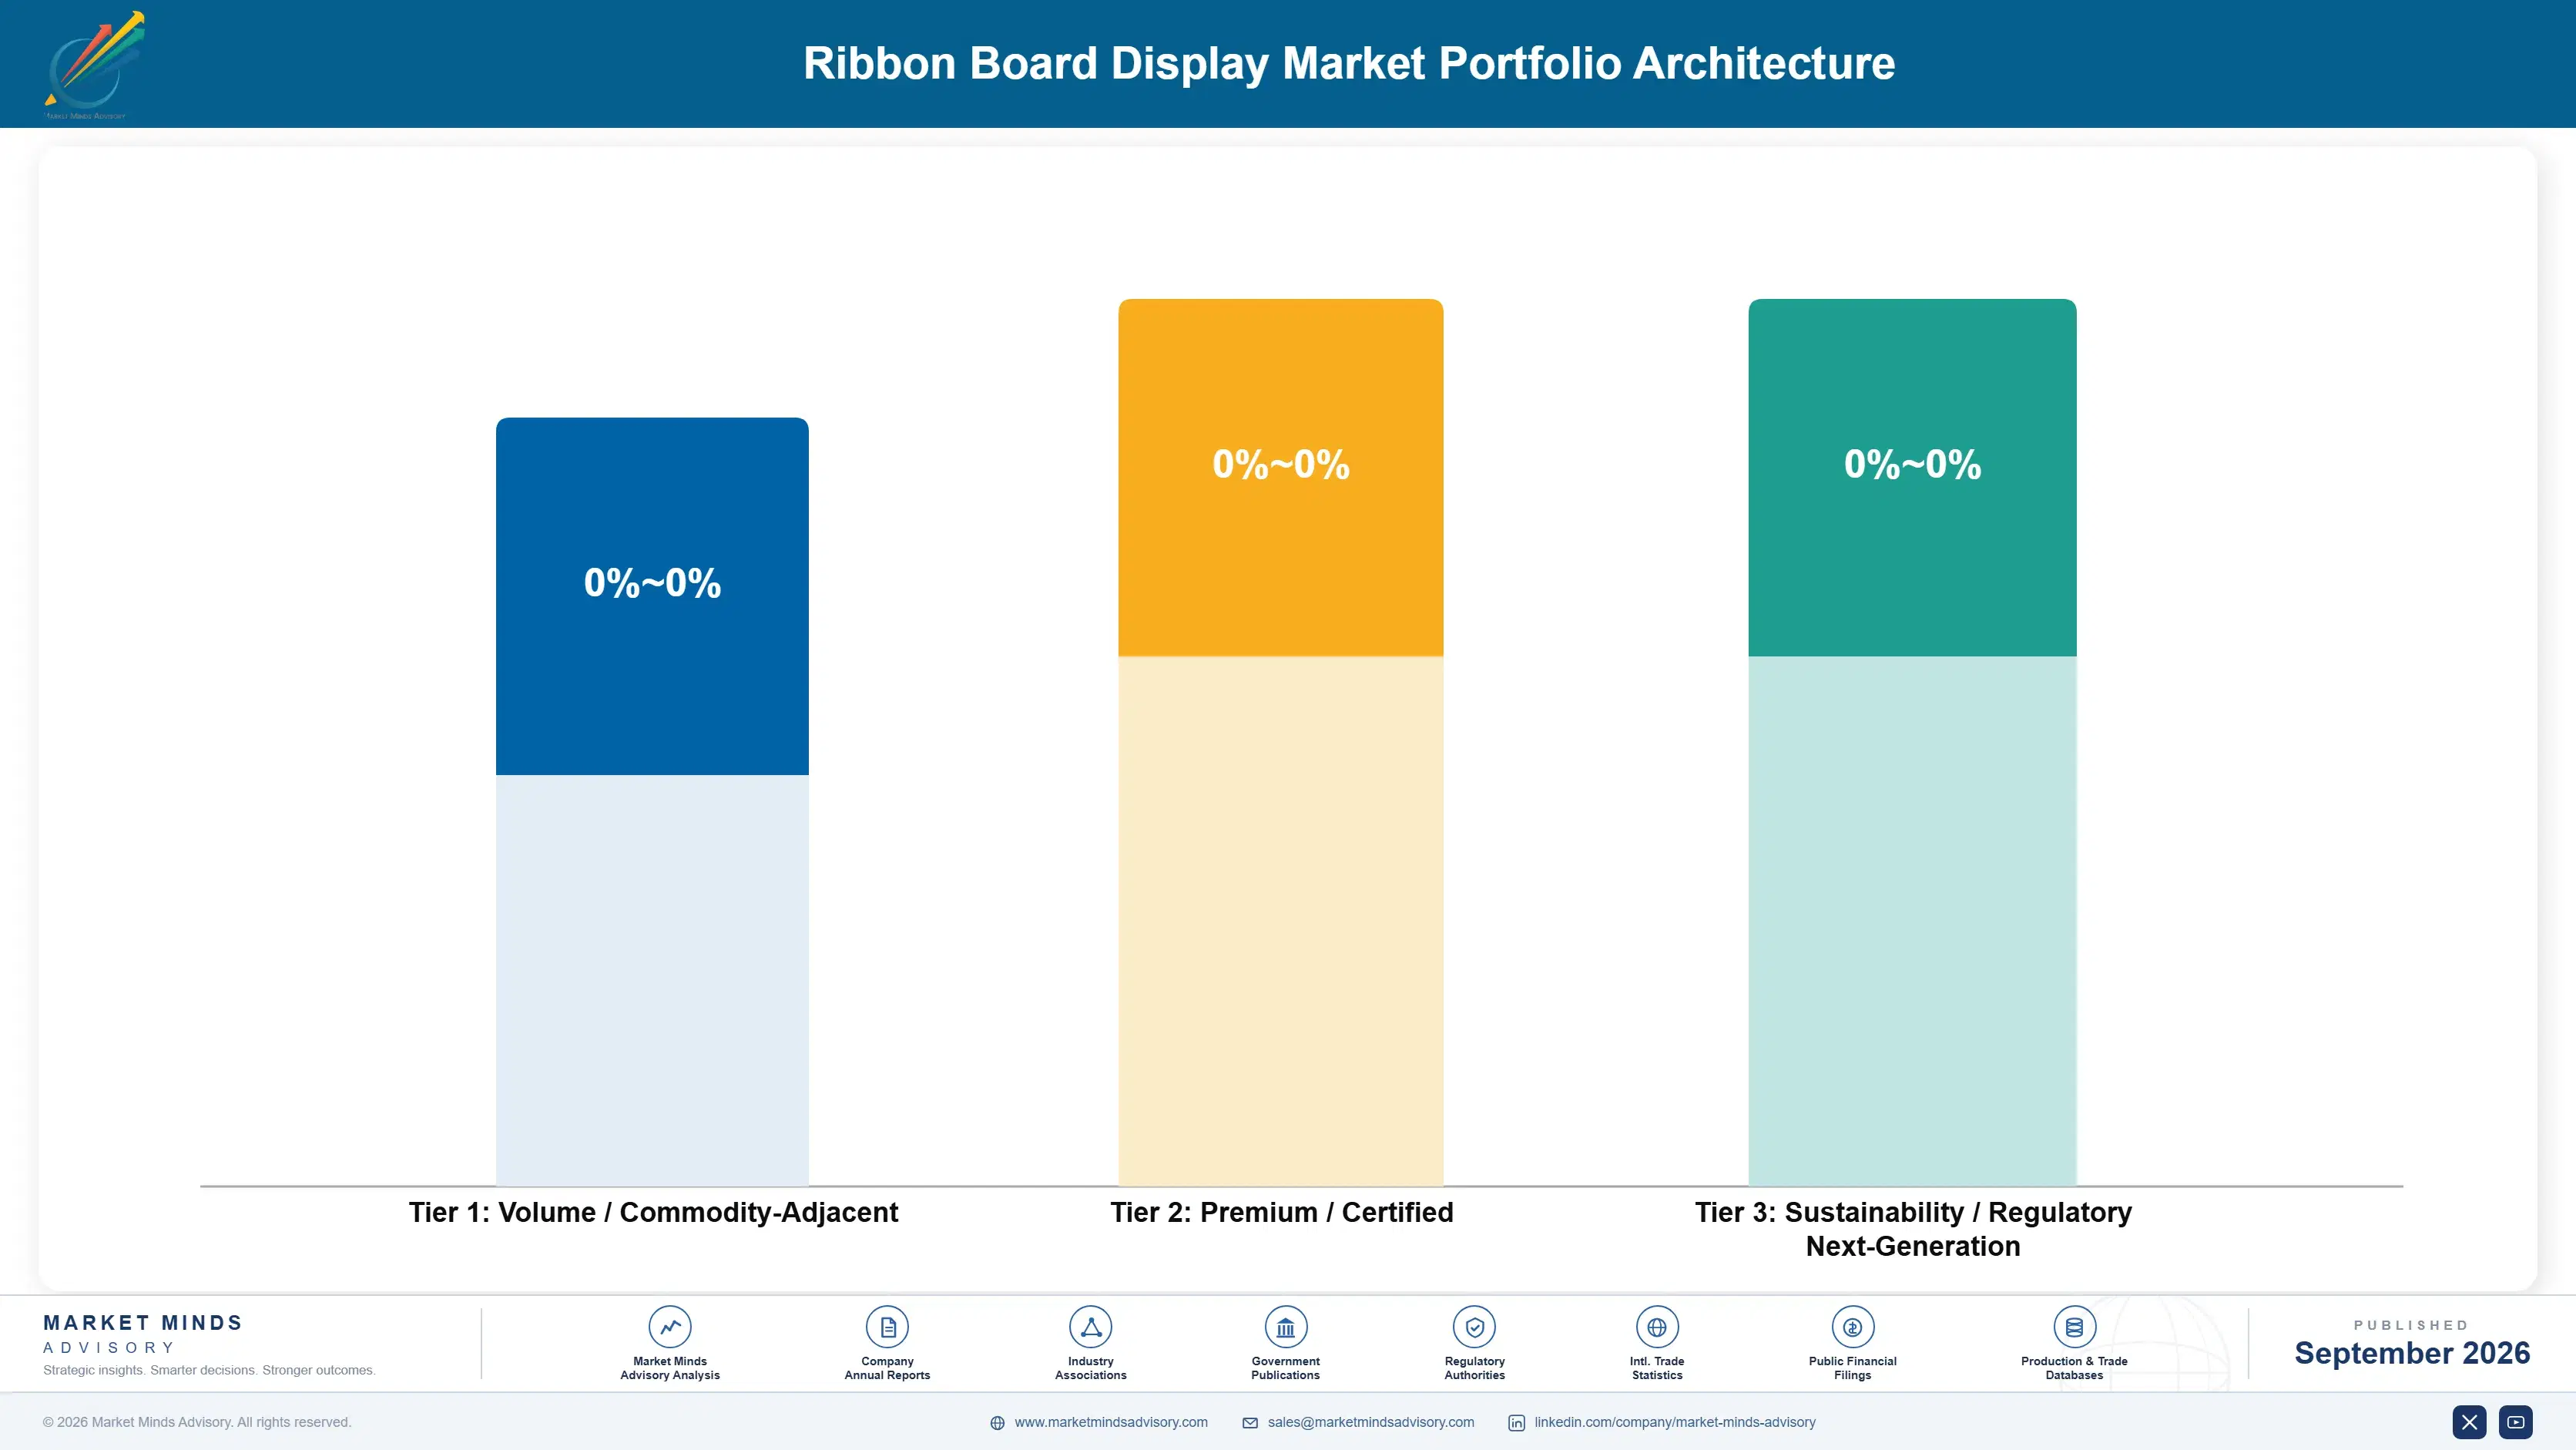
Portfolio Architecture for Margin Defence

Portfolio economics split across three tiers: volume-commodity-adjacent standard-pitch panels competing mainly on price, premium certified fine-pitch displays serving venues requiring documented broadcast quality, and next-generation sponsorship analytics platforms capturing customers focused on revenue optimization and dynamic content. Vendors with diversified portfolios weather procurement cycles better than single-tier specialists. Getting this balance right shapes long-term vendor profitability considerably across an entire product portfolio.
Volume tension is real: cost-constrained collegiate venues on tight budgets default to standard-pitch panels meeting minimum functional requirements, while larger professional venues managing brand and sponsorship risk increasingly specify fine-pitch or analytics-integrated platforms regardless of marginal cost differences. Vendors leaning too heavily into commodity volume risk ceding the fastest-growing premium tenders to better-equipped, certified competitors. Getting this balance right separates the most profitable vendors from those merely chasing volume.

High-value margin pools concentrate in sponsorship yield optimization software and fine-pitch international tournament construction, where recurring revenue and specialized delivery capability both support meaningfully wider margins than standard panel sales agreements. Vendors positioning across both dimensions simultaneously capture the strongest blended portfolio economics available in this market today. The gap versus vendors competing purely on panel volume continues widening steadily across most markets MMA tracks.

Volume / Commodity-Adjacent

Standard-pitch panels meeting minimum functional requirements, sold primarily on price into cost-constrained collegiate and amateur venue tenders. Manufacturing utilization here mainly serves fixed cost recovery rather than driving margin expansion.
Gross Margin: 16 to 22%

Premium / Certified

Fine-pitch panels meeting the strictest broadcast quality and interoperability standards, commanding tender premiums tied to documented picture quality credentials. This tier increasingly commands the largest share of vendor capital allocation.
Gross Margin: 28 to 36%

Sustainability / Regulatory / Next-Generation

Sponsorship yield optimization software and dynamic content platforms generating high-margin recurring revenue independent of individual panel sale cycles. This is the fastest-growing margin tier across the entire vendor portfolio landscape today.
Gross Margin: 34 to 42%
ribbon-board-display-market-portfolio-architecture-1788415241999

High-value Sub-segments and Strategic Watch-out

Fine-Pitch LED Ribbon Board Technology

The clearest high-value high-growth pocket in this market, combining premium tender pricing with the fastest segment CAGR tracked, as broadcasters increasingly treat fine-pitch resolution as standard rather than a niche option. Capital allocation here should continue rising through the forecast period. Priority allocation continues expanding steadily.
Gross Margin: 36 to 44%

Sponsorship Yield Optimization Software

A high-value moderate-growth pool where recurring analytics revenue commands strong margins even as new panel sale growth moderates across already well-served core professional venue markets. Vendors with established platforms hold a durable edge. Venues increasingly favor bundled analytics contracts over standalone panel procurement today alone.
Gross Margin: 32 to 40%

Standard Collegiate and Amateur Displays

The volume core of this market, providing steady multi-year replacement revenue at thinner margins that fund manufacturing utilization without materially expanding overall profitability across cycles. Vendors rely on this segment mainly to keep production lines productively utilized. Margins here rarely exceed the low twenties even in favorable pricing years.
Gross Margin: 16 to 22%

Legacy Static Signage Formats

A strategic watch-out segment losing share to dynamic alternatives as sponsorship revenue expectations tighten, forcing venues still dependent on this format to plan technology transition before contracts lapse entirely. Early transition planning reduces stranded manufacturing capacity risk considerably. Revenue pressure here should build steadily through the forecast period.
Gross Margin: 8 to 13%

Recurring Season Cycles Sustain Revenue

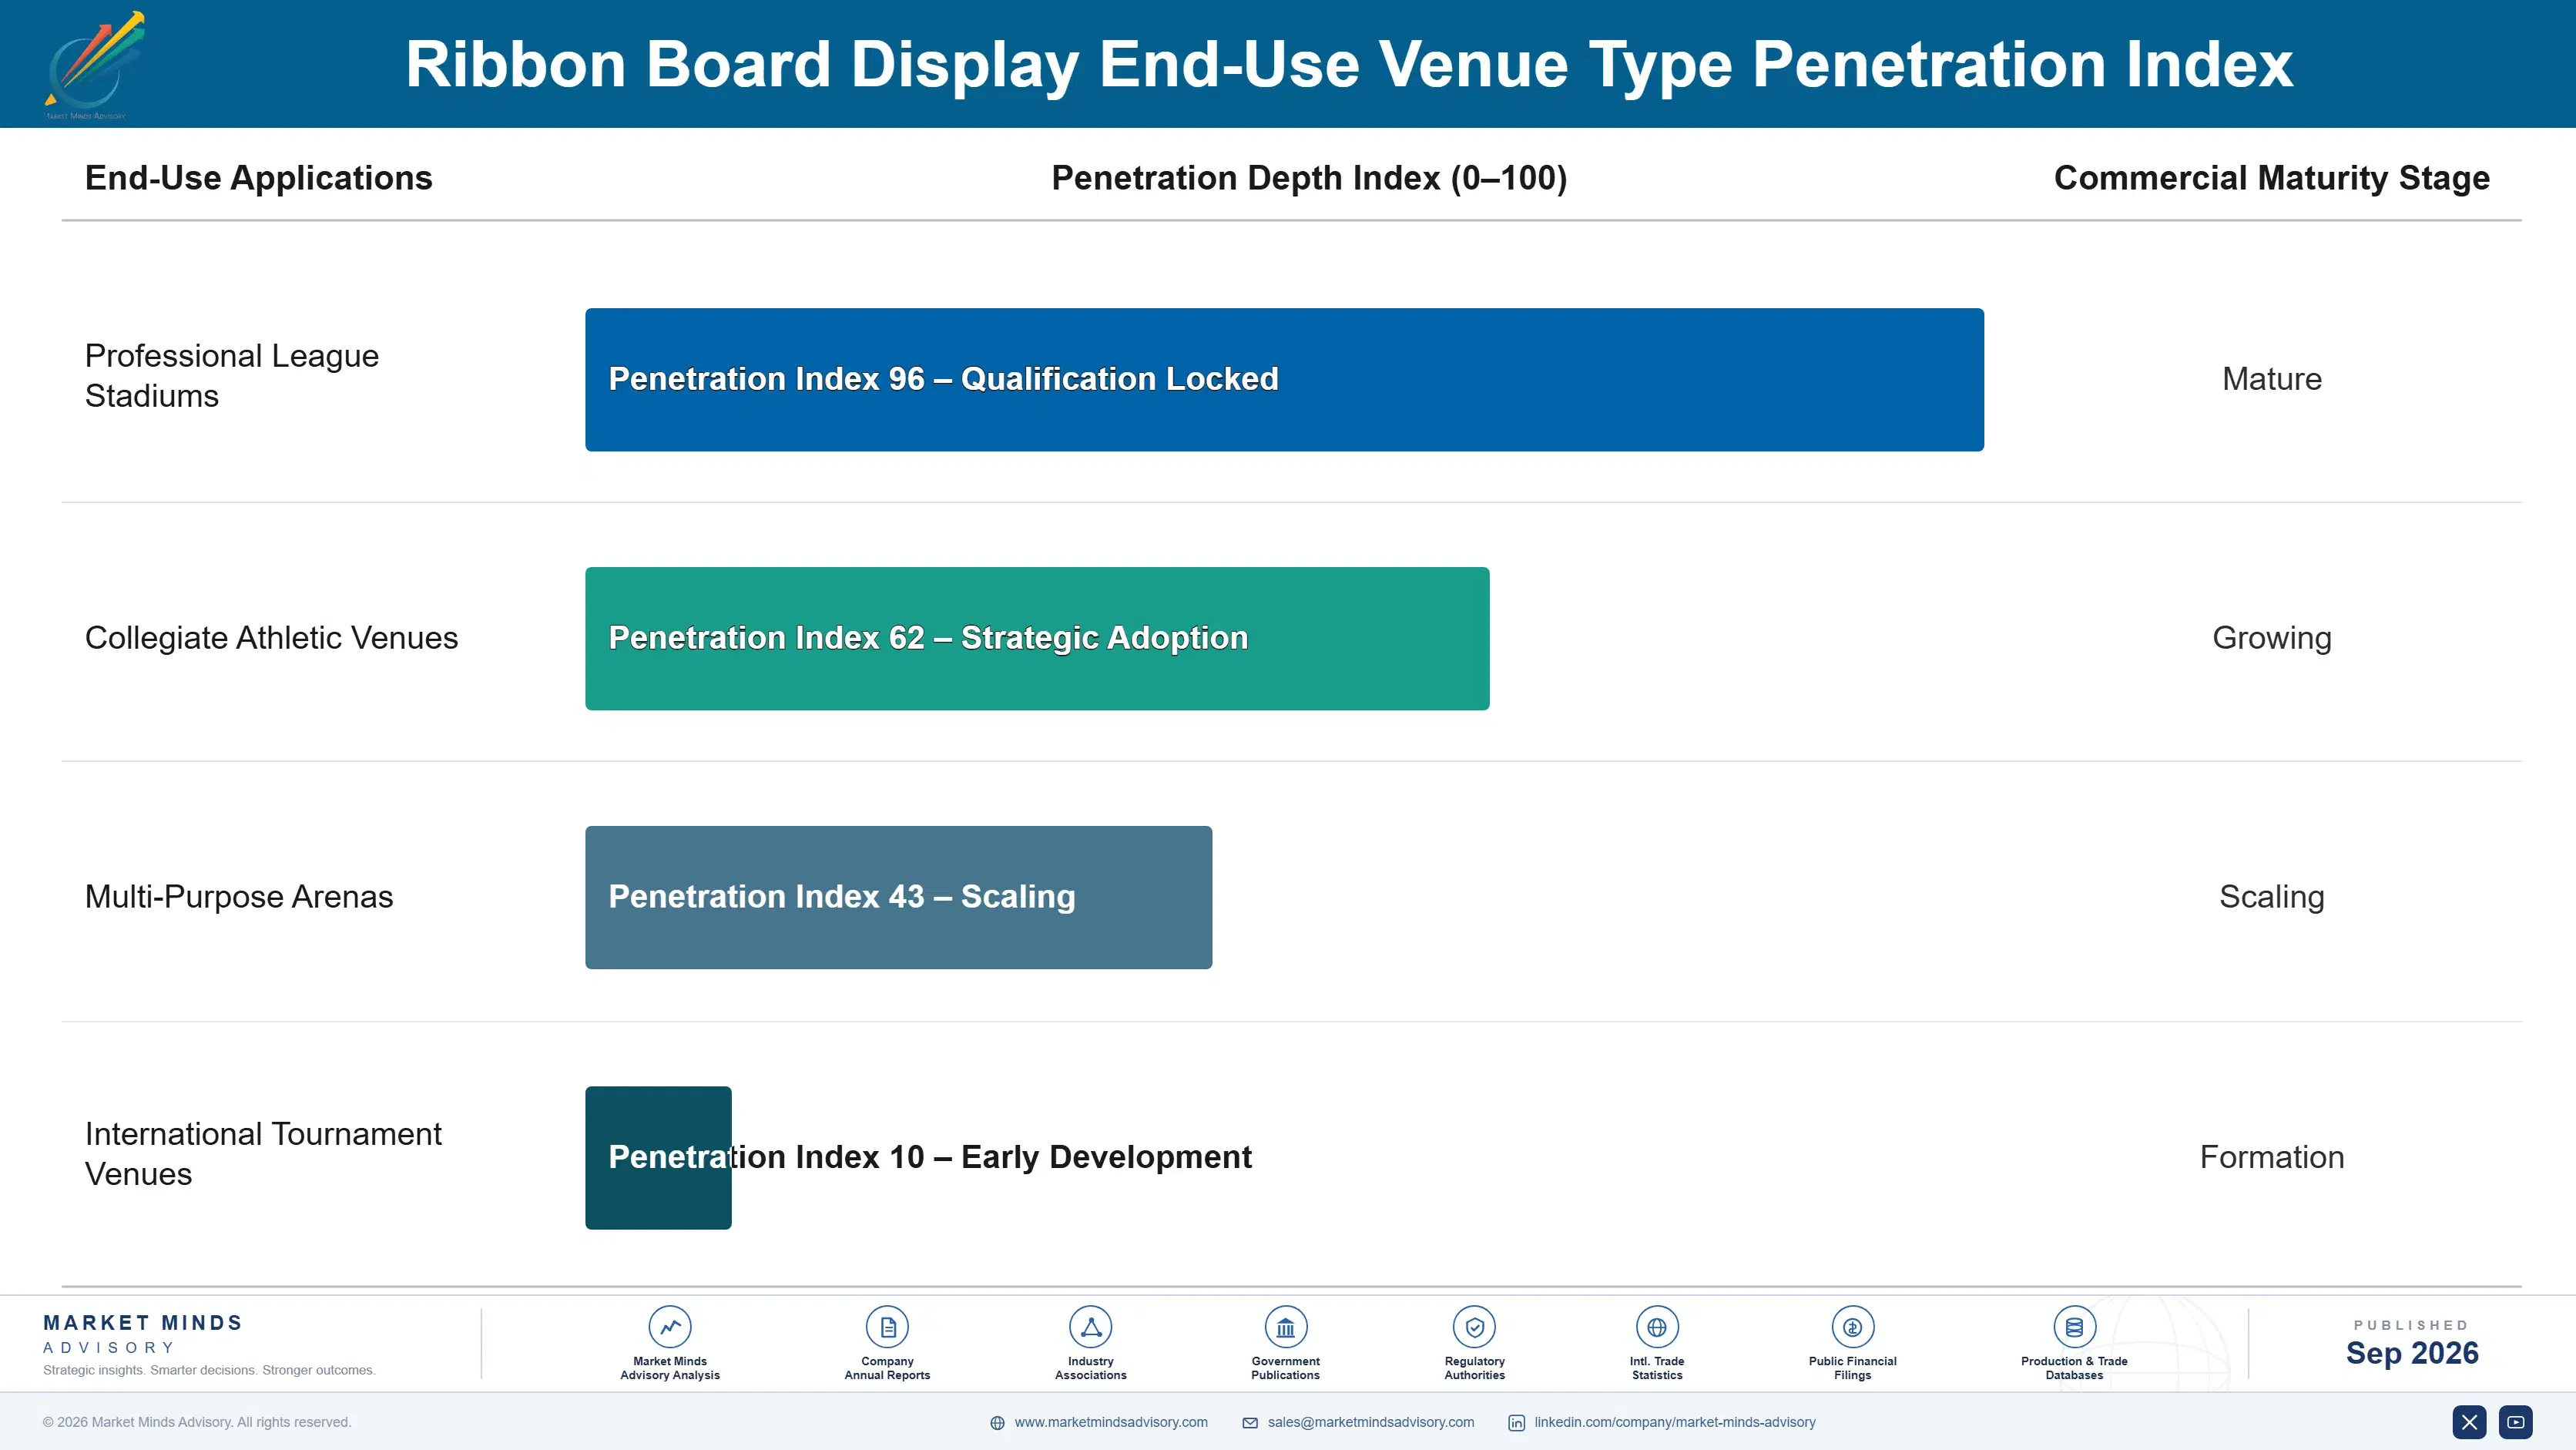
Ribbon board revenue behaves like an annuity tied to the roughly nine-year panel replacement cycle and sponsorship season renewals rather than a single purchase, since every venue eventually requires panel replacement or content platform upgrades regardless of which vendor originally won the installation. Vendors that secure the initial installation capture repeat orders when replacement cycles arrive, and sponsorship season renewals add a predictable secondary revenue layer tied to broadcast rights negotiation cycles rather than pure hardware wear.
Professional sports franchises show the highest adoption stickiness, since multi-year sponsorship contracts and broadcast integration depth rarely favor switching vendors mid-season once initial platform selection clears procurement vetting. Collegiate and amateur venues show markedly lower stickiness, chasing whichever vendor offers the best combination of price and financing terms for episodic facility upgrade decisions. Mid-tier professional venues show intermediate stickiness, balancing cost sensitivity against sponsorship relationship depth.

Procurement authority is shifting from individual facility managers toward centralized venue technology departments that increasingly negotiate multi-year framework agreements directly with vendors rather than letting individual venues select suppliers independently. Younger facility managers increasingly favor vendors offering transparent digital quote platforms over relationship-based sales calls, rewarding vendors that offer integrated pricing.
ribbon-board-display-market-end-use-penetration-index-1788415242489

Where MMA Sees the Opportunity

These are among the four positions where our research anticipates prominent divergence between winners and laggards over the coming forecast period. Each is grounded in the demand model, the regulatory perimeter, and the announced capacity pipeline.
01 / FINE-PITCH CAPACITY INVESTMENT

Expand fine-pitch capacity ahead of broadcast requirements

Roughly 36 percent of new installations already specify fine-pitch resolution, and vendors offering broadcast-grade panels capture premium positioning as venues document picture quality compliance for broadcast rights negotiations. Daktronics and Panasonic have both expanded fine-pitch offerings, positioning themselves ahead of competitors still selling standard-pitch panels without broadcast-grade resolution. Vendors that delay this investment risk losing the largest broadcast-linked contracts to better-positioned, resolution-capable competitors within a few short years as enforcement of quality standards tightens further across every major hosting jurisdiction.
02 / TOURNAMENT CONSTRUCTION CHANNEL DEVELOPMENT

Build dedicated teams to navigate multi-venue delivery

Tournament construction demand ties directly to complex multi-venue delivery cycles, yet many vendors still serve this channel through generalist venue sales teams unequipped to navigate scheduling requirements that can meaningfully slow conversion rates across program-eligible construction projects. A dedicated tournament navigation team converts episodic construction inquiries into completed sales at meaningfully higher rates than generalist coverage achieves alone, since organizers increasingly favor vendors with proven delivery track records. Vendors that build this capability now capture disproportionate share of a rapidly compounding tournament-linked revenue opportunity.
03 / COLLEGIATE FINANCING STRATEGY

Offer financing to convert deferred collegiate demand

Collegiate and amateur venues without access to major sponsorship revenue frequently defer fine-pitch upgrade despite meaningful sponsorship yield benefits higher resolution provides over standard displays across their full facility footprint. Vendors that offer financing partnerships convert this deferred demand into completed sales by reframing the investment around manageable monthly payments rather than upfront capital outlay. This approach captures collegiate segments that price-only competitors without financing options consistently lose to more flexible, better-positioned vendors offering payment alternatives across the broader collegiate athletics market.
04 / CONTENT STANDARDIZATION PARTNERSHIP

Pursue consortium engagement to accelerate multi-sponsor deployment

Venues managing dynamic advertising across dozens of rotating sponsors face content scheduling complexity that basic display software cannot adequately handle, since bridging disparate sponsor relationship structures requires custom engineering work that individual vendors cannot easily standardize alone. Vendors that help venues navigate multi-sponsor content standardization through industry consortium participation position themselves as strategic partners in the broader interoperability conversation rather than simply panel suppliers. This approach has shortened deployment timelines by roughly 22 percent among the earliest vendor adopters pursuing this structure.

Engagement Snapshot From the Field

A live engagement with an industry participant carrying material or product regulatory and market exposure ahead of a defining policy shift, showing how our research translates into a defensible multi-year portfolio strategy.
MARKET MINDS ADVISORY · CLIENT ENGAGEMENT SUMMARY
Ribbon Board Display Producer Strategic Portfolio Review and Transition Roadmap 2026·Investment Scenario on Ribbon Board Display Exposure Evaluation 2025-26
CLIENT PROFILE
The client is a mid-tier professional sports franchise preparing a facility renovation, facing pressure to modernize aging static ribbon board signage after several sponsorship prospects cited limited dynamic advertising inventory as a barrier to larger deals. Leadership was evaluating whether to pursue full-venue renovation immediately or phase investment across several off-seasons instead given budget constraints.
STRATEGIC CHALLENGE
Rising fine-pitch panel costs and inconsistent vendor lead times were compressing renovation budgets and delaying sponsorship revenue realization, while the franchise's limited technical evaluation experience left it uncertain how to compare competing display vendor proposals. Ownership needed a defensible multi-year investment plan before committing further capital toward broader facility renovation projects.
MMA APPROACH
MMA conducted a vendor landscape assessment benchmarking five display platforms on fine-pitch resolution quality and sponsorship analytics capability, modeled a phased signage upgrade roadmap prioritizing the highest-value sponsorship inventory zones, and evaluated financing options against comparable franchise precedents. Findings were validated against three years of historical sponsorship revenue and renewal data across comparable franchises.
KEY FINDINGS
  1. Prioritizing fine-pitch upgrades at the highest-traffic sponsorship zones could increase advertising revenue by roughly 30 percent within one season. during peak game attendance windows.
  2. Two of five benchmarked vendors already offered sponsorship analytics platforms sufficient for the franchise's revenue optimization goals, meaningfully narrowing the shortlist. for near-term procurement.
  3. Financing options used by comparable mid-tier franchises reduced upfront capital requirements considerably relative to standard purchase agreements across comparable franchise deployments. overall.
  4. The highest-traffic sponsorship zones represented a disproportionately small share of total signage square footage, concentrating the priority case. within the total signage inventory.
CLIENT PROFILE
The client is a mid-tier professional sports franchise preparing a facility renovation, facing pressure to modernize aging static ribbon board signage after several sponsorship prospects cited limited dynamic advertising inventory as a barrier to larger deals. Leadership was evaluating whether to pursue full-venue renovation immediately or phase investment across several off-seasons instead given budget constraints.
STRATEGIC CHALLENGE
Rising fine-pitch panel costs and inconsistent vendor lead times were compressing renovation budgets and delaying sponsorship revenue realization, while the franchise's limited technical evaluation experience left it uncertain how to compare competing display vendor proposals. Ownership needed a defensible multi-year investment plan before committing further capital toward broader facility renovation projects.
MMA APPROACH
MMA conducted a vendor landscape assessment benchmarking five display platforms on fine-pitch resolution quality and sponsorship analytics capability, modeled a phased signage upgrade roadmap prioritizing the highest-value sponsorship inventory zones, and evaluated financing options against comparable franchise precedents. Findings were validated against three years of historical sponsorship revenue and renewal data across comparable franchises.
KEY FINDINGS
  1. Prioritizing fine-pitch upgrades at the highest-traffic sponsorship zones could increase advertising revenue by roughly 30 percent within one season. during peak game attendance windows.
  2. Two of five benchmarked vendors already offered sponsorship analytics platforms sufficient for the franchise's revenue optimization goals, meaningfully narrowing the shortlist. for near-term procurement.
  3. Financing options used by comparable mid-tier franchises reduced upfront capital requirements considerably relative to standard purchase agreements across comparable franchise deployments. overall.
  4. The highest-traffic sponsorship zones represented a disproportionately small share of total signage square footage, concentrating the priority case. within the total signage inventory.
RECOMMENDED STRATEGY
Phase 1: Phase 1 (near-term): upgrade the highest-traffic sponsorship zones first, within one off-season cycle. with dedicated installation and calibration support throughout. Phase 2: Phase 2 (medium-term): negotiate a financing agreement with the selected vendor across remaining venue signage. with quarterly revenue reviews scheduled. Phase 3: Phase 3 (longer-term): expand fine-pitch coverage to remaining zones as sponsorship revenue allows over two seasons. with annual progress reviews scheduled.
OUTCOME
Following the first upgraded season, the franchise reported (client-reported, unverified by MMA) meaningfully stronger sponsorship revenue and improved advertiser renewal rates relative to its prior static signage configuration, attributing the gains directly to the phased upgrade roadmap and vendor selection framework MMA developed for its business operations team.

Frequently Asked Questions

Foundational context covering the market sizes, CAGR, scope, country, region and competition that inform every finding below. This section is provided to cover basics and most often pre-purchase conversations, answered from the MMA Primary Research Dataset.

What is the current size of the Ribbon Board Display Market?

The ribbon board display market reached an estimated $1.1 billion in global value in 2025, driven by tournament stadium construction and rising sponsorship advertising demand worldwide.

How large will the Ribbon Board Display Market be by 2036?

MMA projects the market will reach approximately $2.79 billion by 2036, more than doubling in value as fine-pitch technology and tournament construction continue expanding globally.

What is the CAGR for the Ribbon Board Display Market 2026 to 2036?

The market is forecast to grow at an 8.8 percent compound annual growth rate between 2026 and 2036, with bull and bear scenarios ranging from 7.5 to 10.0 percent.

Which segment is growing fastest?

Fine-pitch LED ribbon board technology leads segment growth at a 14.0 percent CAGR, roughly 1.6 times the overall market rate, as broadcast resolution requirements tighten industry-wide.

Who are the major companies in the Ribbon Board Display Market?

Daktronics, Panasonic, Samsung Electronics, LG Electronics, and ANC Sports Enterprises lead the market, together holding an estimated 42 percent combined share on a shipment value basis.

Which country is growing fastest?

Saudi Arabia is growing fastest at a 13.5 percent CAGR, driven by its 2034 World Cup hosting commitment and extensive multi-venue stadium construction pipeline. This exceeds the global market average considerably.

Report Segmentation Architecture

The full report scope spans multiple orthogonal segmentation dimensions, with cross-tabulated demand data provided for each dimension pair. Coverage extends further to regional breakdowns, trend trajectories, and the competitive detail needed to support segment-level decision-making.

By Technology and Market Maturity

  • Professional Sports Arena and Stadium Ribbon Boards
  • Collegiate and Amateur Sports Venue Displays
  • Fine-Pitch LED Ribbon Board Technology
  • Portable and Modular Ribbon Board Systems
  • Advertising and Sponsorship Display Integration
  • International and Emerging Market Stadium Installations

By End-Use Venue Type

  • Professional League Stadiums
  • Collegiate Athletic Venues
  • Multi-Purpose Arenas
  • International Tournament Venues

By Commercial Dimension

  • Direct Venue Procurement
  • Sponsorship Network Partnership Sales
  • Recurring Content Management Contracts
  • Tournament Organizer Construction Tenders

By Region

  • North America
  • Western Europe
  • East Asia
  • South Asia and Pacific
  • Latin America
  • Middle East and Africa
  • Eastern Europe

Scope, Methodology, and Coverage

Every figure in this report is reproducible from documented input assumptions. The scope below maps the historical period, the forecast horizon, the segmentation dimensions, and the countries covered, alongside the underlying primary and qualitative methodology.
Historical Period
2020 to 2025
Forecast Period
2026 to 2036
Base Year
2025 (USD billions; MMA Primary Research Dataset, September 2026)
Market Definition
This market covers LED ribbon board displays and associated content management software installed along stadium and arena perimeters for scoring, sponsorship advertising, and broadcast enhancement purposes. It excludes large-format scoreboard displays sold as standalone centerhung units, stadium video wall systems unrelated to perimeter signage, and general outdoor digital billboard advertising infrastructure.
Quantitative Units
USD billions (current prices); panel square footage volume where applicable
Segmentation Dimensions
By Technology and Market Maturity; By End-Use Venue Type; By Commercial Dimension; By Region
Regions Covered
North America, Western Europe, East Asia, South Asia and Pacific, Latin America, Middle East and Africa, Eastern Europe
Countries Covered
USA, China, Germany, France, UK, Japan, South Korea, India, Australia, Canada, Brazil, Mexico, Indonesia, Vietnam, Thailand, Malaysia, UAE, Saudi Arabia, South Africa, Nigeria, Turkey, Poland, Netherlands, Italy, Spain, Sweden, Switzerland, Argentina, Colombia, Singapore, and additional markets relevant to this sector
Key Companies Profiled
Daktronics, Panasonic, Samsung Electronics, LG Electronics, ANC Sports Enterprises, Absen, Unilumin, Leyard Optoelectronic, NEC Display Solutions, Barco, Christie Digital Systems, Mitsubishi Electric, Sony, Nevco, Trans-Lux Corporation, Yaham Optoelectronics, Vantage LED, Watchfire Signs, Prismview, Formetco
Quantitative Methodology
Primary survey, n=3,800 respondents, Q4 2025, six countries; demand-side model with trade association cross-validation
Qualitative Methodology
47 expert interviews, Q4 2025; applied to validate demand model assumptions, identify emerging dynamics, and assess competitive positioning
Report Format
PDF and XLSX data workbook (Word format preview document)
Publisher
Market Minds Advisory
Report Code
MMA-2026-TEC-573
Published
September 2026
Contact
sales@marketmindsadvisory.com | www.marketmindsadvisory.com

Purchase the full Ribbon Board Display Market Report (2026 to 2036).

This report provides a comprehensive assessment of the ribbon board display market, covering demand drivers across professional, collegiate, and tournament construction segments through 2036. It includes detailed competitive benchmarking of twenty leading display vendors evaluated on a shipment value basis. Regional demand architecture is mapped across all seven global regions, with particular depth on North American and Middle Eastern dynamics. LED chip input cost exposure and sponsorship strategy are analyzed alongside revenue lever prioritization for vendors navigating this transition. The report is designed for venue technology executives, sponsorship revenue leaders, and facility procurement teams evaluating vendor positioning.
Ten-year global market sizing and forecast
Seven-region global regional demand architecture breakdown
Twenty-company detailed competitive benchmarking and profiling
LED chip input cost exposure and hedging modeling
Revenue lever prioritization and margin framework
Anonymized mid-tier franchise sponsorship case study

Built For The People Who Decide

From boardroom strategy to bench-side execution, this report is read cover-to-cover by leaders shaping the next decade of their industry, turning demand scenarios, market dynamics and valuation benchmarks into decisions.
CXOs/ Presidents/ VPs/ Managers
M&A and Corporate Development
Strategy Teams and R&D Heads
Procurement and Product Directors
Regulatory and Compliance Leaders
Investor Relations and Equity Analysts