Market Minds Advisory
RFID Blood Monitoring Systems Market

RFID Blood Monitoring Systems Market: Competing Against A Barcode That Already Works

Blood carries the strictest audit trail in any hospital and the worst inventory discipline, and the saving from fixing that lands in a budget belonging to somebody other than the buyer.

Lead Analyst

Published

September 2026

Make Smarter Decisions with Customized Research Insights

Request a free sample report and evaluate market opportunities, growth trends, and competitive dynamics relevant to your business needs.

2025 MARKET VALUE$0.3BMarket Size 2025
2036 FORECAST VALUE$1.2BBase Case , 2026 to 2036
CAGR 2026 TO 203612.6 %Bull 13.8% / Bear 11.4%
INCREMENTAL OPPORTUNITY$0.9BNet 10- year value creation
EXPANSION MULTIPLE3.29x2036 value over 2026 base
Strategic Levers
M&A Pipeline
Regional Outlook
Country Rankings
Competitive Intelligence
Segmental Deep-dive
Call-Us : 91 93563 13602

Executive Snapshot and Market Trajectory

Every unit of blood already carries a barcode that works, is standardised worldwide and costs nothing at the point of use. Radio frequency identification has to beat good enough, which is why the argument that actually sells is wastage rather than traceability. Suppliers who understood that sold considerably more.
Western Europe holds 30% of value because European traceability requirements arrived earlier and several national blood services deployed at scale, while American adoption lagged behind an entrenched barcode standard. Vein-to-vein traceability platforms grow at 18.9%, half again the market rate of 12.6%, since the value sits in connecting donation to transfusion rather than in reading a tag. Hardware alone has never justified the investment anywhere.
Concentration is low at 44%, and the field mixes specialist blood traceability companies with general identification technology suppliers who understand radio frequency and not transfusion. Platelets carry the economics: they cost several times a red cell unit and expire within a week, so the saving arrives there long before it appears anywhere else in a hospital's blood budget. The saving arrives there long before it shows anywhere else in a blood budget.
Market Definition
The market covers radio frequency identification systems used to track, monitor and manage blood products from collection through to transfusion, including tags and labels applied to blood products, fixed readers and smart storage cabinets, temperature logging sensor tags, blood inventory management software, bedside transfusion verification systems, and vein-to-vein traceability platforms. Barcode-only identification systems, blood collection and apheresis equipment, transfusion sets, blood typing reagents and laboratory analysers are excluded. Blood service logistics operations fall outside scope.
Base Year Value
$0.3B in 2025 (MMA Primary Research Dataset, August 2026)
Forecast Period
2026 to 2036, eleven discrete annual values
CAGR
12.6% base case. Bull 13.8%. Bear 11.4%.
Fastest Growth Segment
Vein-to-Vein Traceability Platforms: 18.9% CAGR
Fastest Growth Country
India: 14.6% CAGR
Fastest Growth Region
South Asia and Pacific: 14.6% CAGR
Largest Region
Western Europe: 30% of 2025 global value
Market Leaders
Biolog-id, Terumo BCT, Haemonetics, Zebra Technologies, WellSky. Source: MMA Analysis based on disclosed blood management and identification technology revenue, company annual reports 2025.
Primary Survey
n=3,800 procurement and R&D decision-makers, Q4 2025, six countries
Methodology
Demand-side build-up, cross-validated against public data, 47 expert interviews

RFID Blood Monitoring Systems Market Forecast Scenarios

rfid-blood-monitoring-systems-market-size-forecast-scenario-1787686896051
Growth from 2020 to 2025 ran at 11.2% and regulatory traceability requirements drove more of it than any commercial argument did. European national blood services deployed at scale across the period while American hospitals mostly stayed with established barcode workflows. Sensor tag technology matured considerably, reaching a cost point where applying one to a single blood product finally made sense. Platelet wastage drew more attention.
The 12.6% base case rests on three mechanisms. Platelet economics are becoming impossible to ignore, since a product costing several times a red cell unit and expiring within a week wastes money visibly. Temperature sensor tags convert an unverifiable judgement about how long a unit sat outside a refrigerator into a measured one, which recovers units otherwise discarded defensively. And blood services in Asia are building national traceability platforms from scratch rather than retrofitting them.
The bull case at 13.8% turns on a major national health system mandating electronic vein-to-vein traceability, which would convert a commercial argument into a compliance requirement overnight. The bear case at 11.4% is continued satisfaction with barcode workflows in hospitals whose transfusion laboratories cannot capture the saving that justifies replacing them at all. Neither turns on the tag technology itself.

Where The Saving Actually Lands

Blood is the only product in a hospital with a mandatory record connecting a specific donor to a specific patient, and it is stored with less discipline than the pharmacy applies to paracetamol. Red cells last around six weeks and platelets around five days. Roughly 4.1% of issued units are discarded before anybody receives them, mostly because nobody knew which unit was expiring or where it sat.
FIVE-FIRM CONCENTRATION44%Share of blood identification technology revenue held by leaders
PLATELET UNIT COST$540Typical acquisition cost for a single apheresis platelet unit
TOP DEPLOYING COUNTRYFrance 13%French share of globally installed blood identification deployments
HOSPITAL BLOOD WASTAGE4.1%Issued units discarded before transfusion across typical hospital practice
PLATELET SHELF LIFE5 daysUsable life of a platelet unit after collection and testing
EXCURSION DISCARD THRESHOLD30 minutesTime outside controlled storage before a unit requires discarding
The obstacle is that barcodes already work. ISBT 128 is a global standard, it is read reliably, and it costs nothing per unit at the point of use. Radio frequency identification has to justify itself against something adequate rather than against something broken, which is a much harder commercial position. Traceability alone never wins that argument, because the barcode delivers traceability. Wastage and staff time do win it.
The awkward part is where the money moves. A hospital transfusion laboratory buys the system and the saving from reduced wastage largely accrues to the blood service supplying the units, or to a hospital budget line the laboratory does not control. That misalignment has stalled more deployments than any technical objection ever has.
"Everyone pitches traceability, and traceability is the one thing the barcode already does perfectly well. The pitch that works is showing a transfusion lab manager how many platelet units went in the bin last month."
Director, Transfusion Systems and Healthcare Identification Practice · MMA Medical Devices Practice · August 2026

Market Trends

Sensor Tags Convert Temperature Judgement Into Measurement

A red cell unit outside controlled storage for more than 30 minutes must be discarded, and in practice nobody knows exactly how long a given unit sat on a ward counter. Staff discard defensively because the alternative is a risk nobody will take. Temperature logging tags record the actual excursion, which returns units to inventory that would otherwise have been binned on suspicion alone. The clinical safety case and the wastage case point in the same direction here, which is unusual and makes this the easiest part of the category to sell.
Market Impact: Addresses units costing 540 dollars

Blood Services Fund Hospital Deployments Directly

Hospital transfusion laboratories buy these systems and blood services capture much of the saving, since reduced wastage means fewer units issued and replaced. That misalignment stalled deployments for years. National programmes that succeeded are the ones where the blood service funded hospital installations directly, treating it as supply chain investment rather than as hospital equipment. European deployments have largely followed that model. Suppliers selling hospital by hospital in markets without that structure face a buyer who carries the cost and sees only part of the benefit. That is a fundamentally different sale.
Market Impact: Covers 26% of global value

Market Opportunities and Growth Drivers

Platelet Economics Make Wastage Financially Visible

A platelet unit costs several times what a red cell unit costs and expires within about five days of becoming available, which means a hospital holding platelets is running a perishable inventory of expensive product with almost no margin for error. Wastage in that category is where the financial case for these systems actually closes. Suppliers leading with red cell traceability find the numbers unconvincing, while those leading with platelet inventory management reach a transfusion laboratory manager who has been watching money go into a bin for years. Hospital-specific data closes it.
Market Impact: Matches traceability at 0 marginal cost

Asian Blood Services Build National Platforms From Scratch

Chinese and Indian blood services are constructing national traceability infrastructure rather than retrofitting radio frequency identification onto established barcode workflows, which removes the incumbency obstacle that slows Western adoption. Building without a legacy is faster and considerably cheaper. Japanese and Korean services operate centralised structures that make national deployment a single decision rather than thousands of hospital ones. Regional growth is therefore driven by infrastructure programmes rather than by hospital-level purchasing, and it behaves quite differently from anything happening in Europe or America. Legacy workflows are the obstacle everywhere else, and these markets simply do not have any.
Market Impact: Splits benefit across 2 organisations

Market Restraints and Challenges

Barcode Standards Already Deliver The Headline Benefit

ISBT 128 barcoding is a worldwide standard, reads reliably and costs nothing per unit once labels are printed, which means radio frequency identification competes against something adequate rather than something failing. Root cause is that traceability was the original justification for these systems and the barcode delivers it perfectly well. The commercial impact is that any pitch built on tracking loses immediately to a laboratory manager who already tracks. Mitigation runs through wastage and staff time arguments, which are real and require data most suppliers cannot produce for a specific hospital.
Market Impact: Recovers units from 30 minute excursions

The Buyer And The Beneficiary Are Different Organisations

Hospital transfusion laboratories purchase these systems while blood services capture much of the wastage saving through reduced issuing volumes. Root cause is a supply structure where the product is provided by one organisation and managed by another, with no mechanism transferring the benefit back. The commercial impact is deployments that stall at business case stage despite clear aggregate value. Mitigation involves blood service funded programmes, which work well and require a supplier to sell to a national organisation rather than to a hospital. That is a national sale rather than a hospital one, requiring entirely different commercial capability.
Market Impact: Shifts funding for 4.1% wastage
3 additional market trends, 4 additional growth drivers, and 2 additional restraints and challenges are covered in the full report. Contact sales@marketmindsadvisory.com to access the complete intelligence.

Segment CAGR and Growth Architecture

Segmentation follows system layer: what each supplied element contributes to identifying, monitoring or managing a blood product, rather than which institution operates it or how it is funded. Six layers cover the market without overlap, from tags through to traceability platforms. Care setting and funding structure are treated separately, since both cut across every layer.
rfid-blood-monitoring-systems-market-market-share-analysis-1787686896314

Vein-to-Vein Traceability Platforms

The software layer connecting donation, testing, storage, issue and transfusion is where the value in this category actually sits, and it grows at 18.9%, half again the market rate of 12.6%. Hardware reads a tag and a platform tells a laboratory manager which unit expires first, where it is and whether it has been outside a refrigerator. National blood services buying infrastructure buy this layer and then buy the hardware to feed it. Suppliers who led with readers and tags have found themselves supplying components into somebody else's platform, which is a considerably weaker position than the revenue figures alone would suggest. Platform position determines everything downstream of it. Reversing that order rarely works.
CAGR 18.9%

Temperature Logging Sensor Tags

A unit outside controlled storage beyond 30 minutes must be discarded, and staff discard defensively because nobody can reconstruct how long it actually sat there. Sensor tags record the excursion, which returns usable units to inventory rather than to a bin. Growth at 14.8% has been helped enormously by tag cost falling to a point where applying one to an individual blood product finally makes economic sense. The segment is unusual in this category because the safety argument and the wastage argument point the same way, which means a transfusion laboratory manager does not have to choose between them. Cost per tag remains the objection, and pricing against a recovered unit rather than against a passive tag resolves it.
CAGR 14.8%
Full segment breakdown across 6 segments available in the complete report.

Regional Architecture and Country Demand Map

Geography follows regulatory history and blood service structure rather than transfusion volume, which is broadly proportional to population. Western Europe leads on early national deployments, East Asia builds platforms from scratch, and North America lags behind entrenched barcode workflows. Funding structure explains more than technology preference does.

North America

North America sits at 21%, below the 22 to 32% default band, because American hospitals adopted ISBT 128 barcoding thoroughly and see radio frequency identification as duplicating a workflow that already satisfies regulators. That entrenchment rather than any lack of spending explains the position. Deployments concentrate in large academic centres with high platelet consumption, where wastage economics close the business case independently. Blood centres have generally not funded hospital installations, which leaves the misaligned incentive unresolved. Canadian blood services are centralised and could deploy nationally, though funding has not been committed. Mexican adoption is minimal outside private hospital groups. Wastage economics close the case independently wherever platelet volumes are high enough.
Share: 21% | CAGR: 12.0% (2026 to 2036)

Western Europe

Western Europe leads at 30%, above the 18 to 26% default band, because European traceability requirements arrived earlier than elsewhere and several national blood services funded hospital deployments directly rather than leaving them to individual laboratories. That funding structure is the explanation. French deployments are the most extensive anywhere and were driven by the national blood service as supply chain investment. Italian and Spanish regional services followed similar models. Belgian and Dutch hospitals run mature installations with strong wastage data. British adoption has been slower, constrained by hospital-level funding rather than by any regulatory reluctance. Funding structure rather than regulation explains the regional variation, and British hospitals face the same rules with far less money attached to meeting them.
Share: 30% | CAGR: 11.0% (2026 to 2036)
Regional intelligence for 5 additional markets available in the complete report: East Asia, South Asia and Pacific, Latin America, Middle East and Africa, Eastern Europe. Contact sales@marketmindsadvisory.com.
rfid-blood-monitoring-systems-market-country-cagr-analysis-1787686896579

Beating Adequate With Better Economics

The barcode already delivers traceability at no marginal cost, the buyer does not capture the saving, and platelets rather than red cells carry the financial case. Four levers work on economics, funding structure and software position rather than on any radio frequency capability a competitor cannot match. Radio frequency capability is not the differentiator anybody assumes.

Lead With Platelet Wastage, Not Traceability

A platelet unit costs around 540 dollars and expires within five days, which makes wastage in that category financially visible in a way red cell losses never are. Suppliers pitching traceability lose immediately to a laboratory manager whose barcode already traces everything. Those leading with platelet inventory data reach somebody who has watched money go into a bin for years and has never had a tool to stop it. The requirement is producing wastage data for the specific hospital rather than presenting generic capability, which most suppliers still fail to do.
Market Impact: Targets platelet units costing around 540 dollars each

Sell To Blood Services Rather Than Hospitals

Hospital laboratories buy these systems and blood services capture much of the roughly 4.1% wastage saving, which stalls business cases that are perfectly sound in aggregate. Every successful national programme resolved this by having the blood service fund hospital installations as supply chain investment. Selling to a national organisation is a longer and larger sale requiring entirely different commercial capability. It also converts a fragmented hospital-by-hospital grind into a handful of decisions that carry hundreds of sites each. Sales cycles lengthen considerably and conversion rates improve enough to more than compensate for it. Nobody closes hospital business cases reliably.
Market Impact: Resolves the 4.1% wastage saving funding split properly

Own The Platform Layer Above The Hardware

Traceability platforms grow at 18.9% while tags and readers grow at roughly half that, because the platform tells a laboratory which unit expires first and the hardware merely reads a number. Suppliers who led with readers now supply components into somebody else's software and hold correspondingly little pricing power. Building or acquiring the platform layer is expensive and it determines whether a company sets the specification or answers it. National blood services buy the platform first and the hardware afterward, in that order. Reversing that order almost never works. Hardware-led suppliers have found this out expensively.
Market Impact: Captures the software layer growing at 18.9% annually

Target Markets Without Any Barcode Incumbency

Chinese, Indian and several Southeast Asian blood services are building traceability infrastructure with no established workflow to displace, which removes the single hardest objection in this category entirely. East Asia holds 26% of value and is growing faster than anywhere with an installed barcode base. Competing there means engaging national programme procurement and accepting domestic technology partners on most Chinese work. The alternative is arguing against adequacy in Western hospitals, which is slower and considerably less rewarding per unit of commercial effort spent. Effort per unit of revenue is far lower. The objection simply does not arise.
Market Impact: Addresses the 26% that carry no legacy workflow

Who Controls the Margin Pool

Measured on disclosed blood management and identification technology revenue, the five leading suppliers hold a CR5 of 44%, which is low and reflects a field split between transfusion specialists and general identification technology companies. Biolog-id holds the deepest national deployment experience, while Zebra and comparable suppliers bring radio frequency capability without transfusion domain knowledge. Those are very different businesses competing for the same contracts.
Three contests define activity. National platform programmes compete on transfusion domain expertise and deployment track record, which favours specialists heavily. Hospital-level installations compete on business case construction and integration with laboratory information systems. Tag and reader supply competes on price and read reliability, where general identification suppliers are strongest. A supplier strong in one contest is usually weak in the others, and very few organisations hold all three capabilities credibly.

Pressure comes from domestic Chinese technology suppliers who hold most national programme work in the largest growth market and from laboratory information system vendors adding traceability modules. Rankings shift wherever the platform layer rather than the hardware decides a procurement, and that is happening in more programmes each year. Software increasingly decides the outcome.
rfid-blood-monitoring-systems-market-company-positioning-matrix-1787686896846

Competitive Moat and Risk Dimensions

BIOLOG-ID

Moat: National Deployment Track Record

Biolog-id has delivered national scale blood traceability deployments that competitors cannot point to, and a blood service committing to infrastructure across hundreds of hospitals weighs delivery evidence above everything else. Reference programmes take years to accumulate and cannot be assembled quickly. A technically comparable competitor still has to persuade a national organisation to be its first large customer.
BIOLOG-ID

Risk: Specialist Scale Limitation

A specialist supplier competing for national programmes against large identification technology groups carries balance sheet and support scale that procurement processes examine carefully. Domain expertise wins technical evaluation and does less in financial due diligence. Growth also depends on national decisions that arrive unpredictably, which makes revenue considerably lumpier than a hospital-level business would be.
TERUMO BCT

Moat: Blood Service Relationship Depth

Terumo BCT reaches blood services through collection and processing equipment those organisations already depend on, which places traceability inside relationships built over decades on entirely separate products. That access matters enormously when the buyer is a national service rather than a hospital. A specialist competitor with better software still needs an introduction the incumbent has held for years.
TERUMO BCT

Risk: Software Capability Gap

The value in this category is migrating toward the platform layer growing at 18.9%, and a company whose strength lies in collection and processing hardware competes there against software organisations built for it. Equipment relationships open the conversation and software determines who wins the specification. Building that capability internally has proved slow for hardware-led companies across many adjacent categories.

Players Tracked

Prominent Players

Biolog-id
Terumo BCT
Haemonetics
Zebra Technologies
WellSky

Other Key Players

Impinj
Avery Dennison
Grifols
Fresenius Kabi
Helmer Scientific
Thermo Fisher Scientific
Oracle Health
Sarstedt
Honeywell
SATO Holdings
Toshiba Tec
LogTag Recorders
Bio-Rad Laboratories
Werfen
Macopharma

Recent Developments

MARCH 2025

National blood service funds hospital traceability deployment programme

A national blood service committed funding for radio frequency traceability deployment across hospital transfusion laboratories, treating the installations as supply chain investment rather than as hospital equipment. This was a procurement and funding decision rather than any corporate transaction, and it resolves the incentive split that stalls hospital-level business cases.
Signal: Blood services funding hospital installations is the model that works, and more national programmes are copying it.
JULY 2025

Sensor tag manufacturer reduces unit cost for single product tagging

A sensor tag manufacturer reduced unit cost sufficiently to make tagging individual blood products economically viable, an organic manufacturing improvement rather than any partnership or acquisition. Temperature excursion recording had previously been applied at container level, which could not resolve what happened to an individual unit on a ward.
Signal: Per-unit sensing changes the wastage argument from a container-level estimate into a defensible unit-level measurement instead.
NOVEMBER 2025

Laboratory information system vendor adds blood traceability module

A laboratory information system vendor added a blood traceability module to its transfusion product, an internal development rather than any acquisition. The move places traceability inside software hospitals already run, which reduces integration work considerably and pressures specialist platform suppliers on exactly the layer they depend upon.
Signal: Platform value is being absorbed into systems hospitals already own, which threatens standalone traceability software directly.

What The System Costs

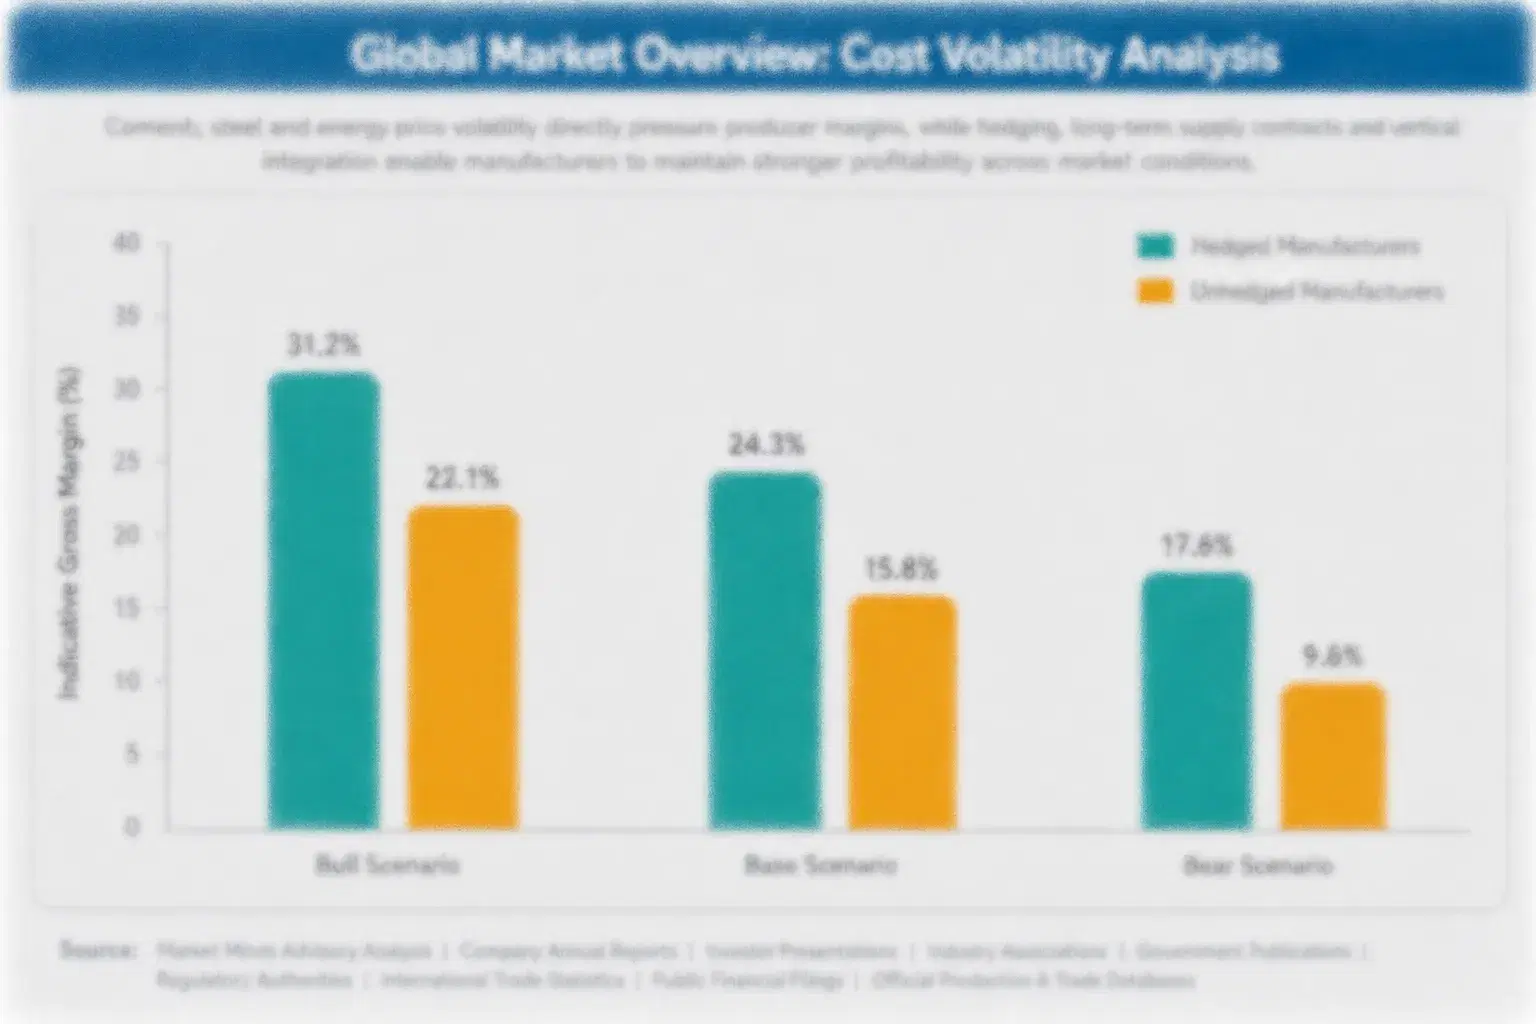
Hardware costs are modest and falling. Passive tags, reader antennas and cabinet electronics together run 22 to 27% of system selling price, with tag silicon and antenna assembly the largest components. Sensor tags cost considerably more per unit because they carry a battery, a temperature element and memory. Software development and deployment services dominate the rest, and they are where the actual investment sits for any supplier.
The volatility that matters is semiconductor supply rather than commodity pricing. Radio frequency identification chip availability tightened sharply through 2021 and 2022 alongside broader semiconductor constraints, and lead times extended well past what deployment schedules assumed. Impinj and Zebra annual report disclosures describe those supply conditions directly. Suppliers holding allocation agreements delivered on programme timetables. Suppliers buying on the open market missed deployment milestones that carried contractual penalties.

Exposure divides by where a supplier sits in the stack. Tag and reader manufacturers carry semiconductor cost and availability risk directly. Platform suppliers carry development and integration cost that scales with each customer's laboratory information system rather than with volume. Deployment across hundreds of hospitals carries a services burden that most software financial models understate badly.
rfid-blood-monitoring-systems-market-cost-volatility-analysis-1787686897124

Secure chip allocation ahead of national programme commitments

Radio frequency chip lead times extended well beyond deployment assumptions through 2021 and 2022, and suppliers without allocation agreements missed national programme milestones carrying contractual penalties. Committing to allocation costs working capital and inventory risk. It prevents the specific failure that damages a reference programme, which is the only asset that wins the next national contract.

Standardise laboratory system integration before scaling deployment

Integration effort scales with each hospital's laboratory information system rather than with the number of units tracked, and suppliers pricing deployment on installed sites consistently underestimate it. Building standard interfaces for the common systems before a national programme starts converts bespoke work into configuration. Discovering this during a hundred-site rollout is expensive and damages delivery reputation permanently.

Price sensor tags against recovered units, not components

A sensor tag costs several times a passive tag and returns units to inventory that would otherwise be discarded on suspicion. Pricing against passive tag cost surrenders the entire value and invites comparison on the wrong basis. Pricing against a recovered platelet unit reflects what the customer gains and sustains margin. Component comparison invites the wrong conversation.

Portfolio Architecture for Margin Defence

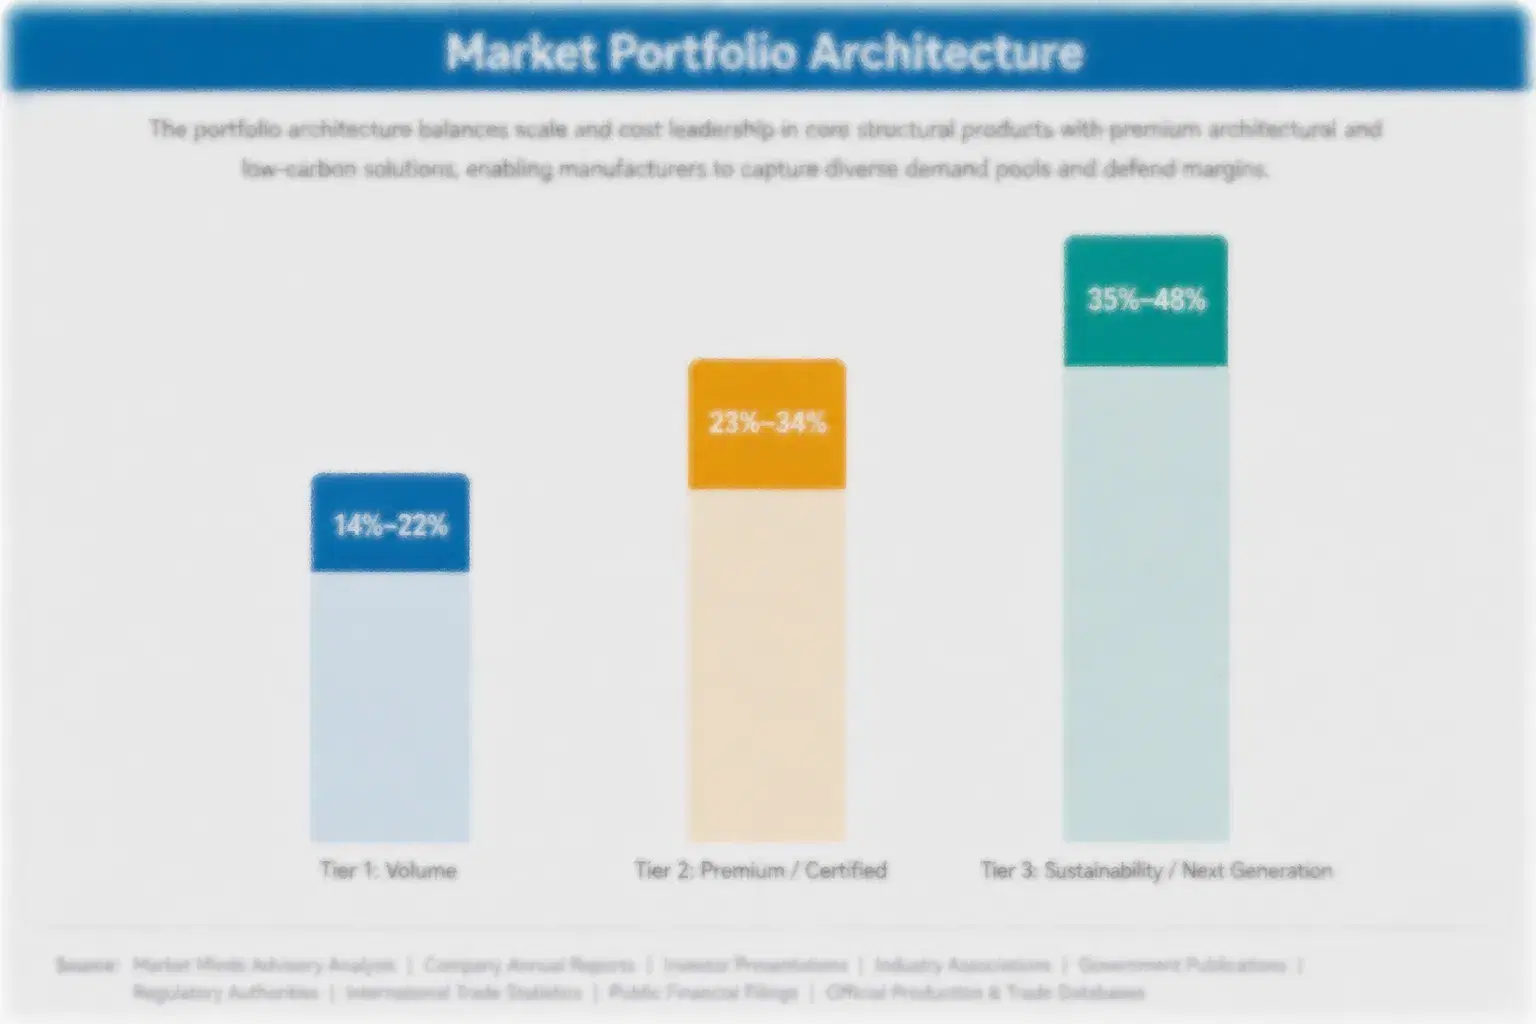
Margin follows position in the stack rather than technical sophistication. Passive tags are a component sold on price against general identification suppliers with far greater scale. Readers and cabinets earn modestly on hardware economics. Sensor tags earn well where priced against recovered units rather than against component cost. Platform software earns most and carries a deployment services burden that unit economics conceal entirely.
The tension is that hardware is where the revenue looks immediate and software is where the position is durable. Suppliers who led with readers and tags now supply components into platforms somebody else specified, which is a weaker place to stand than the revenue line suggests. Building the platform layer costs years and considerable investment, and the companies that did it are setting specifications rather than answering them.

High-value pools sit in three places. Traceability platform software, which national blood services buy first and which determines every subsequent hardware decision. Sensor tags priced against recovered units. And national programme delivery capability, which is what a blood service actually evaluates when committing to hundreds of sites. None of the three is where most hardware-led suppliers in this category have concentrated their investment over the past decade.

Volume / Commodity-Adjacent

Passive tags, labels and standard reader hardware competing directly against general identification technology suppliers with far greater manufacturing scale. The 7-point range separates suppliers holding chip allocation agreements from those exposed to open market semiconductor pricing and availability.
Gross Margin: 28-35%

Premium / Certified

Smart storage cabinets, bedside verification systems and integrated hardware carrying transfusion-specific validation and regulatory documentation. The 7-point spread separates suppliers with blood service deployment references from those offering comparable equipment without transfusion domain evidence.
Gross Margin: 46-53%

Sustainability / Regulatory / Next-Generation

Vein-to-vein traceability platforms and temperature logging sensor tags. The 27-point range is very wide because platform software earns software economics while carrying heavy deployment services costs, and sensor tag margins depend entirely on whether pricing references recovered units or component cost.
Gross Margin: 52-79%
rfid-blood-monitoring-systems-market-portfolio-architecture-1787686897402

High-value Sub-segments and Strategic Watch-out

Traceability Platform Software

Highest value and fastest growing, bought first by national blood services and determining every hardware decision that follows it afterward. The risk is laboratory information system vendors absorbing traceability into software hospitals already run, which would strand standalone platforms entirely. That threat is real and growing.
Gross Margin: 76-79%

Sensor Tags Priced On Recovery

High value with strong growth, justified by units returned to inventory rather than discarded on suspicion after an unrecorded excursion. The risk is competitors pricing against passive tag cost, which anchors the whole segment on components and destroys the margin available to everybody. Anchoring matters enormously here.
Gross Margin: 61-64%

Passive Tags And Readers

The volume core, competing directly against general identification suppliers whose manufacturing scale no transfusion specialist can approach. Suppliers hold the line because tags feed platforms, and losing the hardware can eventually cost the software position that sits above it. Scale is impossible to match. The relationship is what this protects.
Gross Margin: 29-32%

Hospital Level Business Cases

The strategic watch-out. Selling to individual transfusion laboratories means selling to a buyer who carries the cost while blood services capture much of the wastage saving. The risk is a fragmented pipeline of stalled business cases that consume commercial effort without ever closing. Conversion rates are poor everywhere.
Gross Margin: 47-50%

Tags Consumed With Every Unit

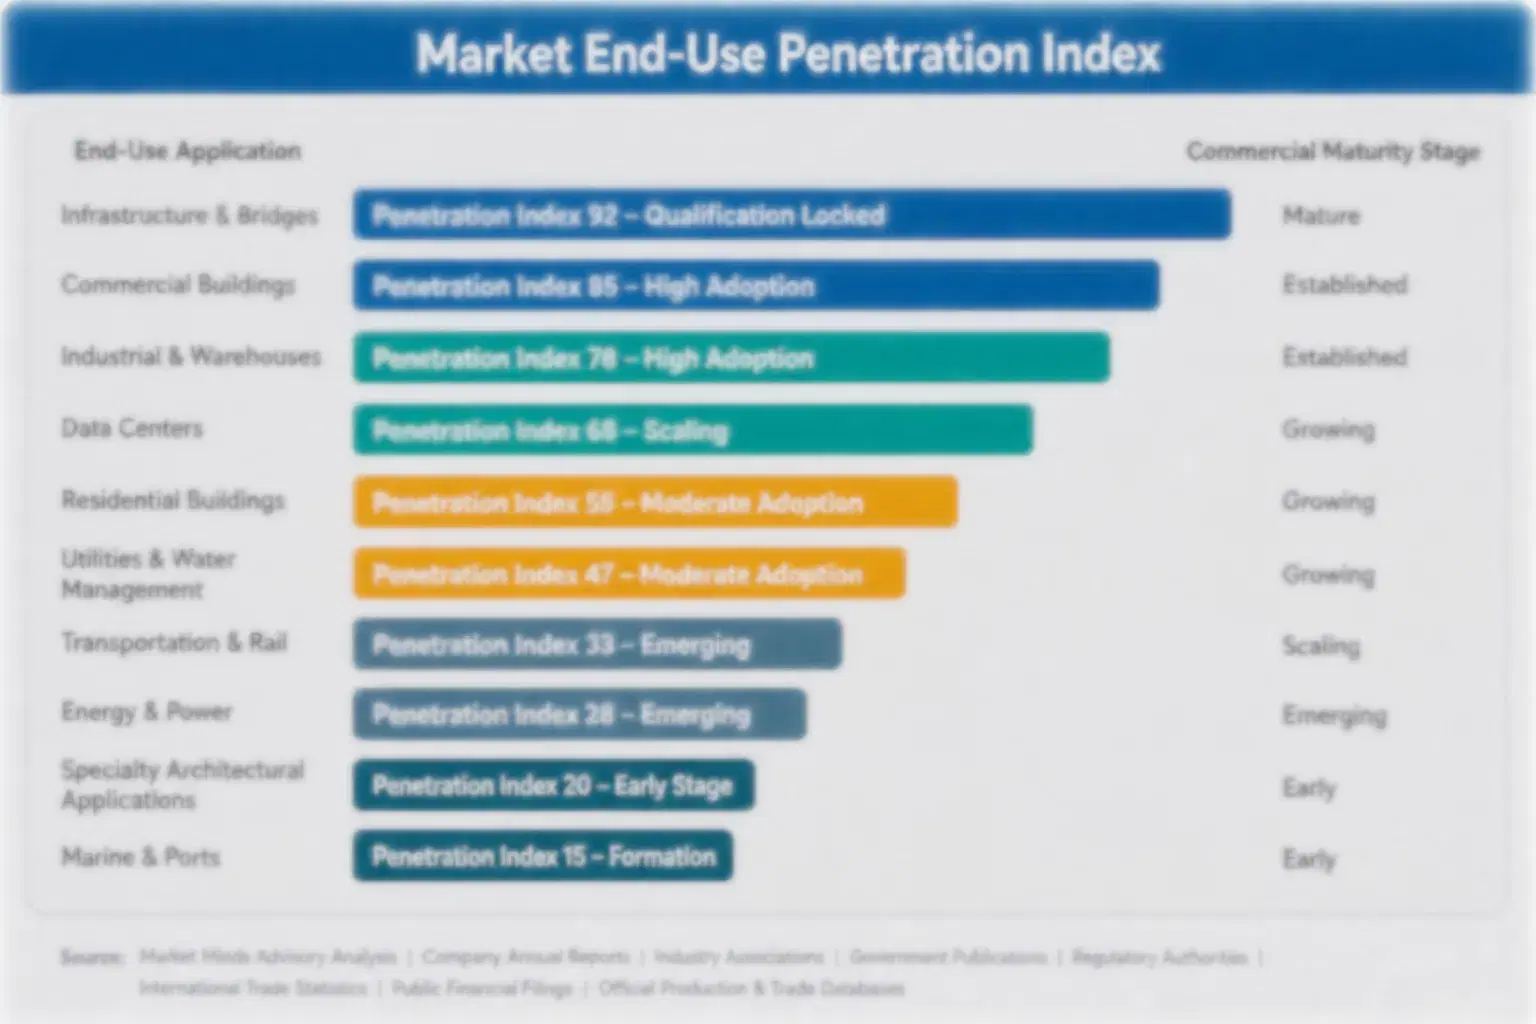
This category carries two revenue shapes at once. Platform licences and cabinet hardware are periodic and lumpy, arriving when a blood service or hospital commits. Tags are consumed with every blood product handled and recur automatically with transfusion volume, which never falls. Once a site is deployed the tag revenue continues indefinitely without any further decision. It scales with clinical activity rather than with any budget cycle a supplier must win again.
Stickiness depends on which layer was chosen. A traceability platform integrated into laboratory information systems and validated across a national programme is effectively permanent, since replacing it means revalidating a regulated process. Cabinet hardware follows equipment replacement cycles. Tag supply is the loosest link and moves on price once a platform accepts multiple tag formats, which is why platform suppliers work hard to keep formats proprietary.

The decision maker sits higher than most suppliers assume. National blood services rather than hospital laboratories make the deployments that matter, and those organisations evaluate delivery track record across hundreds of sites rather than product specification. Calling on laboratory managers reaches users who cannot fund a programme. The people who can fund one run procurement processes those suppliers never see.
rfid-blood-monitoring-systems-market-end-use-penetration-index-1787686897671

Winning Against Good Enough

These are among the four positions where our research anticipates prominent divergence between winners and laggards over the coming forecast period. Each is grounded in the demand model, the regulatory perimeter, and the announced capacity pipeline.
01 / PLATELET ECONOMICS SELLING

Wastage closes the case, traceability never does

A platelet unit costs around 540 dollars and expires within roughly five days, which makes wastage in that category financially visible in a way red cell losses simply never are. Suppliers pitching traceability lose immediately to a laboratory manager whose existing barcode already traces every unit perfectly well at no marginal cost. Those leading with platelet inventory data reach somebody who has watched money go into a bin for years, and the requirement is producing hospital-specific wastage figures rather than generic capability claims.
02 / FUNDING STRUCTURE ALIGNMENT

Sell to whoever captures the saving

Hospital transfusion laboratories buy these systems while blood services capture much of the roughly 4.1% wastage saving through reduced issuing volumes, which stalls business cases that are entirely sound in aggregate terms. Every national programme that succeeded resolved this by having the blood service fund hospital installations directly as supply chain investment. Selling to a national organisation demands quite different commercial capability, and it converts a fragmented hospital by hospital grind into a handful of decisions each carrying hundreds of sites.
03 / PLATFORM LAYER OWNERSHIP

The software sets the hardware specification

Traceability platforms grow at 18.9% while tags and readers grow at roughly half that rate, because a platform tells a laboratory which unit expires first while hardware merely reads a number off it. Suppliers who led with readers now supply components into platforms that somebody else specified and hold correspondingly little pricing power over any of it. Building or acquiring that software layer costs several years and real investment, and it ultimately determines whether a company writes the specifications or merely answers them.
04 / GREENFIELD MARKET PRIORITY

Go where no barcode workflow exists yet

Chinese, Indian and several Southeast Asian blood services are currently building traceability infrastructure with no established barcode workflow at all to displace, which removes the single hardest objection anywhere in this category. East Asia holds 26% of global value and is growing faster than any market carrying an established installed barcode base does. Competing there means engaging national programme procurement and accepting domestic technology partners on most Chinese work, which is still considerably easier than arguing against adequacy inside Western hospitals.

Engagement Snapshot From the Field

A live engagement with an industry participant carrying material or product regulatory and market exposure ahead of a defining policy shift, showing how our research translates into a defensible multi-year portfolio strategy.
MARKET MINDS ADVISORY · CLIENT ENGAGEMENT SUMMARY
RFID Blood Monitoring Systems Producer Strategic Portfolio Review and Transition Roadmap 2026·Investment Scenario on RFID Blood Monitoring Systems Exposure Evaluation 2025-26
CLIENT PROFILE
A blood traceability technology supplier offering tags, readers and smart storage cabinets across nine European markets, with reported revenue of 41 million euros (client-reported, unverified by MMA). Roughly 81% came from hardware, with traceability software supplied through a third-party partner. Its commercial organisation of 24 people called on hospital transfusion laboratory managers exclusively. Blood service relationships had never been pursued.
STRATEGIC CHALLENGE
Pipeline conversion had fallen for three consecutive years despite growing interest, with business cases stalling repeatedly at approval stage. Management assumed price was the obstacle and had reduced hardware pricing twice. Nobody had traced where stalled business cases actually failed, or who inside each organisation was declining to approve them.
MMA APPROACH
MMA reconstructed the approval path for eighteen stalled business cases, following each from laboratory manager to final decision, which the company had never documented. Eleven expert interviews with laboratory managers, finance leads and blood service planners established where the wastage saving actually accrued. The analysis treated funding structure rather than pricing as the likely cause of failure.
KEY FINDINGS
  1. Business cases stalled at hospital finance approval because most of the wastage saving accrued to blood services rather than to the purchasing hospital itself.
  2. Every successfully closed deployment in the reviewed markets had involved blood service funding, and the company had pursued none of those relationships directly.
  3. The third-party software partner controlled specification in six of eighteen cases, relegating the client to component supply on price alone. Pricing power was minimal there.
  4. Blood service level selling modelled far higher conversion at longer sales cycles than the hospital approach had achieved (client-reported, unverified by MMA).
CLIENT PROFILE
A blood traceability technology supplier offering tags, readers and smart storage cabinets across nine European markets, with reported revenue of 41 million euros (client-reported, unverified by MMA). Roughly 81% came from hardware, with traceability software supplied through a third-party partner. Its commercial organisation of 24 people called on hospital transfusion laboratory managers exclusively. Blood service relationships had never been pursued.
STRATEGIC CHALLENGE
Pipeline conversion had fallen for three consecutive years despite growing interest, with business cases stalling repeatedly at approval stage. Management assumed price was the obstacle and had reduced hardware pricing twice. Nobody had traced where stalled business cases actually failed, or who inside each organisation was declining to approve them.
MMA APPROACH
MMA reconstructed the approval path for eighteen stalled business cases, following each from laboratory manager to final decision, which the company had never documented. Eleven expert interviews with laboratory managers, finance leads and blood service planners established where the wastage saving actually accrued. The analysis treated funding structure rather than pricing as the likely cause of failure.
KEY FINDINGS
  1. Business cases stalled at hospital finance approval because most of the wastage saving accrued to blood services rather than to the purchasing hospital itself.
  2. Every successfully closed deployment in the reviewed markets had involved blood service funding, and the company had pursued none of those relationships directly.
  3. The third-party software partner controlled specification in six of eighteen cases, relegating the client to component supply on price alone. Pricing power was minimal there.
  4. Blood service level selling modelled far higher conversion at longer sales cycles than the hospital approach had achieved (client-reported, unverified by MMA).
RECOMMENDED STRATEGY
Phase 1: Phase one: stop discounting hardware, since price was never the obstacle, and rebuild business cases around platelet wastage figures for each specific hospital. Phase 2: Phase two: build a direct commercial capability for national blood service selling, which requires different people and much longer engagement cycles. Phase 3: Phase three: acquire or build platform software capability, ending dependency on a partner that controls specification in a third of opportunities.
OUTCOME
Hardware discounting stopped without any measurable effect on conversion, confirming the diagnosis. Two national blood service engagements opened within a year and one reached procurement (client-reported, unverified by MMA). Platform software development began internally after acquisition discussions with the incumbent partner did not proceed. Hardware pricing was restored to previous levels.

Frequently Asked Questions

Foundational context covering the market sizes, CAGR, scope, country, region and competition that inform every finding below. This section is provided to cover basics and most often pre-purchase conversations, answered from the MMA Primary Research Dataset.

What is the current size of the RFID Blood Monitoring Systems Market?

The market was worth 0.34 billion dollars in 2025, covering tags, readers and cabinets, sensor tags, inventory software, bedside verification and traceability platforms. It reaches 0.38 billion dollars in 2026.

How large will the RFID Blood Monitoring Systems Market be by 2036?

MMA forecasts 1.25 billion dollars by 2036, an increase of 0.87 billion dollars over the 2026 base. That represents an expansion multiple of 3.29 times across the forecast period.

What is the CAGR for the RFID Blood Monitoring Systems Market 2026 to 2036?

The base case compounds at 12.6% annually. MMA's bull case reaches 13.8% if a major health system mandates electronic traceability, while the bear case sits at 11.4% on continued barcode satisfaction.

Which segment is growing fastest?

Vein-to-vein traceability platforms, at 18.9%, half again the market rate of 12.6%. The platform tells a laboratory which unit expires first, which hardware alone cannot do.

Who are the major companies in the RFID Blood Monitoring Systems Market?

Biolog-id, Terumo BCT, Haemonetics, Zebra Technologies and WellSky lead on disclosed blood management and identification technology revenue. Impinj, Avery Dennison, Helmer Scientific and Macopharma compete within specific layers.

Which country is growing fastest?

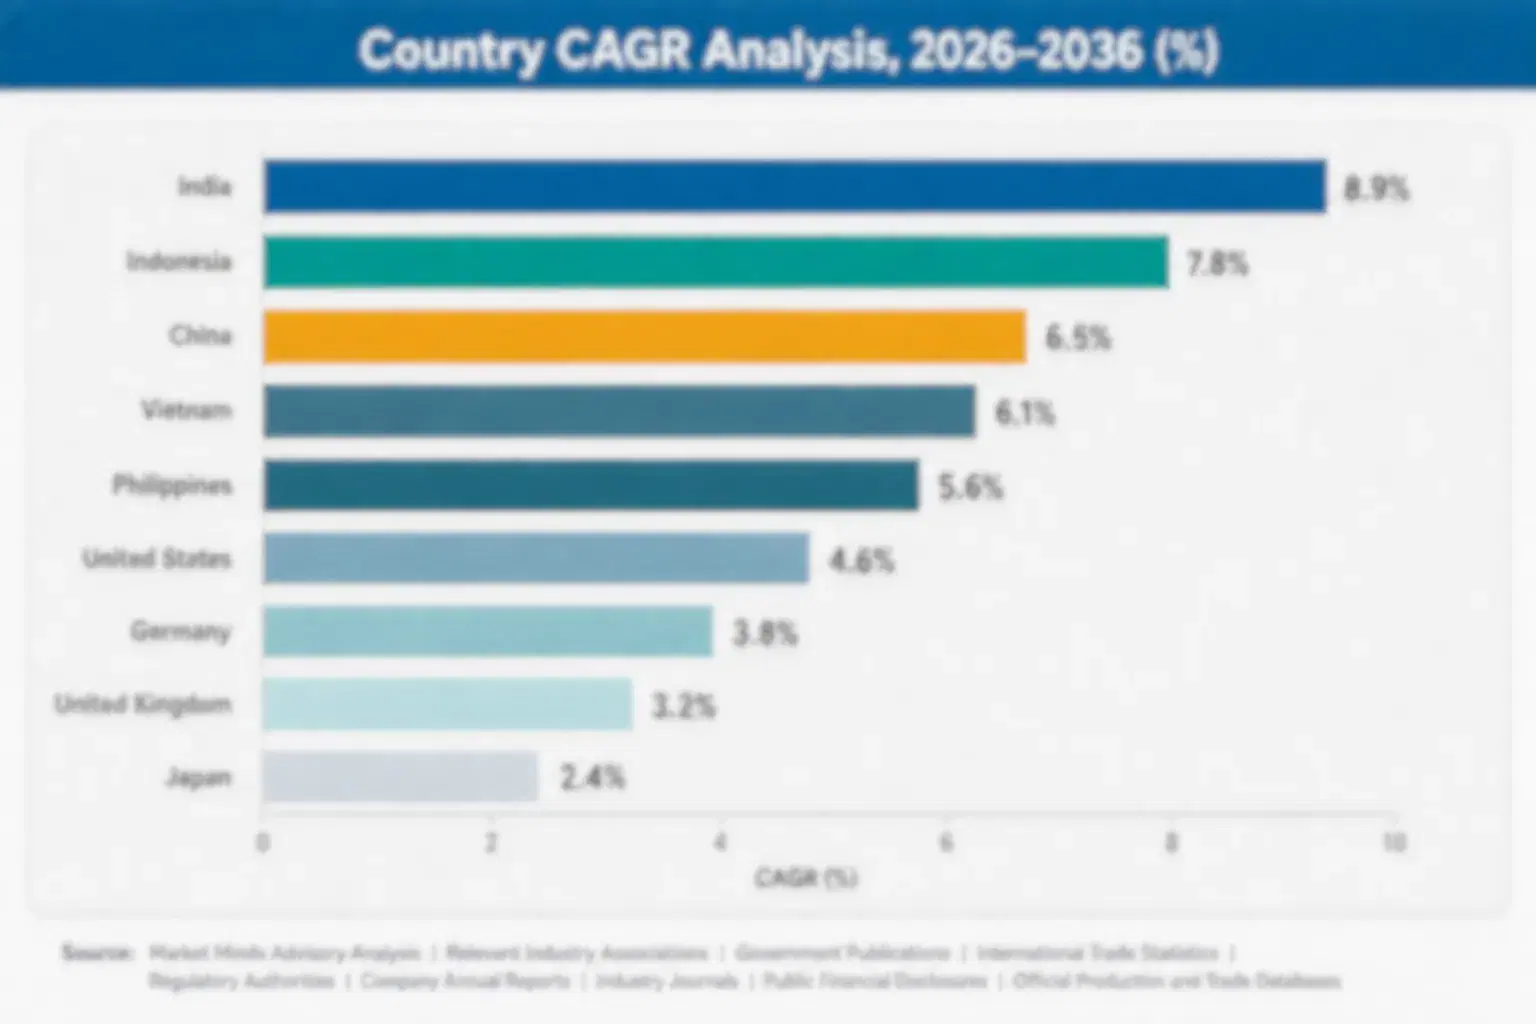
India at 14.6%, driven by national programmes imposing traceability across a fragmented blood banking base with no entrenched workflow to displace. China follows closely on similar dynamics.

Report Segmentation Architecture

The full report scope spans multiple orthogonal segmentation dimensions, with cross-tabulated demand data provided for each dimension pair. Coverage extends further to regional breakdowns, trend trajectories, and the competitive detail needed to support segment-level decision-making.

By System Layer

  • RFID Tags and Labels
  • Fixed Readers and Smart Storage Cabinets
  • Temperature Logging Sensor Tags
  • Blood Inventory Management Software
  • Bedside Transfusion Verification Systems
  • Vein-to-Vein Traceability Platforms

By End-Use Industry

  • National Blood Services
  • Hospital Transfusion Laboratories
  • Regional Blood Centres
  • Surgical and Trauma Units
  • Oncology and Haematology Services
  • Plasma Collection Operations

By Commercial Dimension

  • Blood Service Funded Programme
  • Hospital Capital Purchase
  • Software Licence Subscription
  • Consumable Tag Supply
  • Public Tender Procurement
  • System Integrator Delivered

By Region

  • North America
  • Western Europe
  • East Asia
  • South Asia and Pacific
  • Latin America
  • Middle East and Africa
  • Eastern Europe

Scope, Methodology, and Coverage

Every figure in this report is reproducible from documented input assumptions. The scope below maps the historical period, the forecast horizon, the segmentation dimensions, and the countries covered, alongside the underlying primary and qualitative methodology.
Historical Period
2020 to 2025
Forecast Period
2026 to 2036
Base Year
2025 (USD billions; MMA Primary Research Dataset, August 2026)
Market Definition
Scope covers radio frequency identification systems used to identify, track, monitor and manage blood products across the transfusion chain from collection through storage and issue to bedside administration, spanning tags and labels applied to blood products, fixed readers and smart storage cabinets, temperature logging sensor tags, blood inventory management software, bedside transfusion verification systems, and vein-to-vein traceability platforms. Barcode-only identification systems and label printing, blood collection and apheresis equipment, transfusion administration sets, blood grouping reagents and laboratory analysers are excluded. Blood service transport logistics and donor recruitment systems fall outside the boundary.
Quantitative Units
USD billions (current prices); tags consumed; sites deployed; units tracked; wastage rate by product type
Segmentation Dimensions
By System Layer; By End-Use Industry; By Commercial Dimension; By Region
Regions Covered
North America, Western Europe, East Asia, South Asia and Pacific, Latin America, Middle East and Africa, Eastern Europe
Countries Covered
France, USA, China, Japan, Italy, Spain, Germany, UK, India, South Korea, Australia, Brazil, Canada, Poland, Saudi Arabia
Key Companies Profiled
Biolog-id, Terumo BCT, Haemonetics, Zebra Technologies, WellSky, Impinj, Avery Dennison, Grifols, Fresenius Kabi, Helmer Scientific, Thermo Fisher Scientific, Oracle Health, Sarstedt, Honeywell, SATO Holdings, Toshiba Tec, LogTag Recorders, Bio-Rad Laboratories, Werfen, Macopharma
Quantitative Methodology
Primary survey, n=3,800 respondents, Q4 2025, six countries; demand-side model with trade association cross-validation
Qualitative Methodology
47 expert interviews, Q4 2025; applied to validate demand model assumptions, identify emerging dynamics, and assess competitive positioning
Report Format
PDF and XLSX data workbook (Word format preview document)
Publisher
Market Minds Advisory
Report Code
MMA-2026-MED-152
Published
August 2026
Contact
sales@marketmindsadvisory.com | www.marketmindsadvisory.com

Purchase the full RFID Blood Monitoring Systems Market Report (2026 to 2036).

The full report runs to 160 pages and covers all six system layer segments, seven regions and 20 profiled companies in detail. It includes the complete segment CAGR set, regional deployment and blood service structure data, and wastage economics modelled across product types and care settings. Company profiles carry evaluation on disclosed blood management and identification technology revenue, with moat and risk assessment for the top five suppliers. The competitive section extends to 13 tracked corporate developments across 2024 and 2025, each with commercial interpretation. Primary research inputs include a quantitative survey of 3,800 respondents and 47 expert interviews conducted in Q4 2025.
Six system layer segments with individual CAGR forecasts
Seven regional markets with deployment and blood service data
Twenty company profiles on consistent revenue evaluation basis
Thirteen tracked corporate developments with commercial interpretation notes
Wastage economics modelled by blood product type and setting
Funding structure analysis across national and hospital purchasing routes

Built For The People Who Decide

From boardroom strategy to bench-side execution, this report is read cover-to-cover by leaders shaping the next decade of their industry, turning demand scenarios, market dynamics and valuation benchmarks into decisions.
CXOs/ Presidents/ VPs/ Managers
M&A and Corporate Development
Strategy Teams and R&D Heads
Procurement and Product Directors
Regulatory and Compliance Leaders
Investor Relations and Equity Analysts