Market Minds Advisory
Revenue Management Software Market

Revenue Management Software Market: Revenue Management Software Market: Pricing Decision Classes, Override Economics and Attribute Monetisation 2026 to 2036

The system recommends a price and the general manager changes it about a third of the time. Every override breaks the feedback loop, and the model never learns what the recommendation would have earned.

Lead Analyst

Published

September 2026

Make Smarter Decisions with Customized Research Insights

Request a free sample report and evaluate market opportunities, growth trends, and competitive dynamics relevant to your business needs.

2025 MARKET VALUE$6.2BMarket Size 2025
2036 FORECAST VALUE$19.9BBase Case , 2026 to 2036
CAGR 2026 TO 203611.2 %Bull 12.5% / Bear 10.0%
INCREMENTAL OPPORTUNITY$13.0BNet 10- year value creation
EXPANSION MULTIPLE2.89x2036 value over 2026 base
Strategic Levers
M&A Pipeline
Regional Outlook
Country Rankings
Competitive Intelligence
Segmental Deep-dive
Call-Us : 91 93563 13602

Executive Snapshot and Market Trajectory.

This category has a credibility problem it built entirely itself. Manager override rates run around 34%, and every override breaks the feedback loop, because the model never observes what its own recommendation would have earned. Vendors call that a training failure. It is a trust question.
The market reaches USD 6.89 billion in 2026 and USD 19.92 billion by 2036, a 2.89 times expansion at 11.2%. Ancillary and attribute pricing grows at 16.8%, half again the market rate of 11.2%, because around 23% of transaction value now sits in things that are not the base rate at all. Western Europe holds 30% of licence and subscription revenue on property count, and India grows fastest at 17.4% on new supply.
Five vendors hold 47% of licence and subscription revenue, which is concentrated by ownership of the reservation systems the pricing has to reach. Amadeus, Oracle Hospitality and Sabre sell pricing alongside platforms customers already run. IDeaS and PROS built specialist positions on modelling depth instead. Independent challengers reach the independent properties instead, which is a genuinely large market that nobody at all has begun to consolidate yet.
Market Definition
This report covers software that sets prices and allocates perishable inventory across travel, hospitality and retail: dynamic price optimisation, inventory allocation and capacity control, demand forecasting and unconstrained demand modelling, markdown and clearance optimisation, ancillary and attribute pricing, and rate shopping with competitive intelligence. It excludes reservation and property management systems, distribution and channel management, payment processing, loyalty platforms, and general business intelligence tools.
Base Year Value
$6.2B in 2025 (MMA Primary Research Dataset, September 2026)
Forecast Period
2026 to 2036, eleven discrete annual values
CAGR
11.2% base case. Bull 12.5%. Bear 10.0%.
Fastest Growth Segment
Ancillary And Attribute Pricing: 16.8% CAGR
Fastest Growth Country
India: 17.4% CAGR
Fastest Growth Region
South Asia and Pacific: 13.4% CAGR
Largest Region
Western Europe: 30% of 2025 global value
Market Leaders
Amadeus IT Group, Oracle Hospitality, IDeaS Revenue Solutions, PROS Holdings and Sabre Corporation lead on revenue management licence and subscription revenue. Source: MMA Analysis.
Primary Survey
n=3,800 procurement and R&D decision-makers, Q4 2025, six countries
Methodology
Demand-side build-up, cross-validated against public data, 47 expert interviews

Revenue Management Software Market Forecast Scenarios

revenue-management-software-market-size-forecast-scenario-1789988909256
Between 2020 and 2025 the category compounded at 10.2%, and the data underneath it broke in the middle. Every forecasting model in this industry trained on historical demand patterns, and 2020 and 2021 described nothing that will recur. Vendors excluded those years, which left a hole in the seasonality baselines models depend on, and that hole is still working through the training windows today.
The base case holds 11.2% on three mechanisms. Attribute pricing keeps expanding as operators discover that around 23% of transaction value sits outside the base rate, in bags, seats, room features and cancellation flexibility. Independent hotels and small groups are adopting revenue management for the first time as cloud pricing removes the implementation cost that kept them out. And retail markdown optimisation continues moving from spreadsheets to software as inventory carrying costs rise.
The bull case at 12.5% assumes override rates fall as newer models explain their reasoning to the people using them, which would raise measured benefit and shorten sales cycles considerably. The bear case at 10.0% is a visible pricing controversy: regulators in several jurisdictions are examining algorithmic pricing coordination, and an adverse finding would slow adoption well beyond the firms directly involved.

The Price The Manager Actually Publishes

Around 34% of recommended prices get changed before publication, and the industry has spent two decades calling that a training problem. It is not. A general manager knows about the wedding party arriving Saturday, the roadworks closing the approach and the conference that quietly cancelled. The override is often correct and still destroys the feedback the system needs.
TOP FIVE CONCENTRATION47%Concentrated among reservation platform owners and pricing specialist vendors
MANAGER OVERRIDE RATE34%Recommended prices changed by staff before publication anywhere
REVPAR UPLIFT ACHIEVED6%Measured improvement against comparable properties without the software
ANCILLARY REVENUE SHARE23%Portion of transaction value from attributes beyond base rate
PRICE UPDATE FREQUENCY96 dailyRate changes published per property in dynamic markets
TYPICAL IMPLEMENTATION PERIOD17 weeksFrom contract signature to first automated pricing decision made
Value migrated away from the base rate while most systems stayed focused on it. Roughly 23% of transaction value now comes from attributes: checked bags, seat selection, boarding priority, room floor and view, late checkout, flexible cancellation. Airlines got there first and hospitality is following. Systems designed to price one room for one night are being asked to price eight things at once, and most of them were not built for that.
The pandemic left a hole in the data that is still working through. Forecasting depends on multi-year seasonality baselines, and 2020 and 2021 described patterns that will not recur, so vendors excluded them. That left training windows with a gap where several years of history should sit. Model confidence suffered, and high override rates are partly a rational response.
"Every vendor in this category reports the uplift their system delivers. Almost none of them reports the override rate. The second number tells you far more about whether the software is actually running the business or just producing suggestions somebody ignores."
Principal, Travel Technology and Commercial Optimisation Practice · MMA Technology Practice · September 2026

Market Trends

Attribute Pricing Moved The Money Off The Base Rate

Around 23% of transaction value now sits outside the headline price, in checked bags, seat selection, boarding priority, room floor and view, late checkout and flexible cancellation terms. Airlines built that model first and hospitality has followed steadily, unbundling what used to be included and pricing each piece against its own demand curve. Ancillary and attribute pricing compounds at 16.8% against 11.2% for the market on exactly this shift. Most revenue management systems were architected to price one unit of inventory for one night, and pricing eight attributes simultaneously is a genuinely different problem.
Market Impact: Implementation now runs 17 weeks
Override Rates Expose The Real Adoption Ceiling

Roughly 34% of recommended prices are changed before publication, and vendors have spent twenty years treating that as insufficient user training. The managers overriding usually hold context the model cannot see: a wedding party, a road closure, a conference that cancelled without updating anything. The override is frequently correct and it still breaks the feedback loop, because the system never observes what its own recommendation would have earned. Newer models that explain their reasoning reduce the rate meaningfully, which suggests the problem was always explanation rather than accuracy. Accuracy was never the binding constraint here.
Market Impact: Markdown optimisation compounds at 12.4%

Market Opportunities and Growth Drivers

Cloud Delivery Opened The Independent Property Market

Revenue management was historically sold to chains, because implementation ran into six figures and required analytical staff no independent hotel employs. Cloud delivery cut the entry cost to a monthly subscription and the implementation period to around seventeen weeks, which brought several hundred thousand independent properties into the addressable market for the first time. Those operators have no revenue manager at all, so the software substitutes for a role rather than assisting one. That changes the product requirement considerably, and it is where most category growth now originates. Selling an analyst tool to somebody with no analyst rarely works.
Market Impact: Scrutiny affects 2 major jurisdictions

Retail Markdown Moved Off Spreadsheets Under Cost Pressure

Retailers historically managed clearance with rules of thumb and merchant judgement, which worked adequately while inventory carrying costs were low and warehouse space was cheap. Neither condition holds now. Markdown optimisation compounds at 12.4% as retailers apply the same perishable inventory logic hospitality has used for decades, since unsold seasonal stock behaves much like an unsold hotel night. The mathematics transfers directly and the organisational resistance transfers with it, because merchants override recommendations for the same reasons hotel managers do. Retailers are learning what hotels learned decades ago, including the organisational parts.
Market Impact: 2 full years missing from baselines

Market Restraints and Challenges

Algorithmic Pricing Scrutiny Is Arriving From Regulators

Competition authorities across the United States and Europe have begun examining whether shared pricing algorithms among competitors amount to coordination, particularly where several operators in one market use the same vendor and the same data. The root cause is that revenue management genuinely does use competitor rate data, which is legal when observed publicly and problematic when pooled. Commercially this creates legal exposure customers did not price into their purchase. Mitigation runs through data separation architecture, documented independence of recommendations, and vendors publishing methodology that most have historically kept confidential.
Market Impact: Attributes carry 23% of value

Missing Pandemic Years Still Distort Forecasting Baselines

Demand forecasting depends on multi-year seasonality patterns, and 2020 and 2021 recorded behaviour that will not recur, so vendors excluded them from training data entirely. The root cause is that no statistical treatment recovers a signal that genuinely is not there, and interpolating across a two year gap creates artefacts of its own. Commercially this suppressed model confidence at exactly the moment operators most needed it, which contributed to override rates near 34%. Mitigation runs through longer training windows, external demand signals and honest confidence intervals rather than point recommendations.
Market Impact: Overrides affect 34% of prices
3 additional market trends, 4 additional growth drivers, and 2 additional restraints and challenges are covered in the full report. Contact sales@marketmindsadvisory.com to access the complete intelligence.

Segment CAGR and Growth Architecture

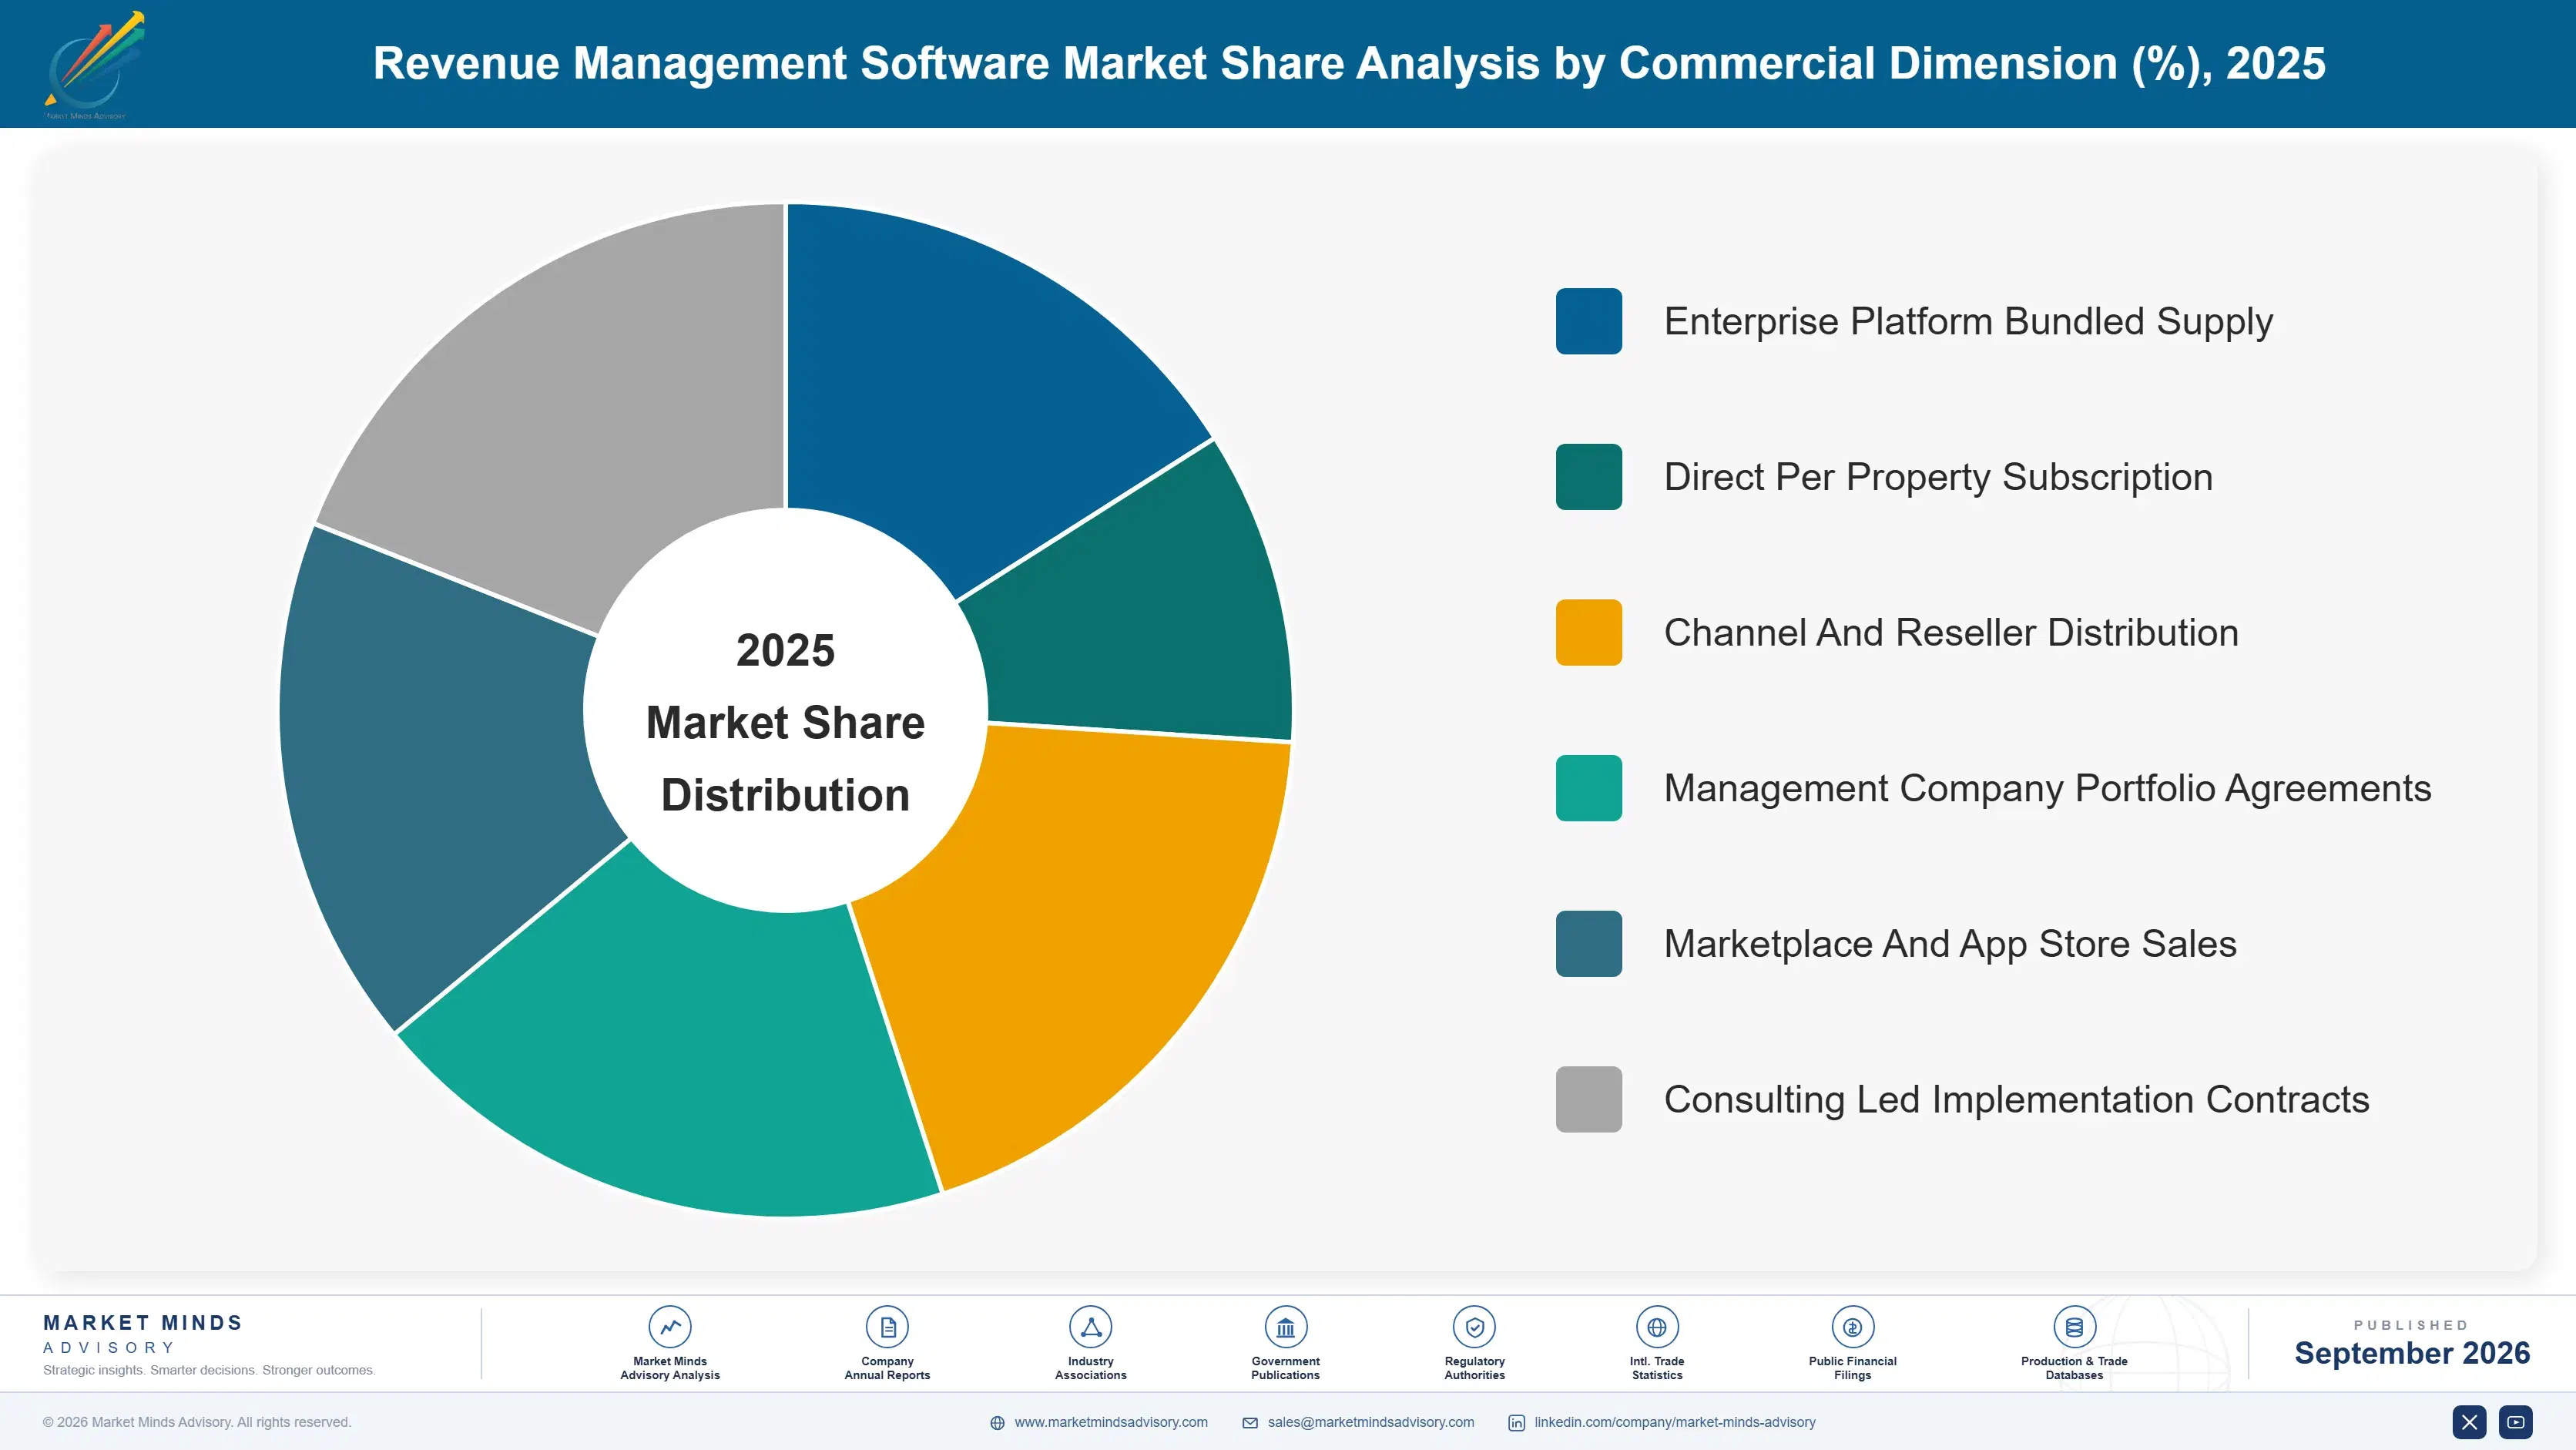
Segmentation follows the pricing decision the software makes, since what a system decides determines the data it needs and who inside the operator actually uses it. Six decision classes cover the market: ancillary and attribute pricing, dynamic price optimisation, markdown optimisation, demand forecasting, rate shopping, and inventory allocation. Industry vertical is a separate dimension entirely.
revenue-management-software-market-market-share-analysis-1789988909791

Ancillary And Attribute Pricing

Ancillary and attribute pricing grows at 16.8%, half again the market rate of 11.2%, because that is where the money went while the systems were watching the base rate. Around 23% of transaction value now sits in checked bags, seat selection, boarding priority, room floor and view, late checkout and cancellation flexibility. Airlines unbundled first and hospitality has followed steadily since. The technical problem is genuinely harder than base rate optimisation, since attributes interact: pricing the window seat affects demand for priority boarding, and most systems built to price one room for one night handle that badly or not at all. Airlines solved this first and hospitality is still catching up considerably.
CAGR 16.8%

Dynamic Price Optimisation

Dynamic price optimisation compounds at 14.1% on adoption reaching independent operators rather than on any change at the chains, who bought this decades ago. Cloud delivery cut implementation to around seventeen weeks and the entry price to a monthly subscription, which brought several hundred thousand independent hotels into the market for the first time. Those properties employ no revenue manager, so the software replaces a role rather than supporting one, and that demands explanation rather than optimisation alone. Override rates near 34% are considerably higher among independents, since the owner publishing the price also owns the consequence personally. Explanation matters more than accuracy to that buyer, and vendors keep missing it entirely.
CAGR 14.1%
Full segment breakdown across 6 segments available in the complete report.

Regional Architecture and Country Demand Map

Western Europe leads at 30% of licence and subscription revenue because the licensing unit is the property and European hotel stock is far more fragmented than American stock. North America follows at 29% with fewer properties, far larger chains and considerably higher revenue per licence.

Western Europe

Western Europe holds 30% of licence and subscription revenue, above the 26% band ceiling, and the mechanism is property count rather than spending power. Revenue management is licensed per property, and European hotel stock is far more fragmented than American stock, with enormous numbers of independents and small groups across Italy, Spain, France and Germany. Amadeus operates from Madrid and holds the leading airline pricing position globally. Lighthouse built its rate intelligence business from Belgium. European carriers adopted continuous pricing early. Growth at 9.8% is the slowest anywhere because penetration among chains is already close to complete here. Fragmentation is the whole mechanism, and it is not going to reverse.
Share: 30% | CAGR: 9.8% (2026 to 2036)

North America

North America takes 29% of licence and subscription revenue on fewer properties earning considerably more each. American hotel stock consolidated into large chains decades ago, so a single Marriott or Hilton agreement covers thousands of properties under central pricing governance that European operators cannot replicate. Oracle Hospitality, IDeaS and Duetto all operate from here, and airline pricing runs through Sabre and PROS. Competition authorities have begun examining algorithmic pricing coordination, which is a live legal question rather than a theoretical one. Growth at 10.6% sits below the global rate on a market where chain penetration is essentially finished. Chain consolidation makes each agreement large and the total property count comparatively small.
Share: 29% | CAGR: 10.6% (2026 to 2036)
Regional intelligence for 5 additional markets available in the complete report: East Asia, South Asia and Pacific, Latin America, Middle East and Africa, Eastern Europe. Contact sales@marketmindsadvisory.com.
revenue-management-software-market-country-cagr-analysis-1789988910324

What Actually Drives Adoption Here

A third of all recommendations get overridden before anybody publishes them, the money moved off the base rate some years ago, and the largest remaining market consists of properties with nobody available to operate the software at all. Each of the four levers below responds directly to one of those three facts rather than to forecast accuracy.

Explain The Recommendation, Not Just The Price

Around 34% of recommended prices are changed before publication, and twenty years of user training has not moved that number meaningfully. The manager overriding usually has context the model lacks and no way to tell whether the recommendation accounted for it. Systems that show the reasoning, the demand signal driving it and the confidence attached reduce override rates substantially, which raises measured benefit without improving the model at all. Vendors keep investing in accuracy when the binding constraint is whether anybody publishes the output. Accuracy is not what stops the output reaching a customer.
Market Impact: Overrides currently affect a full 34% of prices

Price The Attributes Rather Than The Room

Roughly 23% of transaction value now sits outside the base rate, in bags, seats, boarding priority, room view, late checkout and cancellation flexibility, and attribute pricing compounds at 16.8% against 11.2% for the market. Systems architected to price one unit for one night handle interacting attributes badly, since pricing the window seat changes demand for priority boarding. Rebuilding for simultaneous attribute optimisation is expensive engineering that vendors keep deferring, and the operators who need it most are exactly the ones generating the growth. The operators generating the growth need it most.
Market Impact: Attributes now carry fully 23% of transaction value

Build For Properties With No Revenue Manager

Cloud delivery brought several hundred thousand independent properties into the addressable market by cutting implementation to around seventeen weeks and pricing to a monthly subscription. Those operators employ nobody to run the software, so it must substitute for a role rather than assist one, which is a different product entirely. Vendors keep shipping analyst tools with more dashboards to owners who want a price they can trust and publish without thinking about it. The segment is where growth is and the product fit remains poor. Implementation at 17 weeks is still too long for that buyer.
Market Impact: A 17 week implementation now opens the independents

Document Pricing Independence Before Being Asked

Competition authorities in the United States and Europe are examining whether shared pricing algorithms among competitors amount to coordination, particularly where several operators in one market use one vendor and pooled data. Building documented data separation, demonstrable recommendation independence and published methodology addresses that before an investigation rather than during one. Vendors treating methodology as confidential intellectual property carry a legal exposure their customers never priced in. Several operators in one market sharing 1 vendor and pooled data is exactly the pattern now under examination. Publishing the methodology costs far less than defending it later.
Market Impact: Coordination is now examined in 2 major jurisdictions

Who Controls the Margin Pool

Five vendors hold 47% of revenue management licence and subscription revenue, concentrated by ownership of the reservation and distribution systems that pricing decisions have to reach. Amadeus IT Group, Oracle Hospitality and Sabre Corporation sell pricing alongside platforms customers already operate. IDeaS Revenue Solutions and PROS Holdings built specialist positions on modelling depth rather than platform ownership. All participants are assessed on licence and subscription revenue.
Competition runs on integration into reservation systems rather than on model quality, which vendors dislike admitting. A recommendation that cannot reach the booking channel automatically is a report rather than a pricing system, and platform owners control that path. Specialists compete by integrating broadly across platforms, which is continuous engineering work rather than a feature, and it is why the specialist tier stays small.

Rankings shift as independent properties adopt, since that market is served by cloud vendors with different economics rather than by the enterprise platforms. The second pressure is regulatory: an adverse finding on algorithmic pricing coordination would favour vendors who can demonstrate data separation and disadvantage those whose value rests on pooled competitive intelligence, which is a substantial part of this industry.
revenue-management-software-market-company-positioning-matrix-1789988910851

Competitive Moat and Risk Dimensions

AMADEUS IT GROUP

Moat: Distribution Platform Ownership

Amadeus owns the reservation and distribution infrastructure that airline and hotel pricing decisions must travel through, so its pricing products reach the booking channel with no integration work at all. Competitors build and maintain that path continuously against a moving target. The platform position was assembled across decades and no amount of modelling superiority substitutes for it.
AMADEUS IT GROUP

Risk: Regulatory Coordination Exposure

A vendor serving many competing operators in the same market with shared data infrastructure sits precisely where competition authorities are now looking. Demonstrating recommendation independence is possible and it requires architecture and documentation the industry has historically kept confidential. An adverse finding would affect the largest platform positions first and most visibly.
IDEAS REVENUE SOLUTIONS

Moat: Hospitality Modelling Depth

IDeaS has modelled hotel demand for decades and holds forecasting capability specific to hospitality patterns that general pricing engines approximate rather than replicate. Group business, length of stay controls and displacement analysis are hospitality problems that do not transfer from retail or airline pricing. That domain depth is the reason chains keep it alongside platforms they already own.
IDEAS REVENUE SOLUTIONS

Risk: Platform Integration Dependency

A specialist must integrate with every property management and distribution system its customers run, and each of those vendors controls its own interfaces and release timing. Integration is continuous cost rather than a completed project. Platform owners can favour their own pricing products through the same interfaces at any point they choose to.

Players Tracked

Prominent Players

Amadeus IT Group
Oracle Hospitality
IDeaS Revenue Solutions
PROS Holdings
Sabre Corporation

Other Key Players

Duetto
Cendyn
Lighthouse
RateGain Travel Technologies
Infor
Revionics
Blue Yonder
SAP
Zilliant
Pricefx
Atomize
Flyr
Accelya
Shiji Group
Beonprice

Recent Developments

FEBRUARY 2025

Amadeus Extends Attribute Based Pricing Across Airline Retailing

Amadeus IT Group extended attribute based pricing capability across its airline retailing products, an organic product development rather than an acquisition. Around 23% of transaction value now sits outside the base fare, and pricing interacting attributes simultaneously is a materially harder problem than optimising one seat price.
Signal: The money moved off the base rate years ago and the systems are only now following it.
SEPTEMBER 2024

IDeaS Adds Explanation Layer To Hotel Pricing Recommendations

IDeaS Revenue Solutions added an explanation capability showing the demand signals and confidence behind each pricing recommendation, an organic engineering development rather than any transaction. Override rates near a third have persisted for two decades, and the evidence suggests explanation rather than accuracy is what actually moves them.
Signal: Improving the model matters far less than persuading somebody to actually publish what it has produced.
JUNE 2025

RateGain Expands Rate Intelligence Coverage Across Emerging Markets

RateGain Travel Technologies expanded rate intelligence coverage across emerging hospitality markets, an organic capacity expansion rather than a partnership or merger. Indian hotel supply is growing rapidly across secondary cities, and properties opening now configure revenue management from the start rather than retrofitting it later.
Signal: Adopting at opening avoids the organisational resistance that established properties tend to carry for many years afterwards.

What This Software Costs To Run

Engineering salaries account for roughly 44% of platform cost, split between forecasting specialists and the integration engineers who connect to property management and distribution systems. Integration maintenance alone carries around 16%, because every connected platform changes its interfaces on its own schedule. Cloud hosting absorbs about 12%, and customer success and implementation staffing take most of the remaining balance.
Amadeus Annual Report 2024 and Sabre Corporation Annual Report 2024 both record technology staffing and platform modernisation as principal cost variables, with cloud migration expenses running alongside legacy system maintenance. Compensation for engineers combining forecasting and travel domain knowledge rose sharply through 2023 and 2024. Vendors on multi-year subscription contracts absorbed that directly, since a per-property price agreed in 2022 does not reprice when engineering salaries move upward.

The competitive disadvantage mechanism is integration breadth rather than modelling cost. A platform owner reaches the booking channel through infrastructure it already runs, while a specialist maintains connections to dozens of property management and distribution systems that each change independently. That expense scales with customer diversity rather than with customer count, which is why specialists concentrate on a few platforms and platform owners do not have the problem at all.
revenue-management-software-market-cost-volatility-analysis-1789988911049

Concentrate Integration Effort On Fewer Platforms

Integration maintenance runs around 16% of platform cost and scales with the number of connected systems rather than with customers served. A vendor supporting thirty property management systems for a handful of accounts each spends disproportionately on the long tail. Concentrating on platforms carrying most target properties cuts that expense substantially and costs fewer deals than commercial teams fear.

Automate Implementation Configuration From Historical Data

Implementation runs around seventeen weeks and most of that is configuration work performed manually by consultants reading a property's booking history. Automating initial configuration from that same data cuts the period and removes the staffing constraint on onboarding. Independent properties will not wait seventeen weeks at all, and that segment is exactly where the growth is.

Share Forecasting Infrastructure Across Customer Segments

Engineering runs about 44% of platform cost and vendors frequently maintain separate forecasting stacks for chains and independents, on the reasonable-sounding grounds that the requirements differ. The underlying demand mathematics is identical and only the interface and configuration differ genuinely. Consolidating the modelling layer while keeping distinct front ends removes duplication that most product organisations never examine closely.

Portfolio Architecture for Margin Defence

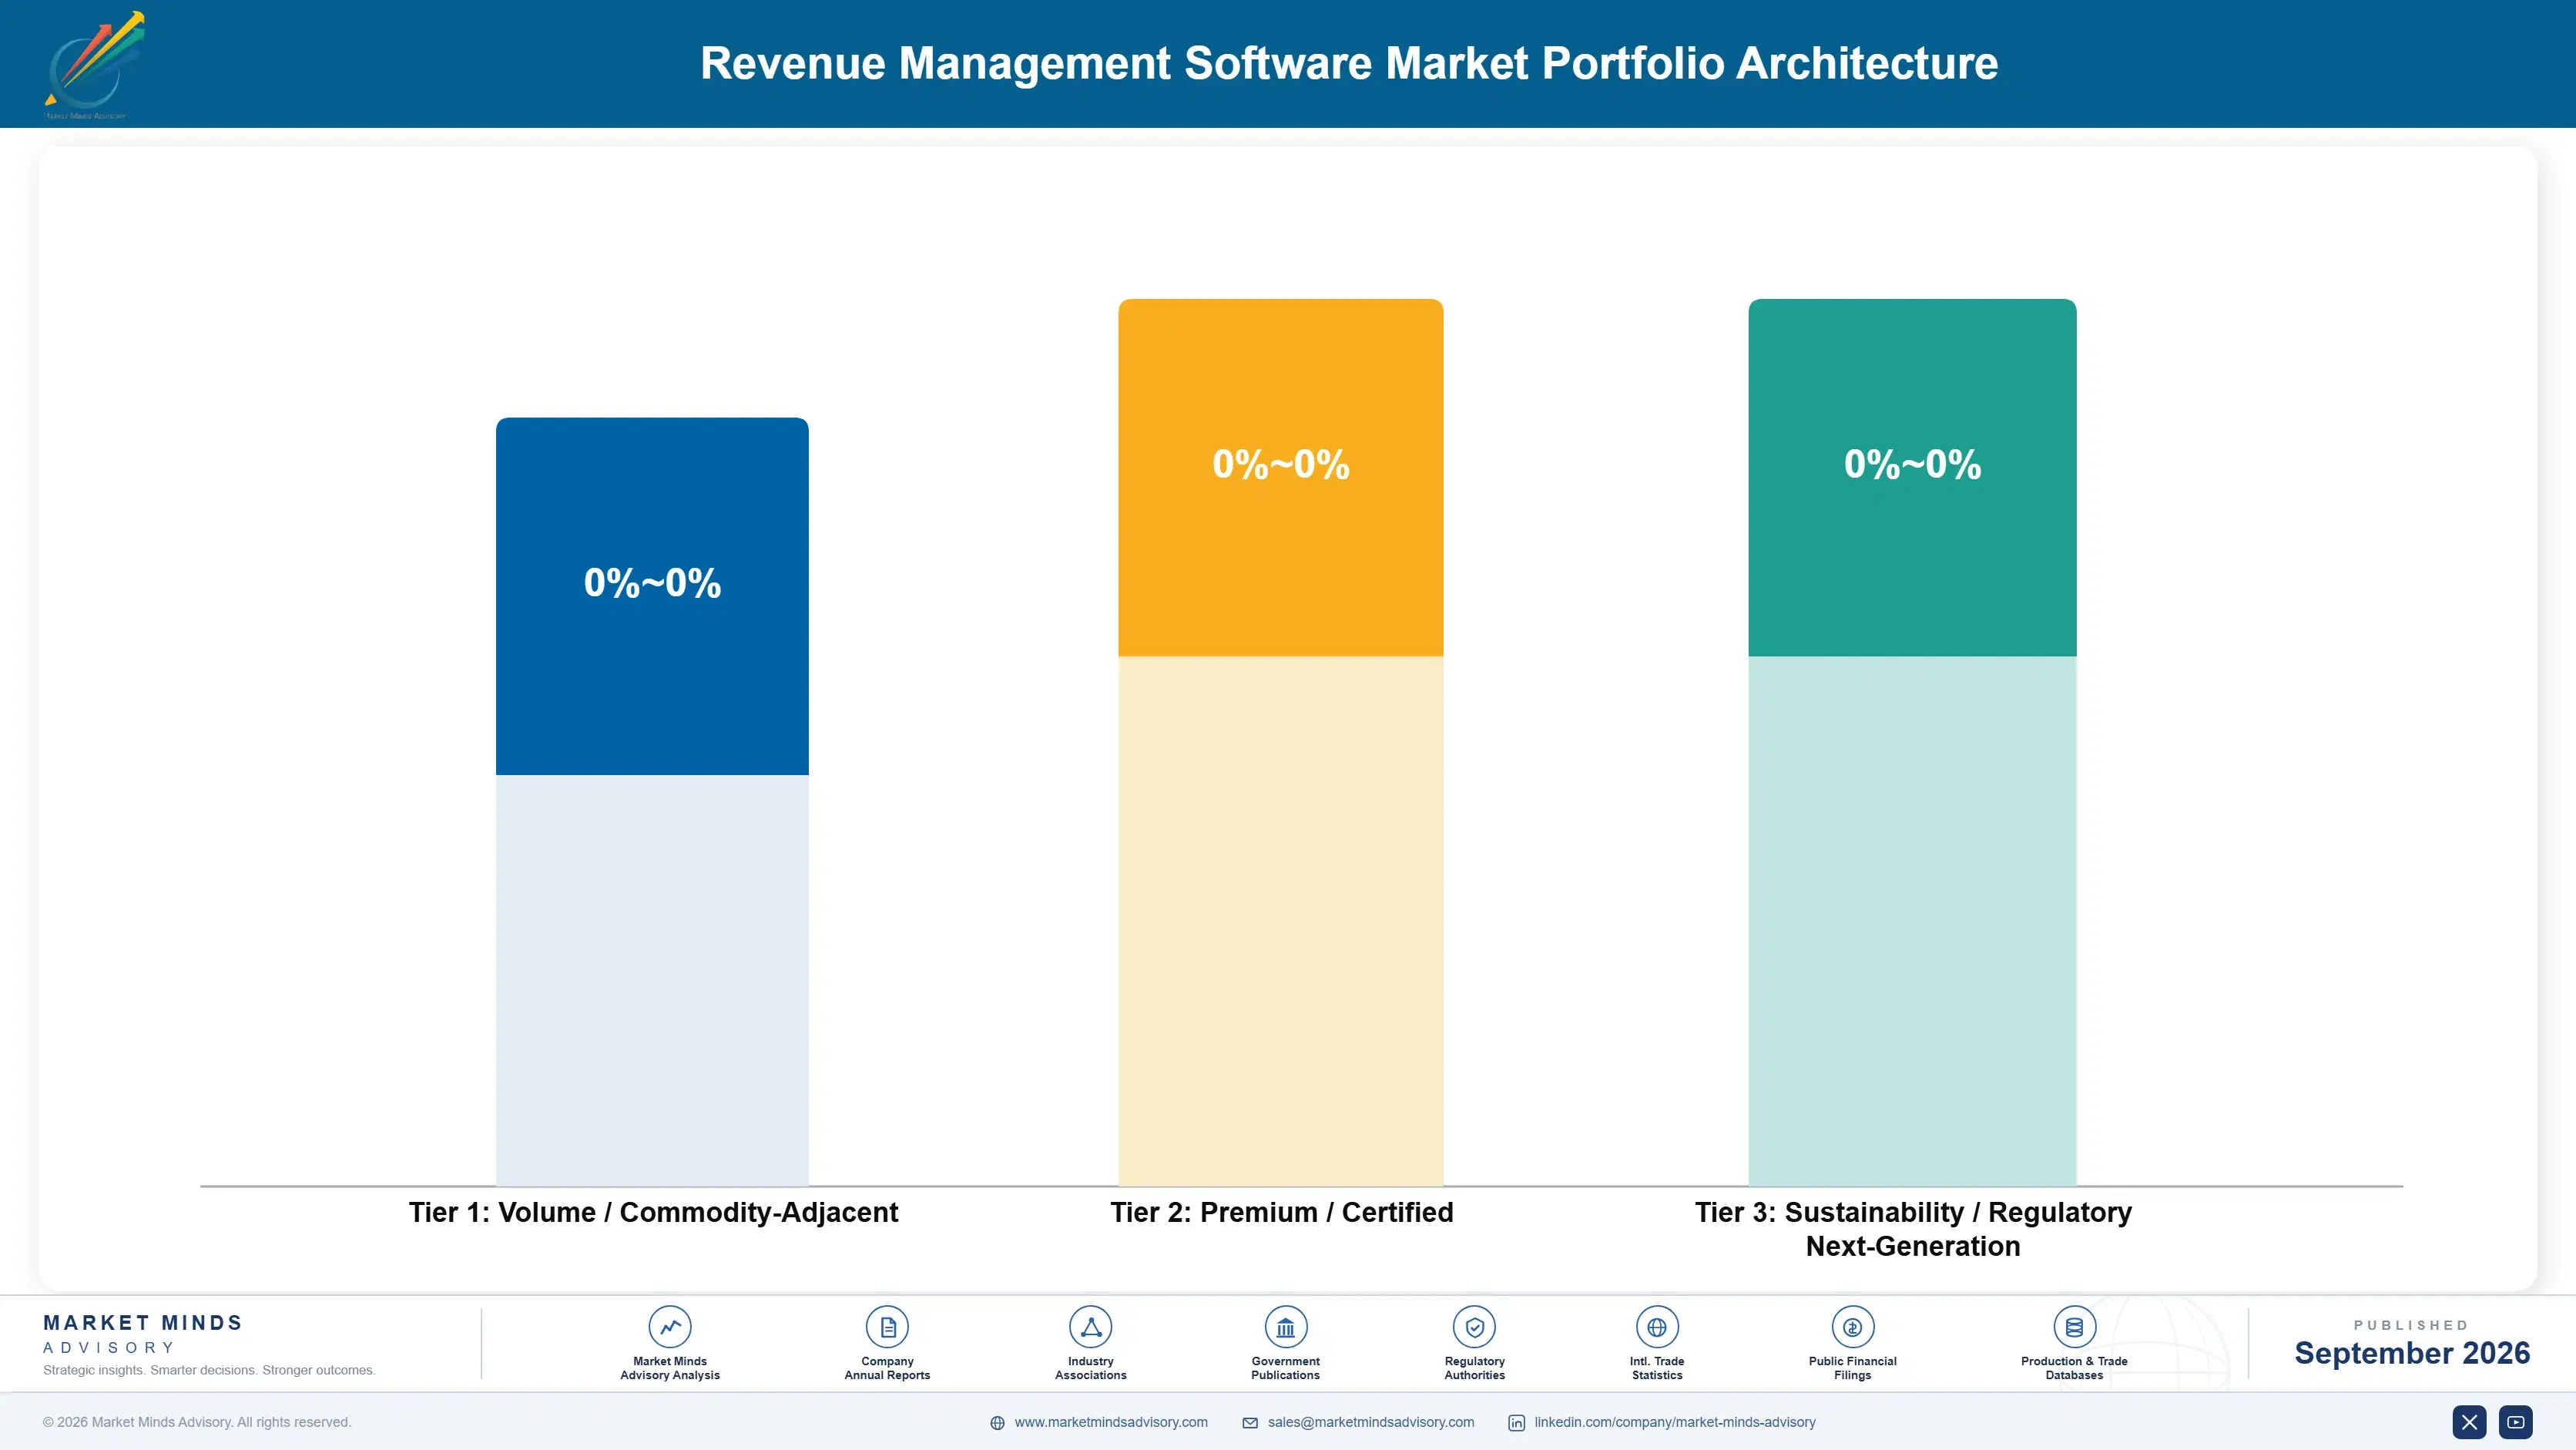
Margin architecture separates on how much the output is trusted and acted upon. Rate shopping and competitive intelligence earn least, since the data is increasingly commoditised and several vendors sell essentially the same feed. Forecasting and inventory allocation sit in the middle as established enterprise functions. Attribute pricing, dynamic optimisation and markdown earn most, because each directly moves revenue the customer can attribute to the software.
The volume versus premium tension is about which customer the product is built for. Chains pay well, buy slowly, employ analysts and demand configurability, which produces a complex product. Independents buy quickly, pay modestly and want a price they can publish without thinking. Vendors building for the first customer and selling to the second explain low adoption as a market education problem, which it is not.

High-value pools concentrate in attribute pricing and in trusted automation, and neither is reached by improving forecast accuracy. Attribute pricing requires rebuilding optimisation for interacting products rather than single units. Trusted automation requires explanation architecture that reduces override rates from around 34%. Both are engineering commitments most vendors have deferred for several years running.

Volume / Commodity-Adjacent

Rate shopping and competitive intelligence feeds, where several vendors sell substantially similar data and differentiation rests on coverage rather than on insight. The ten point spread separates vendors collecting their own data from those reselling aggregated feeds at thinner margin.
Gross Margin: 52% to 62%

Premium / Certified

Demand forecasting and inventory allocation sold into chains and airlines as established enterprise functions with dedicated analytical teams operating them. The ten point spread tracks how much of a vendor's book sits in multi-year enterprise agreements rather than in annually renewed per-property subscriptions.
Gross Margin: 66% to 76%

Sustainability / Regulatory / Next-Generation

Attribute pricing, dynamic optimisation and markdown products, where the software moves revenue the customer can attribute directly to it. The ten point spread reflects override rates, since a recommendation nobody publishes generates no attributable benefit and no renewal argument at all.
Gross Margin: 78% to 88%
revenue-management-software-market-portfolio-architecture-1789988911552

High-value Sub-segments and Strategic Watch-out

Ancillary And Attribute Pricing

Grows at 16.8% because roughly 23% of transaction value moved off the base rate into bags, seats, room features and cancellation terms. The ten point spread reflects override rates. Attributes interact, which makes this genuinely harder than optimising a single unit price. Airlines got there first.
Gross Margin: 78% to 88%

Dynamic Price Optimisation

Grows at 14.1% on independent properties adopting for the first time rather than on any change among chains, who bought decades ago. The ten point spread reflects trust. Override rates near 34% run considerably higher among owners publishing prices personally. Owners bear the consequence personally.
Gross Margin: 78% to 88%

Markdown And Clearance Optimisation

Grows at 12.4% as retailers apply perishable inventory logic that hospitality has used for decades to unsold seasonal stock. The ten point spread reflects integration depth. Merchant overrides mirror hotel manager overrides almost exactly, for identical underlying reasons. The mathematics transfers directly, and so does the organisational resistance.
Gross Margin: 78% to 88%

Inventory Allocation And Capacity Control

Grows at 6.3%, slowest of the six decision classes, because chains and airlines bought this capability long ago and independents rarely need it. The ten point spread reflects contract structure. Replacement rather than new adoption drives essentially all remaining demand here. Nothing new is arriving in this segment.
Gross Margin: 66% to 76%

Why These Subscriptions Renew

The annuity is the historical data the system accumulated rather than the software itself. A forecasting model tuned against several years of a specific property's booking patterns performs there and nowhere else, and switching vendors means starting that accumulation again while pricing worse in the interim. Operators price that switching cost accordingly, which is why renewal rates run well above what per-property subscription pricing would otherwise support.
Depth varies with how automated the operation has become. A chain publishing prices automatically across thousands of properties with minimal human review is deeply embedded and cannot realistically switch quickly. An independent hotel where the owner overrides most recommendations has almost nothing invested and will change vendor for a modest saving. Override rates predict churn better than satisfaction surveys, and few vendors track them.

The buyer moved from a revenue analyst to a general manager or owner as adoption spread beyond the chains, and the product requirement moved with it. An analyst wants configurability, scenario tools and control over assumptions. An owner wants a price to publish and a reason to believe it. Vendors still building for the analyst sell complexity to a customer who never asked.
revenue-management-software-market-end-use-penetration-index-1789988912046

What Decides Success Here

These are among the four positions where our research anticipates prominent divergence between winners and laggards over the coming forecast period. Each is grounded in the demand model, the regulatory perimeter, and the announced capacity pipeline.
01 / RECOMMENDATION EXPLAINABILITY PRIORITY

Win The Override, Not The Forecast

Around 34% of recommended prices are changed before publication, and two decades of user training have not moved that number in any meaningful way at all. The manager overriding usually holds context the model cannot see and has no way at all to judge whether the recommendation accounted for it already. Systems showing their reasoning, the demand signal behind it and the confidence attached cut override rates substantially, which raises measured benefit without improving forecast accuracy by a single point anywhere.
02 / ATTRIBUTE OPTIMISATION REBUILD

Follow The Money Off The Base Rate

Roughly 23% of transaction value now sits outside the headline price, in checked bags, seat selection, boarding priority, room view, late checkout and cancellation flexibility, and attribute pricing compounds at 16.8% against 11.2% for the market. Systems architected to price one unit for one night handle interacting attributes badly, because pricing the window seat changes demand for priority boarding immediately. Rebuilding optimisation for simultaneous attributes is expensive engineering that most vendors in this category have now deferred for several years running.
03 / INDEPENDENT PROPERTY DESIGN

Replace The Revenue Manager, Do Not Assist

Cloud delivery brought several hundred thousand independent properties into the addressable market by cutting implementation to around seventeen weeks and pricing down to a monthly subscription anybody can approve. Those operators employ nobody to run the software, so it has to substitute for a role rather than assist one, which is a fundamentally different product. Vendors keep shipping analyst tools with additional dashboards to owners who simply want a price they can trust enough to publish without thinking about it.
04 / COORDINATION RISK MANAGEMENT

Prove Independence Before Somebody Asks

Competition authorities across the United States and Europe are examining whether shared pricing algorithms among competing operators amount to coordination, particularly where several competing firms in a single market use one vendor and pooled competitive data. Building documented data separation, demonstrable recommendation independence and published methodology addresses that question well before any investigation rather than during one. Vendors treating their own methodology as confidential intellectual property are carrying a legal exposure that their customers never once priced into the purchase at all.

Engagement Snapshot From the Field

A live engagement with an industry participant carrying material or product regulatory and market exposure ahead of a defining policy shift, showing how our research translates into a defensible multi-year portfolio strategy.
MARKET MINDS ADVISORY · CLIENT ENGAGEMENT SUMMARY
Revenue Management Software Producer Strategic Portfolio Review and Transition Roadmap 2026·Investment Scenario on Revenue Management Software Exposure Evaluation 2025-26
CLIENT PROFILE
A European independent hotel group operating 34 properties across four countries, having deployed a revenue management platform two years earlier with disappointing results. Measured revenue improvement sat well below the vendor's projections and below what comparable groups reported. Property managers described the system as broadly unhelpful. Nobody at group level had established what the managers were actually doing with the recommendations day to day.
STRATEGIC CHALLENGE
Commercial leadership believed the vendor's forecasting was inadequate and wanted to run a replacement tender. The vendor pointed to benchmark results at comparable groups and implied the problem was internal. Neither party had measured override behaviour at property level, and the contract renewal decision was scheduled within a quarter with no evidence available to inform it either way.
MMA APPROACH
MMA measured override rates by property and by manager across eighteen months of pricing decisions, and compared realised revenue on published prices against what the original recommendations would have produced. We interviewed managers about why they overrode and grouped the reasons. The work drew on 47 expert interviews conducted in Q4 2025 with vendors, comparable operators and revenue management practitioners across the region.
KEY FINDINGS
  1. Group override rate ran at 61%, far above the 34% typical rate, and 4 properties overrode more than 80% of recommendations they received.
  2. Recommendations that were published unchanged outperformed overridden prices by roughly 5% on revenue per available room, so the model was not the problem.
  3. The dominant override reason was that managers could not tell whether the system knew about local events, which it usually did (client-reported, unverified by MMA).
  4. Two properties with override rates below 20% achieved results in line with the vendor's original projections, which nobody at group level had noticed.
CLIENT PROFILE
A European independent hotel group operating 34 properties across four countries, having deployed a revenue management platform two years earlier with disappointing results. Measured revenue improvement sat well below the vendor's projections and below what comparable groups reported. Property managers described the system as broadly unhelpful. Nobody at group level had established what the managers were actually doing with the recommendations day to day.
STRATEGIC CHALLENGE
Commercial leadership believed the vendor's forecasting was inadequate and wanted to run a replacement tender. The vendor pointed to benchmark results at comparable groups and implied the problem was internal. Neither party had measured override behaviour at property level, and the contract renewal decision was scheduled within a quarter with no evidence available to inform it either way.
MMA APPROACH
MMA measured override rates by property and by manager across eighteen months of pricing decisions, and compared realised revenue on published prices against what the original recommendations would have produced. We interviewed managers about why they overrode and grouped the reasons. The work drew on 47 expert interviews conducted in Q4 2025 with vendors, comparable operators and revenue management practitioners across the region.
KEY FINDINGS
  1. Group override rate ran at 61%, far above the 34% typical rate, and 4 properties overrode more than 80% of recommendations they received.
  2. Recommendations that were published unchanged outperformed overridden prices by roughly 5% on revenue per available room, so the model was not the problem.
  3. The dominant override reason was that managers could not tell whether the system knew about local events, which it usually did (client-reported, unverified by MMA).
  4. Two properties with override rates below 20% achieved results in line with the vendor's original projections, which nobody at group level had noticed.
RECOMMENDED STRATEGY
Phase 1: Phase one: stop the replacement tender, since the evidence shows the model outperformed the managers wherever it was actually allowed to. Phase 2: Phase two: require the vendor to expose which local events and demand signals each recommendation already accounts for, before any renewal is signed. Phase 3: Phase three: report override rate by property every month as an operational metric, alongside occupancy and revenue per available room.
OUTCOME
The group renewed with the incumbent and made override rate a reported operational metric (client-reported, unverified by MMA). The rate fell from 61% to under 30% within two quarters and revenue per available room improved measurably. Vendor selection is now assessed on explanation quality rather than on forecast accuracy claims, which is the change that outlasted the engagement.

Frequently Asked Questions

Foundational context covering the market sizes, CAGR, scope, country, region and competition that inform every finding below. This section is provided to cover basics and most often pre-purchase conversations, answered from the MMA Primary Research Dataset.

What is the current size of the Revenue Management Software Market?

Global value reaches USD 6.89 billion in 2026, measured as licence and subscription revenue across all six pricing decision classes. The 2025 base is USD 6.2 billion.

How large will the Revenue Management Software Market be by 2036?

Licence and subscription revenue reaches USD 19.92 billion by 2036, an increase of USD 13.03 billion over the forecast period. That represents 2.89 times expansion from the 2026 base.

What is the CAGR for the Revenue Management Software Market 2026 to 2036?

The base case runs at 11.2% annually, with a bull case at 12.5% if override rates fall as models explain themselves and a bear case at 10.0% if algorithmic pricing scrutiny slows adoption.

Which segment is growing fastest?

Ancillary and attribute pricing grows at 16.8%, half again the market rate of 11.2%. Around 23% of transaction value now sits outside the base rate in bags, seats, room features and cancellation terms.

Who are the major companies in the Revenue Management Software Market?

Amadeus IT Group, Oracle Hospitality, IDeaS Revenue Solutions, PROS Holdings and Sabre Corporation lead on licence and subscription revenue, together holding 47%. Duetto, Lighthouse and RateGain hold smaller positions.

Which country is growing fastest?

India leads at 17.4%, because hotel supply is expanding across secondary cities and properties adopt revenue management at opening rather than retrofitting it later. Indonesia and Saudi Arabia follow.

Report Segmentation Architecture

The full report scope spans multiple orthogonal segmentation dimensions, with cross-tabulated demand data provided for each dimension pair. Coverage extends further to regional breakdowns, trend trajectories, and the competitive detail needed to support segment-level decision-making.

By Pricing Decision Class

  • Ancillary And Attribute Pricing
  • Dynamic Price Optimisation
  • Markdown And Clearance Optimisation
  • Demand Forecasting And Unconstrained Demand Modelling
  • Rate Shopping And Competitive Intelligence
  • Inventory Allocation And Capacity Control

By End-Use Industry

  • Hotels And Accommodation
  • Airlines And Aviation
  • Car Rental And Mobility
  • Cruise And Leisure Operators
  • Retail And Fashion Merchandising
  • Parking And Live Events

By Commercial Dimension

  • Enterprise Platform Bundled Supply
  • Direct Per Property Subscription
  • Channel And Reseller Distribution
  • Management Company Portfolio Agreements
  • Marketplace And App Store Sales
  • Consulting Led Implementation Contracts

By Region

  • North America
  • Western Europe
  • East Asia
  • South Asia and Pacific
  • Latin America
  • Middle East and Africa
  • Eastern Europe

Scope, Methodology, and Coverage

Every figure in this report is reproducible from documented input assumptions. The scope below maps the historical period, the forecast horizon, the segmentation dimensions, and the countries covered, alongside the underlying primary and qualitative methodology.
Historical Period
2020 to 2025
Forecast Period
2026 to 2036
Base Year
2025 (USD billions; MMA Primary Research Dataset, September 2026)
Market Definition
This report covers software that sets prices and allocates perishable inventory across travel, hospitality and retail: dynamic price optimisation, inventory allocation and capacity control, demand forecasting and unconstrained demand modelling, markdown and clearance optimisation, ancillary and attribute pricing, and rate shopping with competitive intelligence. It excludes reservation and property management systems, distribution and channel management, payment processing, loyalty platforms, and general business intelligence tools.
Quantitative Units
USD millions, licence and subscription revenue basis; licensed properties and airline seats; override rate as a percentage; revenue per available room uplift as a percentage; implementation period in weeks.
Segmentation Dimensions
Pricing decision class; customer industry; commercial distribution model; geography across seven regions.
Regions Covered
North America, Western Europe, East Asia, South Asia and Pacific, Latin America, Middle East and Africa, Eastern Europe
Countries Covered
Spain, France, Italy, Germany, United Kingdom, Netherlands, Poland, Czechia, United States, Canada, Mexico, Brazil, China, Japan, South Korea, India, Indonesia, Australia, United Arab Emirates, Saudi Arabia.
Key Companies Profiled
Amadeus IT Group, Oracle Hospitality, IDeaS Revenue Solutions, PROS Holdings, Sabre Corporation, Duetto, Cendyn, Lighthouse, RateGain Travel Technologies, Infor, Revionics, Blue Yonder, Zilliant, Pricefx, Flyr.
Quantitative Methodology
Primary survey, n=3,800 respondents, Q4 2025, six countries; demand-side model with trade association cross-validation
Qualitative Methodology
47 expert interviews, Q4 2025; applied to validate demand model assumptions, identify emerging dynamics, and assess competitive positioning
Report Format
PDF and XLSX data workbook (Word format preview document)
Publisher
Market Minds Advisory
Report Code
MMA-2026-TEC-491
Published
September 2026
Contact
sales@marketmindsadvisory.com | www.marketmindsadvisory.com

Purchase the full Revenue Management Software Market Report (2026 to 2036).

This report sizes the global revenue management software market from 2026 to 2036 across six pricing decision classes, six customer industries and seven regions. It explains why a 34% override rate matters more than forecast accuracy, how roughly 23% of transaction value moved off the base rate into attributes, and why the missing pandemic years still distort forecasting baselines. Cost composition is sourced to company annual reports, with integration maintenance analysed as the constraint on specialist vendors. Regional analysis explains why Western Europe leads at 30% on property count while India grows at 17.4%. Competitive assessment covers 20 named vendors.
Six pricing decision classes sized through to 2036
Override economics modelled as the real adoption ceiling
Integration maintenance cost analysed from company filings
Twenty named vendors assessed on subscription revenue
Four revenue levers with quantified commercial impact
Anonymised European hotel group adoption engagement included fully

Built For The People Who Decide

From boardroom strategy to bench-side execution, this report is read cover-to-cover by leaders shaping the next decade of their industry, turning demand scenarios, market dynamics and valuation benchmarks into decisions.
CXOs/ Presidents/ VPs/ Managers
M&A and Corporate Development
Strategy Teams and R&D Heads
Procurement and Product Directors
Regulatory and Compliance Leaders
Investor Relations and Equity Analysts