
Market Minds Advisory
Returnable Packaging Market

Returnable Packaging Market Size, Share & Trends 2026-2036

Expanding closed-loop supply chain mandates, tightening single-use packaging regulations, and growing automotive and industrial pooling program adoption are pushing transport packaging toward returnable formats across major manufacturing markets worldwide this year.

Lead Analyst

Bilal Shaikh

Published

November 2026

Make Smarter Decisions with Customized Research Insights

Request a free sample report and evaluate market opportunities, growth trends, and competitive dynamics relevant to your business needs.

2025 MARKET VALUE$4.8BMarket Size 2025
2036 FORECAST VALUE$9.5BBase Case , 2026 to 2036
CAGR 2026 TO 20366.4 %Bull 7.7% / Bear 5.1%
INCREMENTAL OPPORTUNITY$4.4BNet 10- year value creation
EXPANSION MULTIPLE1.86x2036 value over 2026 base
Strategic Levers
M&A Pipeline
Regional Outlook
Country Rankings
Competitive Intelligence
Segmental Deep-dive
Call-Us : 91 93563 13602

Returnable Packaging Market at a Glance

Returnable packaging, covering reusable pallets, crates, and containers within closed-loop and pooled distribution systems, is moving from automotive and industrial supply chains into mainstream retail and grocery distribution this year as single-use packaging regulations tighten nationwide today, reshaping procurement specifications across major brand owners already. Measured on its own, the crates and pallets packaging market is valued by MMA at USD 48.5 billion in 2025, heading to USD 81.2 billion by 2036.
Automotive manufacturers and grocery distributors are the dominant commercial force behind adoption, driven by closed-loop supply chain mandates and total-cost-of-ownership economics that favor reusable formats over repeated single-use packaging purchases. Pooled Returnable Container Programs lead segment growth at a 9.1% CAGR, well above category average, as third-party pooling operators expand service coverage across new regional markets. European manufacturers, led by German industrial producers, are capturing a growing share of global program adoption nationwide.
Competitive intensity is rising, with established pooling operators extending pallet-only programs into broader container and crate categories rather than ceding share to specialist entrants. Single-use packaging bans across multiple jurisdictions are accelerating qualification cycles for compliant returnable alternatives, while asset-tracking complexity and pool-shrinkage losses continue to squeeze margins for smaller operators lacking scale, a gap now widening as tracking requirements grow more technically demanding each cycle too.
Market Definition
The Returnable Packaging Market covers reusable pallets, crates, containers, and dunnage designed for multiple trip cycles within closed-loop or pooled distribution systems, including both owned and third-party pooling programs. It excludes single-use corrugated and plastic transport packaging, consumer-facing reusable bags and totes, and standard warehouse racking or storage infrastructure not designed for repeated transport cycles. This ties directly to the reusable consumer packaging market, which MMA forecasts will reach USD 28.6 billion by 2036 at a 7.8% CAGR.
Base Year Value
$4.8B in 2025 (MMA Primary Research Dataset, October 2026)
Forecast Period
2026 to 2036, eleven discrete annual values
CAGR
6.4% base case. Bull 7.7%. Bear 5.1%.
Fastest Growth Segment
Pooled Returnable Container Programs: 9.1% CAGR
Fastest Growth Country
Germany: 8.2% CAGR
Fastest Growth Region
South Asia and Pacific: 8.4% CAGR
Largest Region
Western Europe: 26% of 2025 global value
Market Leaders
CHEP Pallecon Solutions, IFCO Systems, ORBIS Corporation, Schoeller Allibert, Loscam Limited. Source: MMA Analysis, based on company disclosures and primary survey data, Q4 2025.
Primary Survey
n=3,800 procurement and R&D decision-makers, Q4 2025, six countries
Methodology
Demand-side build-up, cross-validated against public data, 47 expert interviews

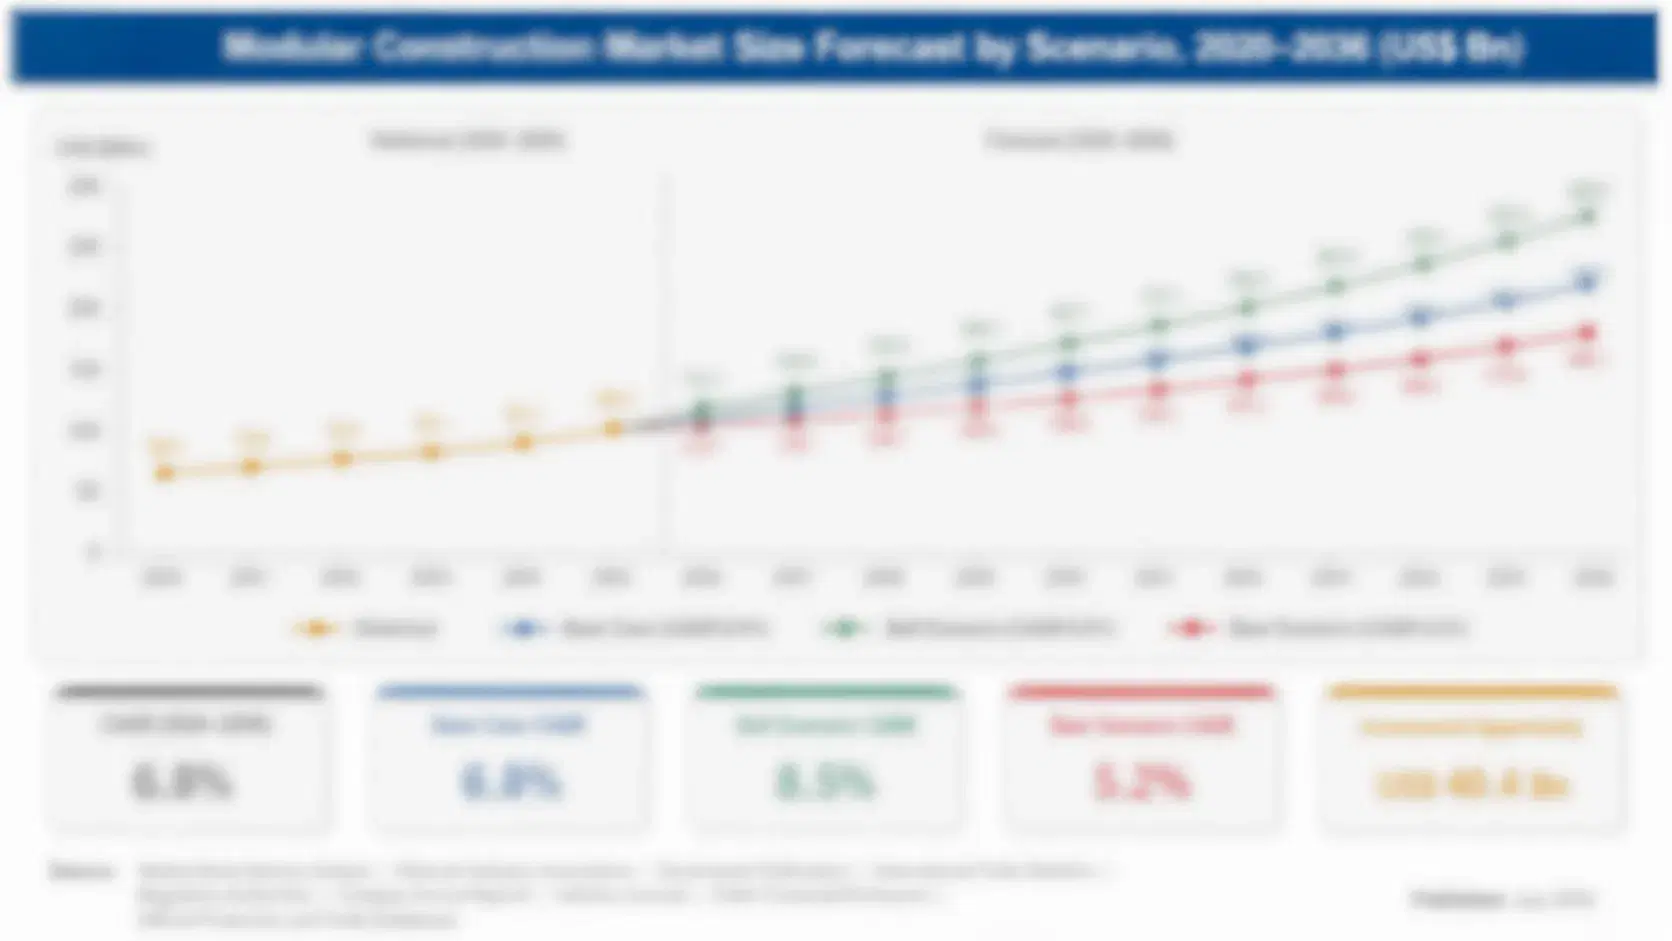
Returnable Packaging Growth Scenarios to 2036

returnable-packaging-market-size-forecast-scenario-1791530566236
Between 2020 and 2025, returnable packaging adoption stayed concentrated among automotive manufacturers with established closed-loop supply chains, with limited penetration into grocery and general retail distribution. Pool-shrinkage losses and asset-tracking complexity kept broader conversion slow during the period. The historical growth rate of 5.7% reflects this automotive-concentrated adoption base rather than broad cross-industry conversion during the historical period.
The base case assumes a 6.4% compound annual growth rate through 2036, anchored by three commercial mechanisms: single-use packaging bans expanding across additional jurisdictions, third-party pooling operators extending service coverage into mid-tier grocery and retail distribution beyond automotive accounts, and RFID-based asset-tracking costs falling enough to support pool management at smaller operator scale Grocery retailers in several markets are also piloting pooled crate programs for fresh produce distribution where damage reduction and sustainability both matter to brand positioning.
The bull case centers on accelerated single-use bans pulling returnable packaging deeper into general retail distribution faster than expected. The bear case centers on persistent pool-shrinkage losses deterring price-sensitive categories from converting, leaving adoption concentrated in automotive and industrial niches only Pooling operator capacity investment announced through 2025 suggests the base case remains the more probable path forward overall.

Ownership Gives Way To Pooled Circulation

Returnable packaging occupies an increasingly central role within broader supply-chain packaging spending, distinguished by its trip-cycle economics rather than the single-purchase model that governs disposable transport packaging. Operators increasingly budget returnable packaging as a total-cost-of-ownership investment with measurable trip-cycle payback rather than a general capital expenditure line item reviewed alongside unrelated logistics upgrades nationwide too now. MMA's outlook for the returnable transport packaging market points to USD 19.2 billion by 2036, a 6.3% annual growth rate.
MARKET CONCENTRATIONCR5 28%Top five operators hold a moderately fragmented share
AVERAGE SELLING PRICEUSD 38/unitReturnable formats command meaningfully higher per-unit pricing today
TOP PRODUCING COUNTRY SHAREGermany 19%Industrial pooling programs concentrate heavily within this country
CAPACITY UTILIZATION81%Pool operators retain modest headroom for new program growth
INPUT COST SHARE46%Recycled plastic resin and RFID tracking dominate production cost
REPLACEMENT CYCLE5 to 7 yearsUnits stay in active circulation for roughly several years
Operators compete on pool-management sophistication, asset-tracking accuracy, and network density, since the ability to minimize shrinkage losses and optimize return-trip logistics increasingly separates premium pooling programs from simple owned-fleet arrangements. Supply reliability for recycled plastic resin has become a growing concern as pooling demand accelerates, since a meaningful share of global resin production concentrates among a small number of recyclers serving multiple packaging categories simultaneously today indeed now too. MMA's view of the corrugated plastic box market offers a useful comparison, at USD 3.1 billion in 2025 rising to USD 6.2 billion by 2036, a 6.5% CAGR.
Manufacturers increasingly treat returnable packaging total-cost-of-ownership as a measurable procurement metric rather than an incidental logistics detail, pushing operators toward documented shrinkage-rate data that can withstand rigorous contract review. This shift is raising entry barriers for smaller operators lacking tracking and shrinkage-analytics infrastructure, pushing consolidation toward firms able to bundle asset fleets with ongoing pool-performance reporting already now too now. Adjacent demand is captured in the returnable circular packaging market, which MMA expects to grow from USD 4.9 billion in 2025 to USD 12.5 billion by 2036.
"A returnable pallet only earns its cost advantage if it actually comes back. Pool management, not the plastic itself, is where the real competitive differentiation lives now."
Senior Analyst, Industrial Packaging Logistics Practice · MMA Reusable Transport and Industrial Packaging Practice · October 2026

Returnable Packaging Technology Trends

Third Party Pooling Networks Keep Expanding

Third-party pooling operators are extending service coverage from automotive-dominated corridors into general retail and grocery distribution networks, offering manufacturers access to shared returnable fleets without the capital commitment of owning and managing assets independently. This network expansion is pulling returnable packaging out of automotive-only niches and into mainstream grocery and general retail distribution faster than operators anticipated two years ago. Suppliers able to demonstrate reliable return-trip performance across diverse distribution networks are winning disproportionate new contract volume across multiple retail categories simultaneously this cycle, a pattern now visible across most major logistics markets tracked in this report. Readers tracking this shift may also follow the ESD stackable box market, which MMA sizes at USD 0.7 billion in 2025, growing at 8.0% a year.
Market Impact: Cuts packaging cost by 22%
Single Use Packaging Bans Force Conversion Timelines

Multiple jurisdictions are tightening single-use transport packaging restrictions on an accelerated timeline, forcing manufacturers and distributors to qualify returnable alternatives faster than their original capital-planning cycles anticipated. This regulatory pressure is lifting demand for returnable packaging across industries previously unaffected by closed-loop supply chain requirements, where conversion had been viewed as optional rather than mandatory. Operators serving regulated jurisdictions are investing in expanded pool capacity to capture this expanding, time-constrained demand ahead of compliance deadlines, a gap most smaller operators lacking comparable capacity are still working to close soon already. MMA expects the related nestable drums market to be worth USD 2.57 billion by 2036.
Market Impact: Reduces supply disruption by 31%

Returnable Packaging Market Opportunities

Total Cost Of Ownership Economics Keep Favoring Reuse

Multi-trip returnable packaging increasingly beats single-use alternatives on total-cost-of-ownership math once trip volume exceeds a break-even threshold that has fallen steadily as pooling operators improve asset-tracking and shrinkage-control performance over successive years. This economic shift gives procurement teams a straightforward financial case for conversion independent of sustainability considerations, materially expanding the addressable buyer base beyond companies with dedicated environmental mandates. This driver is proving durable rather than cyclical, since the underlying trip-volume economics do not depend on regulatory conditions remaining favorable, a pattern now visible across most major manufacturing categories tracked in this report.
Market Impact: Raises shrinkage losses by 13%

Supply Chain Resilience Pressure Keeps Building

Persistent supply chain disruptions in recent years have pushed manufacturers to prioritize packaging systems that reduce dependence on continuous purchasing cycles, since returnable fleets already in circulation provide a buffer against upstream material shortages that disrupted single-use packaging supply repeatedly. Returnable packaging gives manufacturers greater control over their own packaging availability, reducing exposure to the raw-material and converting-capacity bottlenecks that affected single-use suppliers during recent disruption periods. This driver is particularly acute for manufacturers serving just-in-time production schedules, a priority that has only intensified as global shipping disruptions recur more frequently.
Market Impact: Adds 9 days to return cycles

Returnable Packaging Challenges and Constraints

Pool Shrinkage Losses Erode Program Economics

Returnable units that fail to return to the pool, whether lost, damaged, or diverted into unauthorized use, represent a direct economic loss that erodes the total-cost-of-ownership advantage returnable packaging depends on to justify adoption over single-use alternatives. The root cause lies in fragmented supply chains spanning multiple handlers and facilities, each introducing a point where asset visibility can break down without adequate tracking infrastructure in place. Operators are investing in RFID and barcode tracking systems as mitigation pathways, though full shrinkage elimination remains elusive even for the most sophisticated pooling programs.
Market Impact: Covers 17% of new distribution contracts

Cross Border Pooling Logistics Add Complexity

Returnable packaging programs spanning multiple countries face customs, regulatory, and reverse-logistics complications that domestic-only programs do not encounter, complicating pool management for manufacturers operating international supply chains that span several jurisdictions simultaneously. The root cause is inconsistent cross-border packaging regulation and customs treatment of empty returnable assets, which several jurisdictions still classify ambiguously. Operators are developing dedicated cross-border logistics partnerships as a mitigation pathway, though full harmonization across major trading corridors remains incomplete, leaving timeline uncertainty as a genuine barrier for manufacturers evaluating international pooling program expansion across new territories.
Market Impact: Accelerates 24% of conversion timelines
3 additional market trends, 4 additional growth drivers, and 3 additional restraints and challenges are covered in the full report. Contact sales@marketmindsadvisory.com to access the complete intelligence.

Returnable Packaging Segment Performance

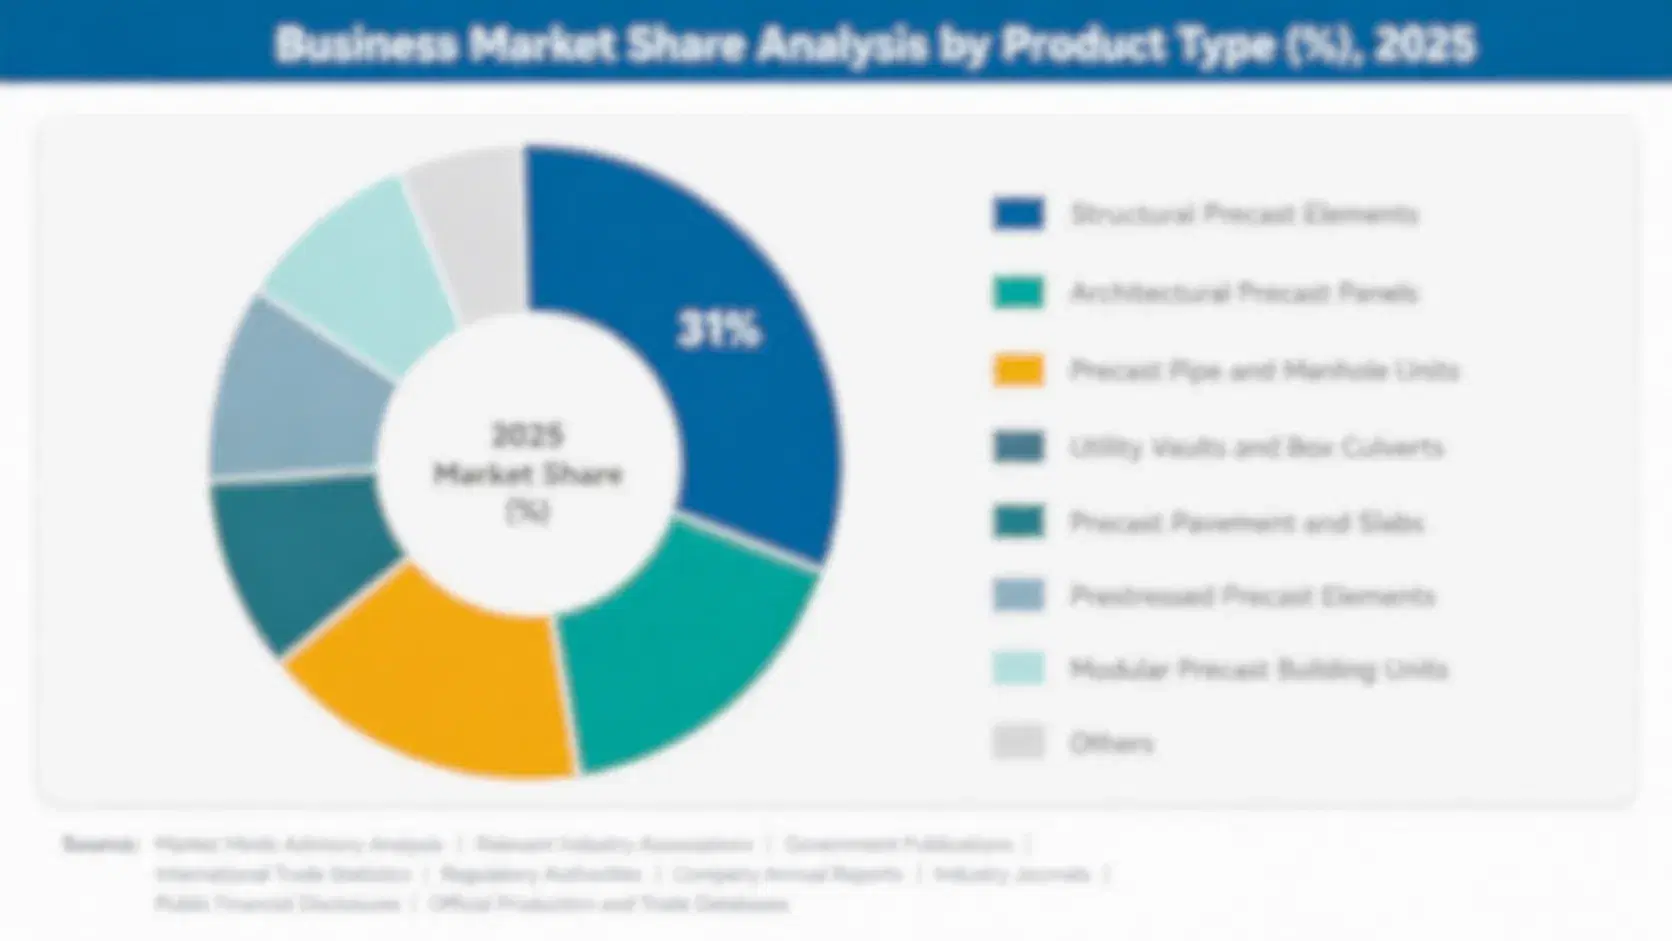
Returnable packaging segments primarily by asset type, since this determines capital cost, pooling model complexity, and the buyer category each format realistically serves across automotive, industrial, and retail distribution applications, from pooled programs carrying the fastest growth to owned fleets carrying the largest existing capital base, with three additional formats tracked in reserve today.
returnable-packaging-market-market-share-analysis-1791530566495

Pooled Returnable Container Programs

Pooled returnable container programs, operated by third-party providers managing shared fleets across multiple manufacturer customers, are capturing a growing share of new program adoption as manufacturers prioritize asset flexibility over capital-intensive owned fleets. Grocery and general retail distributors expanding beyond automotive-style closed-loop systems are the primary adoption driver, since pooled programs let them access returnable infrastructure without building internal pool-management capability. This segment leads category growth by a wide margin as pooling operators extend network density, making shared programs viable for distribution networks that could not previously justify a dedicated fleet investment. Pooling operators serving this segment increasingly treat network density as a core differentiator, since return-trip efficiency matters more to buyers than raw unit-cost savings alone.
CAGR 9.1%

Owned Fleet Returnable Pallet Systems

Owned fleet returnable pallet systems serve manufacturers with established, predictable closed-loop supply chains where direct asset control matters more than the flexibility that pooled programs offer, particularly in automotive and heavy-industrial applications. Large manufacturers with long-term supplier relationships are a significant adoption driver, since owned fleets let them customize asset specifications precisely to their production-line requirements. This segment commands substantial capital investment relative to pooled alternatives, and adoption cycles tend to favor manufacturers with long facility-lease horizons able to justify the fixed asset commitment over time. Maintenance and tracking responsibilities for this segment fall entirely on the owning manufacturer, a meaningful operational commitment that pooled program customers avoid completely under pooled arrangements.
CAGR 6.8%
Full segment breakdown across 7 segments available in the complete report.

Returnable Packaging Market by Country

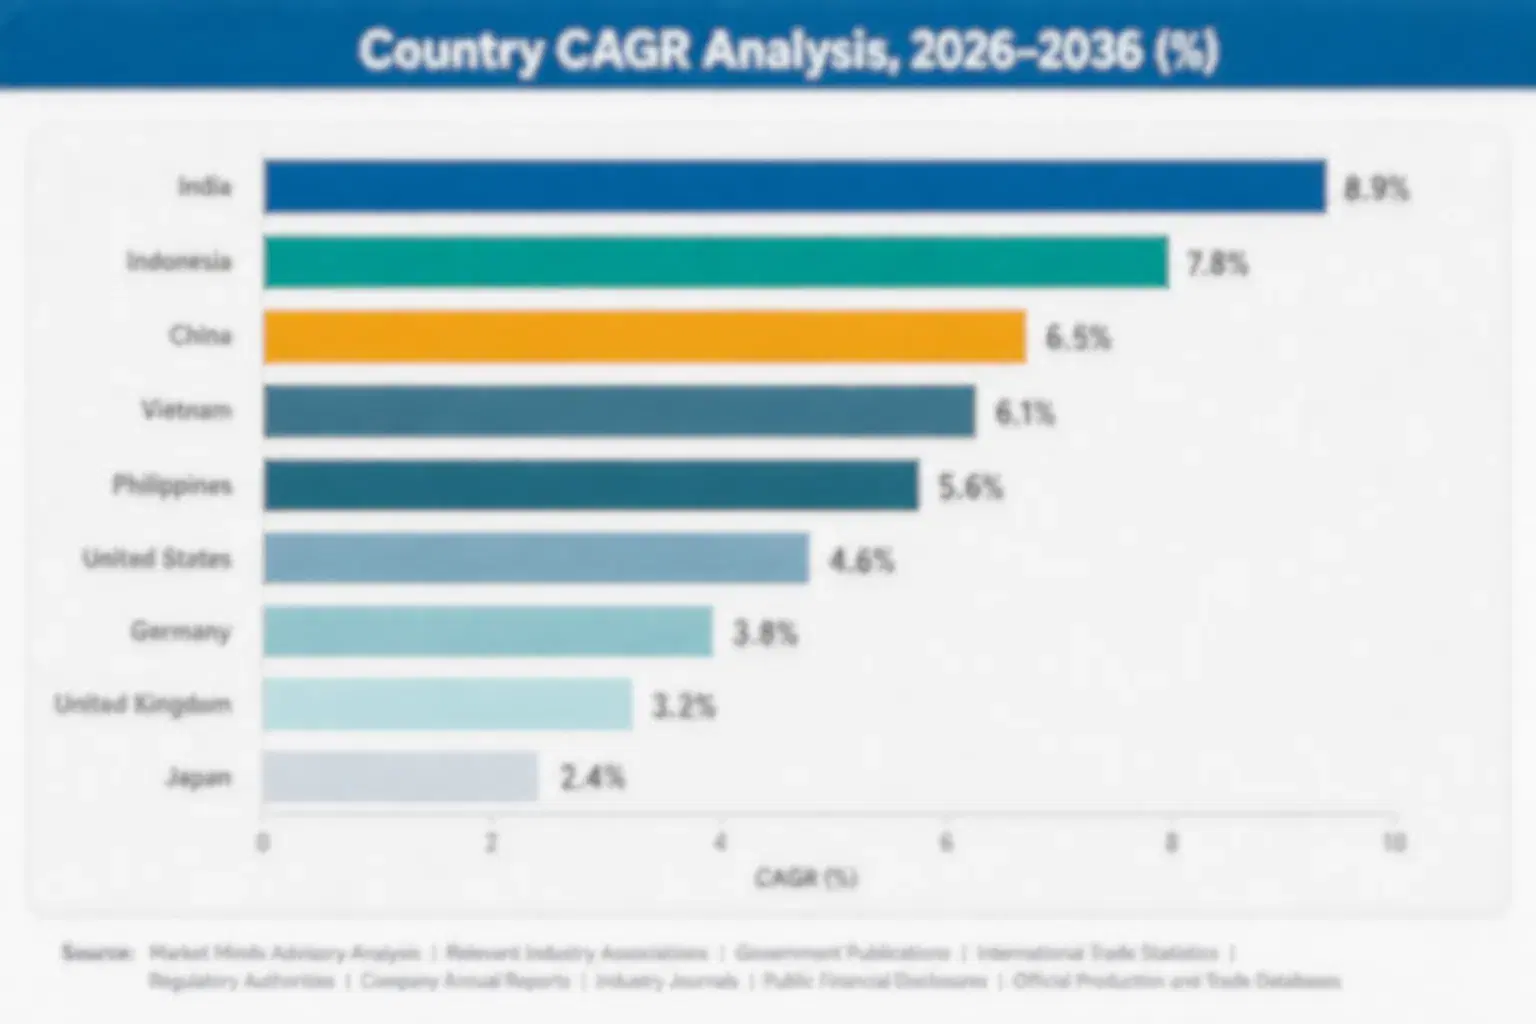
Western Europe leads on industrial pooling program density and automotive closed-loop supply chains, while East Asia drives fastest growth through expanding manufacturing-export packaging requirements, a divide that is expected to persist through most of the forecast period across most major manufacturing corridors worldwide today indeed.

North America

United States and Canadian automotive manufacturers maintain the most mature returnable packaging programs in the region, reflecting decades of closed-loop supply chain discipline established by just-in-time production requirements across integrated manufacturing networks. Grocery distributors are the fastest-growing adopter category, converting from single-use corrugated to pooled crate programs as sustainability commitments expand across major retail chains. Operators here compete heavily on pool-management software sophistication rather than unit cost alone, since large manufacturing accounts increasingly specify shrinkage-rate performance guarantees in procurement contracts. Canadian manufacturers are following similar patterns with a modest lag, reinforcing the region's overall position in pooling program maturity relative to most other markets tracked in this report already now.
Share: 25% | CAGR: 5.9% (2026 to 2036)

Western Europe

Germany hosts the region's densest industrial pooling network, anchored by automotive and heavy-machinery manufacturers that pioneered closed-loop returnable systems decades before other regions adopted comparable practices. France and the United Kingdom are extending pooling programs into grocery and general retail distribution faster than most other developed markets, driven by some of the world's strictest single-use packaging restrictions. Operators serving this region maintain deep regulatory-compliance expertise around packaging-waste reporting, since several European jurisdictions already require detailed asset-circulation disclosure. Nordic markets are moving even faster than peers elsewhere in the region, reflecting generally stronger sustainability-mandate enforcement and deeper industrial manufacturing presence than most Southern European markets too This leadership position is expected to hold through most of the decade.
Share: 26% | CAGR: 5.2% (2026 to 2036)
Regional intelligence for 5 additional markets available in the complete report: East Asia, South Asia and Pacific, Latin America, Middle East and Africa, Eastern Europe. Contact sales@marketmindsadvisory.com.
returnable-packaging-market-country-cagr-analysis-1791530566778

Monetizing Circulation, Not Just Assets

Operators are finding that pool-performance data itself can become a billable service layered on top of the physical asset rental, extending margin capture well past the point of deployment and deepening manufacturer dependence on proven networks over time, and the operators moving fastest to build these recurring revenue streams are positioning for margin profiles closer to software vendors than traditional.

Shrinkage Analytics Subscription Service Contract Programs

Operators with established RFID and tracking infrastructure are beginning to offer manufacturers paid shrinkage-analytics subscriptions, letting procurement teams monitor return-trip performance and identify loss points across their distribution networks in near real time. Early programs suggest this analytics layer can add 7 to 10 percent incremental revenue per account annually, particularly for manufacturers managing complex multi-facility distribution networks where loss points are hard to trace manually. This model converts a one-time asset rental into a recurring data relationship that traditional pooling operators have rarely offered before, a shift that is reshaping how operators value long-term manufacturer account relationships.
Market Impact: Adds 7 to 10% incremental annual operator revenue

Cross Border Logistics Coordination Service Programs

Operators are bundling cross-border logistics coordination services alongside standard pooling contracts, managing customs documentation and reverse-logistics scheduling for manufacturers operating international supply chains that would otherwise require dedicated internal staff. This approach has already produced 5 to 8 percent margin uplift on accounts carrying active coordination agreements, since avoiding customs delays matters more to manufacturers than routine logistics cost savings alone during time-sensitive shipments. Manufacturers increasingly view these agreements as insurance against costly customs delays, making the coordination layer an easier sell than it might otherwise be given the revenue at stake during time-sensitive shipments.
Market Impact: Generates 5 to 8% coordination margin uplift annually

Who Captures Returnable Packaging Value

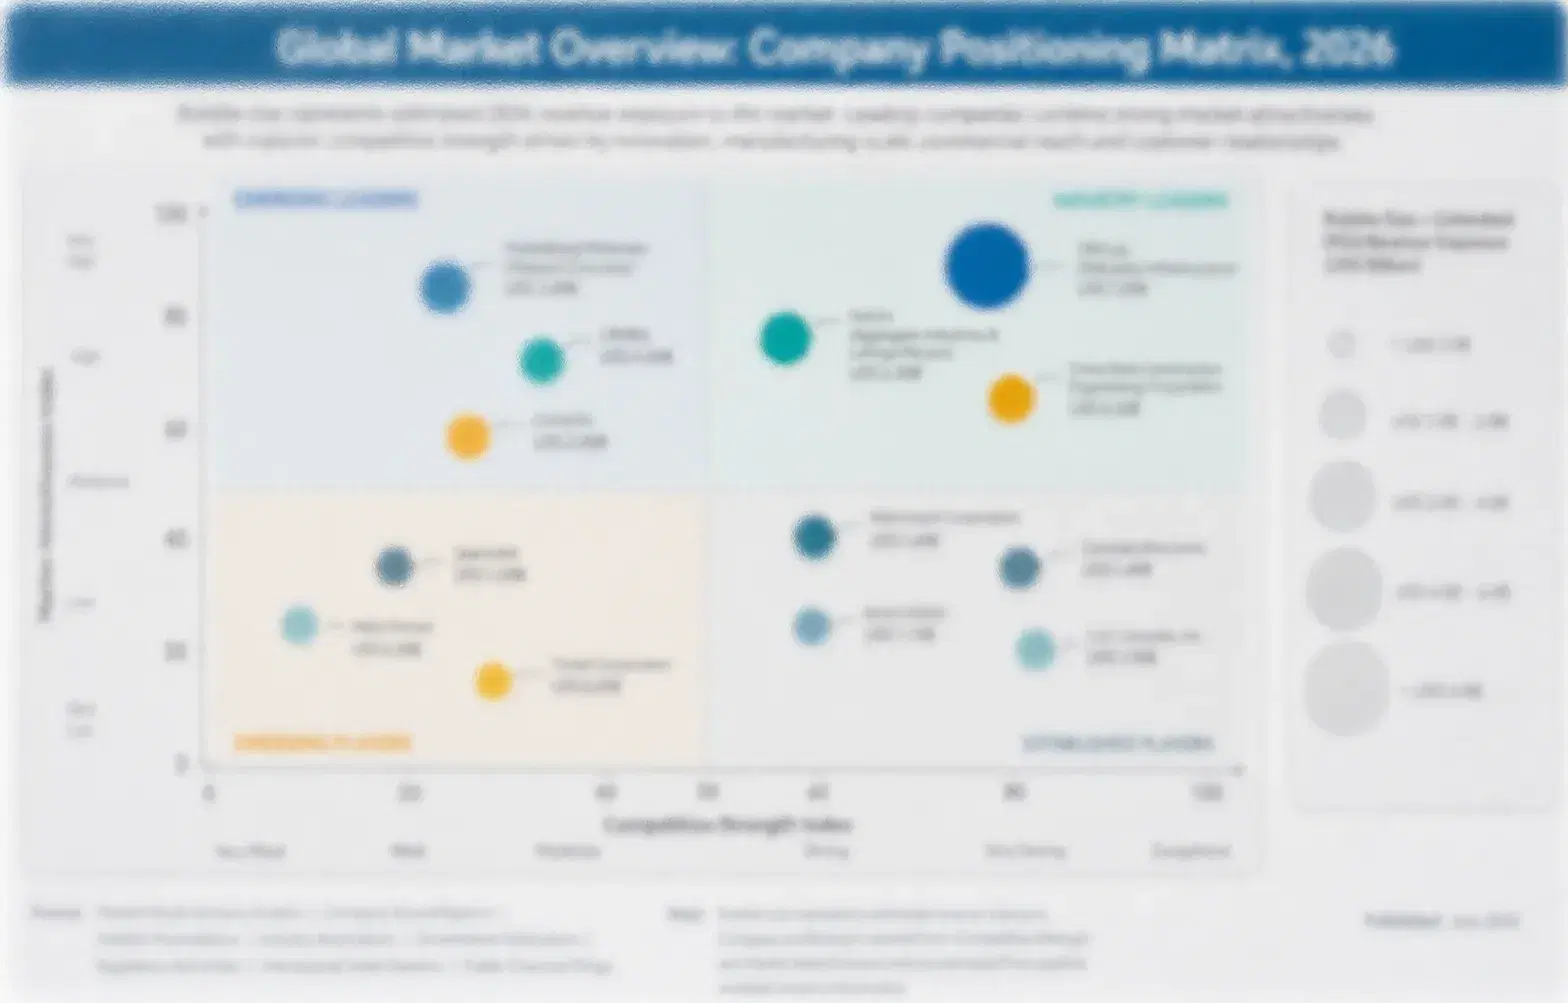
The top five operators hold roughly 28% of global returnable packaging revenue, a moderately fragmented level reflecting the category's history of regional pooling operators alongside global network providers. CHEP leads on breadth across automotive and retail distribution accounts, with a gap over the next-ranked challenger reflecting genuine network-scale advantage built over decades of pooling infrastructure development. Smaller regional operators struggle to close this network gap given the capital investment required to compete at comparable scale.
Competitive activity currently centers on asset-tracking sophistication and cross-border logistics capability, since large manufacturers increasingly require both proven shrinkage-control performance and international coordination from a single operator relationship. Several mid-tier operators are pursuing regional network expansion to compete for multi-facility manufacturer contracts beyond their traditional local-market base Smaller local operators still dominate single-region contracts where multi-country consistency carries less weight.

Emerging pressure comes from logistics-technology specialists attempting to enter adjacent to established pooling operators rather than challenging them head-on, a dynamic that could reshape rankings if a major specialist secures a flagship manufacturer account. Rankings are most likely to shift among mid-tier operators still building network-density track records A major specialist demonstrating comparable tracking performance at lower combined cost would accelerate this shift.
returnable-packaging-market-company-positioning-matrix-1791530567069

Returnable Packaging Supplier Positioning

CHEP PALLECON SOLUTIONS

Moat: Network scale and breadth

CHEP's decades of pooling infrastructure development across automotive and retail distribution give it a network density that newer entrants cannot replicate quickly, particularly for large manufacturers requiring proven return-trip reliability at scale across multiple regions, a lead that continues widening as more manufacturers standardize around proven networks.
CHEP PALLECON SOLUTIONS

Risk: Slower specialist pricing agility

CHEP's scale can mean slower pricing flexibility than smaller specialist operators that focus exclusively on niche pooling segments, risking share loss in the fastest-growing pooled-container segment specifically among mid-sized manufacturers now, particularly as mid-sized manufacturers push back hard on standard pricing terms now too now.
IFCO SYSTEMS

Moat: Grocery distribution network depth

IFCO's long-standing relationships with grocery distributors give it a qualification advantage in fresh-produce crate pooling that newer entrants cannot replicate quickly, since grocery supply chain relationships routinely take years to establish, a position smaller industrial-only competitors struggle to match at comparable scale too already now.
IFCO SYSTEMS

Risk: Limited automotive account presence

IFCO's comparatively limited presence in automotive accounts leaves it exposed as industrial pooling, a substantial share of overall category revenue, remains dominated by competitors with deeper manufacturing relationships today, a gap competitors are watching closely for further opportunity to exploit already indeed too now soon.

Players Tracked

Prominent Players

CHEP Pallecon Solutions
IFCO Systems
ORBIS Corporation
Schoeller Allibert
Loscam Limited

Other Key Players

Craemer Group
Rehrig Pacific Company
Polymer Logistics
Georg Utz Holding
Nefab Group
Brambles Limited
Pooling Partners International
Buckhorn Inc
Cabka Group
Monoflo International
Snyder Industries
TranPak Inc
PalletOne Inc
iGPS Logistics
Tosca Services LLC

Recent Developments

NOVEMBER 2025

CHEP announced a network capacity expansion dedicated to grocery and general retail distribution pooling, responding to rising demand from mid-sized retailers converting legacy single-use crates to pooled returnable formats, with new network capacity expected to come online within the following year, per company disclosures soon.
Signal: Signals established operators are scaling to meet mid-market pooling conversion demand faster than new entrants can respond.
JULY 2025

IFCO completed a supply agreement with a major European grocery chain to deploy pooled produce crates across several hundred store locations, extending its presence in the fresh-produce distribution segment ahead of competitors still focused primarily on direct manufacturer accounts, according to company disclosures made public.
Signal: Signals grocery distribution accounts are becoming a key battleground as automotive growth moderates somewhat overall indeed.

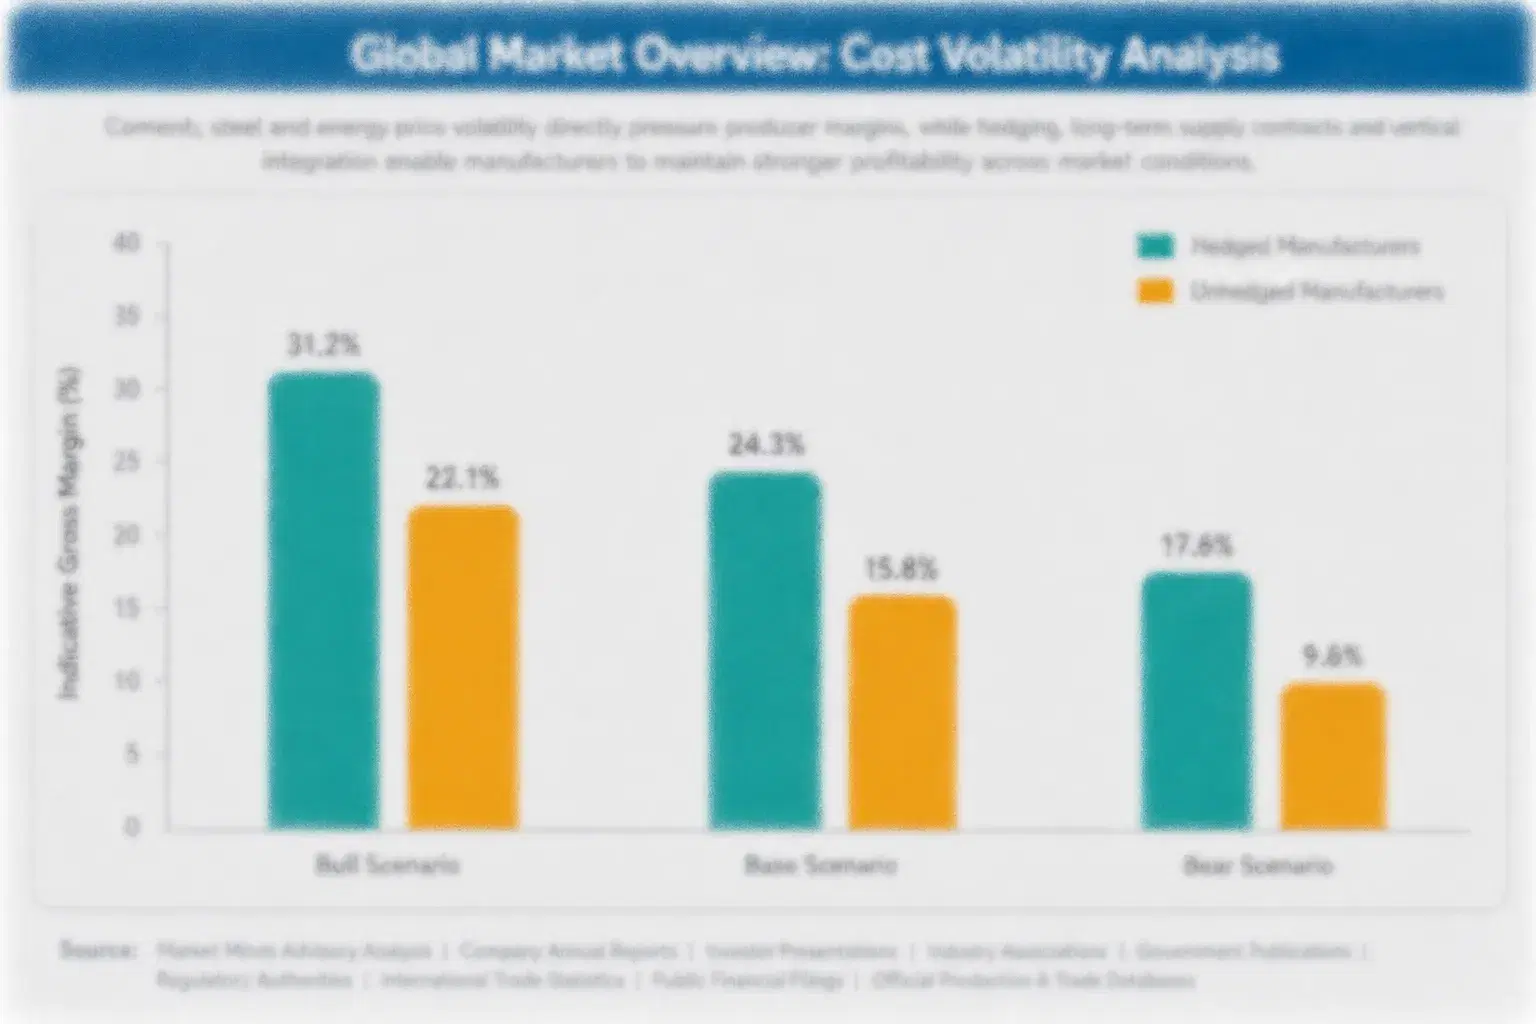
Recycled Resin and Tracking Exposure

Recycled plastic resin and RFID tracking components together account for roughly 46% of unit production cost in returnable packaging, with resin sourced largely through regional recyclers while RFID tracking hardware originates predominantly from a concentrated set of electronics manufacturers, a concentration that gives those suppliers meaningful pricing power over operators operating in competitive bid environments worldwide now too.
A 2025 recycled polypropylene price spike, driven by tightening automotive-grade recycling collection volumes and competing demand from other plastics categories, pushed operator input costs up meaningfully for several months before alternative sourcing stabilized the market, according to EIA commodity tracking and company annual report disclosures from affected operators during the period, illustrating how exposed the category remains to broader recycled-plastics demand dynamics affecting feedstock availability today.

Operators without direct recycled resin sourcing relationships face a lasting cost disadvantage against integrated competitors, since spot-market purchasing carries a persistent premium over long-term supply contracts that only established players can secure. This exposure varies most by operator scale, a dynamic that favors CHEP, IFCO, and other scale players with established multi-supplier relationships over regional shops lacking comparable negotiating position too.
returnable-packaging-market-cost-volatility-analysis-1791530567419

Dual Sourcing Across Resin Suppliers

Operators are qualifying a second recycled resin supplier alongside their primary source to reduce exposure to single-producer disruption, accepting modest cost premiums in exchange for supply continuity assurance across their largest multi-facility accounts. Several mid-tier operators have adopted this approach over the past year specifically, and early results suggest the added cost is more than offset by avoided disruption risk.

Long-Term RFID Component Supply Contracts

Larger operators are negotiating multi-year RFID component supply contracts with built-in price collars that cap input-cost volatility in exchange for committed purchase volumes, a structure smaller regional shops typically cannot access given their limited scale. This structure is becoming increasingly common among the industry's largest operators specifically, giving them a cost-stability advantage that smaller competitors cannot easily replicate.

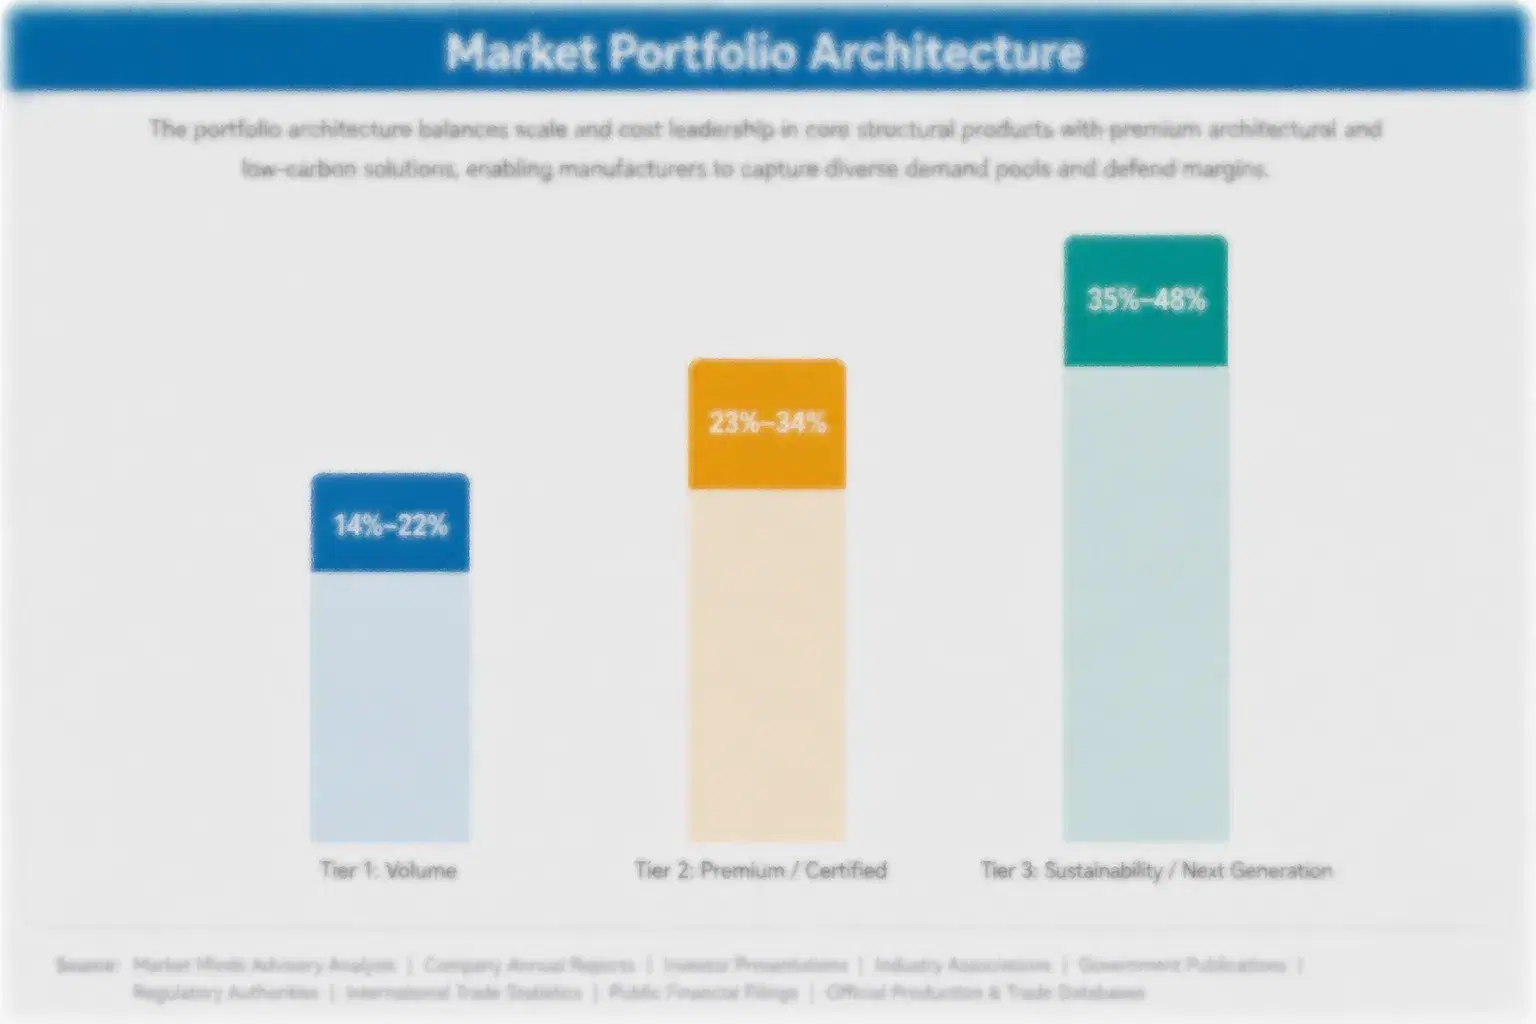
Portfolio Architecture for Margin Defence

Returnable packaging splits into three distinct margin tiers, separated primarily by pooling model and tracking-service attachment rather than asset count alone, with pooled container programs carrying analytics contracts commanding the richest margins across the category. Operators that can operate profitably across all three tiers simultaneously hold an advantage over specialists confined to one pooling model.
Volume commodity-adjacent owned-fleet pallet systems carry the thinnest margins but the largest absolute asset count, while premium pooled formats bundled with shrinkage-analytics and cross-border coordination service command substantially richer margins justified by software integration and ongoing support obligations. The gap between these two tiers has widened over the past two years as pooling adoption accelerates, pushing commodity-tier owned-fleet margins even thinner relative to the premium segment.

High-value pools concentrate most heavily around pooled container programs carrying active analytics and coordination contracts, which command pricing power that ordinary owned-fleet systems cannot match. Operators positioning early in bundled service offerings are capturing disproportionate attention from large manufacturer and grocery accounts. These operators are also best positioned to capture the emerging blockchain-tracking wave, since service infrastructure built for analytics contracts extends naturally to next-generation tracking upgrades.

Owned-fleet returnable pallets and crates sold on a deployment-only basis, competing primarily on fabrication cost and durability rather than tracking sophistication, typically carrying the industry's lowest per-unit margin today now.
Gross Margin

Pooled container formats bundled with shrinkage-analytics and cross-border coordination service, commanding richer margins justified by software integration and support obligations, typically carrying the industry's highest per-unit margin by a wide margin.
Gross Margin

Fully recyclable pooled formats and emerging blockchain-based asset-tracking technologies addressing circularity mandates and expanding regulatory disclosure requirements, representing a smaller but fast-growing margin pool currently, still with limited commercial-scale deployment history to date.
Gross Margin
returnable-packaging-market-portfolio-architecture-1791530567722

High-value Sub-segments and Strategic Watch-out

Shrinkage Analytics Subscription Service Programs

Highest-value, highest-growth category, bundling pooled container deployment with recurring analytics and coordination revenue. Operators with established tracking infrastructure are best positioned to capture this expanding, relatively price-insensitive demand pool over the next several years as analytics adoption practices spread into traditional logistics-focused operator businesses already.

Grocery Retail Pooling Conversion Programs

High-value, moderate-growth category where falling network costs are extending pooling adoption beyond automotive manufacturers. Still early in broad rollout, but offering meaningful pricing power for operators able to demonstrate reliable return-trip performance across diverse retail networks as more mid-sized retailers follow the lead of early-moving national chains nationwide.

Standard Owned Fleet Pallet Programs

Volume core category carrying the largest absolute asset count but thinnest margins. Growth here tracks general industrial demand closely, and competitive intensity is rising as pooled alternatives pressure owned-fleet pricing across every major market at a pace faster than most other watch categories tracked in this report.

Logistics Technology Specialist Entry Programs

Strategic watch-out category where technology specialists could reshape competitive dynamics across every other segment if any secures a flagship manufacturer account. Operators without comparable specialist capability risk losing share in the fastest-growing segment well before mainstream commercial validation is complete industry-wide, a risk operators are now actively monitoring.

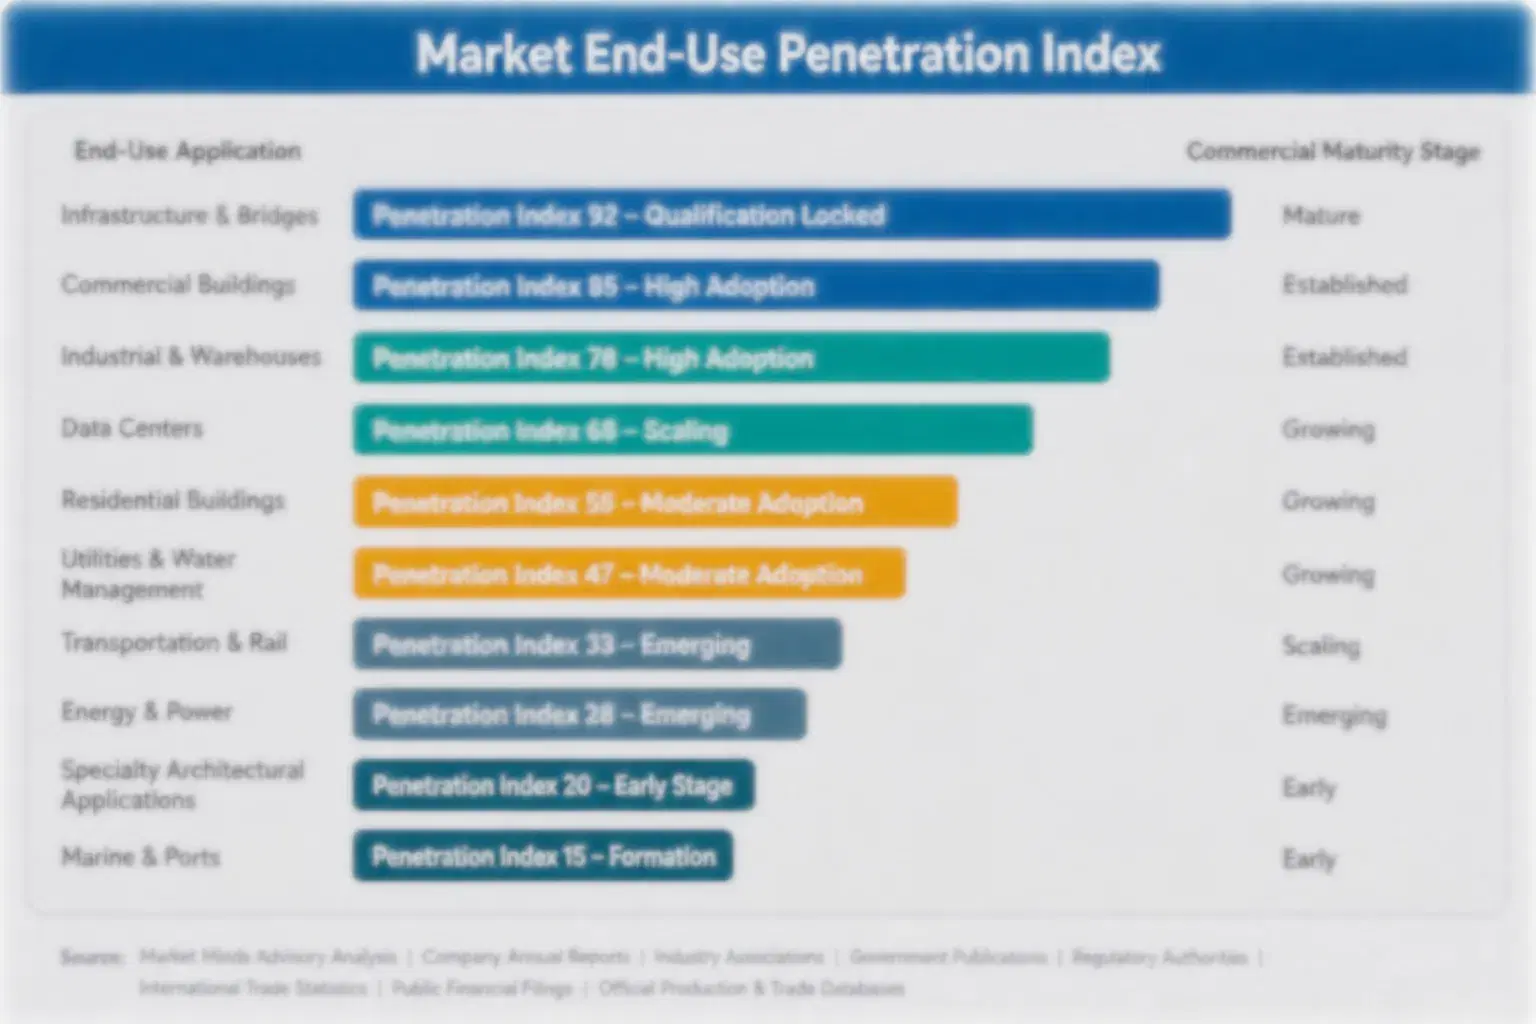
From Owned Asset To Managed Circulation

Returnable packaging is shifting from an owned capital asset toward a managed circulation service that operators track continuously rather than deploy and forget. Manufacturers increasingly renew operator relationships based on documented return-trip reliability and shrinkage-control performance rather than renegotiating rental pricing from scratch each cycle, giving incumbent operators with proven tracking records durable account depth that newer entrants struggle to displace.
Adoption depth varies sharply by end-use vertical. Automotive manufacturers adopt returnable systems with near-total conviction once established, since just-in-time production schedules depend on predictable asset availability, while grocery and general retail distributors adopt more cautiously, often piloting pooled programs on a single product category before expanding across the broader distribution network. This divergence means operators serving both segments need fundamentally different account-management approaches This shift is raising switching costs across the category.

A generational shift is underway among packaging buyers themselves, as sustainability and supply-chain-resilience specialists increasingly drive specification decisions that cost-focused procurement teams once controlled exclusively. These newer buyer profiles weigh shrinkage-rate documentation and circularity more heavily than unit cost alone, a shift that favors operators able to articulate value in resilience terms rather than purely cost terms This trend is expected to continue through the decade.
returnable-packaging-market-end-use-penetration-index-1791530568027

Where Returnable Program Value Concentrates

These are among the four positions where our research anticipates prominent divergence between winners and laggards over the coming forecast period. Each is grounded in the demand model, the regulatory perimeter, and the announced capacity pipeline.
01 / GROCERY POOLING SCALE

Retail Pooling Conversion Rewards Fast Network Scaling

Grocery and general retail pooling conversion is the category's fastest-growing entry point, and retailers are moving quickly from pilot programs to full-network rollout once satisfied with return-trip reliability. Operators that can demonstrate consistent performance at accessible price points are winning disproportionate new contract volume right now. Those still treating pooling as an automotive-only investment risk losing share to faster-moving competitors across entire regional markets soon, a gap that is widening each quarter as more retailers commit to network-wide conversion already.
02 / TRACKING PLATFORM DEPTH

Shrinkage Control Depth Decides Operator Retention

Shrinkage-control tracking depth is becoming a genuine competitive differentiator as manufacturers increasingly require both reliable return performance and transparent loss reporting from a single vendor. Operators with established RFID platforms complete integrations faster than competitors lacking comparable tracking depth, a gap that compounds at the largest multi-facility accounts. Operators without existing tracking capability should prioritize partnership with analytics vendors before pursuing large accounts directly, building a track record before pursuing the largest and most complex multi-facility contracts now already too.
03 / RESIN SUPPLY ACCESS

Recycled Resin Sourcing Determines Cost Competitiveness

Operators without direct recycled resin sourcing relationships face a lasting cost disadvantage that spot-market purchasing cannot fully offset. Dual sourcing and long-term supply contracts with price collars are becoming standard practice among the industry's largest players specifically, protecting them from single-producer disruption. Smaller operators lacking negotiating scale should pursue consortium-based purchasing to access similar terms within their regional markets now, pooling volume to secure terms none could negotiate independently on their own across their regional markets already too now soon.
04 / SERVICE REVENUE EXPANSION

Analytics Subscriptions Extend Operator Margin Capture

Shrinkage-analytics subscriptions and cross-border coordination services are opening recurring revenue paths beyond the physical asset rental itself, a meaningful shift for a category historically priced on one-time deployment cost alone. Operators building these service capabilities now are positioning for margin profiles closer to software vendors than traditional logistics suppliers. This shift favors scale players with existing manufacturer data relationships already in place today, an advantage that will compound as more manufacturers standardize shrinkage-reporting platform requirements today too already too now.

Engagement Snapshot From the Field

A live engagement with an industry participant carrying material or product regulatory and market exposure ahead of a defining policy shift, showing how our research translates into a defensible multi-year portfolio strategy.
MARKET MINDS ADVISORY · CLIENT ENGAGEMENT SUMMARY
Returnable Packaging Producer Strategic Portfolio Review and Transition Roadmap 2026·Investment Scenario on Returnable Packaging Exposure Evaluation 2025-26
CLIENT PROFILE
The client operates a regional grocery distribution network with multiple warehouses across the northeastern United States, generating annual produce shipment volume in the tens of millions of units (client-reported, unverified by MMA). Facing rising single-use packaging costs and a corporate sustainability mandate, the client sought to evaluate pooled returnable crate conversion ahead of a broader distribution network overhaul.
STRATEGIC CHALLENGE
Leadership needed to determine whether pooled returnable crates could deliver sufficient cost savings and damage reduction to justify the operational change relative to continued single-use corrugated reliance, while also confirming return-trip logistics across multiple warehouse locations without disrupting ongoing distribution commitments, given that leadership had already committed meaningful capital budget toward the broader distribution overhaul ahead of the pilot.
MMA APPROACH
MMA's team structured a five-month pilot assessment across two warehouse locations, combining shrinkage-tracking data with structured cost-comparison analysis across the client's highest-volume produce categories. The engagement drew on MMA's primary survey dataset for comparable category benchmarks and incorporated direct interviews with the client's logistics team overseeing the conversion rollout, supplemented by a review of comparable rollout data from other regional grocery distributors tracked in MMA's.
KEY FINDINGS
  1. Pilot warehouses recorded a measurable reduction in produce damage incidents versus matched control shipments over the assessment period (client-reported, unverified by MMA).
  2. Crate shrinkage rates varied by route, with the shortest delivery routes showing the lowest overall loss percentage, confirming the logistics team's core routing assumption held.
  3. Per-trip packaging cost declined notably, exceeding the savings the client's finance team had projected ahead of the pilot launch, strengthening the broader business case internally.
  4. Logistics staff reported straightforward return-tracking integration, requiring minimal retraining across the pilot warehouse workforce, easing internal concerns about operational feasibility at scale across the network.
CLIENT PROFILE
The client operates a regional grocery distribution network with multiple warehouses across the northeastern United States, generating annual produce shipment volume in the tens of millions of units (client-reported, unverified by MMA). Facing rising single-use packaging costs and a corporate sustainability mandate, the client sought to evaluate pooled returnable crate conversion ahead of a broader distribution network overhaul.
STRATEGIC CHALLENGE
Leadership needed to determine whether pooled returnable crates could deliver sufficient cost savings and damage reduction to justify the operational change relative to continued single-use corrugated reliance, while also confirming return-trip logistics across multiple warehouse locations without disrupting ongoing distribution commitments, given that leadership had already committed meaningful capital budget toward the broader distribution overhaul ahead of the pilot.
MMA APPROACH
MMA's team structured a five-month pilot assessment across two warehouse locations, combining shrinkage-tracking data with structured cost-comparison analysis across the client's highest-volume produce categories. The engagement drew on MMA's primary survey dataset for comparable category benchmarks and incorporated direct interviews with the client's logistics team overseeing the conversion rollout, supplemented by a review of comparable rollout data from other regional grocery distributors tracked in MMA's.
KEY FINDINGS
  1. Pilot warehouses recorded a measurable reduction in produce damage incidents versus matched control shipments over the assessment period (client-reported, unverified by MMA).
  2. Crate shrinkage rates varied by route, with the shortest delivery routes showing the lowest overall loss percentage, confirming the logistics team's core routing assumption held.
  3. Per-trip packaging cost declined notably, exceeding the savings the client's finance team had projected ahead of the pilot launch, strengthening the broader business case internally.
  4. Logistics staff reported straightforward return-tracking integration, requiring minimal retraining across the pilot warehouse workforce, easing internal concerns about operational feasibility at scale across the network.
RECOMMENDED STRATEGY
Phase 1: Sequence the full-network rollout by route length, starting with the shortest routes to minimize early shrinkage exposure, validating performance across the client's full warehouse network and shift schedule. Phase 2: Negotiate a multi-year recycled resin supply agreement with price protection ahead of broader rollout to secure favorable economics, protecting margin as conversion volume scales across the full network. Phase 3: Layer in shrinkage-rate reporting as a value-added service for logistics leadership once conversion volume justifies the investment, creating a recurring revenue stream the client had not previously considered.
OUTCOME
The client approved a phased full-network conversion sequenced by route length and began supplier negotiations for a multi-year recycled resin supply agreement (client-reported, unverified by MMA). Logistics leadership reported improved confidence in forecasting conversion timelines, supporting a broader business case for accelerated rollout within the following fiscal year.

Frequently Asked Questions

Foundational context covering the market sizes, CAGR, scope, country, region and competition that inform every finding below. This section is provided to cover basics and most often pre-purchase conversations, answered from the MMA Primary Research Dataset.

What is the current size of the Returnable Packaging Market?

The market reached an estimated USD 5.11 billion in 2026, covering reusable pallets, crates, and containers within closed-loop and pooled distribution systems. Growth is concentrated in Western European industrial pooling density.

How large will the Returnable Packaging Market be by 2036?

MMA projects the market will reach approximately USD 9.5 billion by 2036, roughly 1.86 times its 2026 value, driven by pooling conversion expanding beyond automotive into retail distribution.

What is the CAGR for the Returnable Packaging Market 2026 to 2036?

The market is forecast to grow at a 6.4% compound annual rate through 2036, with bull and bear scenarios ranging from 5.1% to 7.7% depending on single-use ban timing.

Which segment is growing fastest?

Pooled Returnable Container Programs are growing fastest at a 9.1% CAGR, roughly 1.42 times the overall market rate, led by third-party pooling network expansion, well ahead of every other segment tracked.

Who are the major companies in the Returnable Packaging Market?

Leading suppliers include CHEP Pallecon Solutions, IFCO Systems, ORBIS Corporation, Schoeller Allibert, and Loscam Limited, together holding roughly 28% of global revenue, evaluated on a global revenue basis.

Which country is growing fastest?

Germany is growing fastest at an 8.2% CAGR, driven by its dominant industrial pooling network density and established automotive closed-loop supply chain practices, ahead of every other national market tracked in this report.

How the Returnable Packaging Market Is Segmented

The full report scope spans multiple orthogonal segmentation dimensions, with cross-tabulated demand data provided for each dimension pair. Coverage extends further to regional breakdowns, trend trajectories, and the competitive detail needed to support segment-level decision-making.
  • Pooled Returnable Container Programs
  • Owned Fleet Returnable Pallet Systems
  • Returnable Crate Systems
  • Reusable Industrial Dunnage
  • Hybrid Pooled Owned Combination Systems
  • Automotive Manufacturing
  • Grocery and Retail Distribution
  • Industrial and Heavy Machinery
  • Electronics Manufacturing
  • Pharmaceutical Distribution
  • Third Party Pooling Programs
  • Owned Fleet Deployment Programs
  • Analytics Subscription Service Contracts
  • Cross Border Coordination Agreements

By Region

  • North America
  • Western Europe
  • East Asia
  • South Asia and Pacific
  • Latin America
  • Middle East and Africa
  • Eastern Europe

Scope, Methodology, and Coverage

Every figure in this report is reproducible from documented input assumptions. The scope below maps the historical period, the forecast horizon, the segmentation dimensions, and the countries covered, alongside the underlying primary and qualitative methodology.
Historical Period
2020 to 2025
Forecast Period
2026 to 2036
Base Year
2025 (USD billions; MMA Primary Research Dataset, October 2026)
Market Definition
The Returnable Packaging Market covers reusable pallets, crates, containers, and dunnage designed for multiple trip cycles within closed-loop or pooled distribution systems, including both owned and third-party pooling programs. It excludes single-use corrugated and plastic transport packaging, consumer-facing reusable bags and totes, and standard warehouse racking or storage infrastructure not designed for repeated transport cycles.
Quantitative Units
USD billions
Segmentation Dimensions
Regions Covered
North America, Western Europe, East Asia, South Asia and Pacific, Latin America, Middle East and Africa, Eastern Europe
Countries Covered
Key Companies Profiled
CHEP Pallecon Solutions, IFCO Systems, ORBIS Corporation, Schoeller Allibert, Loscam Limited, Craemer Group, Rehrig Pacific Company, Polymer Logistics, Georg Utz Holding, Nefab Group, Brambles Limited, Pooling Partners International, Buckhorn Inc, Cabka Group, Monoflo International, Snyder Industries, TranPak Inc, PalletOne Inc, iGPS Logistics, Tosca Services LLC
Quantitative Methodology
Primary survey, n=3,800 respondents, Q4 2025, six countries; demand-side model with trade association cross-validation
Qualitative Methodology
47 expert interviews, Q4 2025; applied to validate demand model assumptions, identify emerging dynamics, and assess competitive positioning
Report Format
PDF and XLSX data workbook (Word format preview document)
Publisher
Market Minds Advisory
Report Code
MMA-2026-PAC-703
Published
October 2026
Contact
sales@marketmindsadvisory.com | www.marketmindsadvisory.com

Purchase the full Returnable Packaging Market Report (2026 to 2036).

This report provides a comprehensive assessment of the Returnable Packaging Market through 2036. It covers pooled container programs, owned-fleet pallet systems, and reusable dunnage across automotive, industrial, and retail distribution categories. The analysis details regional demand patterns, competitive positioning among established pooling operators, and input-cost exposure tied to recycled resin and tracking component supply concentration. It draws on primary survey data, expert interviews, and company disclosures to quantify segment-level growth and margin architecture across the forecast period. Forecasts reflect both base-case and scenario-adjusted bull and bear trajectories through 2036.
Ten-year revenue and unit volume forecasts
Seven-region demand share and CAGR breakdown
Twenty-company competitive benchmarking and positioning profile
Segment-level CAGR and margin tier analysis
Input-cost exposure mapping and mitigation pathways
Anonymized client case study with full strategy roadmap

Built For The People Who Decide

From boardroom strategy to bench-side execution, this report is read cover-to-cover by leaders shaping the next decade of their industry, turning demand scenarios, market dynamics and valuation benchmarks into decisions.
CXOs/ Presidents/ VPs/ Managers
M&A and Corporate Development
Strategy Teams and R&D Heads
Procurement and Product Directors
Regulatory and Compliance Leaders
Investor Relations and Equity Analysts