Market Minds Advisory
Respiratory Devices Market

Respiratory Devices Market: A Masks And Tubes Business In Capital Equipment Costume

The device lasts five years and the mask lasts three months. Roughly sixty percent of revenue here is consumables, and everything competitive is about placing the platform that locks the interface in.

Lead Analyst

Alice Ballenger

Published

September 2026

Make Smarter Decisions with Customized Research Insights

Request a free sample report and evaluate market opportunities, growth trends, and competitive dynamics relevant to your business needs.

2025 MARKET VALUE$24.5BMarket Size 2025
2036 FORECAST VALUE$50.5BBase Case , 2026 to 2036
CAGR 2026 TO 20366.8 %Bull 8.0% / Bear 5.6%
INCREMENTAL OPPORTUNITY$24.4BNet 10- year value creation
EXPANSION MULTIPLE1.93x2036 value over 2026 base
Strategic Levers
M&A Pipeline
Regional Outlook
Country Rankings
Competitive Intelligence
Segmental Deep-dive
Call-Us : 91 93563 13602

Executive Snapshot and Market Trajectory

This looks like a capital equipment market and behaves like a consumables one. A home therapy platform runs for five years while its mask is replaced every three months, and roughly 60% of sector revenue comes from interfaces, circuits, and cannulae rather than from devices.
The market reaches USD 24.5 billion in 2025 and compounds at 6.8% to USD 50.52 billion by 2036, an expansion multiple of 1.93 times. Home non-invasive ventilation grows fastest at 10.2%, exactly 1.50 times the market rate. North America holds 29% of value on sleep apnoea reimbursement and diagnosis rates, while South Asia and Pacific takes 15%, above this framework's band, on chronic respiratory burden where penetration sits far below Western levels even now.
Concentration sits at 44% across the top five, and interface fit rather than device engineering decides most of it. The binding constraint on the largest therapy category is diagnosis, since obstructive sleep apnoea affects an enormous population and only around 18% have ever been formally identified. Home sleep testing rather than any device improvement is what opens that population up, and manufacturers funding that testing outgrow those funding promotion.
Market Definition
The respiratory devices market covers therapeutic and monitoring equipment for respiratory conditions together with the dedicated consumables supplied for it, spanning home non-invasive ventilation systems, sleep apnoea therapy devices and interfaces, oxygen therapy and concentrator systems, nebulisation and aerosol delivery devices, critical care ventilators, and respiratory monitoring and diagnostic devices. Inhaled medicines and drug-device combination inhalers, anaesthesia delivery systems, general patient monitoring, extracorporeal oxygenation, and medical gas supply infrastructure are excluded.
Base Year Value
$24.5B in 2025 (MMA Primary Research Dataset, August 2026)
Forecast Period
2026 to 2036, eleven discrete annual values
CAGR
6.8% base case. Bull 8.0%. Bear 5.6%.
Fastest Growth Segment
Home Non-Invasive Ventilation Systems: 10.2% CAGR
Fastest Growth Country
India: 10.4% CAGR
Fastest Growth Region
South Asia and Pacific: 8.9% CAGR
Largest Region
North America: 29% of 2025 global value
Market Leaders
ResMed, Philips, Fisher and Paykel Healthcare, Medtronic, Drager. Source: MMA Primary Research Dataset, July 2026.
Primary Survey
n=3,800 procurement and R&D decision-makers, Q4 2025, six countries
Methodology
Demand-side build-up, cross-validated against public data, 47 expert interviews

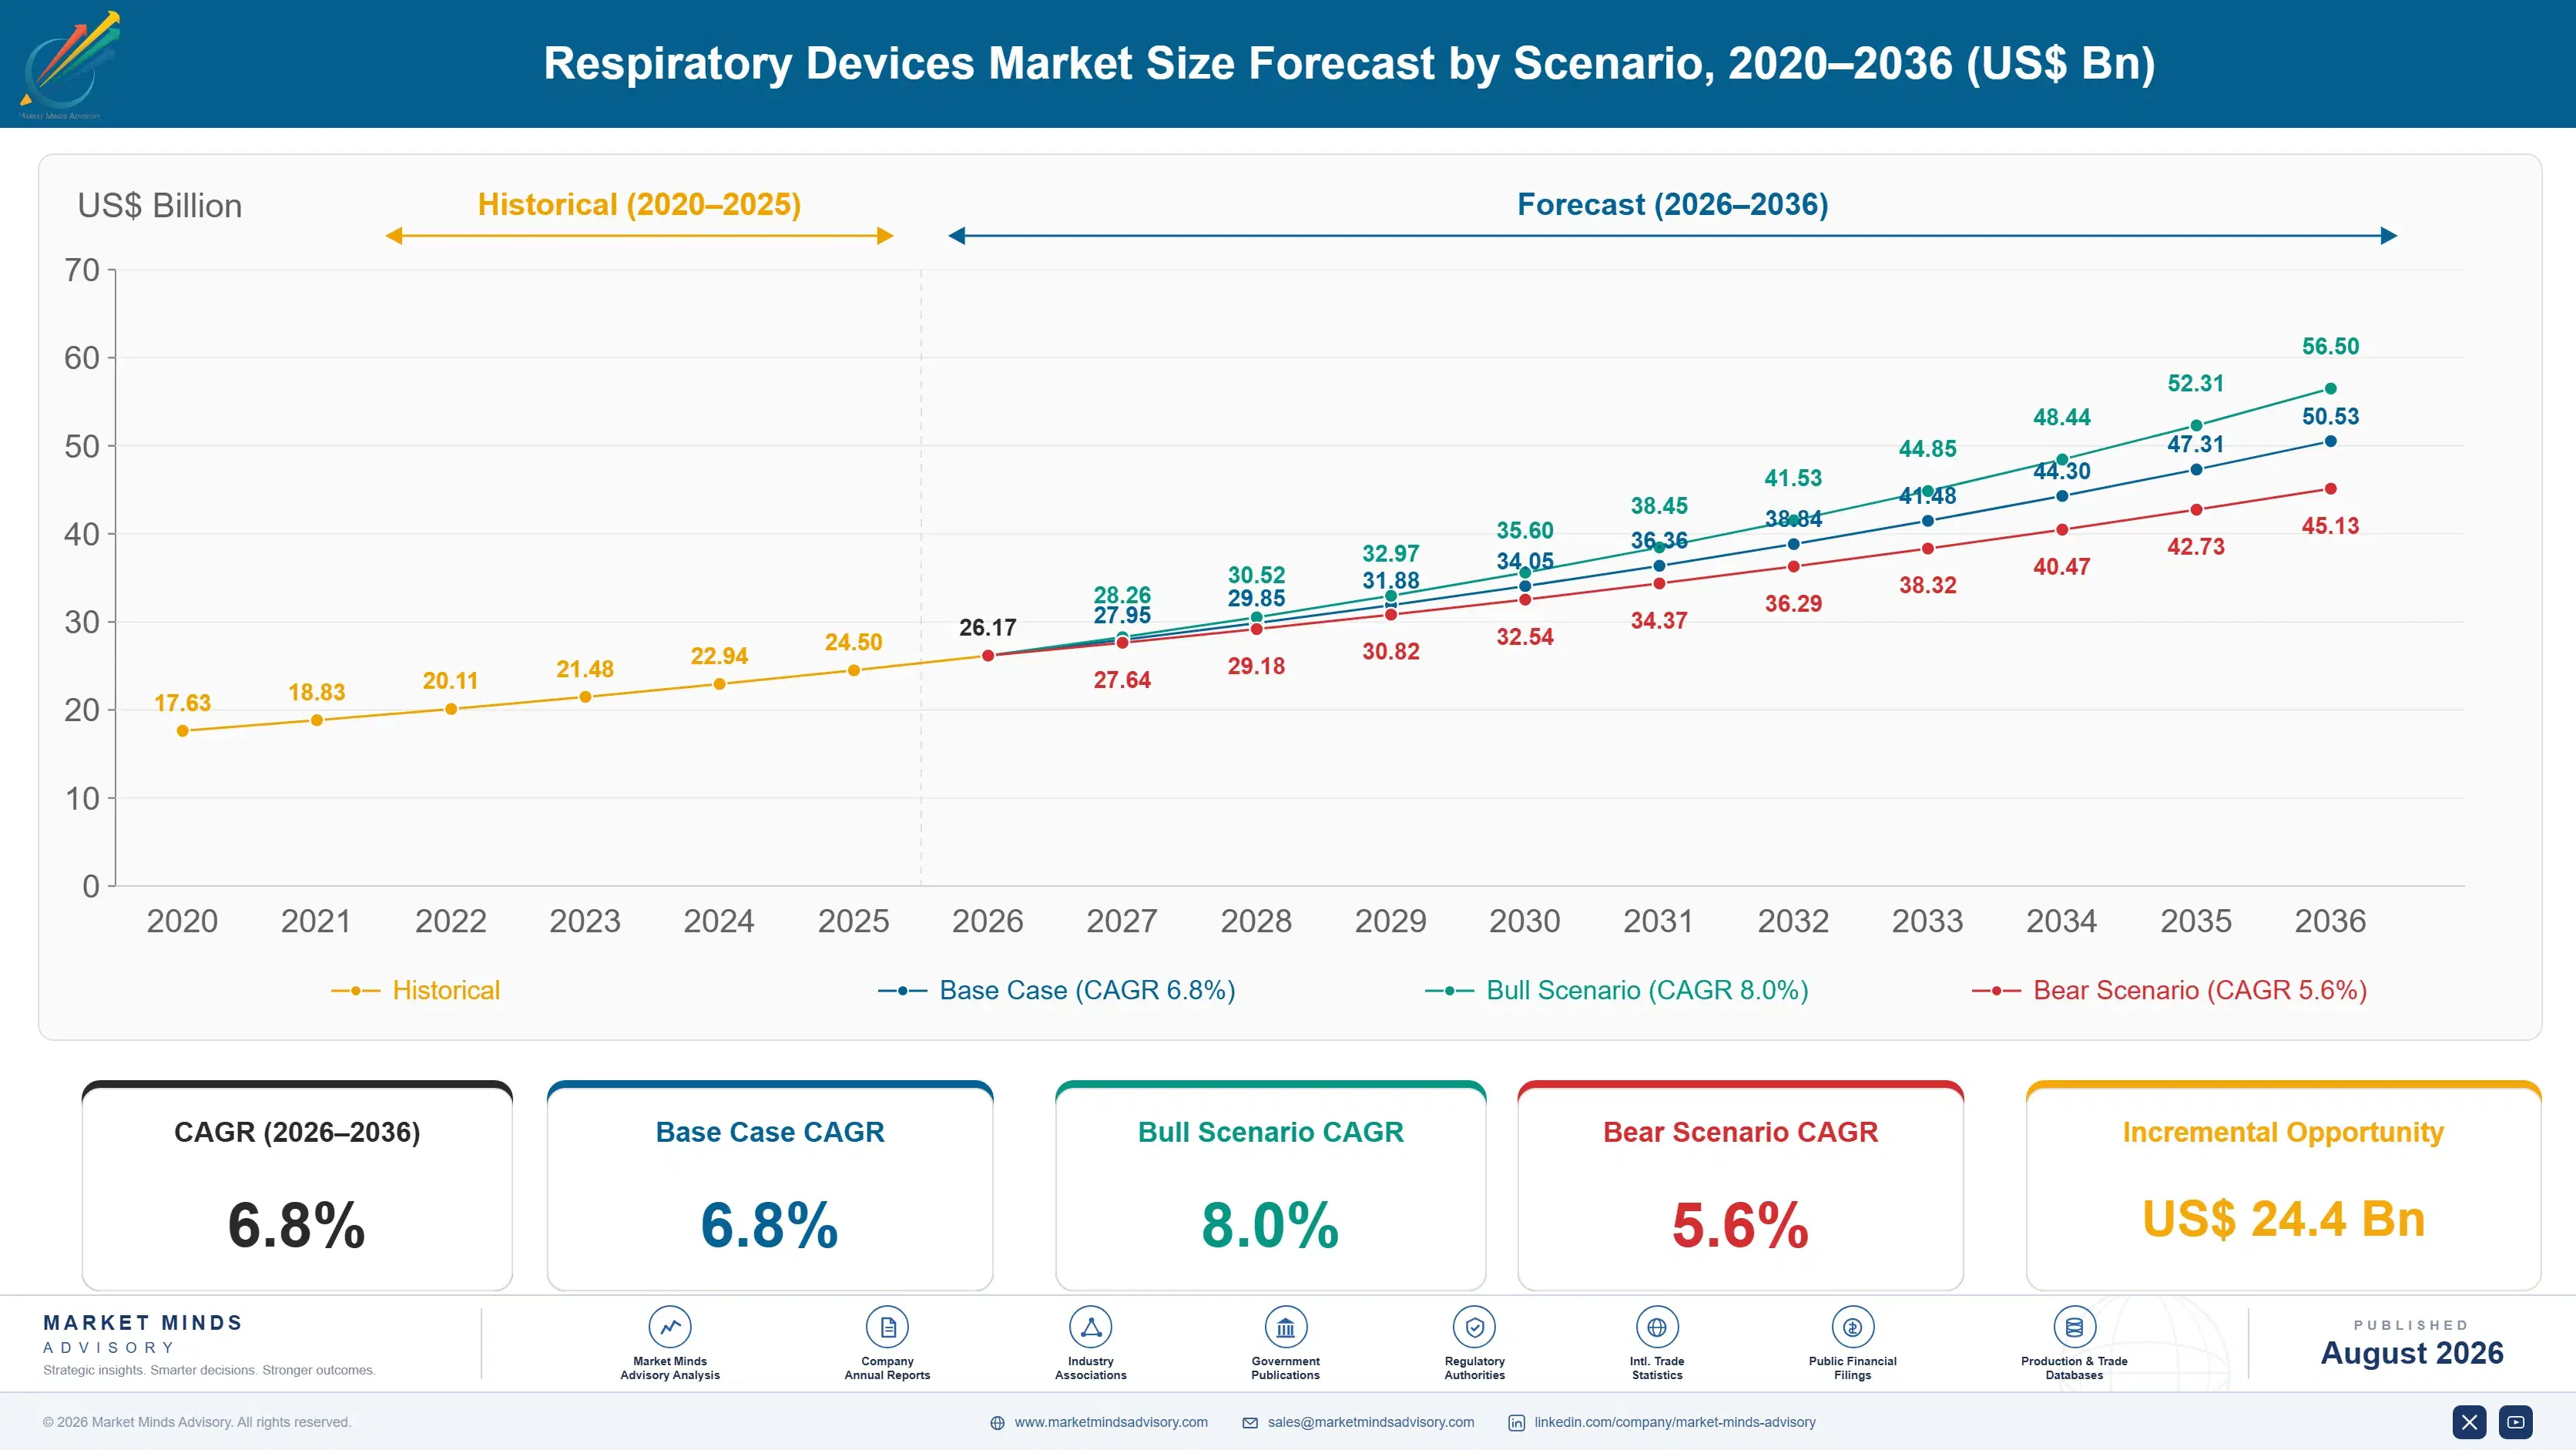
Respiratory Devices Market Forecast Scenarios

respiratory-devices-market-size-forecast-scenario-1787298739831
The 2020 to 2025 period contained two unrelated shocks that shaped the whole sector. Critical care ventilator demand spiked absurdly through 2020 and then collapsed into a decade of surplus inventory, while a foam degradation recall removed one of the two largest sleep apnoea suppliers for years. A 5.7% historical CAGR averages a ventilator boom and bust against a permanent transfer of installed base.
Three mechanisms carry the 6.8% base case. Home ventilation growth is the largest of the three, as chronic obstructive pulmonary disease management shifts out of hospital wards and into domiciliary care. Sleep apnoea diagnosis expansion is the second, driven by home testing replacing laboratory polysomnography. And Asian chronic respiratory burden is the third, where prevalence is enormous, penetration is very low, and domestic manufacturers have finally made home therapy affordable.
The 8.0% bull case rests on home sleep testing and screening reaching primary care at scale, which would lift diagnosis from around 18% and put a platform in front of a population several times the treated base. The 5.6% bear case is reimbursement tightening on consumables, since replacement schedules rather than clinical need drive much of the recurring revenue and payers have begun examining that.

The Interface Is The Business

Nearly everything commercially interesting in this sector happens after the device is placed. A home therapy platform costs several hundred dollars and lasts five years; the mask fitted to a patient's face is replaced quarterly, the cushion more often than that, and the circuit and filters on their own schedules. Roughly 60% of revenue arrives that way, which makes device placement a customer acquisition exercise rather than a sale.
TOP FIVE CONCENTRATION44%Interface consumables rather than devices decide supplier position
CONSUMABLES REVENUE SHARE60%Portion of sector revenue from masks, circuits and cannulae
MASK REPLACEMENT INTERVAL3 monthsRecommended period between interface replacements for therapy users
DIAGNOSIS RATE18%Share of affected adults formally diagnosed with sleep apnoea
DEVICE SERVICE LIFE5 yearsWorking life of a home therapy platform before replacement
FIRST YEAR ADHERENCE62%Proportion of users still on therapy twelve months later
Interface fit is also what actually retains a patient. Therapy adherence sits near 62% at twelve months, and the dominant reason people abandon treatment is a mask that leaks, presses, or wakes them rather than any problem with the device driving it. A supplier whose interface a patient tolerates keeps that patient and the quarterly replacement revenue for years. Engineering effort in this sector is therefore concentrated on silicone and headgear.
The largest therapy category is gated by diagnosis rather than by anything the industry controls. Obstructive sleep apnoea affects a very large adult population worldwide and only around 18% have been formally diagnosed, because laboratory polysomnography is scarce, slow, and unpleasant. Home testing changes that arithmetic, which is why diagnostic access governs how this market grows.
"Manufacturers show me pressure algorithms and humidification curves. The patient stopped using the machine because the mask left a mark on the bridge of her nose, and no algorithm in the world fixes that."
Director, Respiratory And Home Care Devices Practice · MMA Medical Devices Pract

Market Trends

Home Sleep Testing Unblocks The Diagnosis Bottleneck

Laboratory polysomnography requires an overnight stay in a sleep unit, waiting lists run to months in most health systems, and only around 18% of affected adults have ever been diagnosed as a direct result. Home sleep apnoea testing removes the bed, the waiting list, and most of the cost, and it is now reimbursed across many markets for uncomplicated cases. Every diagnosis it produces is a therapy platform placed and a decade of interface replacement behind it, which is why device manufacturers fund testing access so willingly, Primary care ordering rather than specialist referral is the current frontier.
Market Impact: Penetration below 10% of patients

Chronic Disease Management Moves Into Domiciliary Care

Non-invasive ventilation for chronic obstructive pulmonary disease has accumulated genuine evidence for reducing readmission and mortality in hypercapnic patients, and health systems facing bed pressure have every reason to act on it. That moves ventilation out of hospitals and into homes, where the device is placed once and the circuit, mask, and filter consumables recur indefinitely. Home care providers rather than hospital procurement become the buyer, which is a different sale entirely and one many manufacturers still handle badly, Provider consolidation means one agreement can now cover tens of thousands of placements.
Market Impact: Adherence stalls at 62% currently

Market Opportunities and Growth Drivers

Asian Chronic Respiratory Burden Dwarfs Device Penetration

Chronic obstructive pulmonary disease prevalence across China and India is the highest anywhere in the world, driven by smoking, household air pollution, and ambient particulates in combination, and home oxygen and ventilation penetration remains a small fraction of Western levels. Domestic manufacturers including Yuwell, BMC, and Micomme supply devices at prices imported equipment cannot approach, which is what has finally made home therapy reachable for the patient populations that need it most, Eligible patient numbers across both countries exceed anything in the Western world, and penetration has decades of room ahead.
Market Impact: 60% of revenue is exposed

Interface Innovation Retains Patients Better Than Algorithms

Therapy adherence sits near 62% at twelve months and the overwhelming reason for abandonment is interface discomfort rather than any dissatisfaction with the device. Minimal-contact masks, memory foam and gel cushions, and improved headgear all measurably improve continuation, and every retained patient represents years of quarterly replacement revenue. That makes silicone moulding and human factors engineering more commercially valuable in this sector than pressure algorithm development has ever been, Smaller specialists have repeatedly beaten far larger competitors on exactly this ground, which tells you where the differentiation actually lies and human factors work matters here.
Market Impact: Surplus lasts beyond 8 years

Market Restraints and Challenges

Payers Are Examining Consumable Replacement Schedules

Recommended replacement intervals for masks, cushions, tubing, and filters were set by manufacturers rather than by clinical evidence, and roughly 60% of sector revenue depends on them being followed. The root cause is that nobody has ever run a trial comparing quarterly against six-monthly mask replacement on outcomes. Commercially this leaves the largest revenue line exposed to a payer decision nobody can defend with data. Participants are mitigating through adherence evidence linking interface condition to continuation, through direct-to-patient supply, and through markets without prescriptive schedules, No trial has ever compared quarterly against longer intervals on patient outcomes.
Market Impact: Diagnosis reaches only 18% today

Ventilator Surplus Persists Across Global Installed Base

Emergency procurement through 2020 placed enormous numbers of critical care ventilators into health systems that have used very few of them since, and the resulting installed base will not need replacing for years. The root cause is straightforward: demand was forecast from an event rather than from a trend. Commercially this has removed a whole category from meaningful growth for most of this decade. Mitigation runs toward consumables and service on that installed base, toward transport and home formats, and toward emerging market first-time buyers, Service and circuit revenue on that base is the only realistic opportunity left.
Market Impact: Devices placed once per 5 years
3 additional market trends, 4 additional growth drivers, and 2 additional restraints and challenges are covered in the full report. Contact sales@marketmindsadvisory.com to access the complete intelligence.

Segment CAGR and Growth Architecture

Segmentation follows device function, because function determines the care setting a product serves, the consumables attached to it, who buys and reimburses it, and how long the platform stays in place before replacement. Patient condition, distribution route, and ownership model are handled in the framework rather than here, and none of them changes which consumables the platform then consumes.
respiratory-devices-market-market-share-analysis-1787298740380

Home Non-Invasive Ventilation Systems

Home non-invasive ventilation grows fastest at 10.2%, exactly 1.50 times the market rate, carrying chronic obstructive pulmonary disease and neuromuscular patients who would previously have been managed in hospital or not at all. Evidence for reduced readmission and mortality in hypercapnic patients has accumulated to the point where health systems facing bed pressure act on it readily. The device is placed once and circuits, masks, and filters recur indefinitely afterwards. Home care providers rather than hospital procurement make the buying decision, which many manufacturers still handle poorly, Consumable revenue on a placed patient comfortably exceeds the device value within two years, which is the whole commercial logic, Evidence for reduced readmission in hypercapnic patients is now well established.
CAGR 10.2%

Sleep Apnoea Therapy Devices And Interfaces

Sleep apnoea therapy grows at 8.4% and remains the largest single category in this market by a comfortable margin, combining positive airway pressure platforms with the masks, cushions, and headgear replaced on quarterly cycles. Interface fit rather than device performance decides whether a patient continues therapy, and adherence near 62% at twelve months means a substantial share of placed devices stop generating consumable revenue. Diagnosis rather than device supply is the growth constraint, since only around 18% of affected adults have ever been formally identified, Home testing reimbursement is therefore worth more to this segment than any product development, Payer adherence documentation requirements also shape which platforms providers place, and connectivity has become effectively mandatory.
CAGR 8.4%
Full segment breakdown across 6 segments available in the complete report.

Regional Architecture and Country Demand Map

Regional value here reflects reimbursement and diagnosis rates far more than it reflects respiratory disease burden. The regions carrying the heaviest chronic respiratory load are not the ones spending most, and one sits outside this framework's bands as a direct result, and prevalence figures mislead badly when read alone.

North America

North America holds 29% of value, the largest share of any region, on sleep apnoea diagnosis and reimbursement rather than on any excess of respiratory disease. Positive airway pressure therapy is reimbursed with documented adherence requirements that also generate the compliance data manufacturers use commercially. Home oxygen is a substantial reimbursed category with its own network of durable medical equipment suppliers. Consumable replacement schedules are followed more consistently here than anywhere else. Growth at 5.8% trails the global rate on an already well penetrated and maturing therapy base, Home care and durable medical equipment providers hold the patient relationship throughout, Payer adherence documentation requirements shape platform selection considerably, Sleep testing capacity remains a genuine constraint even here.
Share: 29% | CAGR: 5.8% (2026 to 2036)

East Asia

Twenty-four percent of value sits in East Asia, where chronic obstructive pulmonary disease prevalence in China is the highest recorded anywhere and home therapy penetration remains a fraction of Western levels. Domestic manufacturers including Yuwell, BMC, and Micomme supply oxygen concentrators and ventilation devices at prices imported equipment cannot approach, which is what has made home therapy reachable at all. Japanese and Korean sleep apnoea diagnosis and reimbursement follow Western convention closely. Growth at 7.6% exceeds the global rate on penetration rather than pricing, Chinese eligible patient numbers exceed anything in the Western world combined, and penetration remains extremely low, Home oxygen concentrator volumes across China are already very large indeed.
Share: 24% | CAGR: 7.6% (2026 to 2036)
Regional intelligence for 5 additional markets available in the complete report: Western Europe, South Asia and Pacific, Latin America, Middle East and Africa, Eastern Europe. Contact sales@marketmindsadvisory.com.
respiratory-devices-market-country-cagr-analysis-1787298740900

Placing Platforms And Selling Interfaces

Device placement is customer acquisition and interfaces are the actual business, so every lever here either creates more placements or keeps the patient attached to one already made. Diagnostic funding, interface engineering, adherence infrastructure, and provider channel work each do exactly that, Four levers follow, and none of them concerns the device itself at all.

Fund Diagnostic Access Rather Than Device Promotion

Only around 18% of adults with obstructive sleep apnoea have ever been diagnosed, and every diagnosis produces a therapy platform placement plus roughly a decade of quarterly interface replacement behind it. Sponsoring home sleep testing access at primary care and referral level costs USD 90 to USD 160 per patient tested and produces far more placements than any promotional programme aimed at already diagnosed patients. Manufacturers who fund testing consistently outgrow those who fund advertising, Primary care ordering rather than specialist referral is where the remaining capacity sits, and it costs far less than advertising to already diagnosed patients.
Market Impact: Testing costs USD 90 to 160 for each patient

Engineer The Mask, Not The Pressure Algorithm

Therapy adherence sits near 62% at twelve months and interface discomfort rather than device dissatisfaction causes almost all abandonment, which means every point of adherence gained is years of consumable revenue retained. Minimal-contact designs, memory foam cushions, and improved headgear measurably improve continuation. Development spend on silicone moulding and human factors returns considerably more here than pressure algorithm work, and it is where the smaller specialists have repeatedly beaten larger competitors, Every point of adherence retained is years of quarterly consumable revenue preserved, which no algorithm improvement delivers, Owning the tooling protects both the margin and the preference itself.
Market Impact: Adherence currently sits near 62% at year one

Build Adherence Monitoring Into The Reimbursement Loop

Payers requiring documented adherence for continued reimbursement created an infrastructure need that manufacturers can own, and the same connectivity supporting compliance reporting also flags patients drifting toward abandonment early enough to intervene. Automated coaching and interface troubleshooting triggered by usage data lift twelve month continuation by 8 to 14 points. That protects the consumable stream directly and makes the platform considerably harder for a competitor to displace later, Payers requiring documented adherence created the infrastructure need in the first place, which manufacturers can own outright, It also makes the platform considerably harder for a competitor to displace later.
Market Impact: Lifts continuation by 8 to 14 percentage points

Sell Through Home Care Providers Rather Than Hospitals

Home ventilation and oxygen reach patients through durable medical equipment and home care organisations that hold the patient relationship, manage the consumable supply, and decide which platform gets placed. Hospital procurement barely features in the decision at all. Provider consolidation means a single agreement can cover tens of thousands of placements, and manufacturers still organised around hospital selling consistently lose those agreements to competitors who understood the channel, A single provider agreement can now cover 30,000 placements or more, Manufacturers still organised around hospital selling lose these agreements consistently, and rarely understand why.
Market Impact: A single agreement can cover 30,000 patient placements

Who Controls the Margin Pool

Concentration at 44% across the top five reflects interface positions and provider relationships rather than any device technology advantage. All participants here are compared on measured global revenue from respiratory devices and their dedicated consumables, which requires separating that line from wider hospital equipment and monitoring businesses inside the diversified medical technology groups that report at a much higher level.
Competition runs on interface fit and channel access rather than on device specification. ResMed and Philips hold the sleep apnoea positions, with the balance between them reshaped permanently by a recall rather than by any competitive action. Fisher and Paykel competes strongly on interface and humidification across both home and hospital settings. Medtronic and Drager hold critical care ventilation positions in a category with little growth left this decade.

Pressure is building from Asian manufacturers and from payer scrutiny simultaneously. Yuwell, BMC, and Micomme supply home therapy devices at prices Western manufacturers cannot approach and are exporting beyond their domestic markets. Rankings shift on provider network agreements and on interface preference, since a patient refitted to a competitor's mask very rarely returns to the original supplier afterwards.
respiratory-devices-market-company-positioning-matrix-1787298741421

Competitive Moat and Risk Dimensions

RESMED

Moat: Interface Preference And Adherence Infrastructure

ResMed holds strong patient preference across its mask range and operates connectivity infrastructure that both satisfies payer adherence requirements and identifies patients drifting toward abandonment. Interface preference is unusually sticky, since a patient who tolerates a mask has no reason to try another. That combination retains consumable revenue for years beyond the device placement itself.
RESMED

Risk: Share Gained Through Competitor Failure

A substantial part of the current position came from a competitor's recall rather than from anything the company did, and that competitor is steadily returning with rebuilt supply. Asian manufacturers are simultaneously entering at prices no Western cost base can meet. Payer scrutiny of replacement schedules aims at the revenue line underpinning everything.
PHILIPS

Moat: Installed Base And Clinical Breadth

Philips retains substantial installed base across sleep, home ventilation, and hospital respiratory care, alongside imaging and monitoring relationships that reach the same institutional buyers. Rebuilding supply into an installed base that already knows the platform is considerably easier than winning a patient from scratch, and the clinical breadth supports conversations no single-category competitor can hold.
PHILIPS

Risk: Recall Legacy And Rebuilding Trust

The foam degradation recall transferred patients to a competitor and patients refitted to another mask very rarely return, which makes the loss largely permanent rather than temporary. Regulatory and litigation overhang has persisted for years. Rebuilding clinician and provider confidence takes considerably longer than rebuilding manufacturing capacity ever did.

Players Tracked

Prominent Players

ResMed
Philips
Fisher and Paykel Healthcare
Medtronic
Drager

Other Key Players

Getinge
Hamilton Medical
Invacare
Inogen
React Health
Nihon Kohden
Mindray
Yuwell Medical
BMC Medical
Micomme Medical
Air Liquide
Chart Industries
ICU Medical
Vitalograph
Masimo

Recent Developments

FEBRUARY 2025

Payer Reviews Consumable Replacement Schedules For Therapy Supplies

A large payer opened a review of reimbursed replacement intervals for positive airway pressure masks, cushions, tubing, and filters, noting that current schedules originated with manufacturers rather than from clinical evidence. The review is a coverage assessment rather than any change to therapy access itself.
Signal: Sixty percent of sector revenue rests on replacement schedules that nobody has ever validated clinically anywhere
MAY 2025

Home Sleep Testing Reimbursement Widens In Primary Care Settings

A national health system extended reimbursement for home sleep apnoea testing ordered directly from primary care rather than requiring specialist referral. The change is a reimbursement policy decision and it removes a referral step that previously added months to the diagnostic pathway for uncomplicated cases.
Signal: Every diagnostic bottleneck removed converts directly into therapy platform placements downstream, and consumable revenue behind them
SEPTEMBER 2025

Chinese Manufacturer Expands Home Ventilation Exports Into New Markets

A Chinese home respiratory device manufacturer widened distribution of ventilation and oxygen concentrator products across Southeast Asian, Latin American, and Eastern European markets. The expansion was organic commercial activity through existing distributor relationships rather than any partnership with an established Western manufacturer, and local registration preceded each entry.
Signal: Domestic Chinese pricing reaches patient populations that Western device cost structures could never have served properly

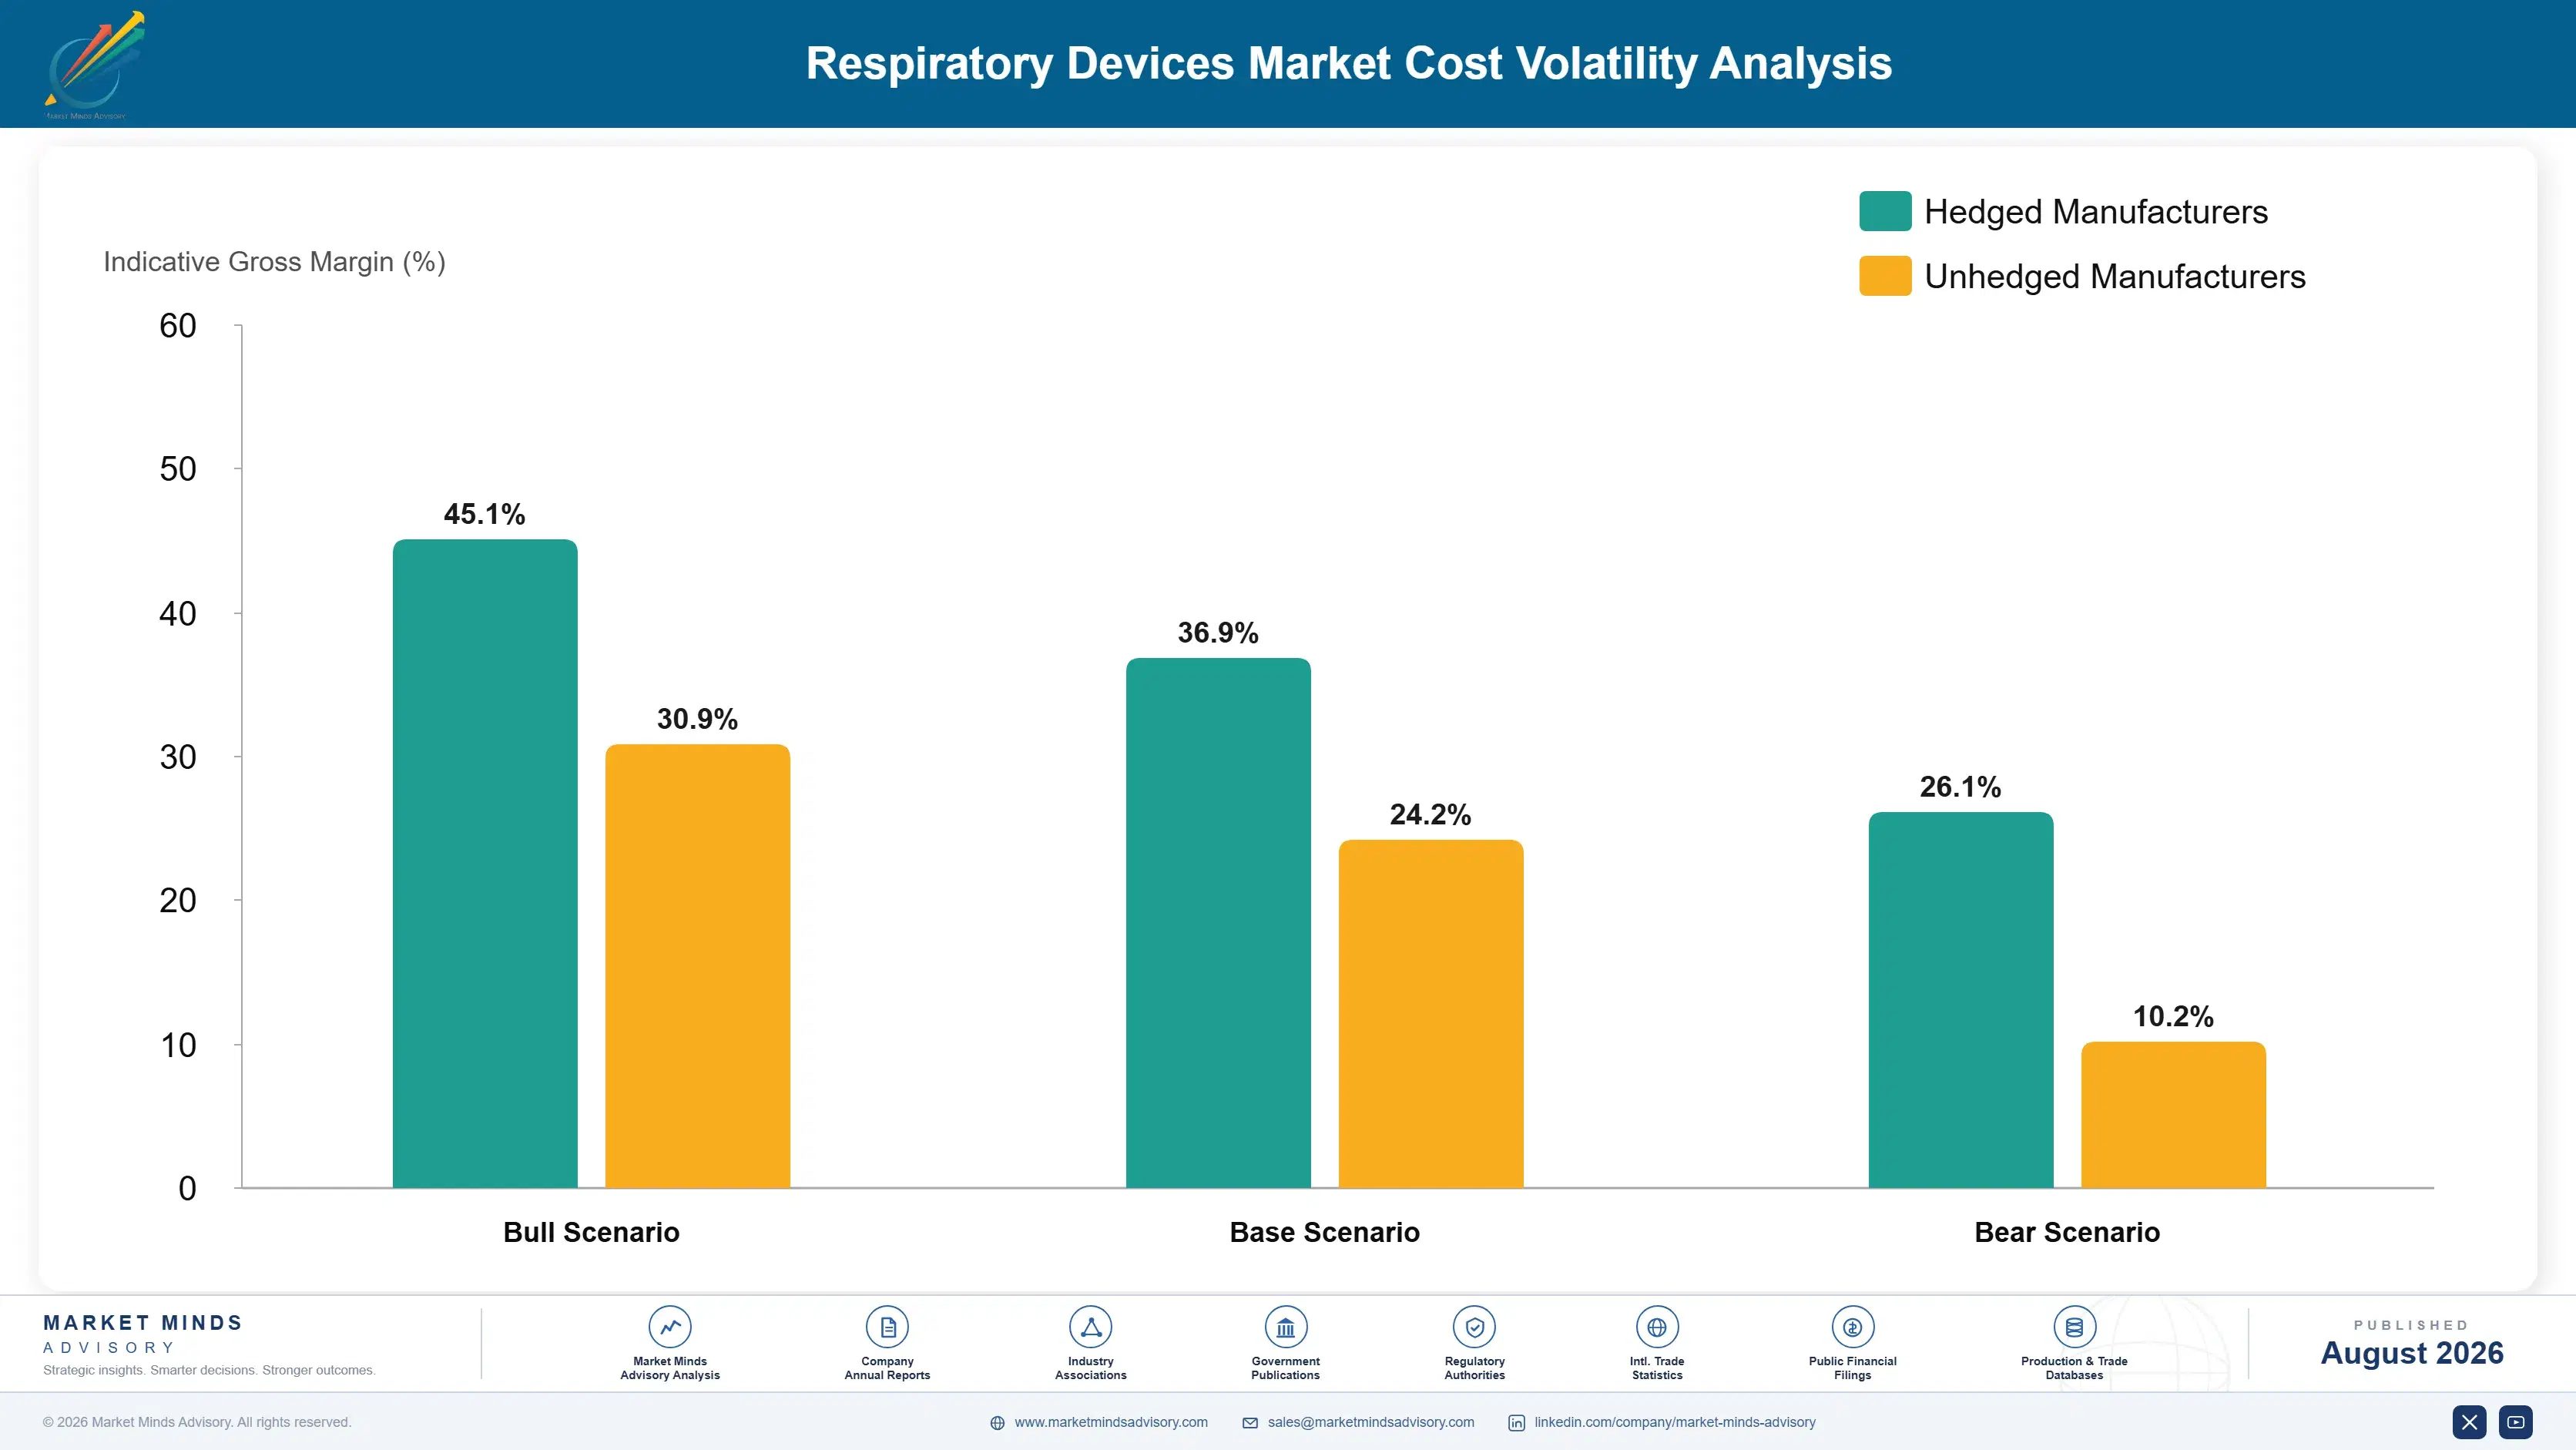
Silicone, Electronics And Freight

Medical grade silicone, foam, and moulded polymer components account for roughly 30% to 42% of interface consumable cost, sourced from specialist moulders whose tooling is product-specific and expensive to replicate. Motors, blowers, sensors, and control electronics run 34% to 46% of device build cost. Assembly labour, packaging, and outbound freight carry the remainder, with freight disproportionate on bulky oxygen concentrators.
Electronic component and motor supply constrained device manufacturing severely through 2021 and 2022 as semiconductor and motion control shortages ran across every industry, and respiratory manufacturers competed for allocation against automotive customers ordering vastly larger volumes. Philips described component availability constraints across its connected care operations in its 2022 annual reporting. Devices sat part-built waiting for controllers while demand was at its peak, Allocation rather than pricing was the problem throughout that period.

Exposure separates by whether a manufacturer controls interface tooling and moulding. A company owning its silicone tooling protects both the margin and the patient preference that retains consumable revenue for years. One outsourcing interface production competes on a component anybody can copy once the patent lapses. Device electronics exposure is broadly common to everybody and matters far less to long-run position than the mask does.
respiratory-devices-market-cost-volatility-analysis-1787298741837

Own Interface Tooling And Silicone Moulding Capability

The mask rather than the device retains a patient, and interface tooling is product-specific, expensive to replicate, and slow to qualify. Owning that capability protects both the consumable margin and the preference that keeps a patient attached for years. Outsourcing it hands away the one component in this sector where genuine differentiation has repeatedly proved possible.

Dual-Source Motors And Control Electronics Across Regions

Blowers, motors, and controllers come from suppliers who consistently prioritise far larger industrial and automotive customers when allocation tightens, and respiratory volumes are small by comparison. Qualifying second regional sources costs design verification and regulatory change work, and it prevents complete devices sitting unshipped while demand is at its highest, which is precisely what happened across the industry through 2021.

Manufacture Oxygen Concentrators Within The Freight Radius

Concentrators are bulky, heavy, and comparatively low in value per unit, which makes intercontinental freight a material share of delivered cost in exactly the emerging markets where volume is growing fastest. Regional assembly changes the landed economics rather than the negotiating position, and several manufacturers have already moved concentrator production accordingly rather than waiting.

Portfolio Architecture for Margin Defence

Margin architecture separates by whether an item is placed once or replaced quarterly. Device hardware earns 28% to 42%, frequently less where a platform is placed at or below cost to secure the patient. Interface consumables, cushions, circuits, and filters earn 62% to 76%, because the patient is already fitted, the provider already stocks it, and no alternative fits the same face comfortably.
The tension is that the whole model depends on replacement schedules nobody has validated clinically. Roughly 60% of revenue rests on intervals set by manufacturers rather than by evidence, and payers have started asking why a mask needs replacing quarterly. No trial exists comparing outcomes across intervals, which is an uncomfortable position for an industry whose economics depend entirely on the answer.

High-value pools concentrate in interface consumables, adherence infrastructure, and home ventilation placements. All three attach a patient rather than sell an item. Interfaces carry the widest margin range in the sector, because a preferred mask retained for a decade and a commodity cushion sold on tender share a description and share nothing whatsoever commercially, and the difference is worth several times the device value.

Volume / Commodity-Adjacent

Device hardware including concentrators, nebulisers, and entry-level therapy platforms sold or placed into competitive channels. The fourteen-point range separates differentiated home platforms from commodity equipment competing directly against Asian manufacturers on delivered price.
Gross Margin: 28% to 42%

Premium / Certified

Interface consumables, cushions, circuits, and filters supplied to patients already fitted to a platform and stocked by their provider. The fourteen-point range separates preferred branded interfaces from commodity replacement components sold on provider tender pricing.
Gross Margin: 62% to 76%

Sustainability / Regulatory / Next-Generation

Adherence monitoring and connectivity services, home sleep testing programmes, and reprocessed or reduced-material consumable formats. The forty-point range reflects genuine divergence: connectivity services carry software economics while sustainable consumables compete purely on cost.
Gross Margin: 38% to 78%
respiratory-devices-market-portfolio-architecture-1787298742694

High-value Sub-segments and Strategic Watch-out

Interface Consumables And Cushions

The value engine of this entire sector, generating around sixty percent of revenue from patients already fitted and providers already stocking replacements. Payer scrutiny of replacement intervals is the only genuine threat to it, and no clinical evidence exists on either side of that question.
Gross Margin: 66% to 76%

Home Ventilation Placements

Fastest growing category, moving chronic respiratory management out of hospitals into homes with genuine readmission evidence behind it. The device is placed once and consumables recur indefinitely, and home care providers rather than hospitals make the buying decision entirely, and hospital procurement barely features in the decision at all.
Gross Margin: 52% to 66%

Device Hardware Placement

Customer acquisition dressed as a product sale, frequently placed at or below cost to secure the patient and the consumable stream behind them. Asian manufacturers compete hard here and Western cost bases cannot follow them down on price, so device margin should be planned as an acquisition cost.
Gross Margin: 28% to 42%

Critical Care Ventilator Supply

Strategic watch-out. Emergency procurement placed enormous numbers of units into health systems that have barely used them since, and that installed base will not need replacing for years. Consumables and service on it are the only revenue available, Demand had been forecast from an event rather than a trend.
Gross Margin: 30% to 44%

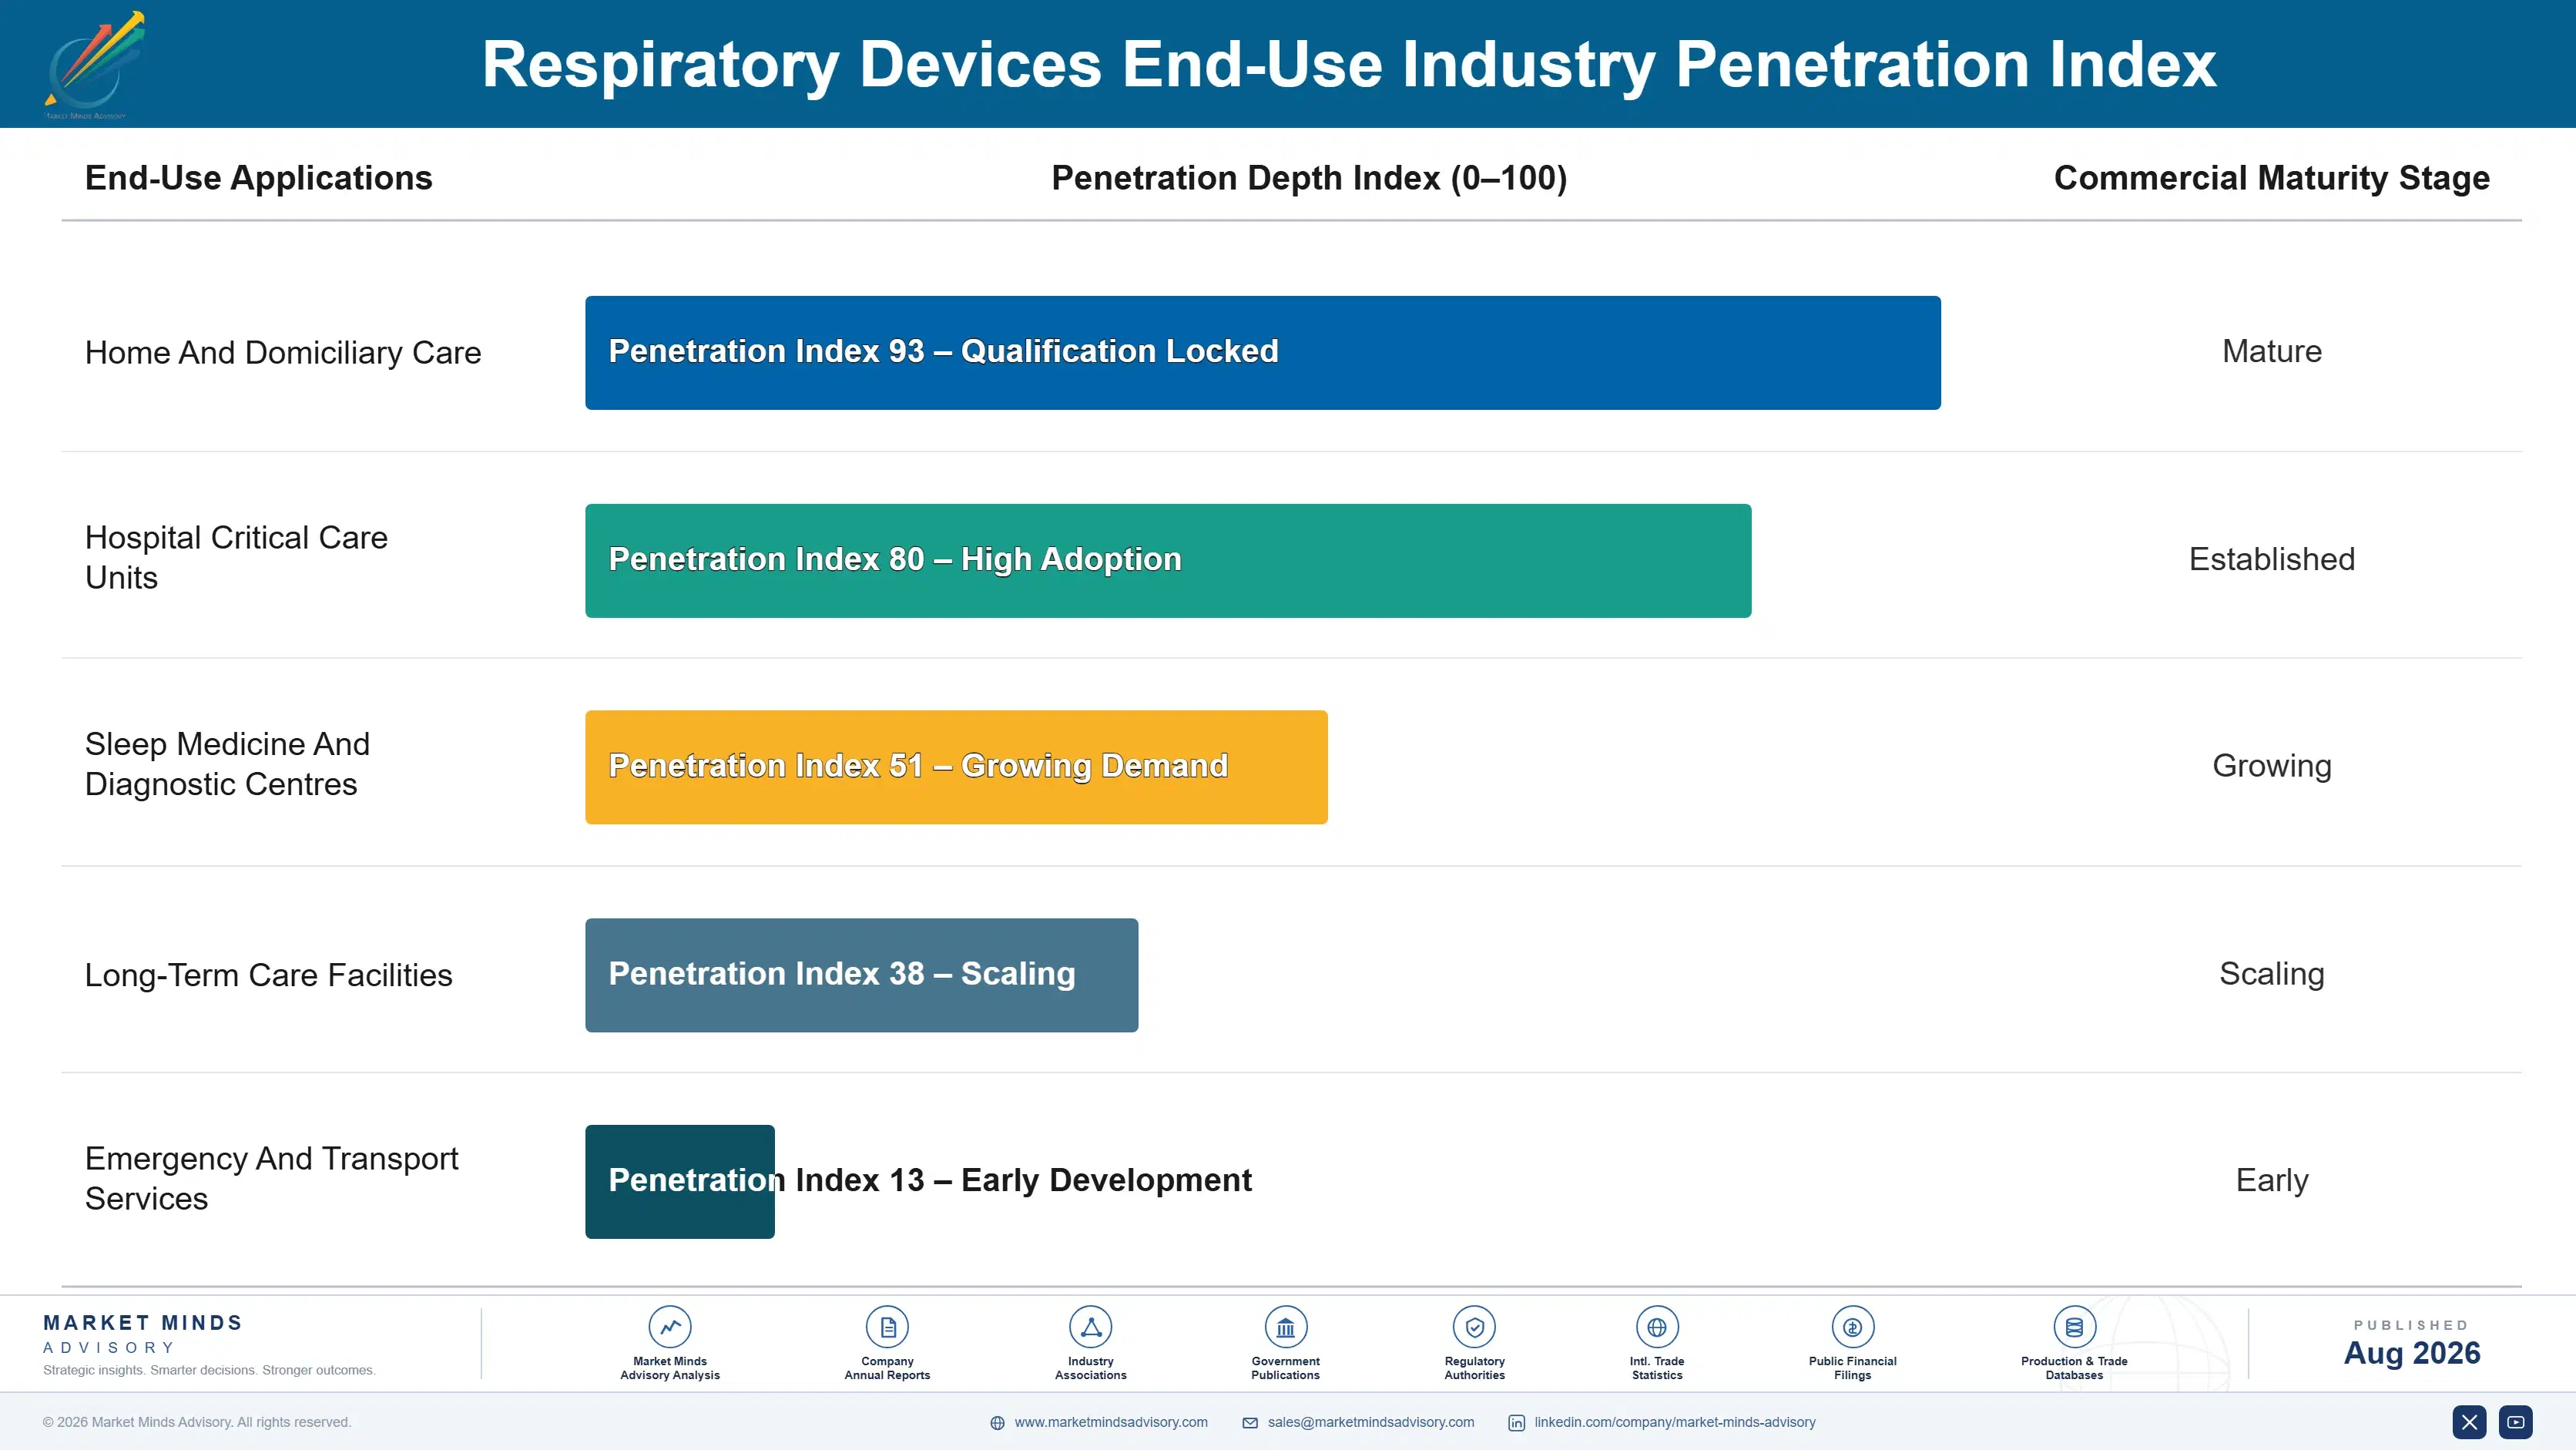
How A Patient Becomes An Annuity

The recurring unit here is the fitted patient rather than any contract. Once a therapy platform is placed and an interface fitted, the mask is replaced quarterly, the cushion more often, and the circuit and filters on their own schedules, generating revenue for as long as the person continues therapy. That makes device placement an acquisition event and adherence the retention metric, which is a subscription business wearing medical device clothing.
Depth varies by how attached the patient is to the interface. A patient who tolerates a particular mask has no reason whatsoever to try another, and refitting to a competitor's product is a genuine clinical inconvenience nobody undertakes lightly. Home ventilation is similarly deep, since the provider stocks the consumables. Hospital ventilator circuits are shallower, moving on procurement tender with the platform already installed.

Buyer profiles have consolidated in ways that matter. Home care and durable medical equipment providers now hold the patient relationship, stock the consumables, and choose which platform gets placed, while hospital procurement barely features in home therapy decisions at all. Payers separately impose adherence documentation requirements. Both changes reward manufacturers organised around provider channels and connectivity, and they penalise anybody still selling to clinicians.
respiratory-devices-market-end-use-penetration-index-1787298743591

Where We Come Out

These are among the four positions where our research anticipates prominent divergence between winners and laggards over the coming forecast period. Each is grounded in the demand model, the regulatory perimeter, and the announced capacity pipeline.
01 / INTERFACE INVESTMENT PRIORITY

The mask retains the patient, and the algorithm does not

Therapy adherence sits near sixty-two percent at twelve months and almost every abandonment traces to a mask that leaks, presses, or wakes somebody rather than to any dissatisfaction with the device driving it. Every point of adherence retained is years of quarterly consumable revenue that would otherwise stop entirely. Development spend on silicone moulding, cushion geometry, and headgear returns considerably more than pressure algorithm work, and smaller specialists have repeatedly beaten larger competitors on exactly that basis, Owning the interface tooling protects both the margin and the preference itself.
02 / DIAGNOSTIC FUNDING FOCUS

Fund the test, because the therapy market follows it

Only around eighteen percent of adults with obstructive sleep apnoea have ever been formally diagnosed, and the obstacle is laboratory polysomnography capacity rather than any shortage of devices or willingness to treat. Home sleep testing costs ninety to a hundred and sixty dollars per patient and each diagnosis produces a platform placement plus roughly a decade of interface replacement behind it. Manufacturers funding diagnostic access consistently outgrow those spending the same money promoting to already diagnosed patients, Primary care ordering rather than specialist referral is where capacity now sits.
03 / PROVIDER CHANNEL ORGANISATION

Home care providers decide placements, and hospitals do not

Home ventilation and oxygen reach patients through durable medical equipment organisations that hold the relationship, stock the consumables, and choose which platform gets placed in the house. Hospital procurement barely features in that decision at any point. Provider consolidation means a single supply agreement can now cover tens of thousands of placements at once, and manufacturers still organised around hospital selling lose those agreements to competitors who understood the channel years ago, Provider stocking preferences also shape which platform gets placed in a house.
04 / REPLACEMENT SCHEDULE DEFENCE

Sixty percent of revenue rests on unvalidated intervals

Recommended replacement schedules for masks, cushions, tubing, and filters were set by manufacturers rather than derived from clinical evidence, and no trial has ever compared quarterly against longer intervals on patient outcomes. Payers have begun asking exactly that question and the industry currently has no answer to give them. Generating adherence evidence linking interface condition to therapy continuation is the only defence available, and it needs starting before a coverage decision arrives rather than afterwards, A coverage decision taken without that evidence would be extremely difficult to reverse.

Engagement Snapshot From the Field

A live engagement with an industry participant carrying material or product regulatory and market exposure ahead of a defining policy shift, showing how our research translates into a defensible multi-year portfolio strategy.
MARKET MINDS ADVISORY · CLIENT ENGAGEMENT SUMMARY
Respiratory Devices Producer Strategic Portfolio Review and Transition Roadmap 2026·Investment Scenario on Respiratory Devices Exposure Evaluation 2025-26
CLIENT PROFILE
A mid-sized respiratory device manufacturer with roughly USD 480 million in annual revenue (client-reported, unverified by MMA), selling home therapy platforms and consumables across North America and Western Europe. Around 71% of revenue came from device hardware, interface products were outsourced to a contract moulder, and the commercial organisation was structured around hospital and clinician selling.
STRATEGIC CHALLENGE
Device pricing had eroded for three consecutive years under Asian competition while consumable revenue per placed patient sat well below competitor benchmarks, and the company had lost two large home care provider agreements in eighteen months. The board wanted to understand whether the problem was product, price, or something structural about how the business was organised.
MMA APPROACH
MMA analysed revenue per placed patient against competitor benchmarks, interviewed twenty-eight home care provider procurement leads and clinicians on platform selection, and assessed the client's interface portfolio against patient preference and adherence data. Outsourced moulding economics were compared against owned tooling at the client's actual volumes, Provider channel structure and consolidation were mapped across both regions.
KEY FINDINGS
  1. Consumable revenue per placed patient ran 44% below the leading competitor, driven by lower interface attach rate rather than by any difference in pricing or replacement schedules.
  2. Twenty-three of twenty-eight provider contacts named interface range and patient preference as the primary platform selection criterion, and none mentioned device specification at all.
  3. Twelve month adherence on the client's placements measured 51% against a competitor benchmark near 64%, and interface discomfort accounted for most of the difference reported.
  4. Outsourced interface moulding cost 31% more per unit than owned tooling would at current volumes, and prevented any proprietary cushion development entirely.
CLIENT PROFILE
A mid-sized respiratory device manufacturer with roughly USD 480 million in annual revenue (client-reported, unverified by MMA), selling home therapy platforms and consumables across North America and Western Europe. Around 71% of revenue came from device hardware, interface products were outsourced to a contract moulder, and the commercial organisation was structured around hospital and clinician selling.
STRATEGIC CHALLENGE
Device pricing had eroded for three consecutive years under Asian competition while consumable revenue per placed patient sat well below competitor benchmarks, and the company had lost two large home care provider agreements in eighteen months. The board wanted to understand whether the problem was product, price, or something structural about how the business was organised.
MMA APPROACH
MMA analysed revenue per placed patient against competitor benchmarks, interviewed twenty-eight home care provider procurement leads and clinicians on platform selection, and assessed the client's interface portfolio against patient preference and adherence data. Outsourced moulding economics were compared against owned tooling at the client's actual volumes, Provider channel structure and consolidation were mapped across both regions.
KEY FINDINGS
  1. Consumable revenue per placed patient ran 44% below the leading competitor, driven by lower interface attach rate rather than by any difference in pricing or replacement schedules.
  2. Twenty-three of twenty-eight provider contacts named interface range and patient preference as the primary platform selection criterion, and none mentioned device specification at all.
  3. Twelve month adherence on the client's placements measured 51% against a competitor benchmark near 64%, and interface discomfort accounted for most of the difference reported.
  4. Outsourced interface moulding cost 31% more per unit than owned tooling would at current volumes, and prevented any proprietary cushion development entirely.
RECOMMENDED STRATEGY
Phase 1: Phase one: bring interface tooling and silicone moulding in-house and begin proprietary cushion development aimed explicitly at adherence rather than at cost. Phase 2: Phase two: restructure the commercial organisation around home care provider accounts, and withdraw the hospital-focused field team from home therapy selling. Phase 3: Phase three: build adherence monitoring into the platform and use the resulting data both for payer reporting and for early intervention with drifting patients.
OUTCOME
The client brought moulding in-house within three quarters and launched two proprietary cushions. Twelve month adherence rose from 51% to 59%, consumable revenue per placed patient improved 28%, and the company regained one of the two lost provider agreements (client-reported, unverified by MMA), with device pricing left unchanged throughout.

Frequently Asked Questions

Foundational context covering the market sizes, CAGR, scope, country, region and competition that inform every finding below. This section is provided to cover basics and most often pre-purchase conversations, answered from the MMA Primary Research Dataset.

What is the current size of the Respiratory Devices Market?

The global respiratory devices market reached USD 24.5 billion in 2025, covering therapeutic and monitoring equipment for respiratory conditions together with dedicated consumables. Inhaled medicines, anaesthesia systems, and general patient monitoring are excluded.

How large will the Respiratory Devices Market be by 2036?

MMA forecasts USD 50.52 billion by 2036, up from USD 26.17 billion in 2026, an increase of USD 24.35 billion. That represents an expansion multiple of 1.93 times across the forecast period.

What is the CAGR for the Respiratory Devices Market 2026 to 2036?

The base case CAGR is 6.8%, with a bull case of 8.0% and a bear case of 5.6%. Historical growth between 2020 and 2025 ran at 5.7%, averaging a ventilator boom and bust against a permanent transfer of installed base.

Which segment is growing fastest?

Home non-invasive ventilation systems grow fastest at 10.2%, exactly 1.50 times the market rate, as chronic respiratory management moves into domiciliary care. Sleep apnoea therapy devices and interfaces follow at 8.4%.

Who are the major companies in the Respiratory Devices Market?

ResMed, Philips, Fisher and Paykel Healthcare, Medtronic, and Drager lead, together holding 44% of the market. Interface fit and provider relationships rather than device engineering decide most of that position.

Which country is growing fastest?

India grows fastest at 10.4%, driven by chronic obstructive pulmonary disease prevalence among the highest anywhere and home therapy penetration still rising from a very low base. Domestic manufacturing keeps pricing accessible.

Report Segmentation Architecture

The full report scope spans multiple orthogonal segmentation dimensions, with cross-tabulated demand data provided for each dimension pair. Coverage extends further to regional breakdowns, trend trajectories, and the competitive detail needed to support segment-level decision-making.

By Device Function

  • Home Non-Invasive Ventilation Systems
  • Sleep Apnoea Therapy Devices And Interfaces
  • Oxygen Therapy And Concentrator Systems
  • Nebulisation And Aerosol Delivery Devices
  • Critical Care Ventilators
  • Respiratory Monitoring And Diagnostic Devices

By End-Use Industry

  • Home And Domiciliary Care
  • Hospital Critical Care Units
  • Sleep Medicine And Diagnostic Centres
  • Long-Term Care Facilities
  • Emergency And Transport Services

By Commercial Dimension

  • Home Care Provider Supply Agreements
  • Hospital Tender And Group Purchasing
  • Direct-To-Patient Consumable Supply
  • Reimbursed Rental And Placement Models
  • Distributor And Retail Channels

By Region

  • North America
  • East Asia
  • Western Europe
  • South Asia and Pacific
  • Latin America
  • Middle East and Africa
  • Eastern Europe

Scope, Methodology, and Coverage

Every figure in this report is reproducible from documented input assumptions. The scope below maps the historical period, the forecast horizon, the segmentation dimensions, and the countries covered, alongside the underlying primary and qualitative methodology.
Historical Period
2020 to 2025
Forecast Period
2026 to 2036
Base Year
2025 (USD billions; MMA Primary Research Dataset, August 2026)
Market Definition
The respiratory devices market covers therapeutic and monitoring equipment used in the management of respiratory conditions across home, hospital, and long-term care settings, together with the dedicated consumables supplied for those devices. Scope spans home non-invasive ventilation systems, sleep apnoea therapy devices and interfaces, oxygen therapy and concentrator systems, nebulisation and aerosol delivery devices, critical care ventilators, and respiratory monitoring and diagnostic equipment. Inhaled medicines and drug-device combination inhalers, anaesthesia delivery, general patient monitoring, extracorporeal oxygenation, and medical gas infrastructure are excluded.
Quantitative Units
USD billions at manufacturer revenue level; devices placed annually; consumable revenue per placed patient.
Segmentation Dimensions
By device function; by end-use industry; by commercial dimension; by region.
Regions Covered
North America, East Asia, Western Europe, South Asia and Pacific, Latin America, Middle East and Africa, Eastern Europe
Countries Covered
United States, Canada, Germany, France, United Kingdom, Italy, Spain, Netherlands, Poland, Czech Republic, China, Japan, South Korea, India, Indonesia, Australia, Brazil, Mexico, Saudi Arabia, South Africa.
Key Companies Profiled
ResMed, Philips, Fisher and Paykel Healthcare, Medtronic, Drager, Getinge, Hamilton Medical, Invacare, Inogen, React Health, Nihon Kohden, Mindray, Yuwell Medical, BMC Medical, Micomme Medical, Air Liquide, Chart Industries, ICU Medical, Vitalograph, Masimo.
Quantitative Methodology
Primary survey, n=3,800 respondents, Q4 2025, six countries; demand-side model with trade association cross-validation
Qualitative Methodology
47 expert interviews, Q4 2025; applied to validate demand model assumptions, identify emerging dynamics, and assess competitive positioning
Report Format
PDF and XLSX data workbook (Word format preview document)
Publisher
Market Minds Advisory
Report Code
MMA-2026-MED-932
Published
August 2026
Contact
sales@marketmindsadvisory.com | www.marketmindsadvisory.com

Purchase the full Respiratory Devices Market Report (2026 to 2036).

The full MMA report on respiratory devices covers device function, regional, and competitive analysis in detail, with separate treatment of the consumable economics that generate most sector revenue and decide most competitive positions. It includes consumable revenue per placed patient benchmarking, adherence and interface preference analysis across major platforms, home care provider channel structure and consolidation mapping, and diagnosis rate assessment against therapy market potential. Regional chapters cover twenty countries with reimbursement and disease burden assessed separately. Competitive profiling spans twenty companies on a consistent revenue basis throughout.
Twenty country reimbursement and disease burden chapters
Consumable revenue per placed patient benchmarking across platforms
Adherence and interface preference analysis by product family
Home care provider channel structure and consolidation mapping
Twenty company competitive profiles compared consistently
Diagnosis rate assessment against addressable therapy potential

Built For The People Who Decide

From boardroom strategy to bench-side execution, this report is read cover-to-cover by leaders shaping the next decade of their industry, turning demand scenarios, market dynamics and valuation benchmarks into decisions.
CXOs/ Presidents/ VPs/ Managers
M&A and Corporate Development
Strategy Teams and R&D Heads
Procurement and Product Directors
Regulatory and Compliance Leaders
Investor Relations and Equity Analysts