Market Minds Advisory
Respiratory Analysers Market

Respiratory Analysers Market: The Instrument Is Fine, the Test Is Not

Around a third of spirometry tests fail published acceptability criteria, which means the limiting factor in respiratory diagnosis is the person performing the manoeuvre rather than the instrument recording it.

Lead Analyst

Alice Ballenger

Published

September 2026

Make Smarter Decisions with Customized Research Insights

Request a free sample report and evaluate market opportunities, growth trends, and competitive dynamics relevant to your business needs.

2025 MARKET VALUE$1.6BMarket Size 2025
2036 FORECAST VALUE$3.5BBase Case , 2026 to 2036
CAGR 2026 TO 20367.6 %Bull 8.8% / Bear 6.4%
INCREMENTAL OPPORTUNITY$1.8BNet 10- year value creation
EXPANSION MULTIPLE2.08x2036 value over 2026 base
Strategic Levers
M&A Pipeline
Regional Outlook
Country Rankings
Competitive Intelligence
Segmental Deep-dive
Call-Us : 91 93563 13602

Executive Snapshot and Market Trajectory

Spirometry depends on a patient blowing as hard as they can while somebody coaches them properly. Around 31% of tests fail published acceptability criteria, which makes the operator rather than the analyser the limiting factor in respiratory diagnosis. Under-effort resembles genuine restriction on the printout. The instrument rarely is.
That reframes what a device is actually for. Automated quality grading, real-time coaching prompts and manoeuvre feedback raise diagnostic yield considerably more than any sensor improvement can, and they matter more each year as testing moves outward, with roughly 43% of devices now sited outside hospital pulmonary function laboratories where trained technicians once ran every single test. Sensor accuracy has not been the constraint for decades.
The reference equation change is the underappreciated event here. Moving from race-specific to race-neutral prediction reclassified around 14% of patients, altering who counts as impaired for disability assessment, transplant listing and clinical trial eligibility. Every installed analyser needed a software update, and every longitudinal dataset acquired a discontinuity that cannot be reconciled afterwards. Manufacturers who updated the installed base quickly gained credibility with laboratories, and those who could not lost it.
Market Definition
Instruments measuring respiratory gas composition, airflow and lung mechanics for diagnosis and monitoring, covering spirometers, body plethysmographs and lung volume systems, gas diffusion systems, exhaled nitric oxide analysers, capnographs and respiratory gas monitors, and cardiopulmonary exercise testing systems. Measured at manufacturer selling value including consumables and software. Excludes ventilators, oxygen therapy equipment, blood gas analysers, sleep diagnostic devices and imaging systems.
Base Year Value
$1.6B in 2025 (MMA Primary Research Dataset, August 2026)
Forecast Period
2026 to 2036, eleven discrete annual values
CAGR
7.6% base case. Bull 8.8%. Bear 6.4%.
Fastest Growth Segment
Exhaled Nitric Oxide Analysers: 11.4% CAGR
Fastest Growth Country
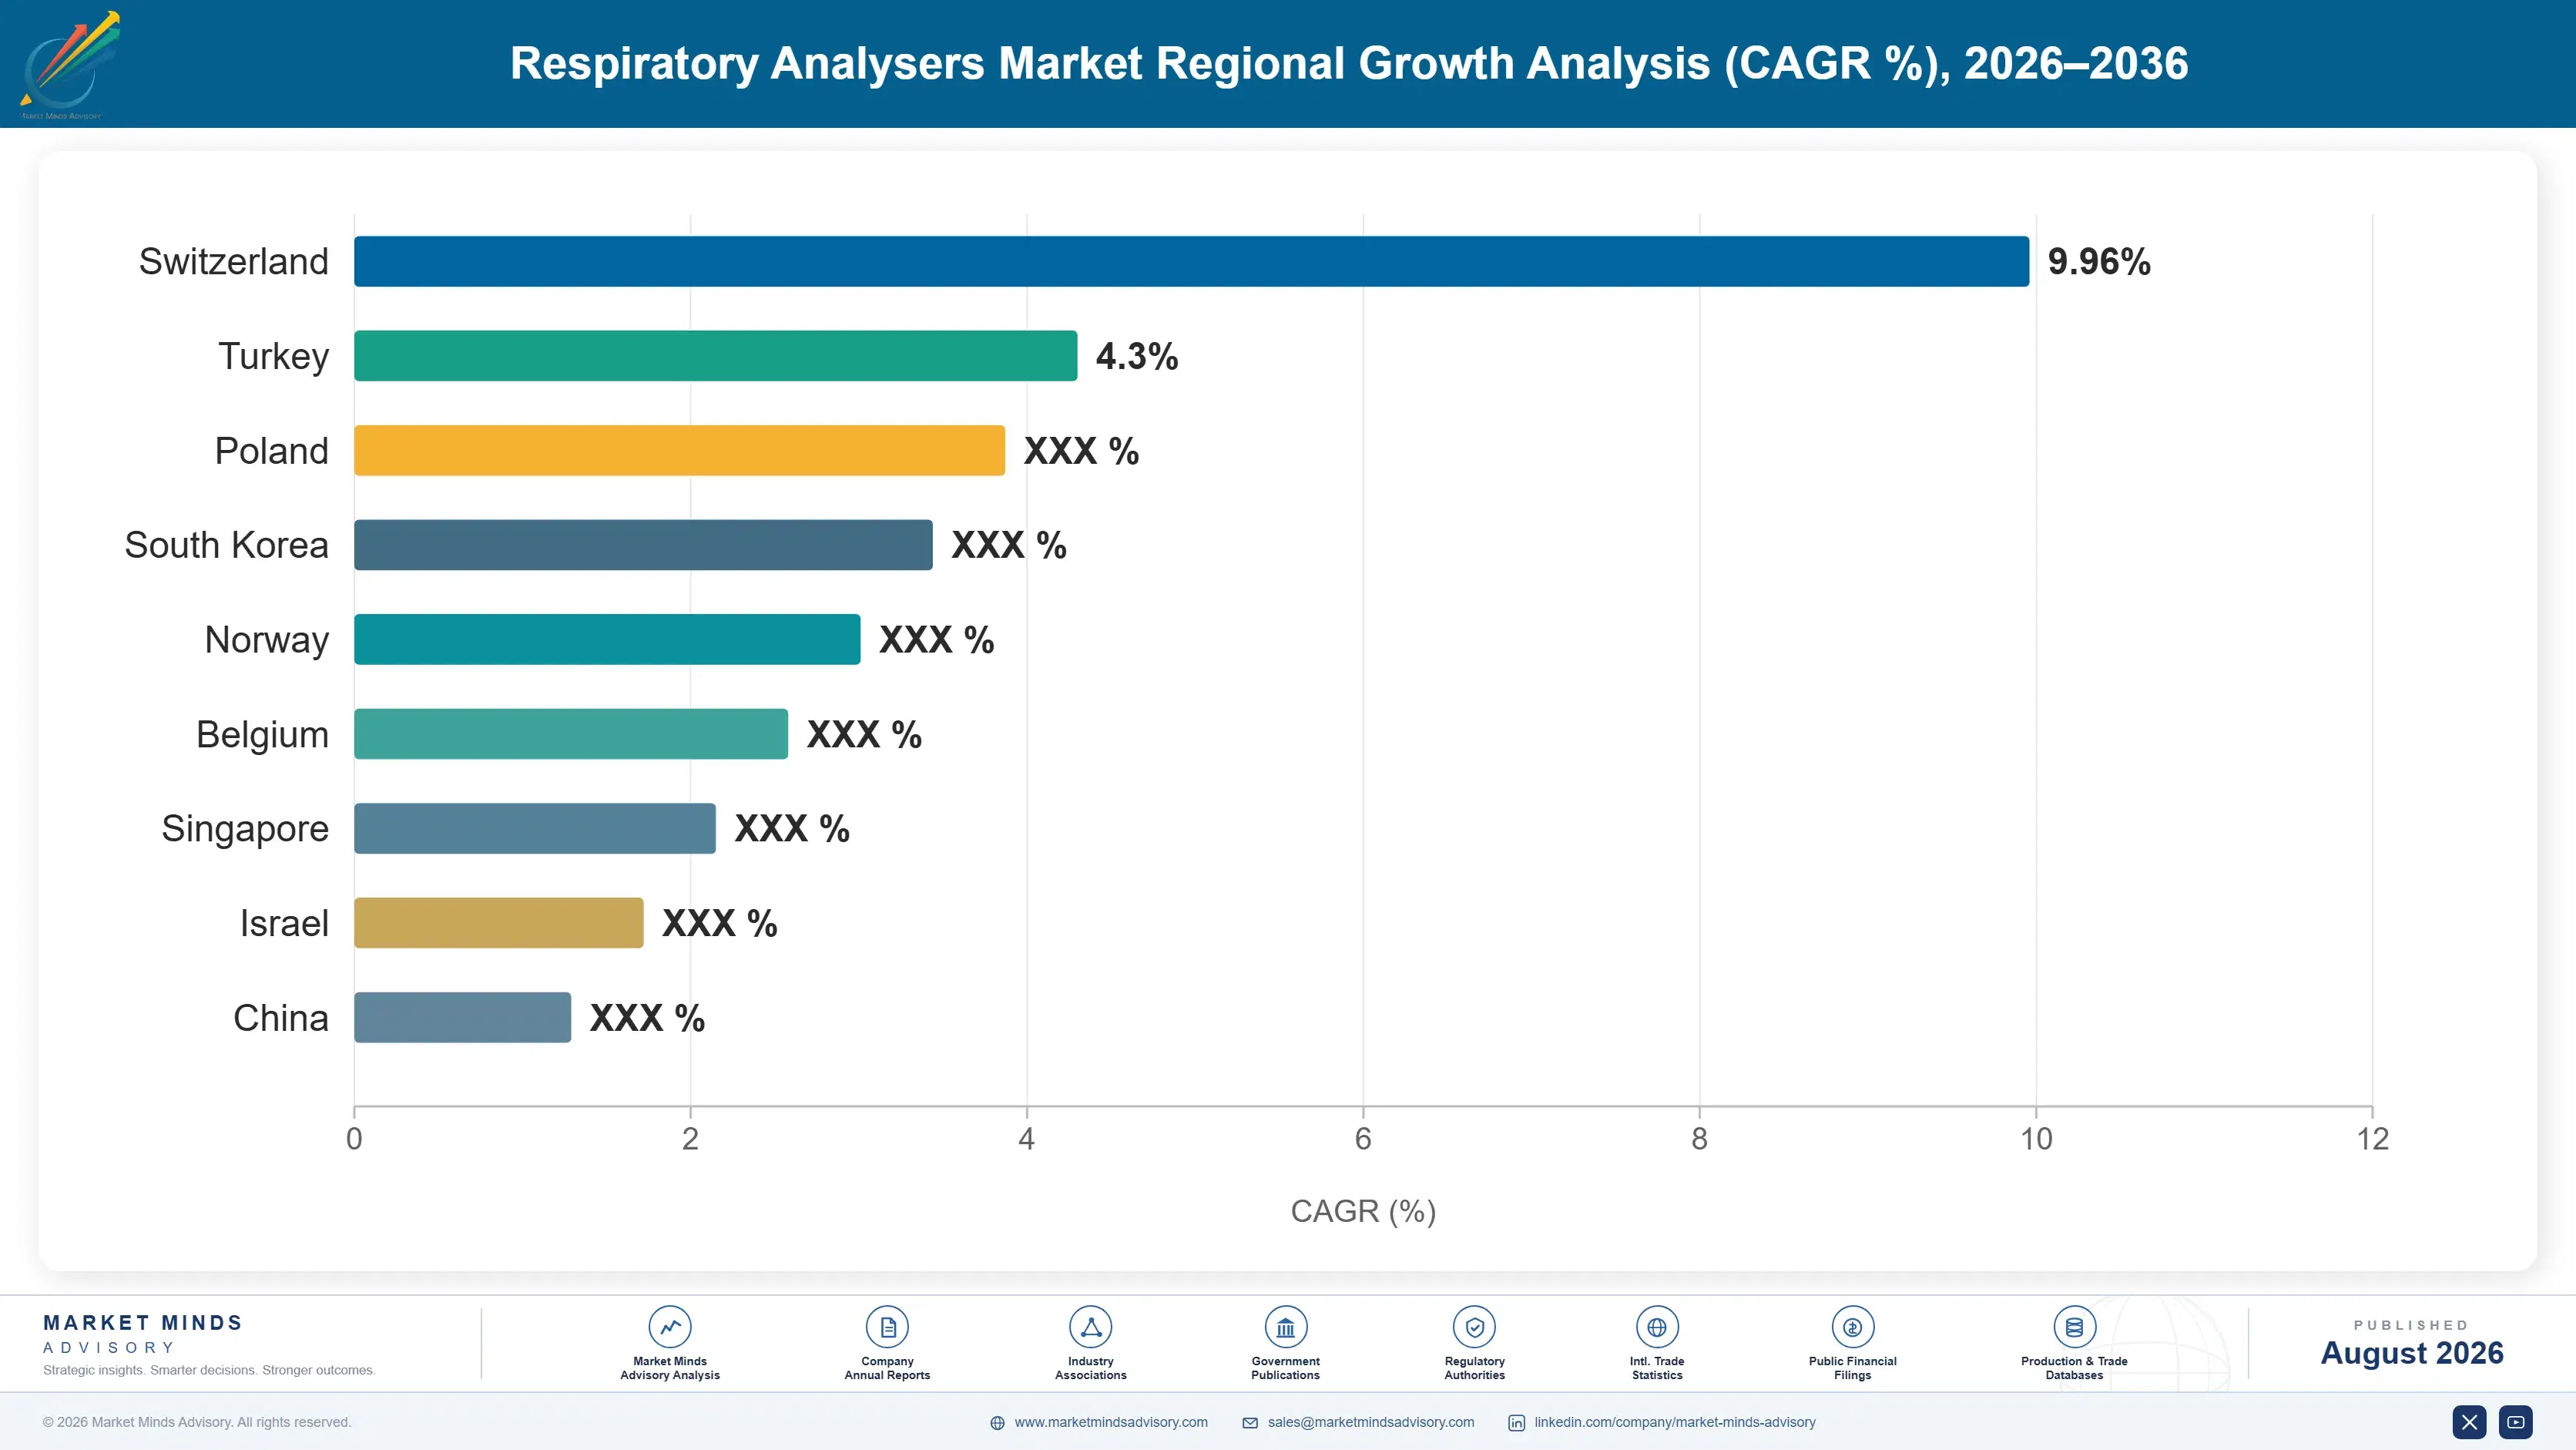
China: 11.0% CAGR
Fastest Growth Region
South Asia and Pacific: 9.6% CAGR
Largest Region
North America: 30% of 2025 global value
Market Leaders
COSMED, MGC Diagnostics, ndd Medical Technologies, Nihon Kohden, Schiller. Source: MMA Primary Research Dataset, July 2026.
Primary Survey
n=3,800 procurement and R&D decision-makers, Q4 2025, six countries
Methodology
Demand-side build-up, cross-validated against public data, 47 expert interviews

Respiratory Analysers Market Forecast Scenarios

respiratory-analysers-market-size-forecast-scenario-1787594900336
Growth ran near 6.2% between 2020 and 2025, disrupted early as pulmonary function testing was suspended in many health systems over aerosol transmission concerns and then rebounding into a substantial backlog. Testing partly relocated toward primary care and home monitoring and did not fully return afterwards. Reference equation revision arrived toward the end of the period and forced software updates across the installed base.
Base case 7.6% rests on three mechanisms. Exhaled nitric oxide testing grows at 11.4% because asthma biologics costing around thirty-four thousand dollars annually need phenotype selection, and a cheap biomarker gates access to an expensive therapy. Decentralised testing keeps expanding, with roughly 43% of devices already outside pulmonary function laboratories. And Chinese screening programmes drive 11.0% growth against the largest chronic obstructive pulmonary disease burden anywhere in the world. Screening capacity is the constraint there.
The bull case at 8.8% assumes automated quality grading raising acceptable test rates enough to make primary care spirometry genuinely reliable, which would expand the installed base well beyond specialist settings. The bear case at 6.4% is health system budget pressure deferring pulmonary function laboratory replacement, since a working analyser can be kept running for years past its intended service life.

A Test Only As Good As the Coaching

Spirometry is an effort-dependent test, which is a polite way of saying its result depends on how hard the patient blows and how well somebody coaches them through it. Around 31% of tests fail published acceptability and repeatability criteria, and a failed test is not a null result but a misleading one, because an under-effort manoeuvre looks exactly like restricted lung function to anyone reading the number afterwards.
TOP FIVE CONCENTRATION47%Reference equation software and calibration narrow the field
TEST ACCEPTABILITY FAILURE31%Spirometry tests failing published acceptability and repeatability criteria
EQUATION RECLASSIFICATION SHARE14%Patients whose category changed under race-neutral reference equations
BIOLOGIC THERAPY ANNUAL COST34,000Yearly cost of the therapy a biomarker helps select
PRIMARY CARE INSTALLED SHARE43%Devices now sited outside hospital pulmonary function laboratories
DEVICE SERVICE LIFE9 yearsWorking life before an analyser is typically replaced
That places the commercial opportunity somewhere unexpected. Sensor accuracy in modern analysers is comfortably beyond what the measurement problem requires, so a better flow sensor changes almost nothing. Automated quality grading, real-time coaching displays and manoeuvre feedback change a great deal, and they matter more every year as testing moves outward, with roughly 43% of devices now sited outside pulmonary function laboratories.
The reference equation revision was the largest single event in this field for a generation and passed almost unnoticed outside it. Moving from race-specific to race-neutral prediction reclassified roughly 14% of patients, changing who is recorded as impaired for disability assessment, transplant listing and clinical trial eligibility. Every installed device required updated software, and every longitudinal record now spans two incompatible reference frames.
"Manufacturers keep competing on sensor specifications that stopped mattering fifteen years ago. The test fails a third of the time because of coaching, and the device that fixes coaching will beat the device with the better flow sensor in every setting where a trained technician is not standing there."
Director, Diagnostic Devices and Respiratory Medicine Practice · MMA Medical Devices Practice · August 2026

Market Trends

Reference equation revision forcing software updates and record discontinuity

The move from race-specific to race-neutral prediction equations reclassified roughly 14% of patients, altering who is recorded as having impaired lung function for disability determination, transplant listing and trial eligibility. Every installed analyser required a software update to apply the new equations, and every longitudinal patient record now spans two incompatible reference frames that cannot be compared directly. Manufacturers able to update the installed base quickly gained visibility with laboratories, and those who could not lost credibility they had built over years. It was the most direct contact manufacturers had with their entire installed base in a decade.
Market Impact: Chinese demand growing at 11.0%

Biomarker testing gating access to expensive asthma biologics

Asthma biologics cost around thirty-four thousand dollars per patient annually and require phenotype selection, since they work in type-2 inflammation and not otherwise. Exhaled nitric oxide is a cheap, fast and non-invasive marker of exactly that inflammation, which makes a modest analyser the gatekeeper for a very expensive therapy. That relationship drives 11.4% growth, and it means the device's commercial value derives substantially from the drug it helps select rather than from anything the instrument itself does. Sensor consumables carry recurring revenue attached to every placement, which turns a capital sale into something closer to an annuity.
Market Impact: Devices 43% outside laboratories

Market Opportunities and Growth Drivers

Chinese screening programmes reaching a very large disease burden

China grows fastest anywhere at 11.0%, driven by pulmonary function testing entering national public health screening against the largest chronic obstructive pulmonary disease burden in the world. Smoking prevalence and historical air quality both contribute, and much of that disease has never been diagnosed. Domestic manufacturers supply a substantial share of the equipment at prices international suppliers do not attempt to match, which means installed base grows considerably faster than regional value does. Much of that disease has never been diagnosed at all, which is what the screening is designed to address. Testing capacity rather than awareness is the constraint.
Market Impact: Fails 31% of attempted tests

Testing relocating outward from specialist pulmonary function laboratories

Roughly 43% of devices now sit outside hospital pulmonary function laboratories, in primary care, occupational health and increasingly in patients' homes for transplant and cystic fibrosis monitoring. That shift accelerated when hospital testing was suspended during the pandemic and never fully reversed afterwards. It creates volume for lower-cost devices while making the coaching problem considerably worse, since the trained technician who used to run the test is no longer standing beside the patient. Volume grows for lower-cost devices while confidence in the results grows considerably more slowly, which is the tension running through the whole category.
Market Impact: Stretches a 9 year cycle

Market Restraints and Challenges

Effort dependence undermining test quality wherever coaching is weak

Around 31% of spirometry tests fail published acceptability and repeatability criteria, and a poor manoeuvre produces a misleading result rather than an obviously invalid one, since under-effort resembles genuine restriction. The root cause is that the measurement requires maximal patient effort sustained correctly, which is a coaching problem rather than an instrumentation one. Commercially it limits confidence in decentralised testing where technicians are absent. Automated quality grading and real-time coaching feedback are the mitigations manufacturers are pursuing. Procurement is beginning to require grading rather than merely prefer it. Nothing about the instrument itself changes the outcome.
Market Impact: Reclassified about 14% of patients

Extended device life deferring pulmonary function laboratory replacement

A pulmonary function analyser typically works for around nine years and frequently runs considerably longer, because the underlying measurement has not changed and a calibrated device keeps producing valid results indefinitely. The root cause is that sensor performance stopped being the limiting factor decades ago. Commercially it means replacement cycles stretch under budget pressure with no clinical penalty. Software capability, reference equation currency and quality grading are what manufacturers use to justify replacement rather than measurement improvement. Reference currency has become the strongest replacement argument available to a manufacturer. Measurement improvement no longer justifies a purchase.
Market Impact: Gates 34,000 dollar annual therapy
4 additional market trends, 3 additional growth drivers, and 2 additional restraints and challenges are covered in the full report. Contact sales@marketmindsadvisory.com to access the complete intelligence.

Segment CAGR and Growth Architecture

Six segments are split here by analyser type, because each one measures a different respiratory parameter, requires a different degree of patient cooperation and sits in an entirely different clinical pathway. Portable and desktop configuration variants sit inside each type rather than beside them. Care setting and channel are handled in the framework instead.
respiratory-analysers-market-market-share-analysis-1787594900901

Exhaled Nitric Oxide Analysers

Growing at 11.4%, half again the market rate of 7.6%, these analysers measure a marker of type-2 airway inflammation through a single controlled exhalation, which requires far less patient effort than spirometry and is correspondingly more reliable outside specialist settings. Their commercial position derives from asthma biologics costing around thirty-four thousand dollars annually that require phenotype selection before prescribing. A cheap test gating an expensive therapy is an unusually strong position for a device, and it means demand tracks biologic prescribing rather than respiratory testing volumes generally. Sensor consumables carry recurring revenue attached to each installed unit. Payers requiring documented biomarker results before authorisation strengthen that position further. Demand tracks prescribing rather than testing volumes.
CAGR 11.4%

Cardiopulmonary Exercise Testing Systems

At 9.2% these systems measure gas exchange during graded exercise, producing the most complete functional assessment available in respiratory and cardiac medicine. Use has expanded beyond specialist referral into preoperative risk assessment, where exercise capacity predicts surgical outcomes better than resting measurements do, and into long-term follow-up of post-viral breathlessness. The systems are expensive, require trained operators and occupy dedicated space, which limits placement to larger centres. Interpretation complexity is the practical constraint, and manufacturers embedding automated reporting reach centres that would otherwise lack the specialist expertise to use the data properly. Preoperative risk assessment has become the fastest growing use, since exercise capacity predicts surgical outcomes considerably better than resting measurements manage to.
CAGR 9.2%
Full segment breakdown across 6 segments available in the complete report.

Regional Architecture and Country Demand Map

North America currently holds 30% of value on device pricing and on unusually dense pulmonary function laboratory provision. East Asia then follows at 26% on Chinese screening expansion against the largest disease burden anywhere, with Western Europe at 24% spread across long-established national laboratory networks.

North America

Reference equation revision originated here and moved fastest, with professional society guidance driving software updates across the installed base within a compressed period. That reclassified roughly 14% of patients and created immediate work for manufacturers able to respond quickly. Occupational health testing is a substantial and often overlooked segment, driven by respiratory surveillance requirements in industries with dust and fume exposure. Asthma biologic prescribing is higher here than anywhere, which supports biomarker analyser placement. Growth of 6.4% runs below the base case on a mature installed base and stretched replacement cycles. Manufacturers who updated the installed base quickly gained visibility with laboratories, and those who could not lost credibility built over many years.
Share: 30% | CAGR: 6.4% (2026 to 2036)

Western Europe

Established pulmonary function laboratory networks across Germany, France, the United Kingdom and the Nordic countries support steady replacement demand rather than expansion. European professional societies contributed substantially to the reference equation work and adoption has been broadly consistent across national health systems. Occupational respiratory surveillance is well regulated and generates predictable testing volumes. Home monitoring for cystic fibrosis and transplant follow-up is more developed here than in most regions. Growth at 6.0% runs below the base case, tracking replacement and budget cycles rather than clinical demand. Procurement runs through national frameworks in several countries, which concentrates decisions considerably. Home monitoring for cystic fibrosis and transplant follow-up is more developed here than almost anywhere else.
Share: 24% | CAGR: 6.0% (2026 to 2036)
Regional intelligence for 5 additional markets available in the complete report: East Asia, South Asia and Pacific, Latin America, Middle East and Africa, Eastern Europe. Contact sales@marketmindsadvisory.com.
respiratory-analysers-market-country-cagr-analysis-1787594901421

Four Moves Beyond Sensor Specifications

Sensor accuracy stopped being the limiting factor in this field several decades ago, and manufacturers still compete on it anyway. Around 31% of tests fail on coaching and effort, roughly 43% of devices now sit where no technician stands, and that mismatch is where every remaining commercial opportunity in this category actually sits waiting.

Automate quality grading rather than improving the sensor

Around 31% of spirometry tests fail acceptability criteria, and a poor manoeuvre produces a misleading result rather than an obvious failure, since under-effort resembles genuine restriction. Automated grading against published criteria, with real-time coaching prompts, addresses the actual source of diagnostic error. Sensor improvements address a problem solved decades ago. As roughly 43% of devices move outside laboratories, the device that coaches well beats the device that measures marginally better in every one of those settings. Procurement lists are beginning to exclude devices lacking the capability. Capability rather than price is what excludes them.
Market Impact: Attacks the whole 31% test acceptability failure problem

Attach the analyser to the biologic prescribing pathway

Asthma biologics cost around thirty-four thousand dollars per patient annually and require phenotype selection before prescribing, which makes a modest exhaled nitric oxide analyser the gate on a very expensive therapy. Positioning the device within that pathway reaches respiratory specialists and payers rather than equipment purchasing, and demand then tracks biologic prescribing rather than general testing volumes. Sensor consumables carry recurring revenue against every placement, which turns a capital sale into an annuity. A device costing a fraction of one year of therapy at 34,000 dollars is not really a capital decision.
Market Impact: Gates therapy costing 34,000 dollars every single year

Own the reference equation update across the installed base

Reference equation revision reclassified roughly 14% of patients and required a software update on every installed analyser, which is the most direct contact a manufacturer gets with its entire installed base in a decade. Responding quickly built credibility with laboratories and responding slowly destroyed it. Treating reference currency, quality algorithms and reporting software as a maintained service rather than a shipped feature creates the recurring relationship that a nine year hardware life otherwise prevents entirely. Laboratories accept paid maintenance readily once a reference change has shown them why it matters.
Market Impact: Covers all 14% patient reclassification software update work

Build for the setting without a trained technician

Roughly 43% of devices now sit in primary care, occupational health and patients' homes, where nobody coaches the manoeuvre and the 31% failure rate is likely worse rather than better. Designing for that setting means guided workflows, automatic rejection of poor efforts and remote review by a specialist who never meets the patient. Manufacturers still designing for a laboratory technician are building for a shrinking share of their own installed base without appearing to notice. Remote specialist review of recorded manoeuvres is the practical answer. Guided workflows and automatic rejection of poor efforts are the rest of it.
Market Impact: Serves 43% of the whole installed device base

Who Controls the Margin Pool

Participation is measured on annual respiratory analyser revenue including consumables and software, and the top five hold 47%. Concentration reflects reference equation software, calibration validation and clinical credibility rather than sensor manufacturing, which is widely available. COSMED and MGC Diagnostics lead on laboratory system breadth and installed base depth. The gap to challengers is software and clinical validation rather than hardware capability. Sensor manufacturing is widely available and confers no advantage.
Competition runs on three fronts. Software currency decides credibility, as the reference equation revision demonstrated more sharply than any product launch could. Quality grading decides performance outside laboratories, where most growth now sits. Consumable attachment decides recurring revenue, which matters greatly against a nine year hardware life that generates nothing in between. Procurement is starting to test all three explicitly.

Pressure ahead comes from Chinese manufacturers competing on price into screening programmes, and from decentralisation favouring lower-cost devices over laboratory systems. Vyaire Medical's respiratory diagnostics business was sold through bankruptcy proceedings in 2024, redistributing a substantial installed base. Rankings shift as quality grading capability separates suppliers and as biomarker placement grows against traditional laboratory equipment. Installed base continuity matters unusually much here.
respiratory-analysers-market-company-positioning-matrix-1787594901934

Competitive Moat and Risk Dimensions

COSMED

Moat: Laboratory system breadth and validation

Capability spanning spirometry, plethysmography, gas diffusion and cardiopulmonary exercise testing lets the company equip a complete pulmonary function laboratory from one supplier, with consistent software and reporting across every measurement. Laboratories value that integration heavily, because comparing results across instruments from different manufacturers introduces exactly the variability the testing is trying to eliminate.
COSMED

Risk: Laboratory setting concentration

Strength in complete laboratory systems is strength in the setting that is shrinking as a share of installed devices, with roughly 43% now sited outside pulmonary function laboratories. Serving primary care and home monitoring requires different products, different pricing and a different route to market, none of which laboratory system capability confers automatically.
NDD MEDICAL TECHNOLOGIES

Moat: Calibration-free measurement approach

An ultrasonic flow measurement approach that avoids routine calibration removes a substantial operational burden from settings without technical staff, which is precisely where testing is relocating. That design decision looks increasingly well judged as roughly 43% of devices move outside laboratories where daily calibration was simply part of the routine.
NDD MEDICAL TECHNOLOGIES

Risk: Narrow measurement portfolio

A focused position in spirometry and diffusion measurement leaves the company outside plethysmography and exercise testing, which limits its ability to equip a complete laboratory or to follow customers as their requirements broaden. Competitors offering the full range can bundle across a procurement in ways a focused supplier cannot answer on price alone.

Players Tracked

Prominent Players

COSMED
MGC Diagnostics
ndd Medical Technologies
Nihon Kohden
Schiller

Other Key Players

Masimo
Medtronic
Philips
Draegerwerk
GE HealthCare
Hamilton Medical
Fukuda Denshi
Vitalograph
Geratherm Medical
SDI Diagnostics
NIOX Group
Bedfont Scientific
Contec Medical Systems
Chest M.I.
Morgan Scientific

Recent Developments

APRIL 2026

Health system mandates automated quality grading for primary care spirometry

A national health system required automated acceptability grading on all spirometers used in primary care, after audit found a substantial proportion of tests failing published criteria without being identified as unusable. Devices lacking the capability were excluded from the approved procurement list. Audit findings had circulated widely beforehand.
Signal: Quality grading is moving from a feature into a procurement requirement, which reshapes who can supply
OCTOBER 2025

Reference equation transition completed across major laboratory networks

Major pulmonary function laboratory networks completed transition to race-neutral reference equations, reclassifying a meaningful share of patients and creating discontinuity in longitudinal records that predate the change. Manufacturers varied considerably in how quickly they delivered the necessary software updates. Longitudinal comparison across the change became impossible.
Signal: Software responsiveness across an installed base builds or destroys credibility faster than any product launch does
JANUARY 2026

Biomarker testing embedded in asthma biologic prescribing pathway

A payer required documented type-2 inflammation biomarker results before authorising asthma biologic therapy costing around thirty-four thousand dollars annually per patient. Exhaled nitric oxide testing volumes rose sharply across the affected respiratory services within two quarters. Authorisation now requires the documented result. Prescribing volumes were unaffected by the requirement.
Signal: A cheap analyser gating an expensive therapy is an unusually strong commercial position for a device

Sensors, Software and Validation

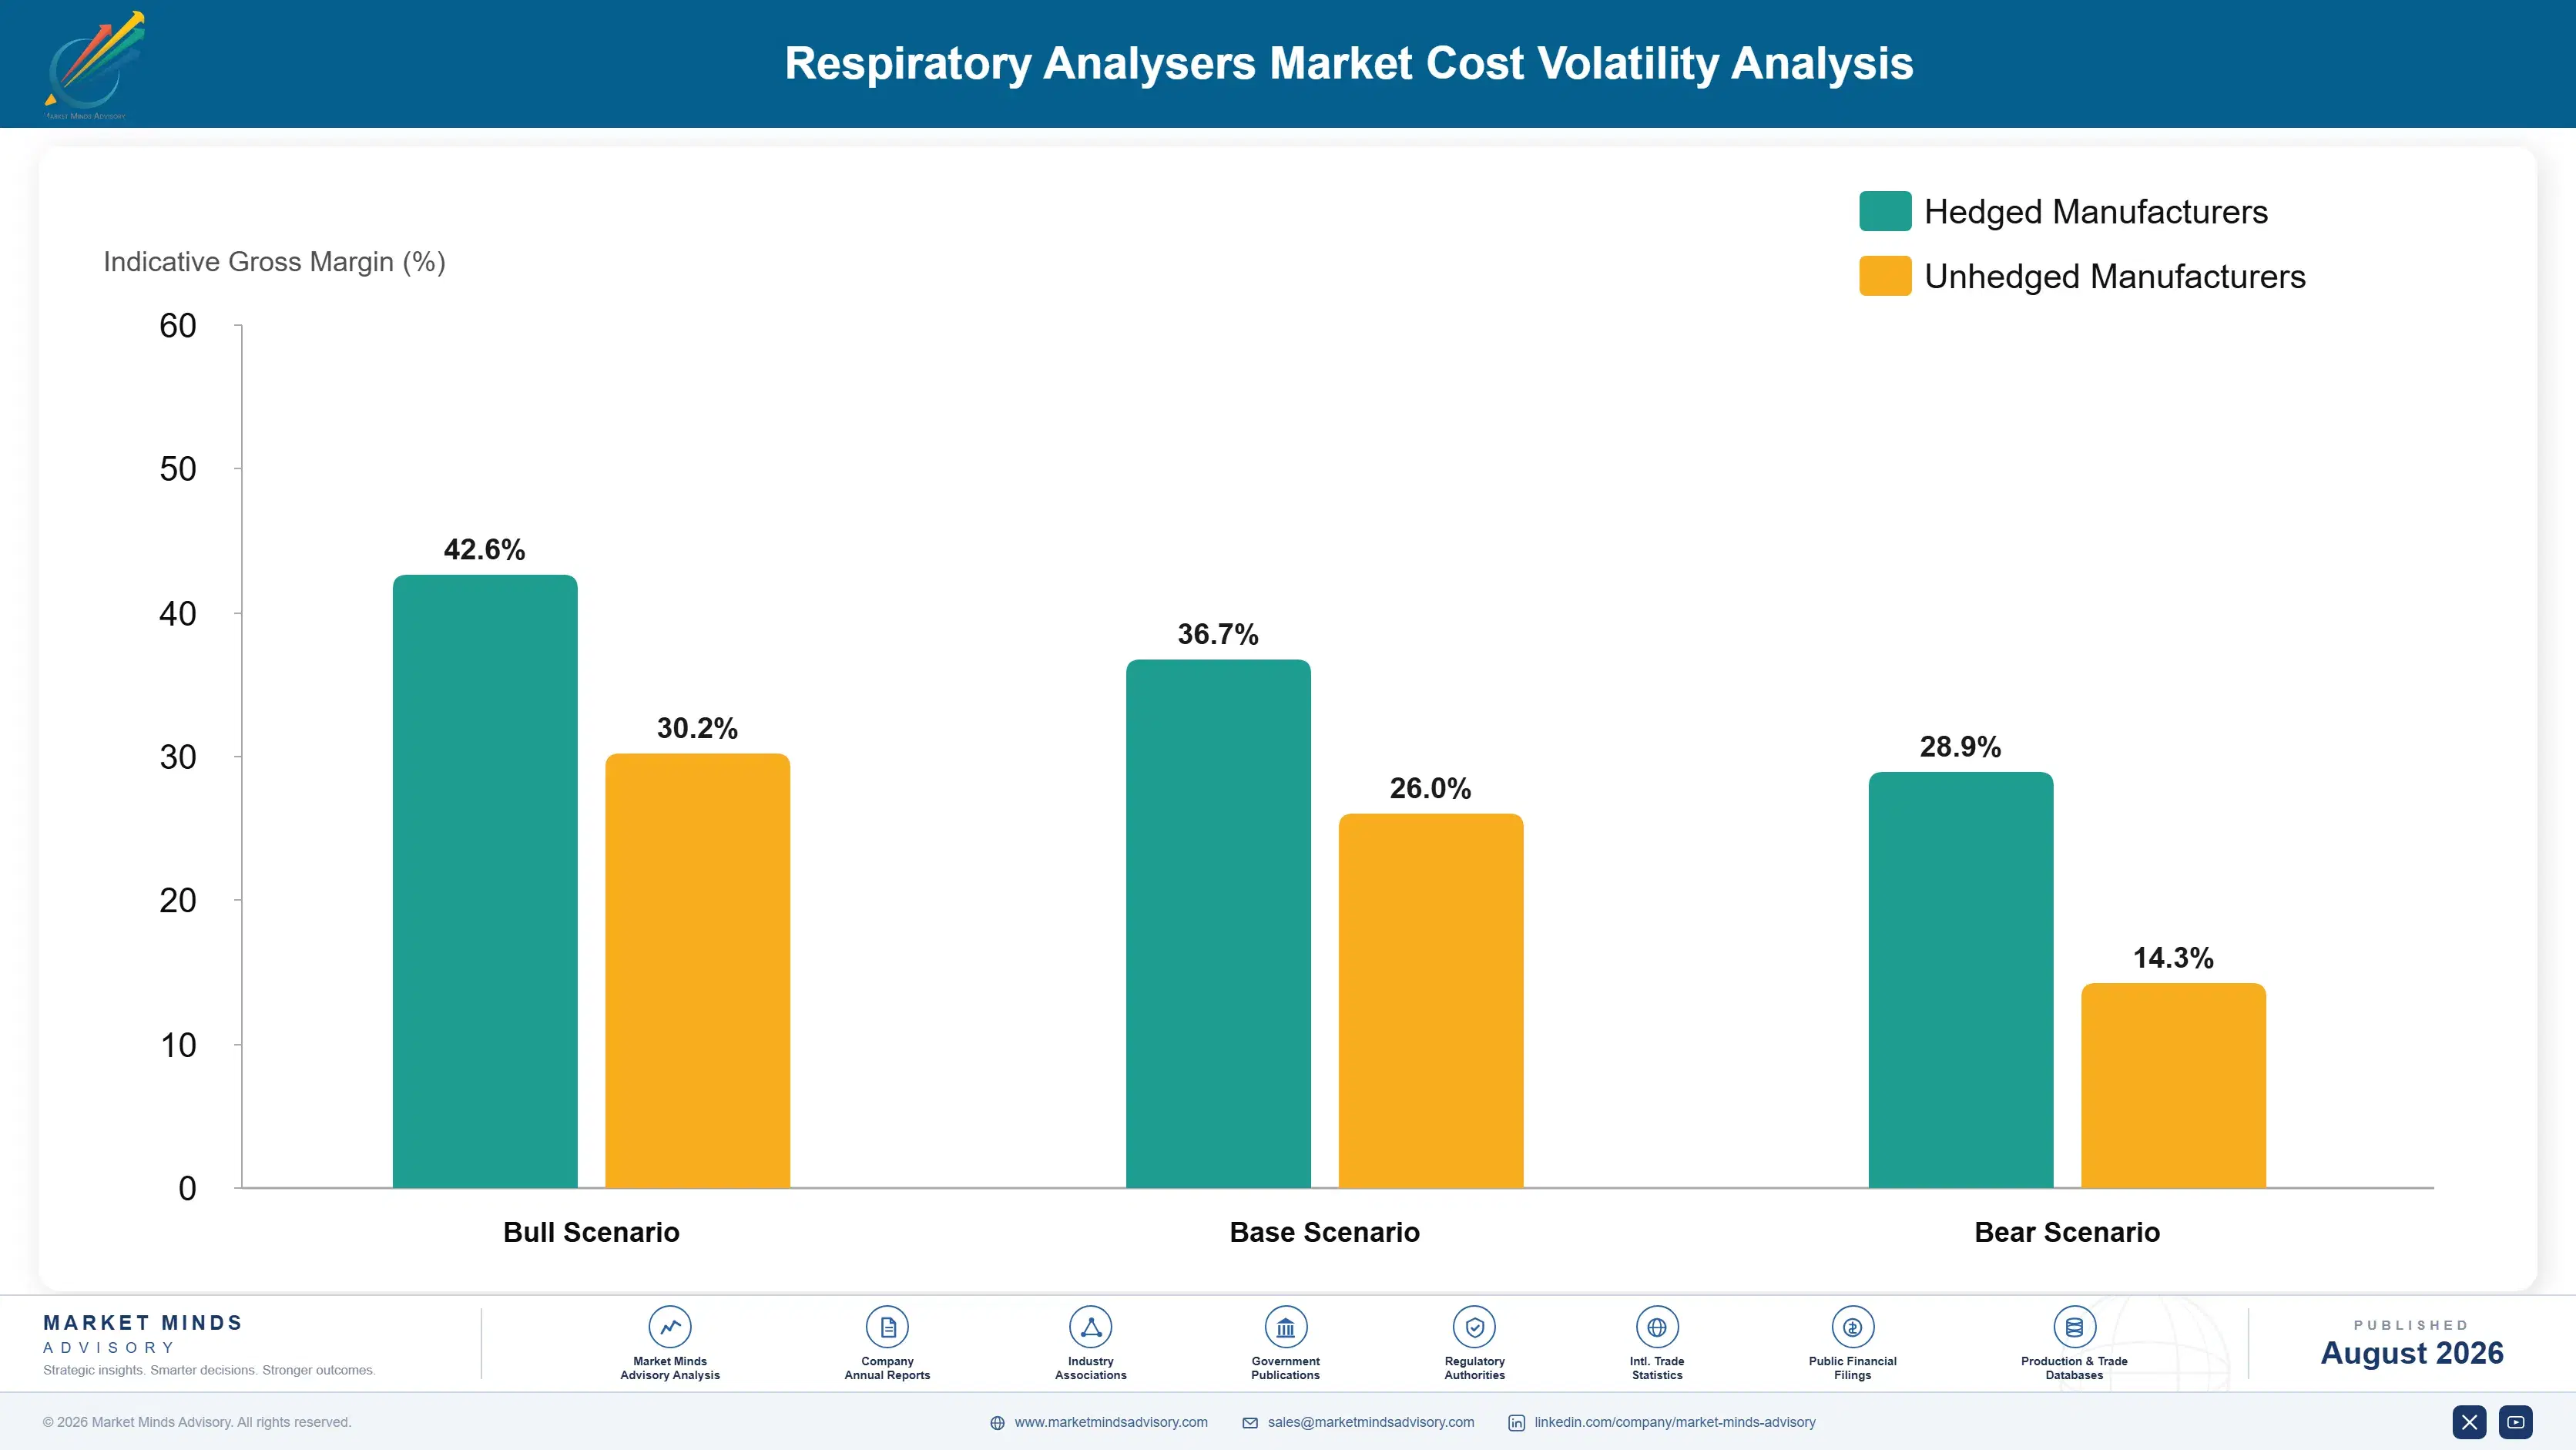
Sensors and flow measurement components account for roughly 22% of device cost, spanning pneumotachographs, ultrasonic transducers and electrochemical cells depending on the measurement. Electronics and displays carry about 18%. Software development, clinical validation and regulatory maintenance take around 31% amortised across volumes, which is the largest single element and rises with every guideline revision. Assembly, calibration and distribution absorb the balance.
Electronic component availability constrained device production through 2021 and 2022 as semiconductor supply tightened across every industry, per national statistical office trade reporting for the period, with medical device manufacturers competing for allocation against far larger consumer electronics buyers. Lead times extended considerably. Sensor component supply was less affected, so the constraint sat in general electronics rather than in anything specific to respiratory measurement. Lead times normalised through 2023 without lasting damage.

Exposure divides on software burden and on portfolio breadth. A manufacturer maintaining reference equations, quality algorithms and reporting across several measurement types carries validation cost that a single-product supplier avoids, though it spreads across more revenue. Regulatory maintenance rises with each guideline revision regardless of volume, which weighs disproportionately on smaller participants and is one reason the top five hold 47% of a technically undemanding market.
respiratory-analysers-market-cost-volatility-analysis-1787594902130

Treat software maintenance as recurring revenue rather than overhead

Software and validation are around 31% of cost and rise with every guideline revision, while hardware generates nothing across a nine year service life. Charging for maintained reference currency, quality algorithms and reporting converts the largest cost line into a recurring relationship. Laboratories accept this readily once a reference equation change has shown them why it matters.

Spread validation cost across a broader measurement portfolio

Regulatory maintenance and clinical validation rise with guideline revisions regardless of unit volumes, which weighs very heavily on narrow product portfolios. Spreading that cost across spirometry, diffusion, plethysmography and exercise testing improves the economics considerably. It also lets a supplier equip a complete laboratory, which procurement frequently prefers to assembling instruments from several different manufacturers.

Secure electronic component allocation ahead of general shortage

General electronics rather than respiratory-specific sensors constrained production during the last shortage, and medical device manufacturers compete for allocation against consumer electronics buyers many times their size. Multi-year component agreements secure supply when spot availability disappears entirely. Manufacturers without them lost delivery slots rather than margin, which cost them tender participation. Allocation rather than price was the binding constraint.

Portfolio Architecture for Margin Defence

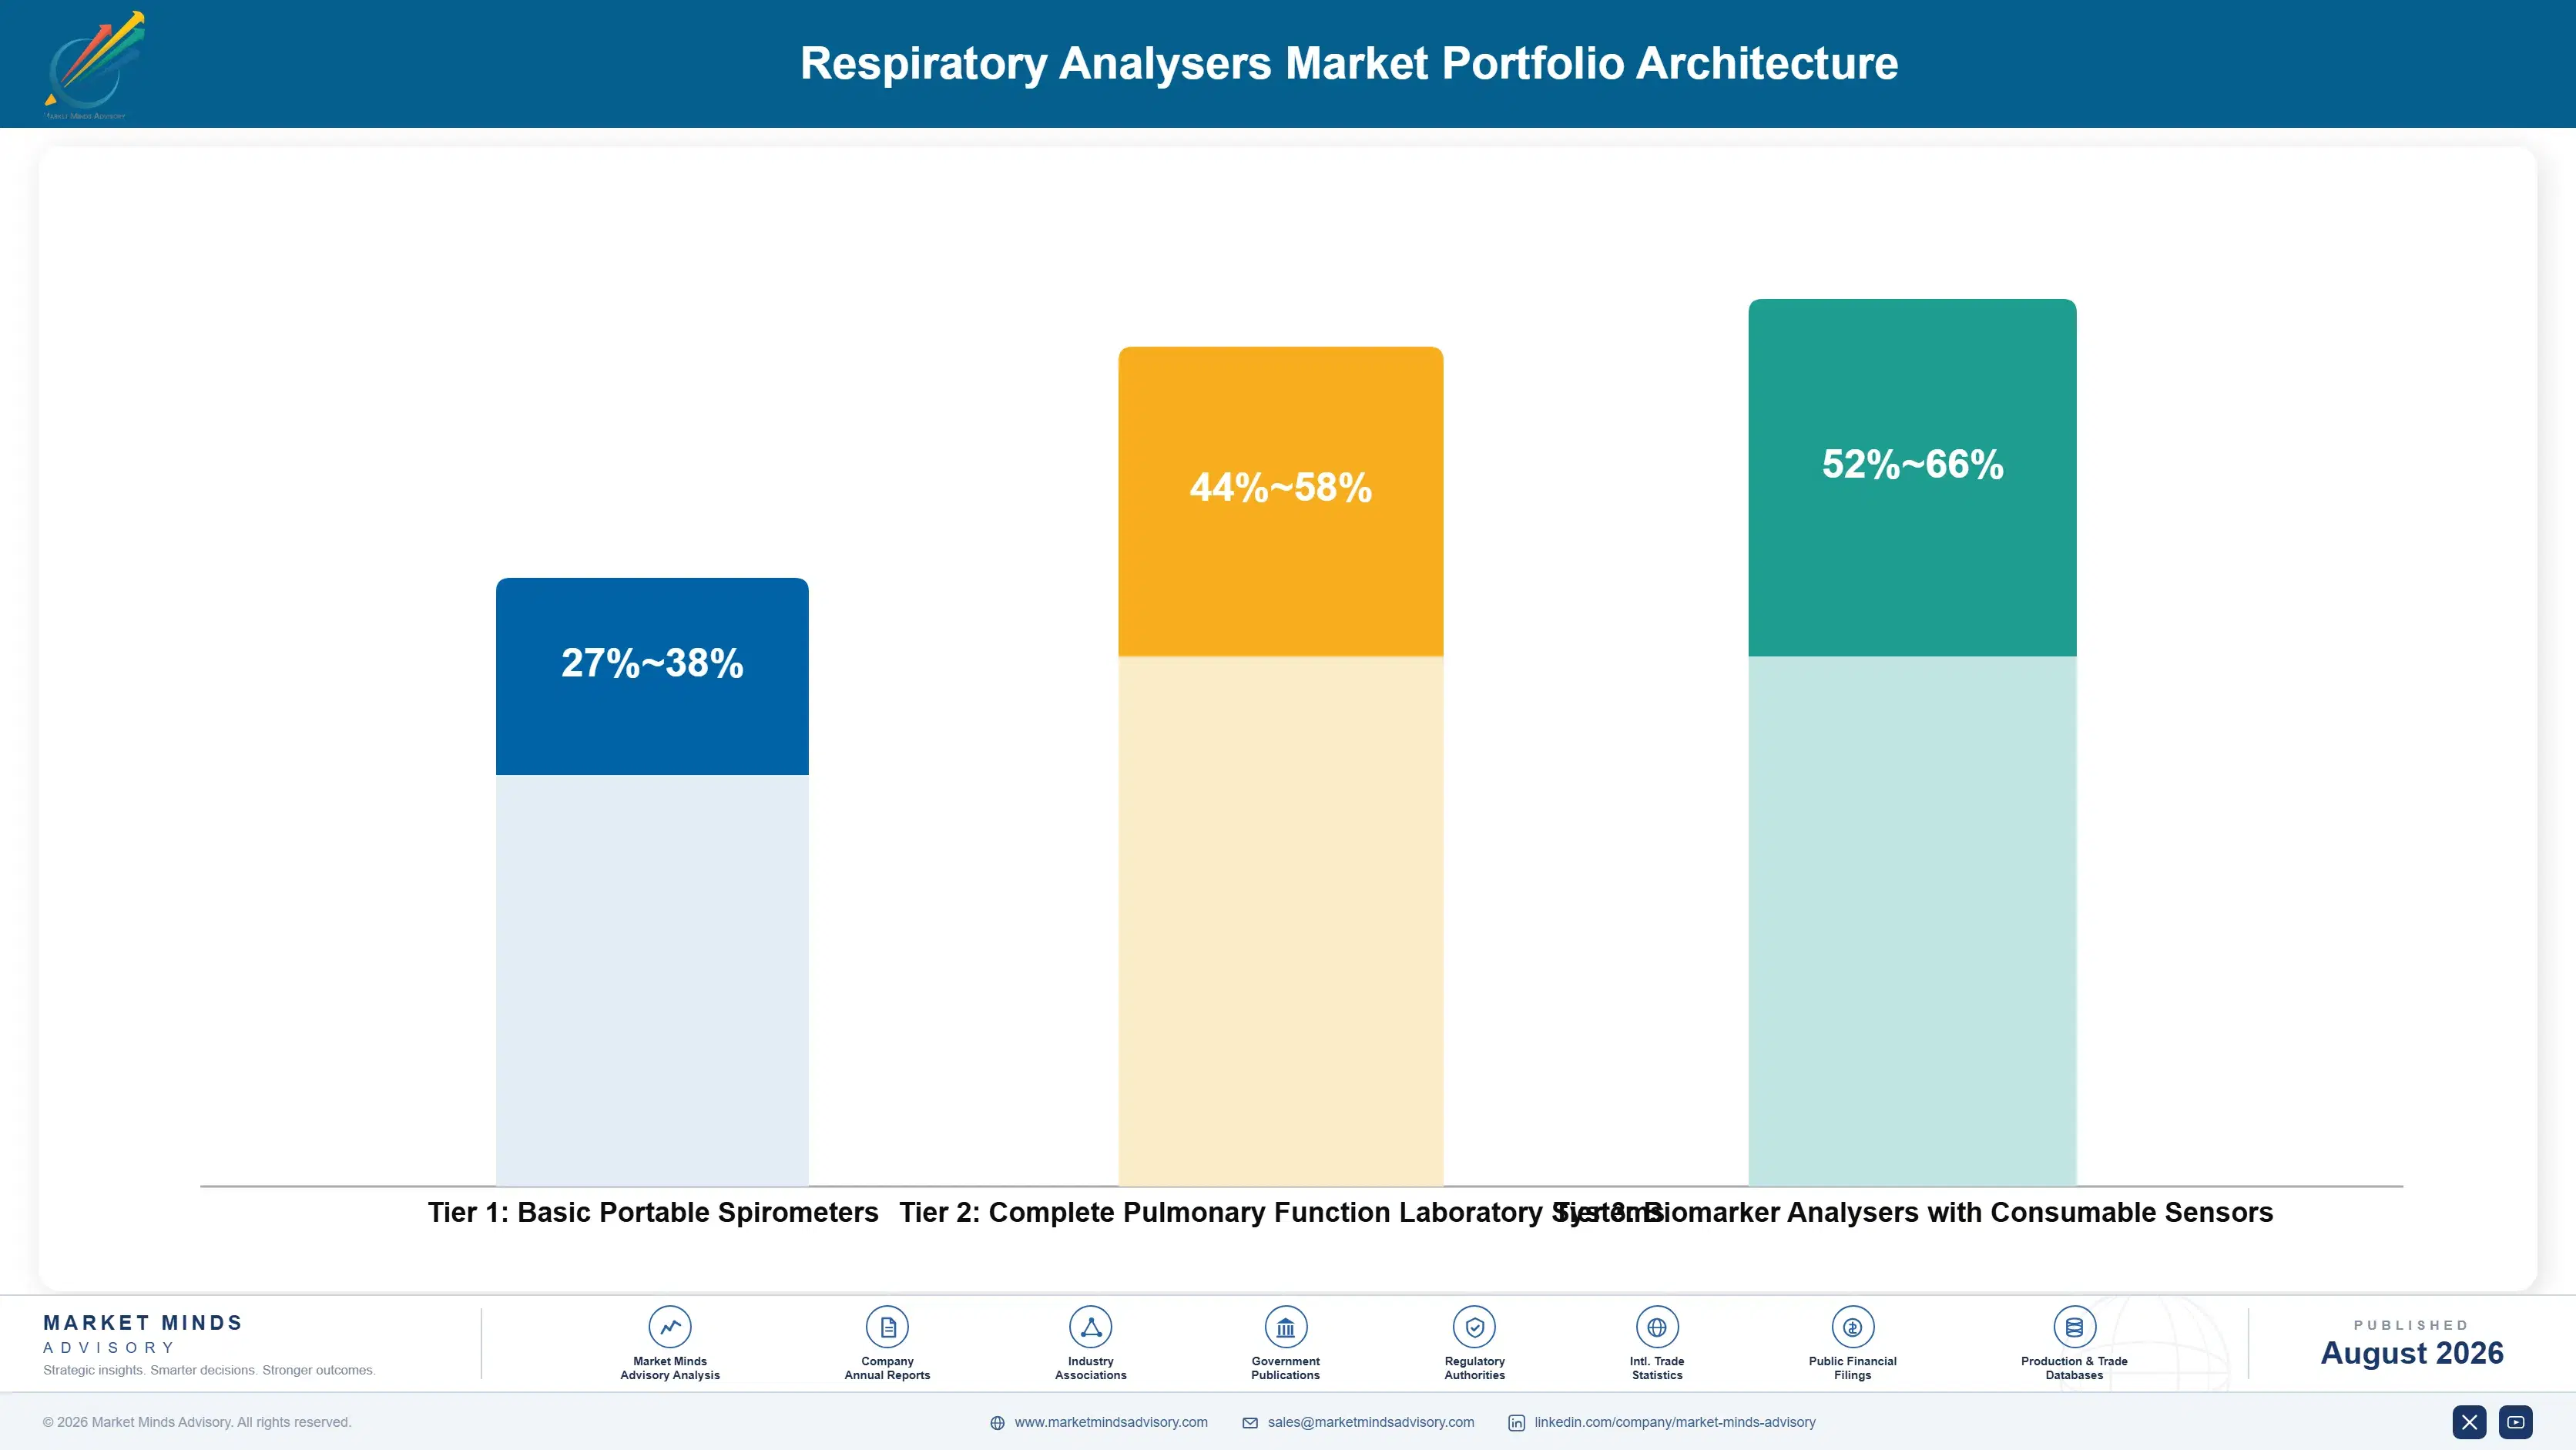
Margin here follows software and consumable attachment far more than hardware content, which is not where most manufacturers direct their engineering effort. Basic portable spirometers sold into primary care earn margins in the high twenties to high thirties, because the hardware is straightforward, Chinese manufacturers compete hard on price and procurement compares specifications that all meet the same standard. Differentiation at this level is close to impossible on measurement alone.
Complete laboratory systems do considerably better in the mid forties to high fifties, because integrated software, consistent reporting across measurements and clinical validation depth are difficult to assemble and laboratories value not comparing results across different manufacturers' instruments. The range reflects portfolio breadth and installed base service relationships. Comparing results across different manufacturers' instruments introduces exactly the variability testing exists to eliminate.

Biomarker analysers with consumable sensors hold the strongest position, reaching into the mid sixties, because a modest device gates therapy costing around thirty-four thousand dollars annually and every test consumes a proprietary sensor. Those margins reflect the pathway the device sits in rather than anything about the instrument itself. Every test consumes a proprietary sensor, which recurs monthly rather than every nine years.

Basic Portable Spirometers

Handheld and desktop spirometers for primary care and occupational screening. The eleven point range reflects manufacturing scale and channel position rather than measurement difference, since all approved devices meet the same standard.
Gross Margin: 27-38%

Complete Pulmonary Function Laboratory Systems

Integrated plethysmography, diffusion and exercise testing systems with unified software and reporting. The fourteen point range reflects portfolio breadth and the depth of installed base service relationships behind each placement.
Gross Margin: 44-58%

Biomarker Analysers with Consumable Sensors

Exhaled nitric oxide and related biomarker devices with proprietary consumable sensors. The fourteen point range reflects the prescribing pathway the device sits within rather than any difference in the instrument itself.
Gross Margin: 52-66%
respiratory-analysers-market-portfolio-architecture-1787594902631

High-value Sub-segments and Strategic Watch-out

Biomarker Analysers with Consumables

High value and the fastest growth at 11.4%, since a cheap test gating therapy costing around thirty-four thousand dollars annually is an unusually strong device position. Consumable sensors turn each placement into recurring revenue rather than a single capital sale. Payers increasingly require the documented result.
Gross Margin: 54-66%

Quality-Graded Decentralised Devices

High value and growing as roughly 43% of devices now sit where no technician coaches the manoeuvre. Automated grading addresses the 31% failure rate directly, and procurement is starting to require it rather than merely prefer it. A poor manoeuvre looks like restriction to anyone reading the number afterwards.
Gross Margin: 38-52%

Basic Portable Spirometers

The volume core, where every approved device meets the same measurement standard and Chinese manufacturers compete hard on price. Procurement compares specifications that are functionally identical, which leaves very little room to differentiate. Chinese manufacturers compete hard across this whole tier. Specifications are functionally identical throughout.
Gross Margin: 27-38%

Laboratory System Replacement Demand

The strategic watch-out. A nine year service life stretches under budget pressure with no clinical penalty, and the range reflects how far manufacturers have built software revenue to bridge the gap between hardware sales. Working devices keep producing valid results indefinitely. Budget pressure stretches the cycle further still.
Gross Margin: 34-58%

Nine Years Between Purchases

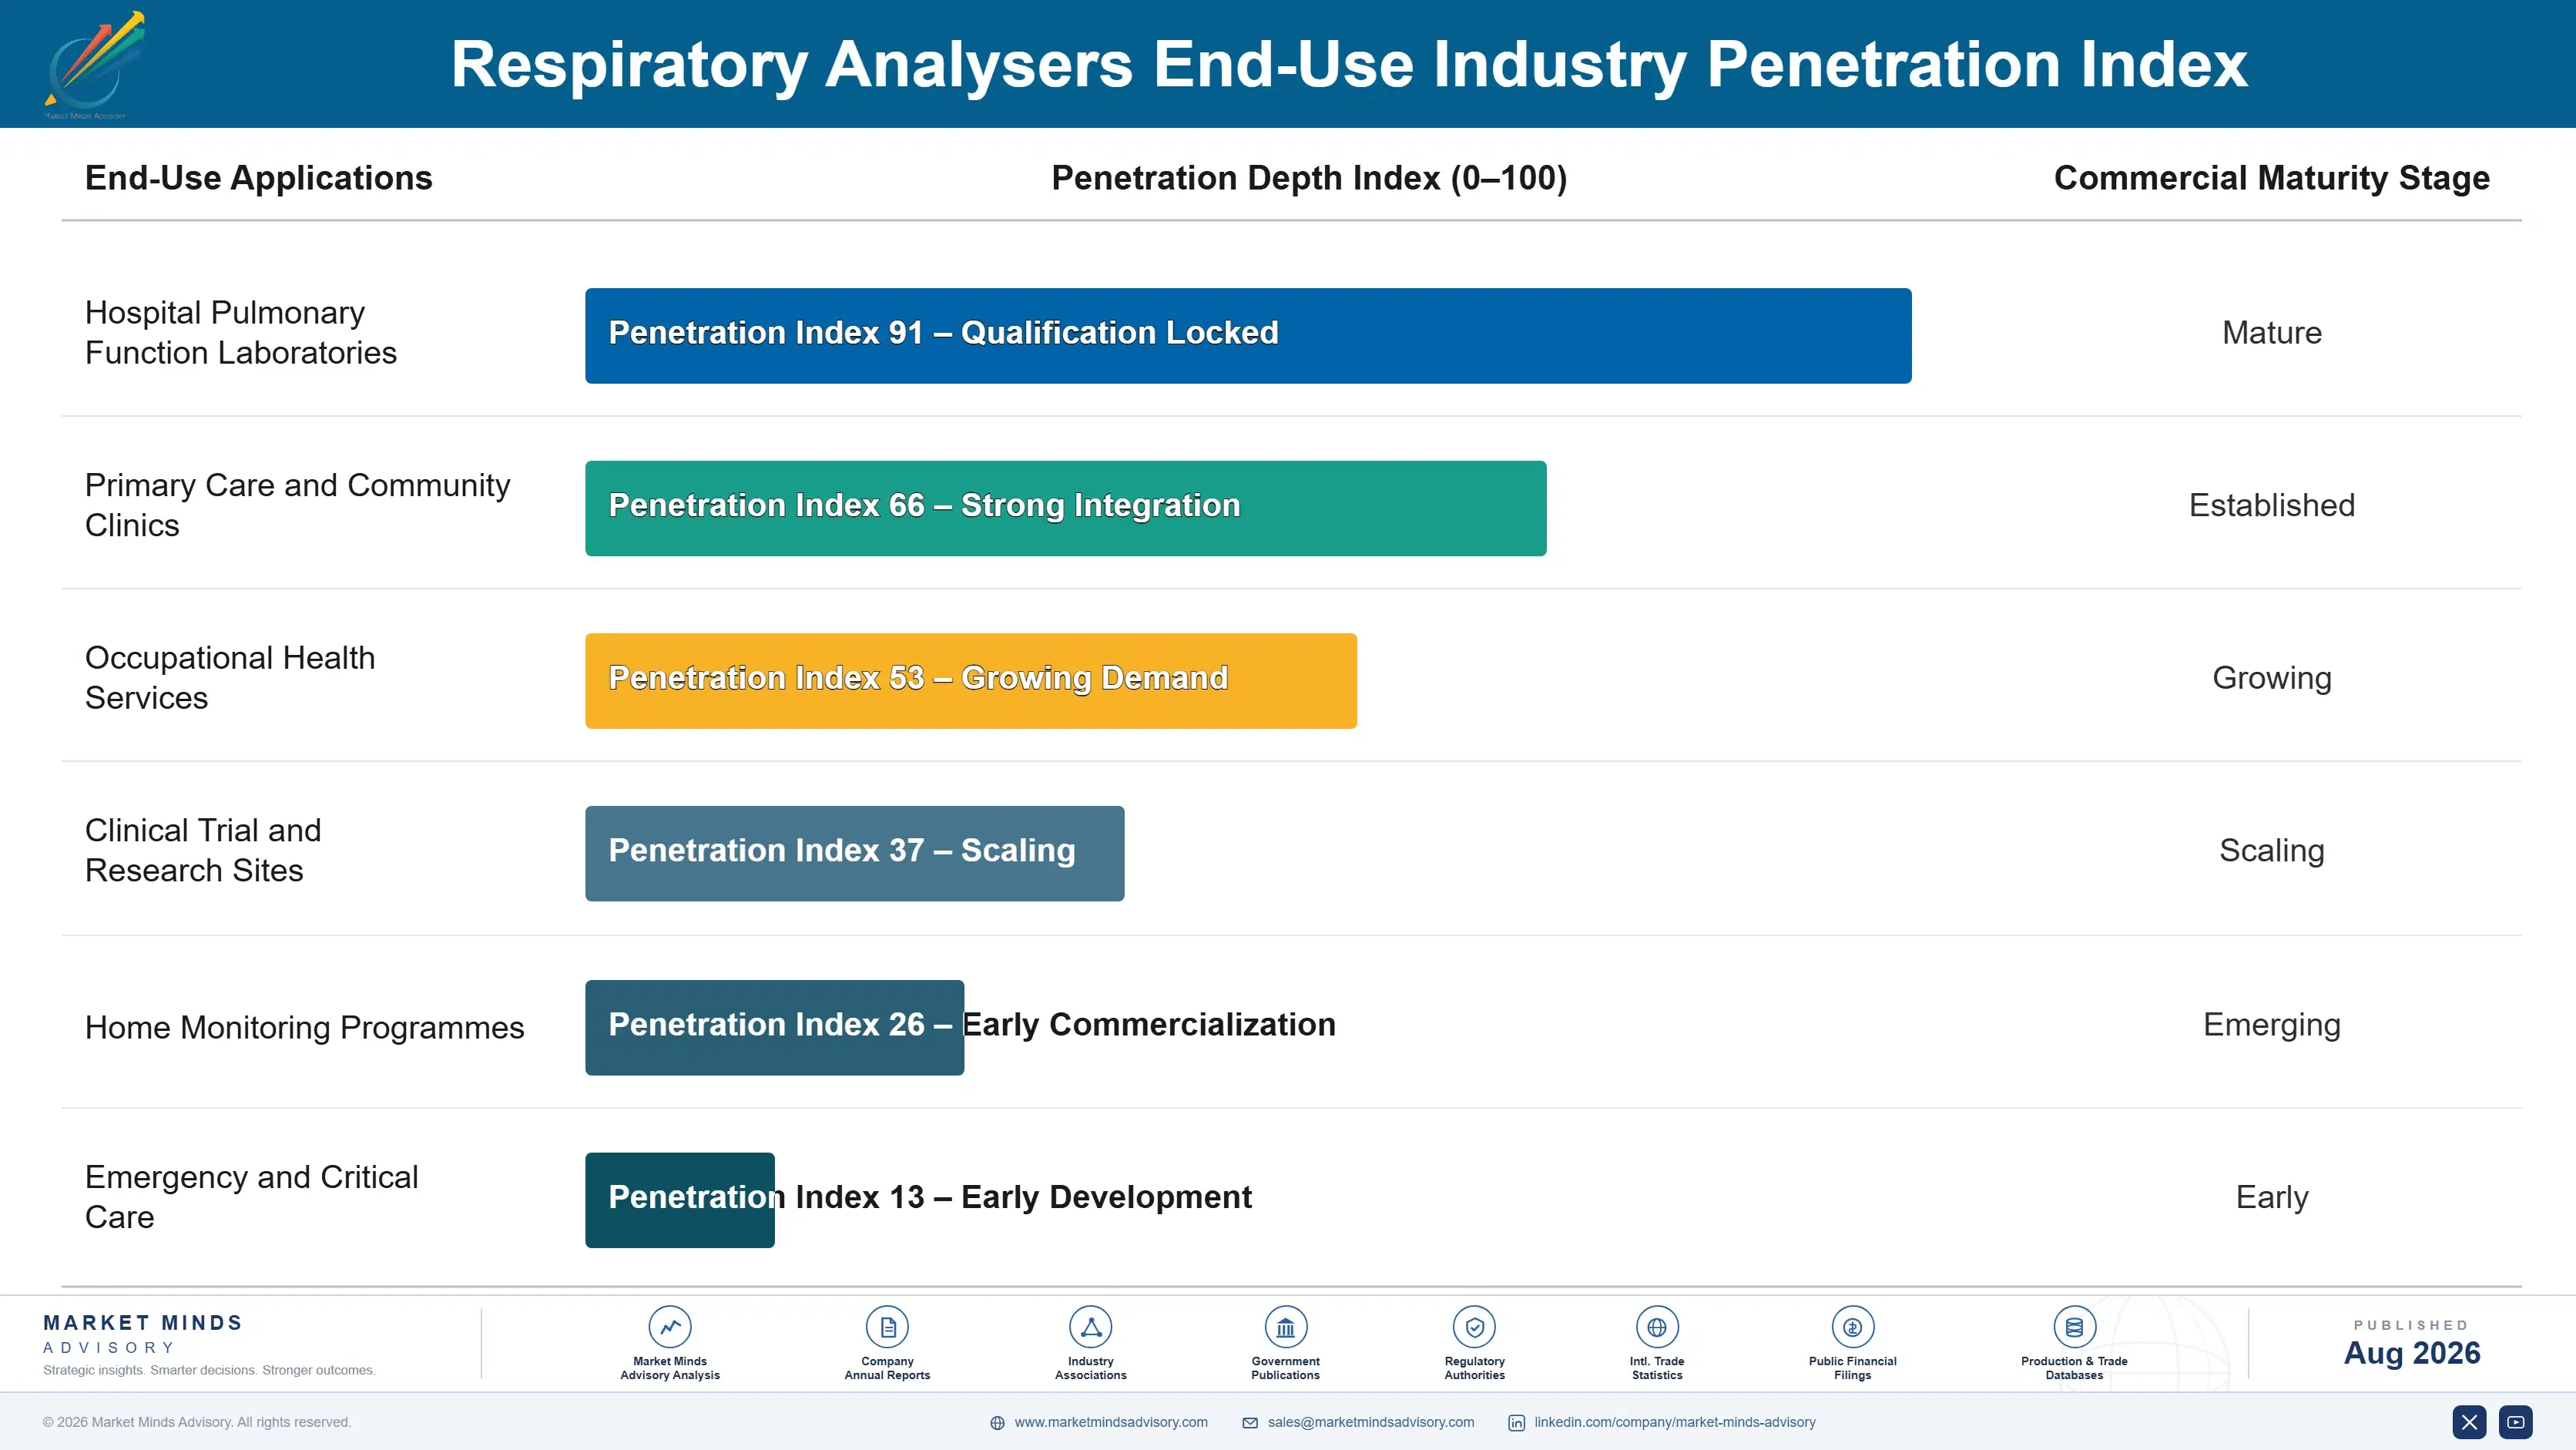
A pulmonary function analyser works for around nine years and frequently longer, which means a manufacturer sells to the same laboratory roughly three times in a career. That is an unusually long gap for a device business and it produces very little revenue in between unless consumables or software subscriptions bridge it. The purchase decision, when it comes, weighs the whole period ahead rather than the immediate specification. Very little happens commercially in between.
Stickiness depends on what happens during those nine years. A manufacturer maintaining reference equations, quality algorithms and reporting software stays present continuously and is difficult to displace at replacement. One that ships a device and disappears has no relationship to defend when the tender comes. Consumable-dependent devices are stickier still, since every test consumes a proprietary sensor and switching costs recur monthly.

The deciding voice sits with respiratory physiologists and clinical scientists rather than with hospital procurement, which handles the transaction afterwards. Biomarker devices are the exception, being decided within the biologic prescribing pathway by respiratory physicians and increasingly influenced by payers who require documented results before authorising a therapy costing tens of thousands annually. That is a different buyer entirely.
respiratory-analysers-market-end-use-penetration-index-1787594903144

Where We Would Focus Effort

These are among the four positions where our research anticipates prominent divergence between winners and laggards over the coming forecast period. Each is grounded in the demand model, the regulatory perimeter, and the announced capacity pipeline.
01 / TEST QUALITY AUTOMATION

Fix the coaching, not the flow sensor

Around 31% of spirometry tests fail published acceptability criteria, and a poor manoeuvre produces a misleading result rather than an obvious failure because under-effort closely resembles genuine restriction. Automated grading with real-time coaching prompts addresses the actual source of diagnostic error, while sensor improvement addresses a problem the industry solved decades ago. As roughly 43% of devices move outside laboratories, the device that coaches well will beat the one that measures marginally better in essentially every one of those settings.
02 / PRESCRIBING PATHWAY ATTACHMENT

A cheap gate on an expensive therapy

Asthma biologics cost around thirty-four thousand dollars per patient annually and require phenotype selection before prescribing, which makes a modest exhaled nitric oxide analyser the gate on that spending. Positioning the device inside the prescribing pathway reaches respiratory physicians and payers rather than equipment purchasing committees weighing competing capital budgets. Demand then tracks biologic prescribing rather than general testing volumes, and consumable sensors turn each placement into recurring revenue instead of a single capital sale made once and then forgotten.
03 / SOFTWARE CURRENCY OWNERSHIP

Nine years of hardware, nine years of software

Reference equation revision reclassified roughly 14% of patients and required a software update on every installed analyser, which was the most direct contact manufacturers had with their entire installed base in an entire decade. Responding quickly built credibility with laboratories while responding slowly destroyed it entirely and rather visibly. Treating reference currency and quality algorithms as a continuously maintained service rather than a shipped software feature creates the recurring relationship that a nine year hardware life would otherwise prevent entirely.
04 / DECENTRALISED SETTING DESIGN

Build for the room with nobody in it

Roughly 43% of devices now sit in primary care, occupational health and patients' own homes, where nobody coaches the manoeuvre and the 31% failure rate is very likely worse rather than better. Designing for that reality means guided workflows, automatic rejection of poor efforts and remote review by a specialist who never meets the patient at all. Manufacturers still designing around a trained laboratory technician are building for a steadily shrinking share of their own installed base with every passing year.

Engagement Snapshot From the Field

A live engagement with an industry participant carrying material or product regulatory and market exposure ahead of a defining policy shift, showing how our research translates into a defensible multi-year portfolio strategy.
MARKET MINDS ADVISORY · CLIENT ENGAGEMENT SUMMARY
Respiratory Analysers Producer Strategic Portfolio Review and Transition Roadmap 2026·Investment Scenario on Respiratory Analysers Exposure Evaluation 2025-26
CLIENT PROFILE
A European manufacturer of pulmonary function equipment supplying complete laboratory systems and desktop spirometers across fifteen countries, at annual revenue near 88 million euros (client-reported, unverified by MMA). Engineering investment concentrated on flow measurement accuracy, software was shipped rather than maintained, and no biomarker analyser existed anywhere in the portfolio or anywhere in active development.
STRATEGIC CHALLENGE
Laboratory system sales had been flat for four years while a competitor grew strongly in primary care, and the reference equation transition had exposed how slowly the company could update its installed base. Management were planning further investment in sensor accuracy and wanted validation that this was where competitive difference actually came from.
MMA APPROACH
MMA assessed test acceptability rates across the client's installed base against competitor devices with automated grading, quantified the installed base share sitting outside pulmonary function laboratories, benchmarked software maintenance models against shipped-software approaches, and sized biomarker analyser opportunity against biologic prescribing volumes. Interviews with 47 experts covered respiratory physiology, primary care testing and device procurement.
KEY FINDINGS
  1. Test acceptability rates on the client's devices in primary care settings were materially worse than in laboratories, and no mechanism existed for anyone to identify unusable results.
  2. Sensor accuracy differences between the client and every serious competitor were far below the variability introduced by patient effort, making further investment there clinically irrelevant.
  3. Competitor devices with automated grading were being specified into procurement lists that excluded the client entirely, on capability rather than on price or measurement performance.
  4. Biomarker analyser placement in the client's territories was growing rapidly on biologic prescribing, in a pathway the commercial organisation had never engaged with at any level.
CLIENT PROFILE
A European manufacturer of pulmonary function equipment supplying complete laboratory systems and desktop spirometers across fifteen countries, at annual revenue near 88 million euros (client-reported, unverified by MMA). Engineering investment concentrated on flow measurement accuracy, software was shipped rather than maintained, and no biomarker analyser existed anywhere in the portfolio or anywhere in active development.
STRATEGIC CHALLENGE
Laboratory system sales had been flat for four years while a competitor grew strongly in primary care, and the reference equation transition had exposed how slowly the company could update its installed base. Management were planning further investment in sensor accuracy and wanted validation that this was where competitive difference actually came from.
MMA APPROACH
MMA assessed test acceptability rates across the client's installed base against competitor devices with automated grading, quantified the installed base share sitting outside pulmonary function laboratories, benchmarked software maintenance models against shipped-software approaches, and sized biomarker analyser opportunity against biologic prescribing volumes. Interviews with 47 experts covered respiratory physiology, primary care testing and device procurement.
KEY FINDINGS
  1. Test acceptability rates on the client's devices in primary care settings were materially worse than in laboratories, and no mechanism existed for anyone to identify unusable results.
  2. Sensor accuracy differences between the client and every serious competitor were far below the variability introduced by patient effort, making further investment there clinically irrelevant.
  3. Competitor devices with automated grading were being specified into procurement lists that excluded the client entirely, on capability rather than on price or measurement performance.
  4. Biomarker analyser placement in the client's territories was growing rapidly on biologic prescribing, in a pathway the commercial organisation had never engaged with at any level.
RECOMMENDED STRATEGY
Phase 1: Phase one: redirect engineering investment from flow measurement into automated quality grading and coaching, since effort variability dwarfs any sensor difference. Phase 2: Phase two: convert software from a shipped feature into a maintained subscription covering reference currency, grading algorithms and clinical reporting. Phase 3: Phase three: enter biomarker analysis, reaching respiratory physicians directly through the biologic prescribing pathway rather than through equipment procurement committees.
OUTCOME
The manufacturer released automated grading across its spirometry range during 2026 and regained inclusion on two national procurement lists (client-reported, unverified by MMA). Software subscription was introduced with laboratory customers, and a biomarker analyser partnership was under negotiation at the year end. Sensor development investment was halted entirely.

Frequently Asked Questions

Foundational context covering the market sizes, CAGR, scope, country, region and competition that inform every finding below. This section is provided to cover basics and most often pre-purchase conversations, answered from the MMA Primary Research Dataset.

What is the current size of the Respiratory Analysers Market?

MMA sizes it at USD 1.58 billion in 2025, rising to USD 1.70 billion in 2026. The figure covers instruments measuring respiratory gases, airflow and lung mechanics at manufacturer selling value.

How large will the Respiratory Analysers Market be by 2036?

USD 3.54 billion by 2036, an incremental USD 1.84 billion over the 2026 base and an expansion multiple of 2.08 times. Biomarker analysers account for a disproportionate share.

What is the CAGR for the Respiratory Analysers Market 2026 to 2036?

7.6% in the base case, with a bull case at 8.8% and a bear case at 6.4%. The spread turns on decentralised testing reliability and on laboratory replacement cycles.

Which segment is growing fastest?

Exhaled nitric oxide analysers at 11.4%, half again the market rate of 7.6%. They gate access to asthma biologics costing around thirty-four thousand dollars per patient annually.

Who are the major companies in the Respiratory Analysers Market?

COSMED, MGC Diagnostics, ndd Medical Technologies, Nihon Kohden and Schiller lead on analyser revenue including consumables. Fifteen further participants are profiled in the full report.

Which country is growing fastest?

China at 11.0%, as pulmonary function testing enters national public health screening against the largest chronic obstructive pulmonary disease burden anywhere in the world today.

Report Segmentation Architecture

The full report scope spans multiple orthogonal segmentation dimensions, with cross-tabulated demand data provided for each dimension pair. Coverage extends further to regional breakdowns, trend trajectories, and the competitive detail needed to support segment-level decision-making.

By Analyser Type

  • Spirometers
  • Body Plethysmographs and Lung Volume Systems
  • Gas Diffusion Systems
  • Exhaled Nitric Oxide Analysers
  • Capnographs and Respiratory Gas Monitors
  • Cardiopulmonary Exercise Testing Systems

By End-Use Industry

  • Hospital Pulmonary Function Laboratories
  • Primary Care and Community Clinics
  • Occupational Health Services
  • Clinical Trial and Research Sites
  • Home Monitoring Programmes
  • Emergency and Critical Care

By Commercial Dimension

  • Direct Hospital Supply
  • Distributor and Dealer Channels
  • National Procurement Frameworks
  • Consumable and Sensor Supply
  • Software Maintenance Subscriptions
  • Export and Cross-Border Supply

By Region

  • North America
  • Western Europe
  • East Asia
  • South Asia and Pacific
  • Latin America
  • Middle East and Africa
  • Eastern Europe

Scope, Methodology, and Coverage

Every figure in this report is reproducible from documented input assumptions. The scope below maps the historical period, the forecast horizon, the segmentation dimensions, and the countries covered, alongside the underlying primary and qualitative methodology.
Historical Period
2020 to 2025
Forecast Period
2026 to 2036
Base Year
2025 (USD billions; MMA Primary Research Dataset, August 2026)
Market Definition
Instruments measuring respiratory gas composition, airflow and lung mechanics for diagnosis and monitoring, covering spirometers, body plethysmographs and lung volume systems, gas diffusion systems, exhaled nitric oxide analysers, capnographs and respiratory gas monitors, and cardiopulmonary exercise testing systems. Measured at manufacturer selling value including consumables and maintained software. Ventilators, oxygen therapy equipment, blood gas analysers, sleep diagnostic devices and thoracic imaging systems are excluded from scope.
Quantitative Units
USD billions (current prices); thousand devices installed; USD per device by analyser type
Segmentation Dimensions
Analyser type; care setting; commercial dimension; region
Regions Covered
North America, Western Europe, East Asia, South Asia and Pacific, Latin America, Middle East and Africa, Eastern Europe
Countries Covered
United States, Canada, Mexico, Germany, France, United Kingdom, Italy, Spain, Netherlands, China, Japan, South Korea, India, Indonesia, Australia, Brazil, Saudi Arabia, United Arab Emirates, Poland, Czech Republic
Key Companies Profiled
COSMED, MGC Diagnostics, ndd Medical Technologies, Nihon Kohden, Schiller, Masimo, Medtronic, Philips, Draegerwerk, GE HealthCare, Hamilton Medical, Fukuda Denshi, Vitalograph, Geratherm Medical, SDI Diagnostics, NIOX Group, Bedfont Scientific, Contec Medical Systems, Chest M.I., Morgan Scientific
Quantitative Methodology
Primary survey, n=3,800 respondents, Q4 2025, six countries; demand-side model with trade association cross-validation
Qualitative Methodology
47 expert interviews, Q4 2025; applied to validate demand model assumptions, identify emerging dynamics, and assess competitive positioning
Report Format
PDF and XLSX data workbook (Word format preview document)
Publisher
Market Minds Advisory
Report Code
MMA-2026-MED-117
Published
August 2026
Contact
sales@marketmindsadvisory.com | www.marketmindsadvisory.com

Purchase the full Respiratory Analysers Market Report (2026 to 2036).

The full report treats test quality rather than measurement accuracy as the commercial variable, because effort variability dwarfs any difference between approved instruments. It sizes all six analyser types independently through 2036, quantifies the installed base sitting outside pulmonary function laboratories, and assesses reference equation transition responsiveness by manufacturer across the affected installed base. Regional chapters cover all seven regions with installed base and value tracked separately, since screening programmes expand units far faster than value. Competitive profiling covers 20 participants on a single revenue basis.
Six analyser types sized independently through 2036
Test acceptability rates assessed across care settings
Installed base outside laboratories quantified by region
Reference equation responsiveness benchmarked across every manufacturer
Twenty participants profiled on one consistent revenue basis
Biomarker placement tracked against biologic prescribing volumes

Built For The People Who Decide

From boardroom strategy to bench-side execution, this report is read cover-to-cover by leaders shaping the next decade of their industry, turning demand scenarios, market dynamics and valuation benchmarks into decisions.
CXOs/ Presidents/ VPs/ Managers
M&A and Corporate Development
Strategy Teams and R&D Heads
Procurement and Product Directors
Regulatory and Compliance Leaders
Investor Relations and Equity Analysts