

Market Minds Advisory
Residential Solar Generator Market

Residential Solar Generator Market: Residential Solar Generator Market: Sold Eleven Days After The Lights Go Out

Nobody buys one of these because they care about carbon. They buy it eleven days after the lights went out and stayed out, which is a very different product to sell.

Lead Analyst

Published

September 2026

Make Smarter Decisions with Customized Research Insights

Request a free sample report and evaluate market opportunities, growth trends, and competitive dynamics relevant to your business needs.

2025 MARKET VALUE$5.8BMarket Size 2025
2036 FORECAST VALUE$20.2BBase Case , 2026 to 2036
CAGR 2026 TO 203612.0 %Bull 13.2% / Bear 10.8%
INCREMENTAL OPPORTUNITY$13.7BNet 10- year value creation
EXPANSION MULTIPLE3.11x2036 value over 2026 base
Strategic Levers
M&A Pipeline
Regional Outlook
Country Rankings
Competitive Intelligence
Segmental Deep-dive
Call-Us : 91 93563 13602

Executive Snapshot and Market Trajectory.

Demand here is event-driven and the events are outages, not policy. Median purchase comes eleven days after a major grid failure, which means this category is sold through search advertising and e-commerce in a narrow window rather than through installers working any kind of pipeline at all.
Expandable modular home systems grow at 18.0%, half again the market rate of 12.0%, because a household that bought a portable unit after one outage adds capacity after the next, and the brands built the connectors to let them. East Asia holds 29% of demand narrowly ahead of North America, on Japanese disaster preparedness that municipalities actively encourage and a Chinese outdoor recreation market nobody outside the region tracks. The gap there is narrow.
Concentration is high at 47% of unit shipments and every one of the five leaders is a Shenzhen company that built a global consumer brand without using Western distribution at all. That is unusual for a consumer durable and it matters commercially, because the incumbents in adjacent categories never had a channel to defend here. Generator makers and battery installers both discovered that fact far too late to matter.
Market Definition
The residential solar generator market covers standalone battery and inverter systems sold to households with solar charging capability, spanning portable power stations under one kilowatt hour, mid-capacity portable units between one and three kilowatt hours, expandable modular home systems between three and ten kilowatt hours, whole-home backup systems above ten kilowatt hours, solar panel kits and charging accessories, and off-grid cabin and recreational systems. Scope covers retail sale to households through all channels. Excluded are grid-tied rooftop photovoltaic installations, permanently wired home battery systems requiring an electrician, fossil-fuelled generators, commercial and industrial storage, and utility-scale equipment.
Base Year Value
$5.8B in 2025 (MMA Primary Research Dataset, September 2026)
Forecast Period
2026 to 2036, eleven discrete annual values
CAGR
12.0% base case. Bull 13.2%. Bear 10.8%.
Fastest Growth Segment
Expandable Modular Home Systems: 18.0% CAGR
Fastest Growth Country
India: 14.2% CAGR
Fastest Growth Region
South Asia and Pacific: 14.2% CAGR
Largest Region
East Asia: 29% of 2025 global value
Market Leaders
EcoFlow, Jackery, Anker Innovations, BLUETTI and Goal Zero. Source: MMA Analysis, July 2026.
Primary Survey
n=3,800 procurement and R&D decision-makers, Q4 2025, six countries
Methodology
Demand-side build-up, cross-validated against public data, 47 expert interviews

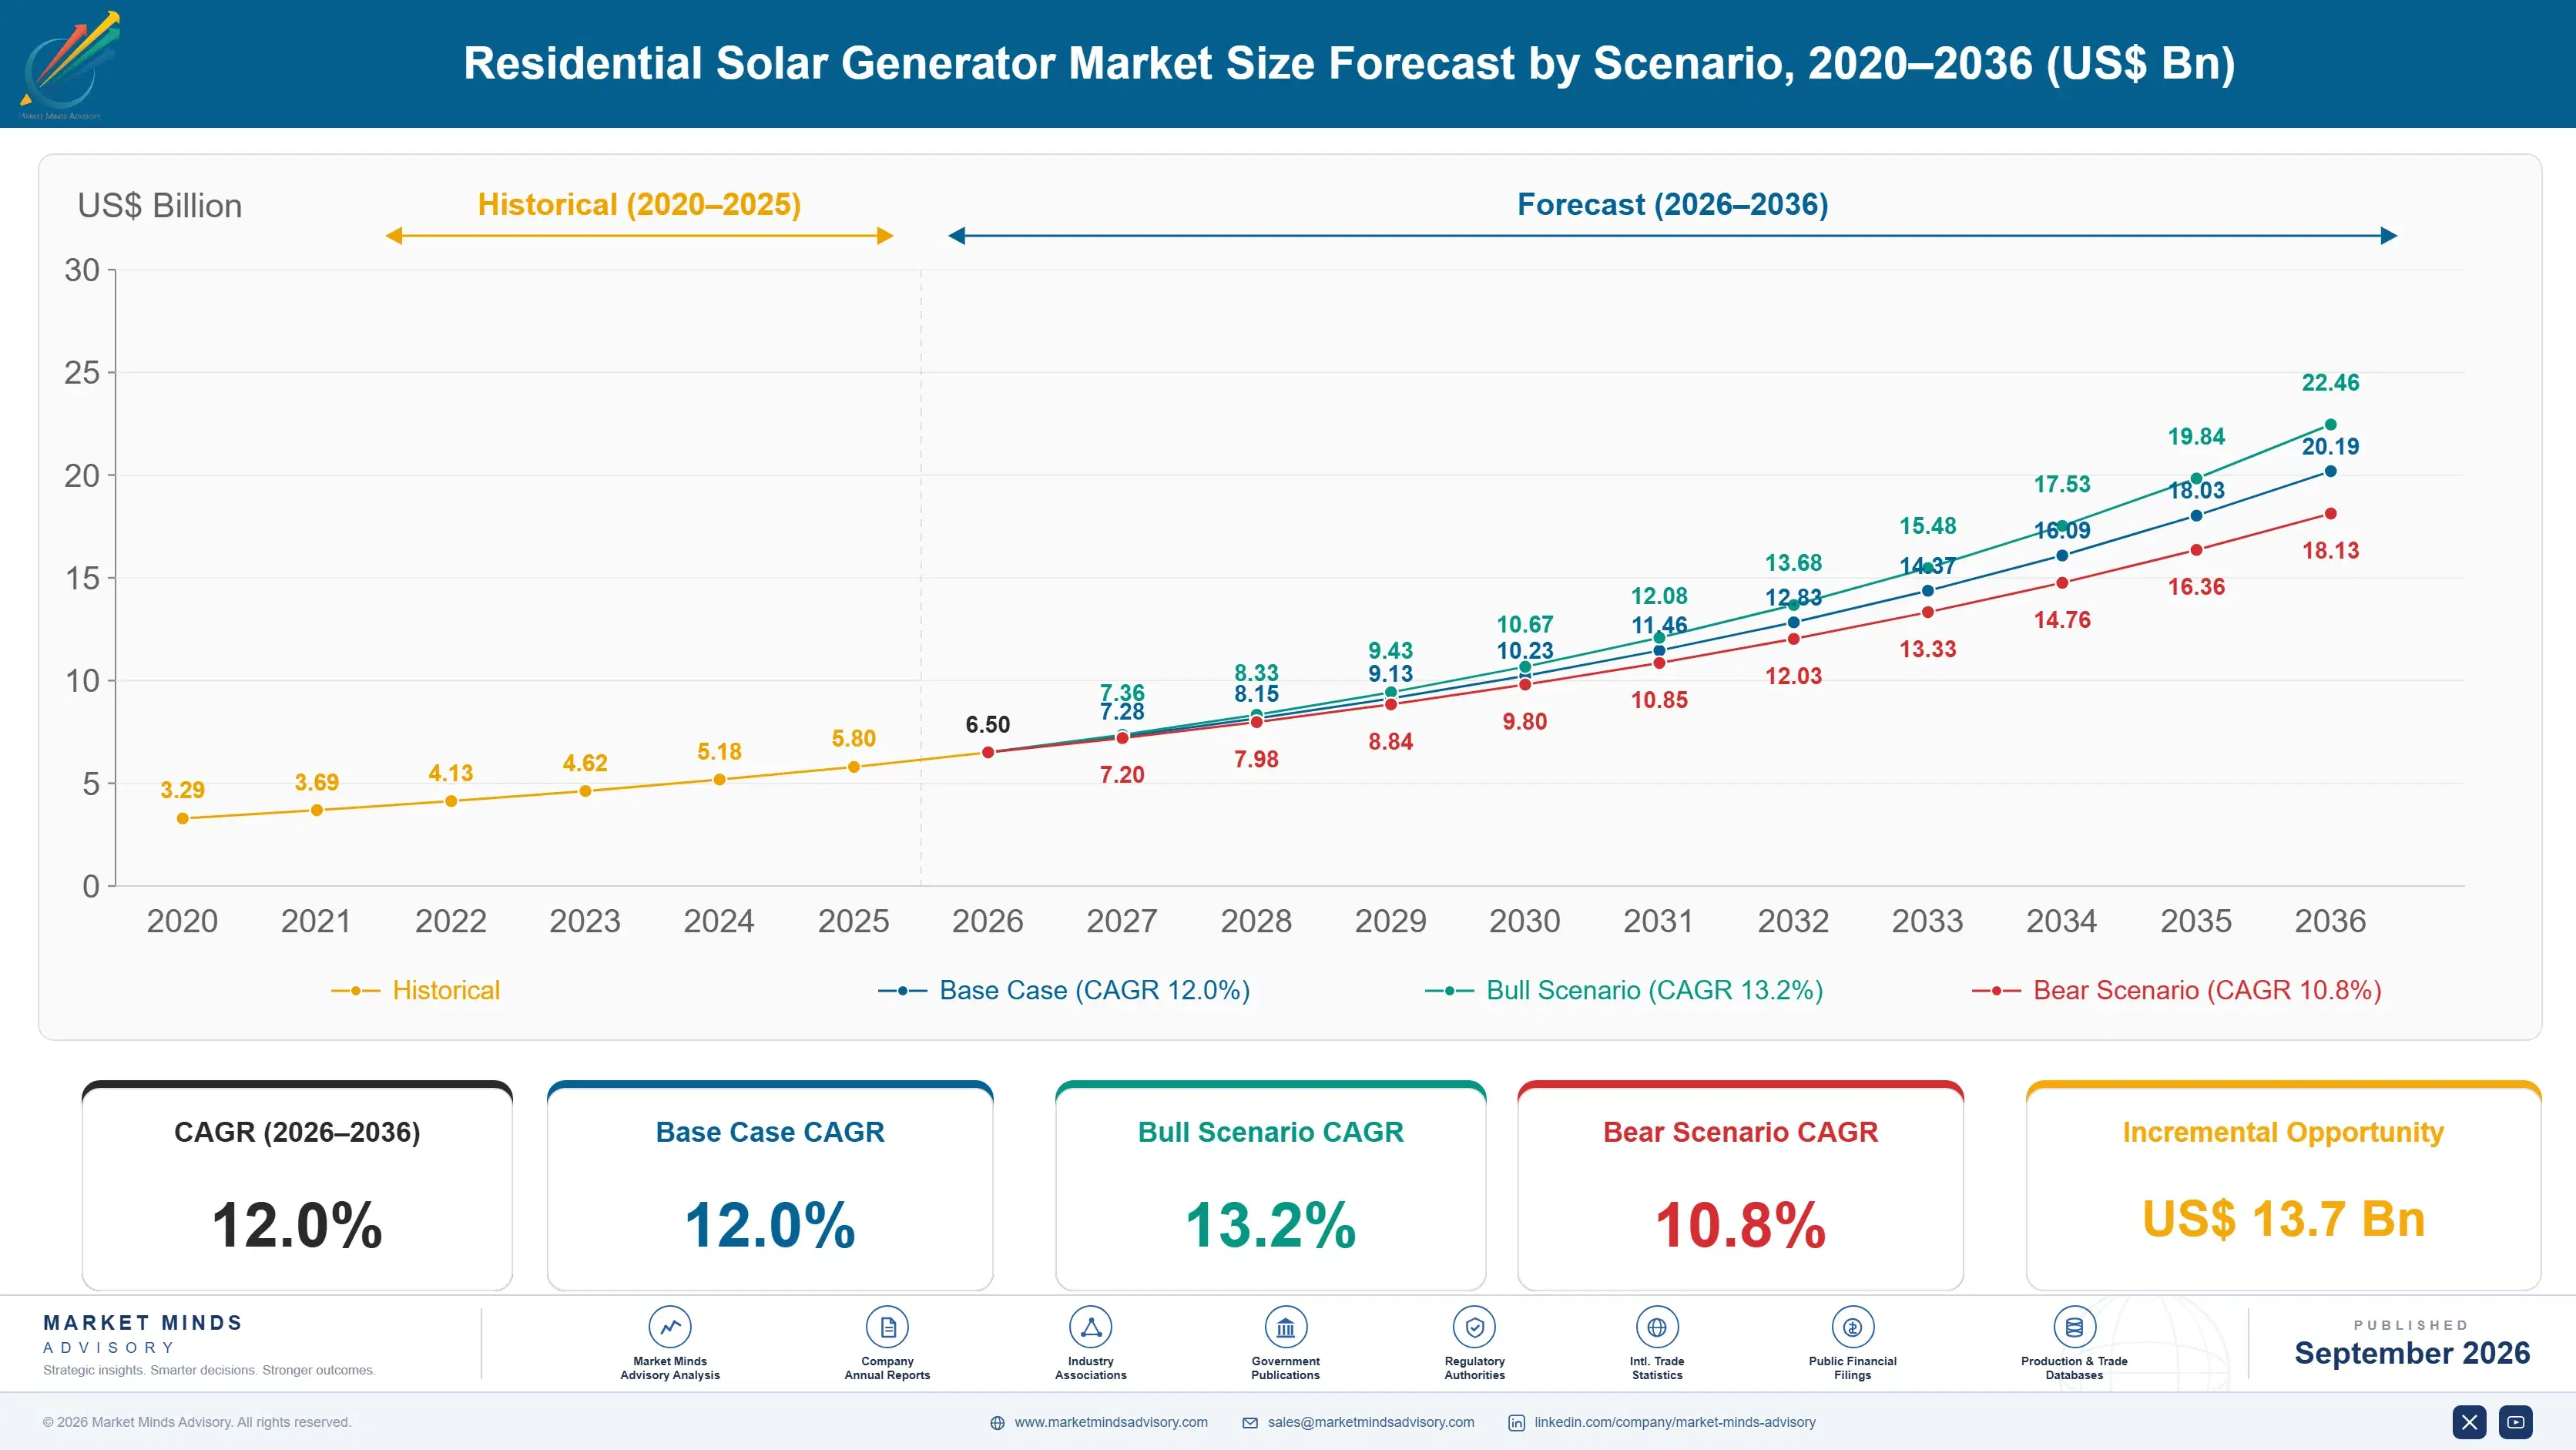
Residential Solar Generator Market Forecast Scenarios

residential-solar-generator-market-size-forecast-scenario-1788234715792
Between 2020 and 2025 the sector compounded at 10.8% and two things drove almost all of it. Lithium iron phosphate cells replaced nickel-based chemistry, which multiplied cycle life and removed the thermal concern that kept a large battery out of the living room. And a run of severe outages across Texas, California and Japan taught households exactly what the product was for.
The 12.0% base case rests on three mechanisms. Grid reliability is deteriorating measurably across North America and parts of Europe as ageing networks meet more extreme weather, and each event converts a block of households into buyers. Modular expandability turns a single purchase into a sequence, because a household that bought two kilowatt hours adds two more after the next outage. And unit prices keep falling as cell costs fall. None of the three depends on any subsidy.
The bull case at 13.2% turns on modular systems reaching whole-home capability at prices that undercut a wired home battery, which would move this out of emergency backup and into everyday use. The bear case at 10.8% is trade measures: every leading brand manufactures in China, and tariffs on battery products would raise prices across the entire category.

Eleven Days After The Outage

The purchase is emotional, immediate and almost entirely reactive. Median buying peaks eleven days after a major outage, once the household has been through the experience, argued about it and found the credit card. That window closes quickly and decides the commercial model: 58% of volume moves direct, because a brand bidding on search terms the morning after a storm reaches buyers no shelf can.
TOP FIVE CONCENTRATION47%Share of retail unit shipments held by five brands
AVERAGE SELLING PRICEUSD 690Mean retail price per unit across all capacity classes
CELL CYCLE LIFE4,000 cyclesCharge cycles delivered before capacity falls below rated threshold
CELL COST SHARE43%Portion of unit cost accounted for by battery cells
POST-OUTAGE PURCHASE WINDOW11 daysMedian time between a major outage and peak buying
DIRECT CHANNEL SHARE58%Portion of volume sold without any physical retail intermediary
One chemistry change created the category. Lithium iron phosphate cells deliver around 4,000 cycles against a few hundred for the nickel chemistries used first, without the thermal runaway profile that made a large battery indoors feel risky. Cost per kilowatt hour fell far enough to make the swap free. What had been a camping accessory became something a household would keep in a hallway.
Competition comes from two directions and the middle is where this product wins. A petrol generator costs less and runs indefinitely, but it is loud, needs fuel during a fuel shortage and cannot run indoors. A wired home battery does more and costs several times as much. The solar generator asks for neither a permit nor an installer, which is most of its appeal.
"This industry keeps describing itself as clean energy and its customers keep describing it as insurance. The brands that write outage preparedness copy rather than emissions copy are converting at rates the sustainability messaging never came close to."
Director, Distributed Energy Products Practice · MMA Technology Practice · September 2026

Market Trends

Iron phosphate chemistry made indoor batteries acceptable

Lithium iron phosphate cells deliver around 4,000 charge cycles against a few hundred from the nickel chemistries these products originally used, and they lack the thermal runaway behaviour that made households uneasy about keeping a large battery in a hallway. Falling cell prices made the substitution cost-free rather than a premium option. That single change turned a recreational accessory with a two-year useful life into a household appliance a family expects to keep for a decade, which is why average selling prices held up while unit costs fell steadily. Nothing else in this category mattered as much.
Market Impact: Peaks within 11 days of outage

Modular expansion converted one purchase into several

Manufacturers added expansion ports allowing extra battery modules to be clipped onto a base unit, which means a household buying two kilowatt hours after one outage can reach eight after three more without replacing anything. That turns a single transaction into a sequence, locks the customer to one brand's connector standard and lifts lifetime value well beyond what the first sale suggests. Expandable modular systems grow at 18.0% against a market rate of 12.0% as a result. It is the most consequential commercial decision anybody in this category has made.
Market Impact: Moves 58% without retail shelves

Market Opportunities and Growth Drivers

Grid reliability is deteriorating in wealthy markets

Outage frequency and duration have risen measurably across North America and parts of Western Europe as networks built decades ago meet more frequent extreme weather, and each significant event converts a block of households into buyers within days. Texas in 2021, repeated Californian public safety shutoffs and successive hurricane seasons each produced demand spikes visible in shipment data. The purchase is defensive rather than environmental, which most brands took several years to understand. Households are buying insurance against their own utility, and they say so plainly when asked. They call it insurance, not solar.
Market Impact: Costs 3 times a petrol unit

Direct commerce reaches buyers no retailer can

Some 58% of volume sells direct through brand websites and marketplaces, which matters because the buying window opens the morning after a storm and closes within a fortnight. A brand bidding on search terms in an affected region reaches a household while the experience is fresh, and no physical retailer can restock a store in that time. That capability is why Shenzhen brands with no Western distribution history took the category outright from established generator and battery names who owned every shelf that mattered. The channel was the whole advantage, and the incumbents never saw it coming at all.
Market Impact: Concentrates 5 of 5 leaders

Market Restraints and Challenges

Squeezed between petrol generators and home batteries

A petrol generator costs a fraction as much and runs as long as fuel lasts, while a wired home battery delivers whole-house capability for several times the price, which leaves this product defending a middle position on convenience rather than on cost or capability. The root cause is that its genuine advantages, no permit, no installer and no fuel, are difficult to price. Commercial impact is a persistent ceiling on what customers will pay. Participants are responding with modular expansion, transfer switch accessories, financing at checkout and messaging built entirely around convenience.
Market Impact: Delivers 4,000 cycles per unit

Every leading brand manufactures in one country

All five leading brands manufacture in China and most source cells from the same handful of suppliers, which means a trade measure on battery products raises prices across the whole category simultaneously rather than advantaging anybody. The root cause is that cell manufacturing at consumer price points exists almost nowhere else at competitive cost. Commercial impact is a shared exposure no individual brand can hedge by itself. Mitigation runs through Southeast Asian assembly, dual cell sourcing, tariff engineering on component classification and inventory positioned ahead of announced measures. Nobody in this category has solved it.
Market Impact: Grows at 18.0% against 12.0%
3 additional market trends, 4 additional growth drivers, and 2 additional restraints and challenges are covered in the full report. Contact sales@marketmindsadvisory.com to access the complete intelligence.

Segment CAGR and Growth Architecture

Segmentation follows capacity class, the dimension on which price point, purchase trigger and household use all move together. Small portable units carry the volume and serve recreation more than emergencies. Expandable modular systems and whole-home backup carry the growth, because both answer the outage that actually frightened somebody rather than a weekend away. Fear sells the larger units.
residential-solar-generator-market-market-share-analysis-1788234716322

Expandable Modular Home Systems

Expandable modular home systems grow at 18.0%, half again the market rate of 12.0%, and the reason is a connector rather than a cell. Adding expansion ports to a base unit means a household that bought two kilowatt hours after one outage can reach eight after several more, buying capacity when the memory is fresh and the budget allows rather than committing everything at once. That converts a single transaction into a sequence and locks the customer to one brand's proprietary connector, which no competitor can supply. Lifetime value on these customers runs several times the first purchase, and almost none of the brands report that number or appear to manage against it.
CAGR 18.0%

Whole-Home Backup Systems

Whole-home backup systems above ten kilowatt hours at 14.6% are where this category meets the wired home battery it was supposed to be an alternative to. Paired with a transfer switch these units run a full house through a multi-day outage, at prices well below an installed battery system and without the electrician, the permit or the utility interconnection agreement. The compromise is that the customer handles the switching themselves and accepts a device sitting in a garage rather than mounted on a wall. Households that experienced a long outage buy this tier readily, and households that have not find the price difficult to justify against a generator. Experience is the entire sales argument.
CAGR 14.6%
Full segment breakdown across 6 segments available in the complete report.

Regional Architecture and Country Demand Map

East Asia takes 29% narrowly ahead of North America at 28%, on Japanese preparedness buying and a Chinese outdoor market few outside the region measure. South Asia grows fastest of the seven. Every regional position here is set by grid quality or by disaster culture, and never by anything environmental.

East Asia

Two very different demand sources add up to the largest regional position, and neither resembles the Western outage story. Japanese households buy emergency power as a normal part of disaster preparedness, a habit that hardened after 2011 and that municipalities actively encourage through subsidy and guidance, which makes purchase planned rather than reactive. Separately, a Chinese outdoor recreation boom since 2020 created enormous domestic demand for portable units that almost nobody outside the region measures. Every leading brand is domiciled here and sells at home first, with domestic pricing well below export levels. Growth at 13.0% runs ahead of North America and the composition is completely different. Nobody exporting into this region has understood that difference.
Share: 29% | CAGR: 13.0% (2026 to 2036)

North America

Per-household spend is the highest anywhere and the 28% share sits marginally behind East Asia rather than leading, which surprises most participants. Outage experience drives everything: Texas in 2021, repeated Californian safety shutoffs and hurricane seasons across the Gulf and Atlantic coasts each produce demand visible in weekly shipment data. Large homes and a substantial recreational vehicle culture support both ends of the capacity range. Direct commerce penetration is deepest here, at well above the category average, because search advertising reaches storm-affected regions faster than any retailer restocks. The buyer is defensive and explicitly says the purchase is insurance rather than anything environmental. Emissions are almost never mentioned in that conversation at all.
Share: 28% | CAGR: 11.4% (2026 to 2036)
Regional intelligence for 5 additional markets available in the complete report: Western Europe, South Asia and Pacific, Latin America, Middle East and Africa, Eastern Europe. Contact sales@marketmindsadvisory.com.
residential-solar-generator-market-country-cagr-analysis-1788234716838

Four Moves On The Buying Window

None of these four is about the hardware, because the cells come from the same suppliers and the inverters are broadly equivalent across every brand here. Each works on the thing that actually decides revenue: reaching a frightened household inside eleven days, and then selling that household a second unit. Neither is a hardware problem at all.

Bid the search terms before the storm lands

Purchase peaks 11 days after a major outage and 58% of volume sells direct, which means the brand visible in search results in an affected region that week takes the demand. Weather forecasting gives several days of notice on hurricanes, winter storms and heat events, and search inventory can be positioned against affected postcodes in advance at ordinary cost. Brands treating this as a marketing calendar rather than a weather-driven operation are arriving after the window closes. It is an operations problem being handled by a media agency. Weather data is cheaper than media.
Market Impact: Captures the entire 11 day buying window properly

Sell the second module, not the first unit

Expandable systems grow at 18.0% against a market rate of 12.0% because a household adds capacity after each subsequent outage, yet almost every brand measures success on first-unit acquisition and stops. Owners of a base unit are the cheapest customers available, already committed to a proprietary connector, and reachable directly because the brand sold to them in the first place. A structured re-marketing programme triggered by regional outage events costs nothing against acquisition. Nobody in this category reports lifetime value, which suggests very few are managing it. That is a reporting failure before it is a commercial one.
Market Impact: Lifts value across 4 or more repeat purchases

Bundle the transfer switch and the permit answer

Whole-home backup at 14.6% competes against wired home batteries whose main disadvantage is an electrician, a permit and a utility agreement, and the solar generator's answer is that it needs none of them. That advantage collapses if the customer cannot work out how to connect the thing to their house. Bundling a transfer switch, clear installation guidance and a vetted electrician referral removes the last objection and lifts the average order considerably. The brands treating installation as somebody else's problem are losing the tier that earns most. The objection is practical rather than financial.
Market Impact: Raises order value across the whole 14.6% tier

Write insurance copy, not sustainability copy

Households in survey work describe this purchase as insurance against their utility and almost never mention emissions, yet most brand messaging in the category still leads with clean energy language borrowed from rooftop solar. The buyer eleven days after an outage is not weighing carbon, and copy that addresses the wrong motivation converts far worse in every test anybody has run. Rewriting the message costs a copywriter and about 2 weeks of work. The brands that made this change reported conversion improvements they had spent years trying to buy through media. The wrong motive was being addressed for years.
Market Impact: Addresses the real motive of 11 day buyers

Who Controls the Margin Pool

CR5 stands at 47% of retail unit shipments, which is the only comparable basis since most participants are private and none discloses category revenue. That is high for a consumer durable and every one of the five is a Shenzhen company that built a global brand through direct commerce. The gap between them and the field is a gap in advertising capability rather than in product.
Competition runs on search visibility, connector lock-in and channel economics. Search visibility decides who reaches the household inside the eleven day window. Connector lock-in decides who sells the expansion modules that follow. Channel economics decide margin, since a direct sale keeps what a retailer would have taken. Cell chemistry and inverter design differ so little between brands that no customer can distinguish them.

Rankings will move on whichever brand first treats outage response as an operational discipline rather than a marketing campaign. Weather gives days of notice and search inventory can be bought against forecast paths in advance. The pressure comes from execution speed rather than from technology, which favours smaller and faster organisations over the established names now entering the category late.
residential-solar-generator-market-company-positioning-matrix-1788234717363

Competitive Moat and Risk Dimensions

ECOFLOW

Moat: Modular architecture and connector lock

An expansion architecture built early and applied consistently across the range means a customer buying a base unit is committed to the brand for every capacity addition afterwards, and those additions are the profitable part of the relationship. Rivals adding expansion later cannot reach the installed base. The lock is proprietary, physical and effectively permanent once a household buys in.
ECOFLOW

Risk: Single country manufacturing exposure

Manufacturing and cell sourcing concentrated in China leaves the brand exposed to trade measures that raise prices without advantaging any competitor, since rivals share the position. Diversifying assembly into Southeast Asia addresses tariff classification alone, since the cells still come from the same suppliers. It is an industry exposure rather than a company one, and nobody can hedge it alone.
JACKERY

Moat: Recreational brand recognition endures

Early and heavy investment in outdoor and recreational positioning built name recognition among camping and vanlife audiences before outage demand existed, and that audience buys repeatedly and recommends actively. Recognition in a category bought under time pressure is worth more than specification advantage. Competitors reaching the same audience now pay considerably more for far less attention.
JACKERY

Risk: Recreational positioning limits backup sales

A brand associated with camping faces a harder argument selling a whole-home backup system to a household deciding between it and a wired battery, because the association signals accessory rather than infrastructure. The fastest growing tiers are exactly where that perception costs most. Repositioning an established consumer brand upward is slow, expensive and frequently unsuccessful.

Players Tracked

Prominent Players

EcoFlow
Jackery
Anker Innovations
BLUETTI
Goal Zero

Other Key Players

Ugreen
Zendure
OUPES
Pecron
ALLPOWERS
Renogy
Duracell
Generac
Schneider Electric
Westinghouse Electric Corporation
Rockpals
GRECELL
Lion Energy
Dabbsson
Segway

Recent Developments

FEBRUARY 2025

Brands positioned advertising against forecast winter storm tracks

Several leading brands bought regional search inventory against forecast winter storm paths days before the weather arrived, rather than responding after outages began. Shipment data afterwards showed those brands capturing a disproportionate share of the demand spike that followed across every one of the affected states.
Signal: Weather forecasting turned out to be a better sales tool than any product feature in the range.
MAY 2025

Expansion module sales overtook base unit revenue for one brand

One leading manufacturer disclosed that expansion battery modules had exceeded base unit sales by revenue for the first time, confirming that the installed base rather than new acquisition now drives growth. The disclosure prompted several competitors to accelerate their own modular architecture programmes considerably within the following quarter.
Signal: The second purchase is where this business actually earns, and most brands still measure only the first.
SEPTEMBER 2025

Japanese municipalities extended household power subsidies

Additional Japanese municipalities extended subsidy programmes covering household emergency power equipment, treating portable battery systems as disaster preparedness infrastructure alongside water and food stockpiles. Demand across those prefectures rose steadily rather than spiking, which is a purchasing pattern that no other national market anywhere produces.
Signal: Planned preparedness buying behaves nothing at all like the panic purchasing every Western brand is built around.

Cells, Inverters And Advertising

Lithium iron phosphate cells account for roughly 43% of unit cost, inverter and power electronics around 17%, and enclosure with thermal management a further 11%. Customer acquisition is the line most participants underweight, running near 14% of revenue in competitive periods and rising sharply during the demand spikes that follow outages, when every brand bids for the same search terms at the same moment.
Cell pricing through 2022 demonstrated the exposure directly. Lithium carbonate moved sharply on electric vehicle demand entirely unconnected to consumer products, and US Geological Survey mineral commodity reporting recorded the movement. Brands holding forward cell contracts protected margin through it. Those buying on spot raised retail prices into a competitive market and lost share they did not recover, which is a poor outcome from a purchasing decision.

The disadvantage falls on acquisition cost rather than the bill of materials, where most attention goes. Every brand buys cells at broadly similar prices from the same suppliers, and none has a hardware cost advantage worth defending. What differs enormously is what a customer costs to acquire, and a brand with recognition and an owned installed base pays a fraction of what a new entrant does.
residential-solar-generator-market-cost-volatility-analysis-1788234717560

Contract cells forward against seasonal demand

Cells are 43% of unit cost and lithium pricing moves on electric vehicle demand unconnected to this category, while retail prices are set in a market that punishes increases. Forward contracts covering the seasonal peak cost a premium against spot and protect margin on the volume that matters. Brands buying spot through the last cycle lost share.

Build owned audience to cut acquisition cost

Customer acquisition runs near 14% of revenue and spikes exactly when demand does, because every brand bids the same search terms in the same week. An owned email and app relationship reaches the installed base at almost no marginal cost and converts far better than advertising. Very few brands treat their own customer list as an asset worth building.

Qualify a second cell supplier before you need one

Most brands source cells from the same handful of Chinese suppliers, which concentrates both price and availability risk in a way nobody has hedged. Qualifying an alternative costs testing and certification rather than capital, and must be done before a shortage rather than during one. Brands that did this during the last surplus had supply when the market tightened.

Portfolio Architecture for Margin Defence

Margin here follows the second purchase rather than the first, which almost nobody in the category reports. A base unit sold through paid search after an outage carries full acquisition cost and thin contribution. An expansion module sold to that same household eighteen months later carries almost no acquisition cost at all and a considerably better margin. Participants managing lifetime value rather than unit share run a completely different business.
Volume and premium pull against each other through brand reach rather than the factory. Small portable units are cheap, sell in volume through marketplaces and put the brand in front of an audience that later buys larger systems, which is the entire reason to keep making them. Abandoning the entry tier saves margin and removes the funnel that fills every profitable tier above it.

High-value pools sit in expansion modules, in whole-home backup and in accessories nobody treats seriously. Transfer switches, panel kits, cables and mounting hardware carry excellent margins, sell to an already-committed owner and require no acquisition spending whatsoever. Most brands present them as an afterthought on a product page rather than as the profit pool they genuinely are.

Volume / Commodity-Adjacent

Portable power stations under one kilowatt hour sold through marketplaces on price against near-identical competing units. Margins are thin and the tier exists to build reach. The 8 point spread reflects whether the sale is direct or through a marketplace taking commission.
Gross Margin: 16 to 24%

Premium / Certified

Mid-capacity portable units and whole-home backup systems sold on brand recognition, certification and warranty rather than on specification. Trust rather than hardware supports the price. The 8 point spread reflects channel mix between owned commerce and third-party marketplaces.
Gross Margin: 30 to 38%

Sustainability / Regulatory / Next-Generation

Expansion modules, transfer switches, panel kits and accessories sold to existing owners with no acquisition cost attached. Margins are high because the customer is already committed to the connector. The 20 point spread separates battery modules from small accessories, which price on entirely different logic.
Gross Margin: 42 to 62%
residential-solar-generator-market-portfolio-architecture-1788234718052

High-value Sub-segments and Strategic Watch-out

Expandable Modular Home Systems

High value and high growth at 18.0%. A proprietary connector means every capacity addition returns to the original brand, and every one of those additions carries no acquisition cost at all. The 8 point spread reflects whether that module is sold direct or through a commissioned marketplace.
Gross Margin: 40 to 48%

Whole-Home Backup Systems

High value with strong growth at 14.6% annually. It competes against wired home batteries by avoiding the electrician, the permit and the utility interconnection agreement entirely. The 8 point spread reflects whether a transfer switch and clear installation guidance are bundled into the sale itself.
Gross Margin: 34 to 42%

Portable Power Stations Under One Kilowatt Hour

The volume core. It earns very little and it introduces households to the brand who go on to buy the larger systems that actually make money. The 8 point spread reflects marketplace commission, which decides these economics far more than any manufacturing cost difference does.
Gross Margin: 14 to 22%

Off-Grid Cabin and Recreational Systems

The strategic watch-out. Recreational demand is discretionary, cyclical and now served by the very same units households buy for backup, which collapses the segment's separate identity. The 22 point spread separates specialist high-capacity installations from the general portable units increasingly sold into the same use.
Gross Margin: 22 to 44%

One Outage, Then Another

The annuity here is unusual because it is triggered externally rather than by any supplier action. A household that buys a base unit after one outage returns for an expansion module after the next, and the brand does nothing to cause that except own the connector and remain reachable. Revenue therefore follows weather and grid performance rather than any sales calendar, which is uncomfortable to forecast and genuinely durable.
Stickiness varies enormously by whether the customer bought into a modular architecture. An owner of an expandable system is locked to one connector and will not restart with a competitor. An owner of a standalone unit is entirely free and buys purely on price next time. That difference is created at first sale and is worth several times the margin on the unit.

Buyer profiles have shifted from outdoor enthusiasts toward anxious homeowners, and much of the category's messaging has not followed. An enthusiast asked about weight, capacity and charging time. A homeowner after a four-day outage asks whether it runs a fridge, a medical device and the internet, and for how long. The second question is now most of the market and it needs answering in plain language.
residential-solar-generator-market-end-use-penetration-index-1788234718540

What Actually Sells These

These are among the four positions where our research anticipates prominent divergence between winners and laggards over the coming forecast period. Each is grounded in the demand model, the regulatory perimeter, and the announced capacity pipeline.
01 / OUTAGE RESPONSE OPERATIONS

Treat weather forecasts as a sales system

Purchase peaks 11 days after a major outage and 58% of volume moves direct, so the brand visible in search results across an affected region that particular week takes the demand from everybody else. Hurricanes, winter storms and heat events all give several days of forecast notice, and regional search inventory can be positioned against those paths in advance at entirely ordinary cost. Brands running this as a quarterly marketing calendar rather than a weather-triggered operation arrive consistently after the window has already closed.
02 / INSTALLED BASE REMARKETING

The second module is the whole business

Expandable systems grow at 18.0% against a market rate of 12.0% because households add capacity after each subsequent outage, yet nearly every brand in this category measures success on first-unit acquisition and then stops paying attention. Existing owners are already committed to a proprietary connector, cost almost nothing to reach and convert at rates no advertising achieves. A remarketing programme triggered by regional outage events costs very little, and the absence of any lifetime value reporting suggests almost nobody is managing this.
03 / ACCESSORY MARGIN CAPTURE

Stop treating the attachments as an afterthought

Transfer switches, panel kits, cables and mounting hardware carry margins far above the units themselves, sell exclusively to owners who are already committed and require no acquisition spending of any kind to reach. Most brands present them as a footnote on a product page rather than merchandising them as the profit pool they genuinely represent across the installed base. Bundling a transfer switch with whole-home backup also removes the last practical objection standing between the customer and the highest-margin tier.
04 / INSURANCE FRAMED MESSAGING

Sell protection, not clean energy

Households describe this purchase as insurance against an unreliable utility and almost never mention emissions unprompted, yet a great deal of messaging in the category still leads with clean energy language borrowed directly from rooftop solar marketing. The buyer eleven days after a four-day outage is not weighing carbon intensity against anything at all. Rewriting the message costs a copywriter and a fortnight, and the brands that made the change reported conversion gains they had spent years attempting to buy through additional media.

Engagement Snapshot From the Field

A live engagement with an industry participant carrying material or product regulatory and market exposure ahead of a defining policy shift, showing how our research translates into a defensible multi-year portfolio strategy.
MARKET MINDS ADVISORY · CLIENT ENGAGEMENT SUMMARY
Residential Solar Generator Producer Strategic Portfolio Review and Transition Roadmap 2026·Investment Scenario on Residential Solar Generator Exposure Evaluation 2025-26
CLIENT PROFILE
A portable power brand selling battery and solar generator systems across North America and Western Europe through its own commerce site and major marketplaces, with annual revenue in the low hundreds of millions of dollars and customer acquisition cost rising for six consecutive quarters (client-reported, unverified by MMA). Growth had continued and contribution margin had not.
STRATEGIC CHALLENGE
Acquisition cost was rising faster than revenue and management had responded by increasing advertising spend, which sustained volume and destroyed margin. They wanted to know whether the problem was competitive bidding, creative quality, product positioning or something in the business model itself that additional spending would never fix at all.
MMA APPROACH
MMA rebuilt three years of customer purchase histories, separating first purchases from subsequent ones and mapping both against regional outage events and advertising spend by week. Forty-seven expert interviews with customers, marketplace managers, competing brands and media buyers established what triggered purchase, what drove repeat buying and where the acquisition cost was actually going.
KEY FINDINGS
  1. Repeat purchases carried 4 times the contribution margin of first purchases, and the client had never separated the two in any reporting.
  2. Some 71% of advertising spend landed outside the 11 day post-outage window when conversion rates were less than a third of peak.
  3. Customers who bought a modular system returned within 2 years at high rates, while standalone unit buyers almost never returned to the brand at all.
  4. Accessory attachment was under 9% of orders against a category benchmark several times higher, on products carrying the best margins in the range.
CLIENT PROFILE
A portable power brand selling battery and solar generator systems across North America and Western Europe through its own commerce site and major marketplaces, with annual revenue in the low hundreds of millions of dollars and customer acquisition cost rising for six consecutive quarters (client-reported, unverified by MMA). Growth had continued and contribution margin had not.
STRATEGIC CHALLENGE
Acquisition cost was rising faster than revenue and management had responded by increasing advertising spend, which sustained volume and destroyed margin. They wanted to know whether the problem was competitive bidding, creative quality, product positioning or something in the business model itself that additional spending would never fix at all.
MMA APPROACH
MMA rebuilt three years of customer purchase histories, separating first purchases from subsequent ones and mapping both against regional outage events and advertising spend by week. Forty-seven expert interviews with customers, marketplace managers, competing brands and media buyers established what triggered purchase, what drove repeat buying and where the acquisition cost was actually going.
KEY FINDINGS
  1. Repeat purchases carried 4 times the contribution margin of first purchases, and the client had never separated the two in any reporting.
  2. Some 71% of advertising spend landed outside the 11 day post-outage window when conversion rates were less than a third of peak.
  3. Customers who bought a modular system returned within 2 years at high rates, while standalone unit buyers almost never returned to the brand at all.
  4. Accessory attachment was under 9% of orders against a category benchmark several times higher, on products carrying the best margins in the range.
RECOMMENDED STRATEGY
Phase 1: Phase one: reallocate advertising spend toward forecast outage regions and away from continuous national coverage, using weather data rather than the marketing calendar. Phase 2: Phase two: build a remarketing programme to existing owners triggered by regional outage events, which costs almost nothing against paid acquisition. Phase 3: Phase three: merchandise accessories and expansion modules properly on every product page rather than burying them somewhere below the specifications.
OUTCOME
Within five quarters blended acquisition cost had fallen by roughly a quarter while volume held, and repeat purchases had risen to a materially larger share of revenue (client-reported, unverified by MMA). Accessory attachment roughly doubled. Total advertising spend was lower than when the work began.

Frequently Asked Questions

Foundational context covering the market sizes, CAGR, scope, country, region and competition that inform every finding below. This section is provided to cover basics and most often pre-purchase conversations, answered from the MMA Primary Research Dataset.

What is the current size of the Residential Solar Generator Market?

The global residential solar generator market was valued at USD 5.8 billion in 2025, covering standalone battery and inverter systems with solar charging sold to households. The 2026 figure reaches USD 6.50 billion.

How large will the Residential Solar Generator Market be by 2036?

MMA forecasts USD 20.19 billion by 2036, an increase of USD 13.69 billion over the 2026 base. That represents an expansion multiple of 3.11 times across the forecast period.

What is the CAGR for the Residential Solar Generator Market 2026 to 2036?

The base case compound annual growth rate is 12.0%, with a bull case at 13.2% and a bear case at 10.8%. Historical growth between 2020 and 2025 ran at 10.8%.

Which segment is growing fastest?

Expandable modular home systems grow at 18.0%, half again the market rate of 12.0%, because households add capacity after each successive outage. Whole-home backup follows at 14.6%.

Who are the major companies in the Residential Solar Generator Market?

EcoFlow, Jackery, Anker Innovations, BLUETTI and Goal Zero lead on retail unit shipments, with combined CR5 of 47%. All five built global brands through direct commerce rather than retail distribution.

Which country is growing fastest?

India grows fastest at 14.2%, where routine load shedding meets falling prices and a middle class replacing lead-acid inverter systems. South Asia and Pacific leads regionally at 14.2%.

Report Segmentation Architecture

The full report scope spans multiple orthogonal segmentation dimensions, with cross-tabulated demand data provided for each dimension pair. Coverage extends further to regional breakdowns, trend trajectories, and the competitive detail needed to support segment-level decision-making.

By Capacity Class

  • Portable Power Stations Under One Kilowatt Hour
  • Mid-Capacity Portable Units
  • Expandable Modular Home Systems
  • Whole-Home Backup Systems
  • Solar Panel Kits and Charging Accessories
  • Off-Grid Cabin and Recreational Systems

By End-Use Industry

  • Household Emergency Backup
  • Recreational and Outdoor Use
  • Off-Grid Rural Households
  • Recreational Vehicle and Marine
  • Home Office and Medical Equipment
  • Small Business Contingency Use

By Commercial Dimension

  • Direct Brand Commerce
  • Online Marketplaces
  • Big Box Retail
  • Specialist Outdoor Retail
  • Utility and Insurance Partnerships
  • Municipal Preparedness Programmes

By Region

  • North America
  • Western Europe
  • East Asia
  • South Asia and Pacific
  • Latin America
  • Middle East and Africa
  • Eastern Europe

Scope, Methodology, and Coverage

Every figure in this report is reproducible from documented input assumptions. The scope below maps the historical period, the forecast horizon, the segmentation dimensions, and the countries covered, alongside the underlying primary and qualitative methodology.
Historical Period
2020 to 2025
Forecast Period
2026 to 2036
Base Year
2025 (USD billions; MMA Primary Research Dataset, September 2026)
Market Definition
The residential solar generator market covers standalone battery and inverter systems sold to households with solar charging capability, spanning portable power stations under one kilowatt hour, mid-capacity portable units between one and three kilowatt hours, expandable modular home systems between three and ten kilowatt hours, whole-home backup systems above ten kilowatt hours, solar panel kits and charging accessories, and off-grid cabin and recreational systems. Scope covers retail sale to households through all channels. Excluded are grid-tied rooftop photovoltaic installations, permanently wired home battery systems requiring an electrician, fossil-fuelled generators, commercial and industrial storage, and utility-scale equipment.
Quantitative Units
USD billion, 2025 base year, 2026 to 2036 forecast period
Segmentation Dimensions
Capacity class, household application, commercial channel, region
Regions Covered
North America, Western Europe, East Asia, South Asia and Pacific, Latin America, Middle East and Africa, Eastern Europe
Countries Covered
United States, Canada, Germany, United Kingdom, France, Spain, Italy, Poland, China, Japan, South Korea, India, Australia, Brazil, Mexico, Saudi Arabia, Nigeria, South Africa
Key Companies Profiled
20 companies across portable power brands, battery specialists and generator manufacturers
Quantitative Methodology
Primary survey, n=3,800 respondents, Q4 2025, six countries; demand-side model with trade association cross-validation
Qualitative Methodology
47 expert interviews, Q4 2025; applied to validate demand model assumptions, identify emerging dynamics, and assess competitive positioning
Report Format
PDF and XLSX data workbook (Word format preview document)
Publisher
Market Minds Advisory
Report Code
MMA-2026-TEC-551
Published
September 2026
Contact
sales@marketmindsadvisory.com | www.marketmindsadvisory.com

Purchase the full Residential Solar Generator Market Report (2026 to 2036).

The full MMA report on the residential solar generator market runs to detailed capacity class and regional models across the 2026 to 2036 forecast period, with cost benchmarks separated by cell chemistry, power electronics and customer acquisition. It profiles 20 companies on a consistent retail unit shipment basis, covering portable power brands, battery specialists and generator manufacturers. Demand is modelled against regional outage frequency and duration rather than against income or installation data. Regional chapters cover the seven MMA regions with country-level detail on the eighteen markets surveyed. Primary research draws on a quantitative survey of 3,800 respondents across six countries and 47 expert interviews conducted in Q4 2025.
Cost benchmarks by cell chemistry, electronics and acquisition
Demand modelled against regional outage frequency and duration
Repeat purchase and expansion module behaviour by capacity class
Twenty company profiles on consistent retail shipment basis
Channel economics compared across direct commerce and marketplaces
Seven regional chapters with eighteen country detail tables

Built For The People Who Decide

From boardroom strategy to bench-side execution, this report is read cover-to-cover by leaders shaping the next decade of their industry, turning demand scenarios, market dynamics and valuation benchmarks into decisions.
CXOs/ Presidents/ VPs/ Managers
M&A and Corporate Development
Strategy Teams and R&D Heads
Procurement and Product Directors
Regulatory and Compliance Leaders
Investor Relations and Equity Analysts