Market Minds Advisory
Research Antibodies Market

Research Antibodies Market: A Reagent Whose Defect Only Appears Months Later

Roughly half of all commercial reagents fail head to head characterisation, and the buyer discovers it only after months of work, which is why sequence-defined product is now displacing everything else.

Lead Analyst

Alice Ballenger

Published

September 2026

Make Smarter Decisions with Customized Research Insights

Request a free sample report and evaluate market opportunities, growth trends, and competitive dynamics relevant to your business needs.

2025 MARKET VALUE$4.2BMarket Size 2025
2036 FORECAST VALUE$8.7BBase Case , 2026 to 2036
CAGR 2026 TO 20366.8 %Bull 8.0% / Bear 5.6%
INCREMENTAL OPPORTUNITY$4.2BNet 10- year value creation
EXPANSION MULTIPLE1.93x2036 value over 2026 base
Strategic Levers
M&A Pipeline
Regional Outlook
Country Rankings
Competitive Intelligence
Segmental Deep-dive
Call-Us : 91 93563 13602

Executive Snapshot and Market Trajectory

Around 48% of commercial research antibodies fail when characterised head to head against the target they claim to recognise. The buyer cannot detect that at purchase and usually finds out months later, after roughly twenty-four thousand dollars of work has already been spent. Nothing at purchase reveals it.
Recombinant antibodies answer that directly, which is why they grow at 10.2%, half again the market rate of 6.8%. A defined sequence can be reproduced identically forever, whereas hybridoma lines drift and die and polyclonal antisera are genuinely a different product with every bleed. Around 61% of new catalogue listings now carry a sequence behind them. That is fast conversion for a market that changed reagents very reluctantly. Supply continuity improves at the same time.
The catalogue itself is part of the problem. Suppliers resell one another's product under their own numbers, so a single clone appears roughly nine times across the market at different prices with different validation data attached. A researcher comparing two antibodies is frequently comparing the same one twice, which no amount of purchasing diligence will reveal. Clone identifiers are the emerging fix and adoption remains partial.
Market Definition
Antibody reagents supplied for research and preclinical use, covering recombinant full-length antibodies, recombinant fragment and single-domain formats, hybridoma-derived monoclonals, polyclonal antisera, secondary and detection antibodies, and antibody panels and multiplex reagent sets. Measured at supplier selling value. Excludes therapeutic and diagnostic antibodies, in vitro diagnostic kits under regulatory approval, custom antibody development services, and protein and nucleic acid reagents.
Base Year Value
$4.2B in 2025 (MMA Primary Research Dataset, August 2026)
Forecast Period
2026 to 2036, eleven discrete annual values
CAGR
6.8% base case. Bull 8.0%. Bear 5.6%.
Fastest Growth Segment
Recombinant Full-Length Antibodies: 10.2% CAGR
Fastest Growth Country
China: 11.8% CAGR
Fastest Growth Region
South Asia and Pacific: 8.6% CAGR
Largest Region
North America: 32% of 2025 global value
Market Leaders
Thermo Fisher Scientific, Abcam, Merck KGaA, Cell Signaling Technology, Bio-Techne. Source: MMA Primary Research Dataset, July 2026.
Primary Survey
n=3,800 procurement and R&D decision-makers, Q4 2025, six countries
Methodology
Demand-side build-up, cross-validated against public data, 47 expert interviews

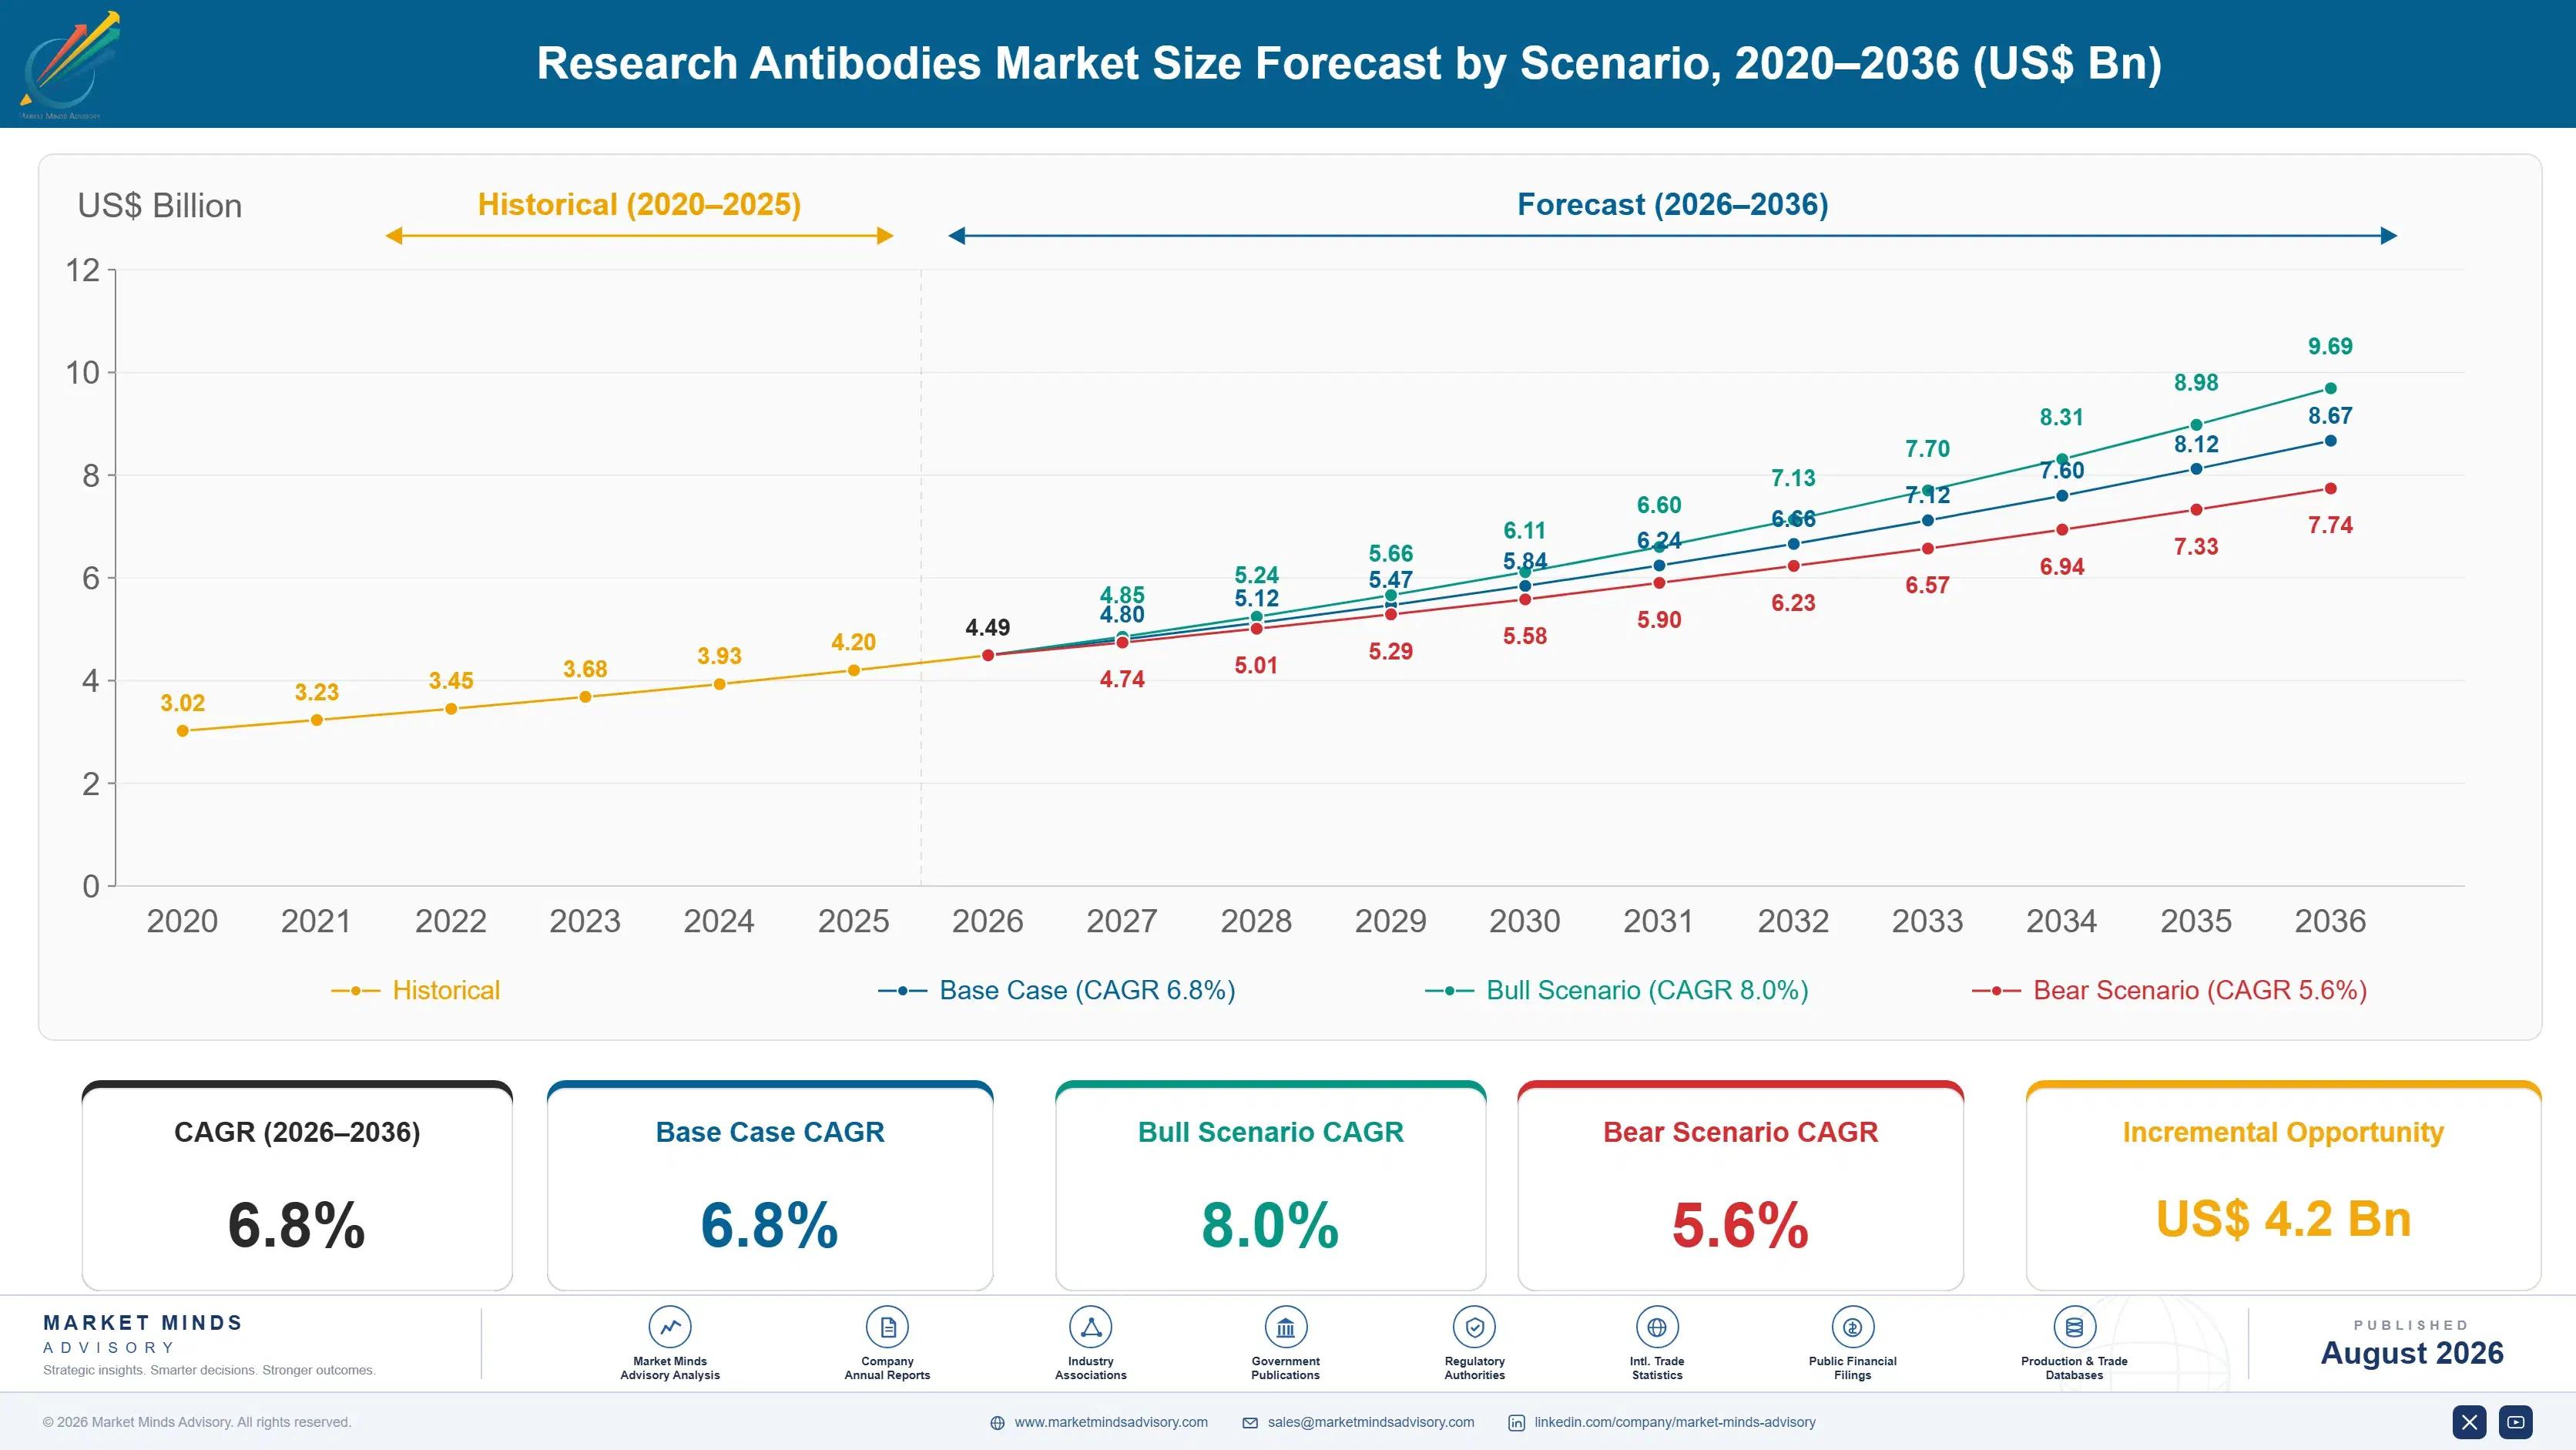
Research Antibodies Market Forecast Scenarios

research-antibodies-market-size-forecast-scenario-1787594882060
Growth ran near 5.8% between 2020 and 2025, distorted early by pandemic research funding that surged into infectious disease and then normalised. Recombinant conversion accelerated across the whole period as reproducibility concerns moved from academic commentary into purchasing criteria. Chinese domestic suppliers expanded catalogue breadth rapidly and competed hard on price, which suppressed value growth in that region relative to unit volumes shipped.
Base case 6.8% rests on three mechanisms. Recombinant conversion continues because a sequence-defined reagent solves a problem the market has finally agreed exists, and around 61% of new listings already carry one. Journal resource identifier requirements and validation frameworks keep pushing characterisation data into the purchase decision. And Chinese and Indian research spending expands faster than anywhere, with China growing at 11.8% on domestic biotechnology research and an expanding contract research sector behind it.
The bull case at 8.0% assumes validation standards becoming a genuine purchasing requirement rather than a stated preference, which would reprice characterised product substantially upward. The bear case at 5.6% is academic funding pressure in North America and Europe pushing laboratories toward cheapest-available reagents regardless of characterisation, which is what price-driven purchasing has always done here.

The Defect You Find in Month Four

An antibody is bought on a claim that cannot be checked before use. Around 48% of commercial reagents fail when characterised head to head against the target they are sold to recognise, through open comparison work repeatedly finding the same result across target classes. The purchaser learns this months later, when an experiment fails or a result cannot be repeated, having spent roughly twenty-four thousand dollars getting there.
TOP FIVE CONCENTRATION42%Catalogue breadth rather than manufacturing decides commercial position
CHARACTERISATION FAILURE RATE48%Commercial reagents failing head to head characterisation testing
CATALOGUE DUPLICATION FACTOR9xDistinct listings carrying the same underlying antibody clone
RECOMBINANT NEW LISTING SHARE61%New catalogue entries with a defined sequence behind them
FAILED EXPERIMENT COST24,000Typical spend lost before a reagent problem finally surfaces
JOURNAL IDENTIFIER REQUIREMENT38%Journals now requiring resource identifiers for research reagents
Recombinant production answers the problem at its root rather than managing it. An antibody with a defined sequence can be expressed identically in ten years by anyone holding the sequence, while a hybridoma line drifts, contaminates and eventually dies, and polyclonal antisera differ genuinely between bleeds from the same animal. Around 61% of new catalogue listings now carry a sequence, which is fast for a conservative market.
Catalogue structure hides most of what a buyer would want to know. Suppliers resell one another's product under their own numbering, so the same clone appears around nine times across the market at different prices, sometimes with validation data and sometimes without any. Comparing two listings frequently means comparing one antibody against itself, and nothing available makes that visible at the point of sale.
"This industry sells a product where the buyer cannot assess quality, the failure appears four months later, and the same clone sits in nine catalogues at nine prices. Whoever makes characterisation legible at the point of purchase takes the market, and it will not be whoever has the largest catalogue."
Director, Life Science Reagents and Research Tools Practice · MMA Healthcare and Life Sciences Practice · August 2026

Market Trends

Recombinant conversion solving reproducibility at the source

A recombinant antibody is defined by its sequence, which means it can be produced identically indefinitely by anyone holding that sequence, and batch variation largely disappears. Hybridoma lines drift genetically, get contaminated and eventually die, taking the reagent with them, while polyclonal antisera differ genuinely between bleeds from the same animal. Recombinant listings grow at 10.2% against a market rate of 6.8% and now account for roughly 61% of new catalogue entries. That is rapid conversion in a market that historically changed reagents very reluctantly. Sequence definition also allows engineering into different species and isotypes.
Market Impact: Chinese demand growing at 11.8%
Validation frameworks entering purchasing rather than staying in commentary

Open characterisation work comparing commercial antibodies head to head against knockout controls has repeatedly found around 48% failing to perform as labelled, and the findings now circulate among purchasers rather than remaining in methodological literature. Around 38% of journals require resource identifiers for reagents used in published work, which creates a documentation trail that did not previously exist. Suppliers able to present application-specific characterisation data are reaching a buyer who has started asking for it rather than assuming it. Purchasers who once assumed characterisation existed now ask to see it.
Market Impact: Avoids 24,000 dollars per failure

Market Opportunities and Growth Drivers

Chinese research and contract organisation spending expanding rapidly

China grows fastest anywhere at 11.8%, driven by domestic biotechnology research, an expanding contract research sector and government funding for life science infrastructure. Domestic suppliers have built substantial catalogues quickly and compete hard on price, which means unit volumes grow considerably faster than value in the region. Those suppliers are also exporting, particularly recombinant product where manufacturing consistency rather than legacy hybridoma stock determines what can be offered, and they are competitive on characterisation as well as price. Legacy hybridoma stock confers no advantage in a market wanting sequence-defined product.
Market Impact: Same clone appears 9 times

Failed experiment costs justifying premium characterised reagents

A failed experiment traced to a reagent typically consumes around twenty-four thousand dollars of work before the cause is identified, which dwarfs any conceivable difference in antibody price between suppliers. That arithmetic is straightforward once somebody presents it, and almost nobody does, because catalogue purchasing compares list prices rather than expected costs. Laboratories that have been through a reproducibility failure buy differently afterwards, which makes the experience itself the most effective sales event available in this category. The cost lands in a different accounting period from the purchase, which is exactly why nothing connects the two in a purchasing decision.
Market Impact: Ignores 24,000 dollar failures

Market Restraints and Challenges

Catalogue duplication preventing meaningful comparison at purchase

Suppliers resell one another's antibodies under their own numbering, so a single clone appears roughly nine times across the market at different prices and with different validation data attached to each listing. The root cause is a distribution model built for catalogue breadth rather than for product transparency. Commercially it means a researcher comparing two products may be comparing one, and no purchasing process available detects it. Clone identifiers and resource identifiers are the emerging fix, and adoption remains partial across suppliers. Suppliers originating product benefit from transparency here while resellers plainly do not.
Market Impact: Reaches 61% of new listings

Academic budget pressure pushing purchasing toward cheapest listings

Grant-funded laboratories under budget pressure buy on catalogue price because the reagent is a consumable line item and the cost of failure lands in a different accounting period entirely. The root cause is that failed experiment costs, around twenty-four thousand dollars, are borne as lost time rather than as identifiable spending. Commercially this rewards suppliers competing on price over those investing in characterisation. Institutional purchasing frameworks incorporating validation criteria are the mitigation, and they remain uncommon. Framework criteria are beginning to bring both conversations into the same room. Cheapest-available buying is what price pressure has always produced here.
Market Impact: Required by 38% of journals
4 additional market trends, 3 additional growth drivers, and 2 additional restraints and challenges are covered in the full report. Contact sales@marketmindsadvisory.com to access the complete intelligence.

Segment CAGR and Growth Architecture

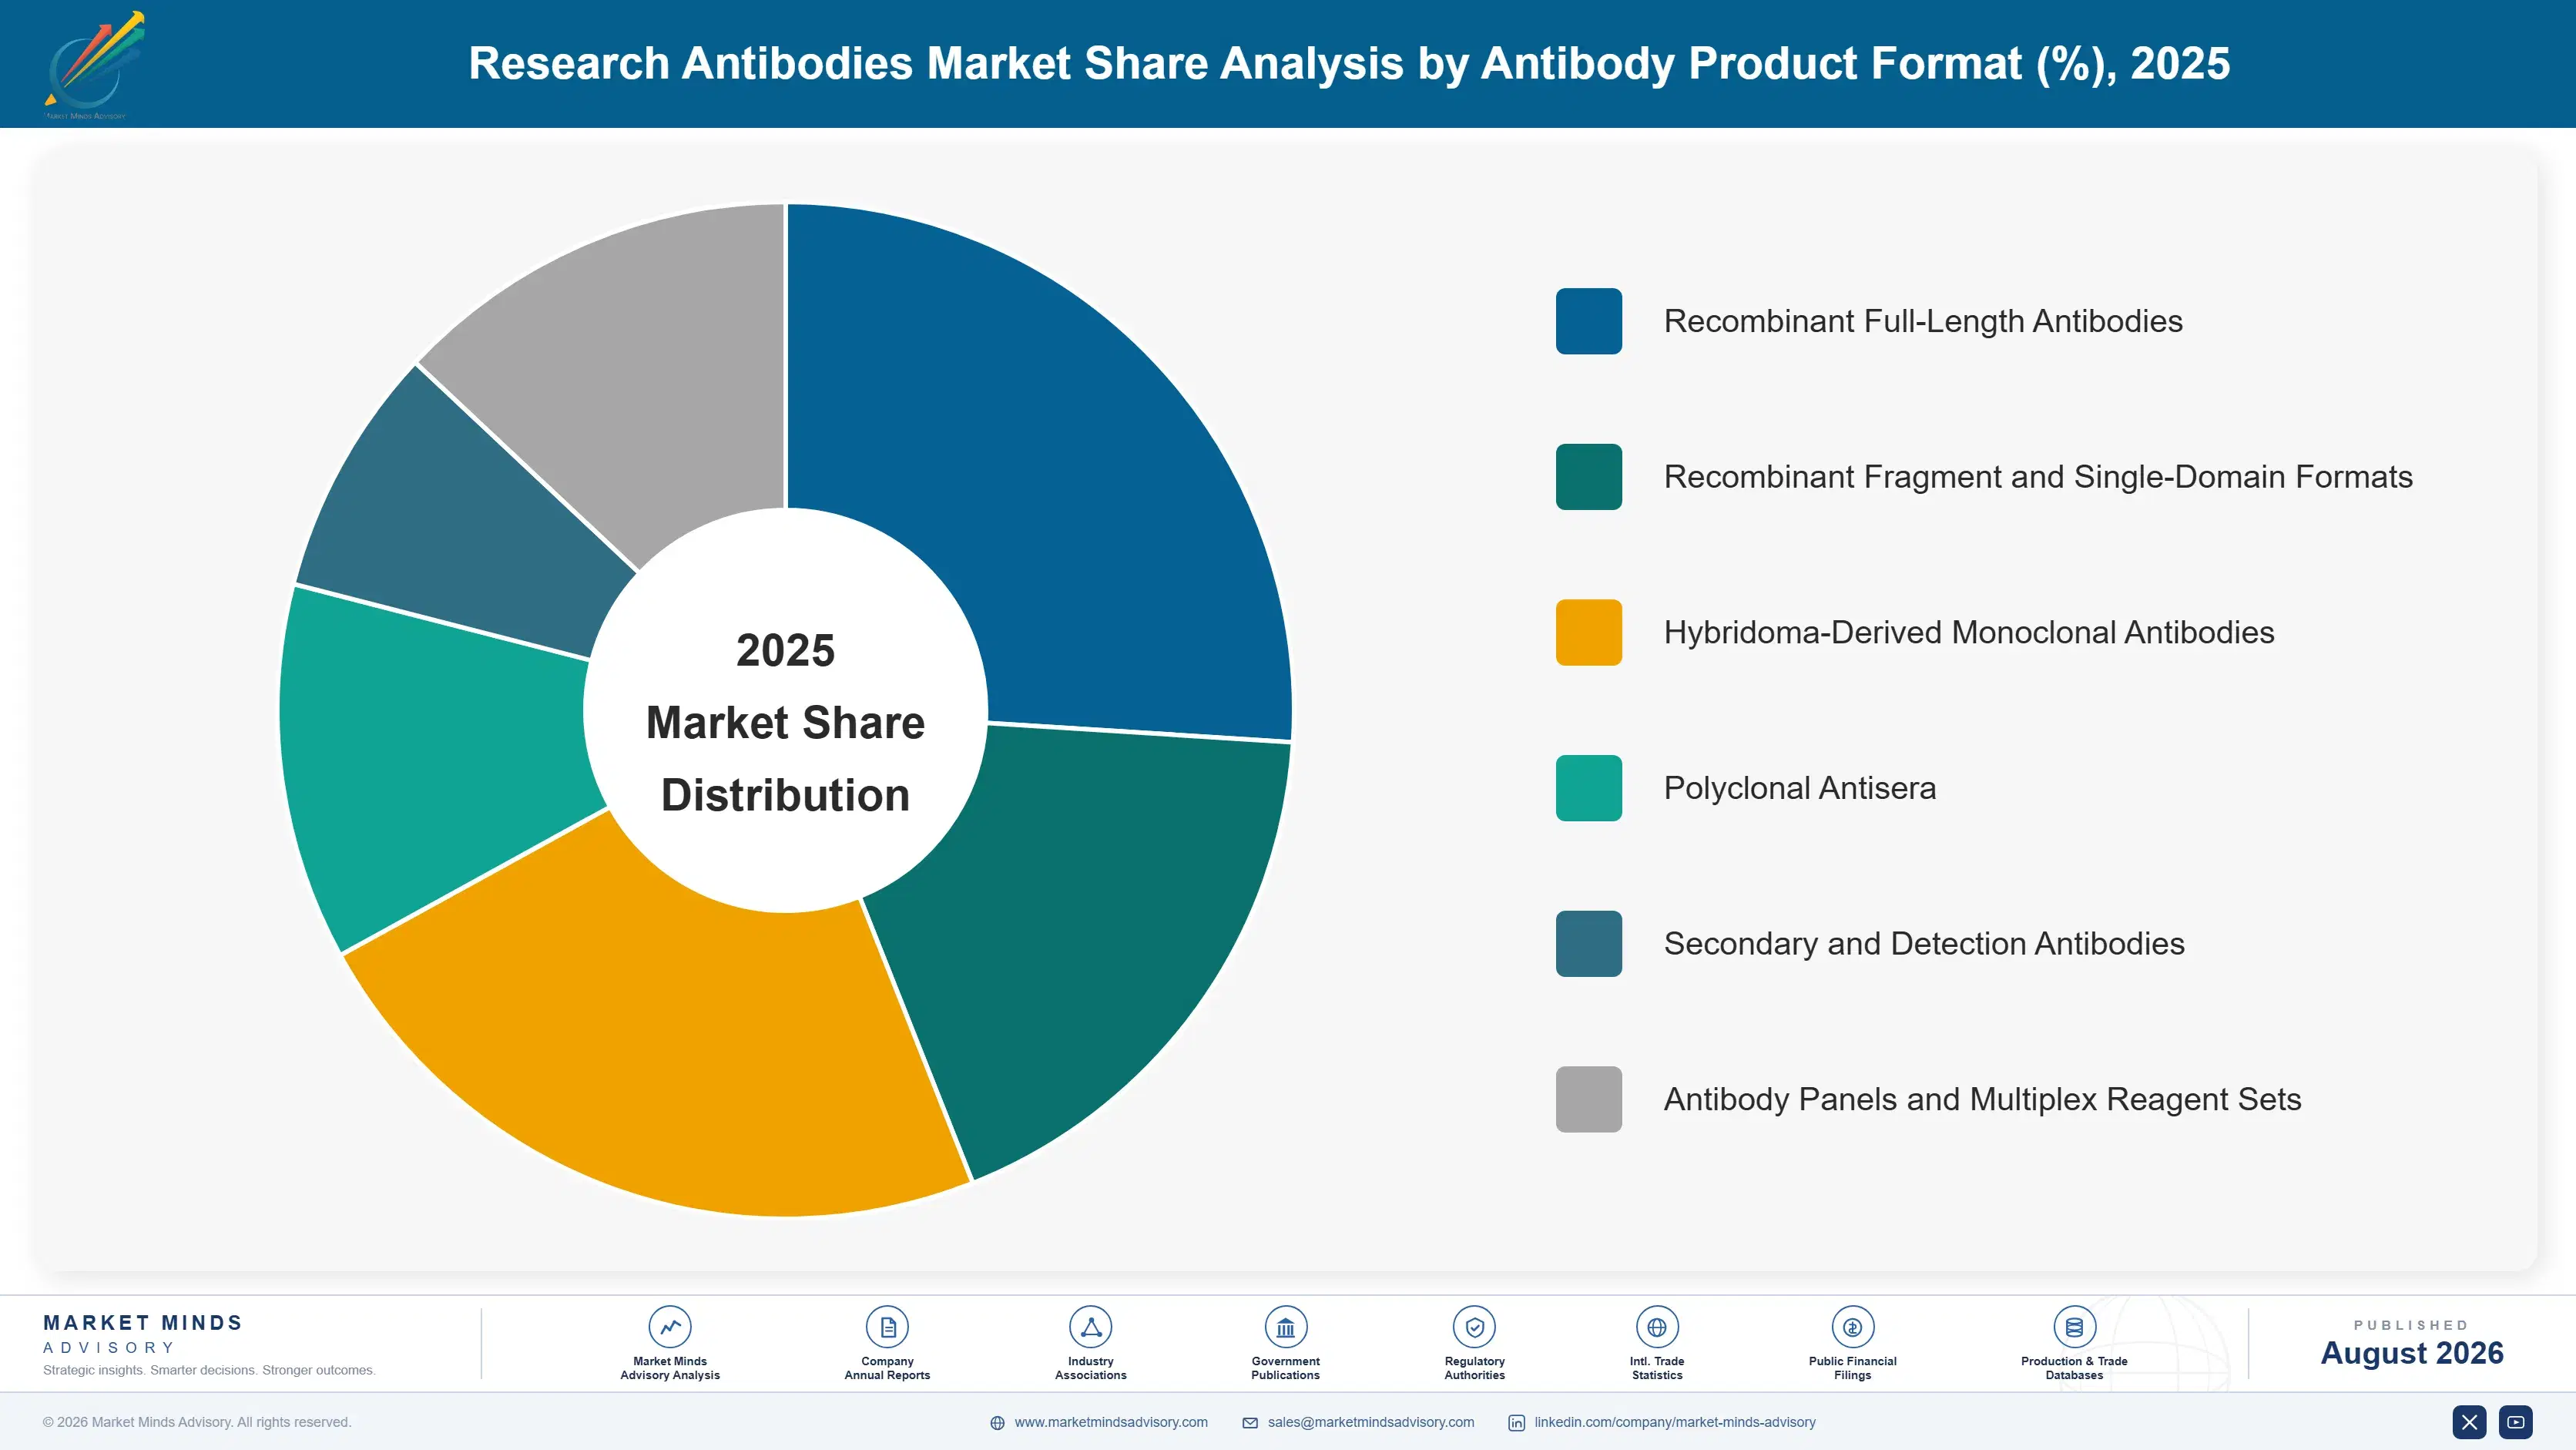
Six segments are split here by the antibody product format itself, because format determines reproducibility, batch behaviour, achievable supply life and what a laboratory can reasonably expect to obtain years later. Target specificity and application variants sit inside each format rather than beside them. End-use research setting and channel are handled in the framework instead.
research-antibodies-market-market-share-analysis-1787594882653

Recombinant Full-Length Antibodies

Growing at 10.2%, half again the market rate of 6.8%, recombinant antibodies are defined by sequence rather than by a cell line, which means the same reagent can be produced identically a decade later by anyone holding that sequence. Batch variation largely disappears and supply continuity stops depending on a hybridoma line staying alive and uncontaminated. Around 61% of new catalogue listings now carry a sequence behind them, which is fast conversion for a market that historically changed reagents very reluctantly indeed. Sequence definition also enables engineering into different species backgrounds and isotypes, which multiplies what a single binder can serve. Supply continuity stops depending on a cell line surviving in somebody's freezer.
CAGR 10.2%

Recombinant Fragment and Single-Domain Formats

At 8.6% fragment formats including Fab, single-chain variable and single-domain constructs offer smaller size, better tissue and tumour penetration, and access to epitopes that full-length antibodies cannot reach for steric reasons. Single-domain formats derived from camelid immunoglobulins are unusually stable and can be produced in bacterial systems at low cost. Adoption concentrates in imaging, structural biology and intracellular applications rather than in routine detection work. The formats are sequence-defined by construction, which means they inherit the reproducibility advantage without any conversion effort being required at all. Bacterial expression makes single-domain formats unusually cheap to produce at scale, and their stability suits applications where conventional antibodies degrade. Adoption remains concentrated rather than general.
CAGR 8.6%
Full segment breakdown across 6 segments available in the complete report.

Regional Architecture and Country Demand Map

North America holds 32% of value on biomedical research funding concentration rather than on any manufacturing advantage whatsoever. East Asia then follows at 26% on Chinese research expansion and domestic supply, with Western Europe holding 24% spread right across an unusually dense academic research base.

North America

Federal biomedical research funding concentration makes this the largest market by value, with academic laboratories, biotechnology companies and pharmaceutical research all buying from the same catalogues. Reproducibility concerns originated substantially in North American methodological literature and have moved further into purchasing here than anywhere else. Journal resource identifier requirements are more widely enforced by American publishers. Budget pressure in grant-funded laboratories pulls the other way, toward cheapest available listings regardless of characterisation. Growth of 5.6% runs below the base case on mature funding rather than any loss of activity. Purchasing frameworks incorporating validation criteria are emerging but remain uncommon across most institutions. Reproducibility concerns originated largely in North American methodological literature.
Share: 32% | CAGR: 5.6% (2026 to 2036)

Western Europe

A dense academic research base across Germany, the United Kingdom, France and the Nordic countries supports steady demand, with European framework funding providing an unusually predictable spending floor. Validation initiatives have received strong European institutional support, and several characterisation programmes comparing commercial reagents against knockout controls originate here. Purchasing consortia at institutional level are more common than in North America, which creates an opportunity to embed validation criteria into framework agreements. Growth at 5.2% runs below the base case as research budgets grow slowly across most member states. Framework agreements are the natural route for embedding validation requirements into purchasing decisions. Several characterisation programmes comparing commercial reagents against knockout controls originate here.
Share: 24% | CAGR: 5.2% (2026 to 2036)
Regional intelligence for 5 additional markets available in the complete report: East Asia, South Asia and Pacific, Latin America, Middle East and Africa, Eastern Europe. Contact sales@marketmindsadvisory.com.
research-antibodies-market-country-cagr-analysis-1787594883188

Four Moves on an Unverifiable Product

A buyer cannot assess this product before using it, discovers any defect around four months later, and compares listings that are frequently the same antibody twice over. Every commercial opportunity here comes from making quality legible at the point of purchase, which almost nothing in the current catalogue model even attempts to do for them.

Publish application-specific characterisation, not a datasheet claim

Around 48% of commercial reagents fail head to head characterisation, and a datasheet listing five applications with no supporting data is indistinguishable from one backed by knockout-controlled testing. Publishing characterisation per application, including where the antibody does not work, separates a supplier from a catalogue in the only way a purchaser can actually see. It also costs relatively little against the price of a returned reagent and a lost customer relationship afterwards. Purchasers have begun asking for exactly this rather than assuming it exists somewhere. Around 48% of listings would not survive that scrutiny.
Market Impact: Addresses the whole 48% characterisation failure problem directly

Make clone identity visible across duplicated listings

The same clone appears roughly nine times across the market under different supplier numbering, so a researcher comparing two products may be comparing one. Publishing clone identifiers and resource identifiers against every listing lets a purchaser see what they are actually buying, which is uncomfortable for suppliers reselling and advantageous for those originating product. Transparency here is a competitive weapon rather than a courtesy, and adoption remains partial enough that moving first still carries an advantage. Around 9 listings can carry the same clone, so transparency is a competitive weapon here rather than a courtesy extended to a purchaser.
Market Impact: Exposes the 9 times catalogue duplication problem outright

Price against failed experiment cost, not catalogue comparison

A reagent failure consumes around twenty-four thousand dollars of work before anyone identifies the cause, which dwarfs any price difference between suppliers by orders of magnitude. That arithmetic reaches a principal investigator rather than a purchasing office, and it is straightforward to build for a specific laboratory. Almost nobody presents it, because catalogue selling compares list prices and the cost of failure lands in a different accounting period entirely from the purchase. A single failure at 24,000 dollars outweighs every price difference in the category. It reaches a principal investigator rather than a purchasing office.
Market Impact: Weighs against a 24,000 dollar failed experiment cost

Convert legacy hybridoma stock to sequence-defined supply

Hybridoma lines drift, contaminate and die, taking the reagent with them and stranding every laboratory that built a protocol around it. Sequencing legacy clones and producing them recombinantly preserves the binder permanently and moves it into the format growing at 10.2%. It also removes the supply continuity risk that makes a purchaser hesitate before committing a multi-year study to any antibody at all, which is a quiet objection nobody voices. Laboratories committing a multi-year study need to know the reagent will still exist. It also moves the binder into the format growing fastest in the category.
Market Impact: Enters a format now growing at 10.2% annually

Who Controls the Margin Pool

Participation is measured on annual research antibody revenue, and the top five hold 42%. Concentration reflects catalogue breadth and distribution reach rather than manufacturing capability, since producing antibodies is not itself a barrier and much of the market resells product originated elsewhere. Thermo Fisher Scientific and Abcam lead on catalogue scale and validation programme investment. The gap to challengers is characterisation depth rather than product availability. Much of the market resells product originated by somebody else.
Competition runs on three fronts. Characterisation data decides which suppliers reach purchasers now asking for it rather than assuming it exists. Recombinant conversion decides supply continuity, since hybridoma stock eventually dies whatever a catalogue says. Clone transparency decides trust, and it is uncomfortable for anyone whose catalogue substantially resells product originated by somebody else. Transparency is uncomfortable for anyone whose catalogue is largely redistribution.

Pressure ahead comes from Chinese suppliers competitive on both price and characterisation, particularly in recombinant product where legacy stock confers no advantage. Danaher acquired Abcam in 2023, consolidating validation-focused catalogue capability. Expect characterisation investment and recombinant conversion rather than further large transactions. Rankings shift as validation criteria enter institutional purchasing frameworks. Institutional frameworks will decide the pace.
research-antibodies-market-company-positioning-matrix-1787594883717

Competitive Moat and Risk Dimensions

THERMO FISHER SCIENTIFIC

Moat: Catalogue breadth with laboratory reach

An extremely broad catalogue combined with distribution relationships across academic, biotechnology and pharmaceutical laboratories means most purchasers reach the company's listings first regardless of what they are looking for. That breadth also supports supplying an entire workflow rather than a single reagent, which institutional purchasing frameworks increasingly prefer to fragmented sourcing.
THERMO FISHER SCIENTIFIC

Risk: Catalogue transparency exposure

A very large catalogue assembled partly through acquisition and resale contains substantial duplication and inconsistent characterisation depth across listings. As clone identifiers and validation data become purchasing criteria, breadth built on redistribution looks considerably less attractive than a smaller catalogue where every entry carries knockout-controlled data behind it.
ABCAM

Moat: Recombinant and validation programme depth

Sustained investment in recombinant conversion and published application-specific validation put the company ahead of most competitors on exactly the criteria purchasers have started applying. Knockout-controlled characterisation data is expensive to generate and cannot be assembled quickly by a competitor deciding to match it after purchasers begin asking.
ABCAM

Risk: Chinese supplier cost competition

Chinese suppliers building recombinant catalogues face no legacy hybridoma constraint and compete on characterisation as well as price, which erodes the premium that validation investment is meant to command. Competing on data quality works only while the gap is visible, and it has been narrowing steadily rather than holding.

Players Tracked

Prominent Players

Thermo Fisher Scientific
Abcam
Merck KGaA
Cell Signaling Technology
Bio-Techne

Other Key Players

Bio-Rad Laboratories
BD Biosciences
Agilent Technologies
Proteintech Group
Santa Cruz Biotechnology
Jackson ImmunoResearch
Sino Biological
ABclonal Technology
Revvity
Rockland Immunochemicals
GenScript
LI-COR Biosciences
Antibodies Incorporated
Absolute Antibody
Twist Bioscience

Recent Developments

MARCH 2026

Institutional purchasing framework adds validation criteria to reagent tenders

A university purchasing consortium added antibody characterisation criteria to its reagent framework agreement, requiring application-specific validation data and clone identifiers rather than accepting datasheet claims alone. Several suppliers were unable to provide the documentation across their listed catalogue. Datasheet claims alone were no longer accepted as evidence.
Signal: Validation is moving from a stated preference into procurement criteria, which changes who can even bid
OCTOBER 2025

Open characterisation programme publishes further commercial antibody failures

An open science characterisation programme published head to head comparisons of commercial antibodies against knockout controls across a further set of protein targets, finding a substantial proportion performing poorly or not at all. Results were released with full supplier and catalogue number attribution. Comparison used knockout controls throughout.
Signal: Attributed public failure data changes purchasing behaviour in ways that methodological commentary has never once managed
JANUARY 2026

Supplier sequences legacy hybridoma catalogue for recombinant production

A research reagent supplier sequenced a substantial portion of its legacy hybridoma catalogue and moved production to recombinant expression, preserving binders that would otherwise have been lost as cell lines aged. Existing customers were transitioned with comparative performance documentation. Cell lines had shown early signs of drift beforehand.
Signal: Sequencing legacy stock preserves the binders permanently and moves them into the fastest growing product format

Expression, Purification and Proof

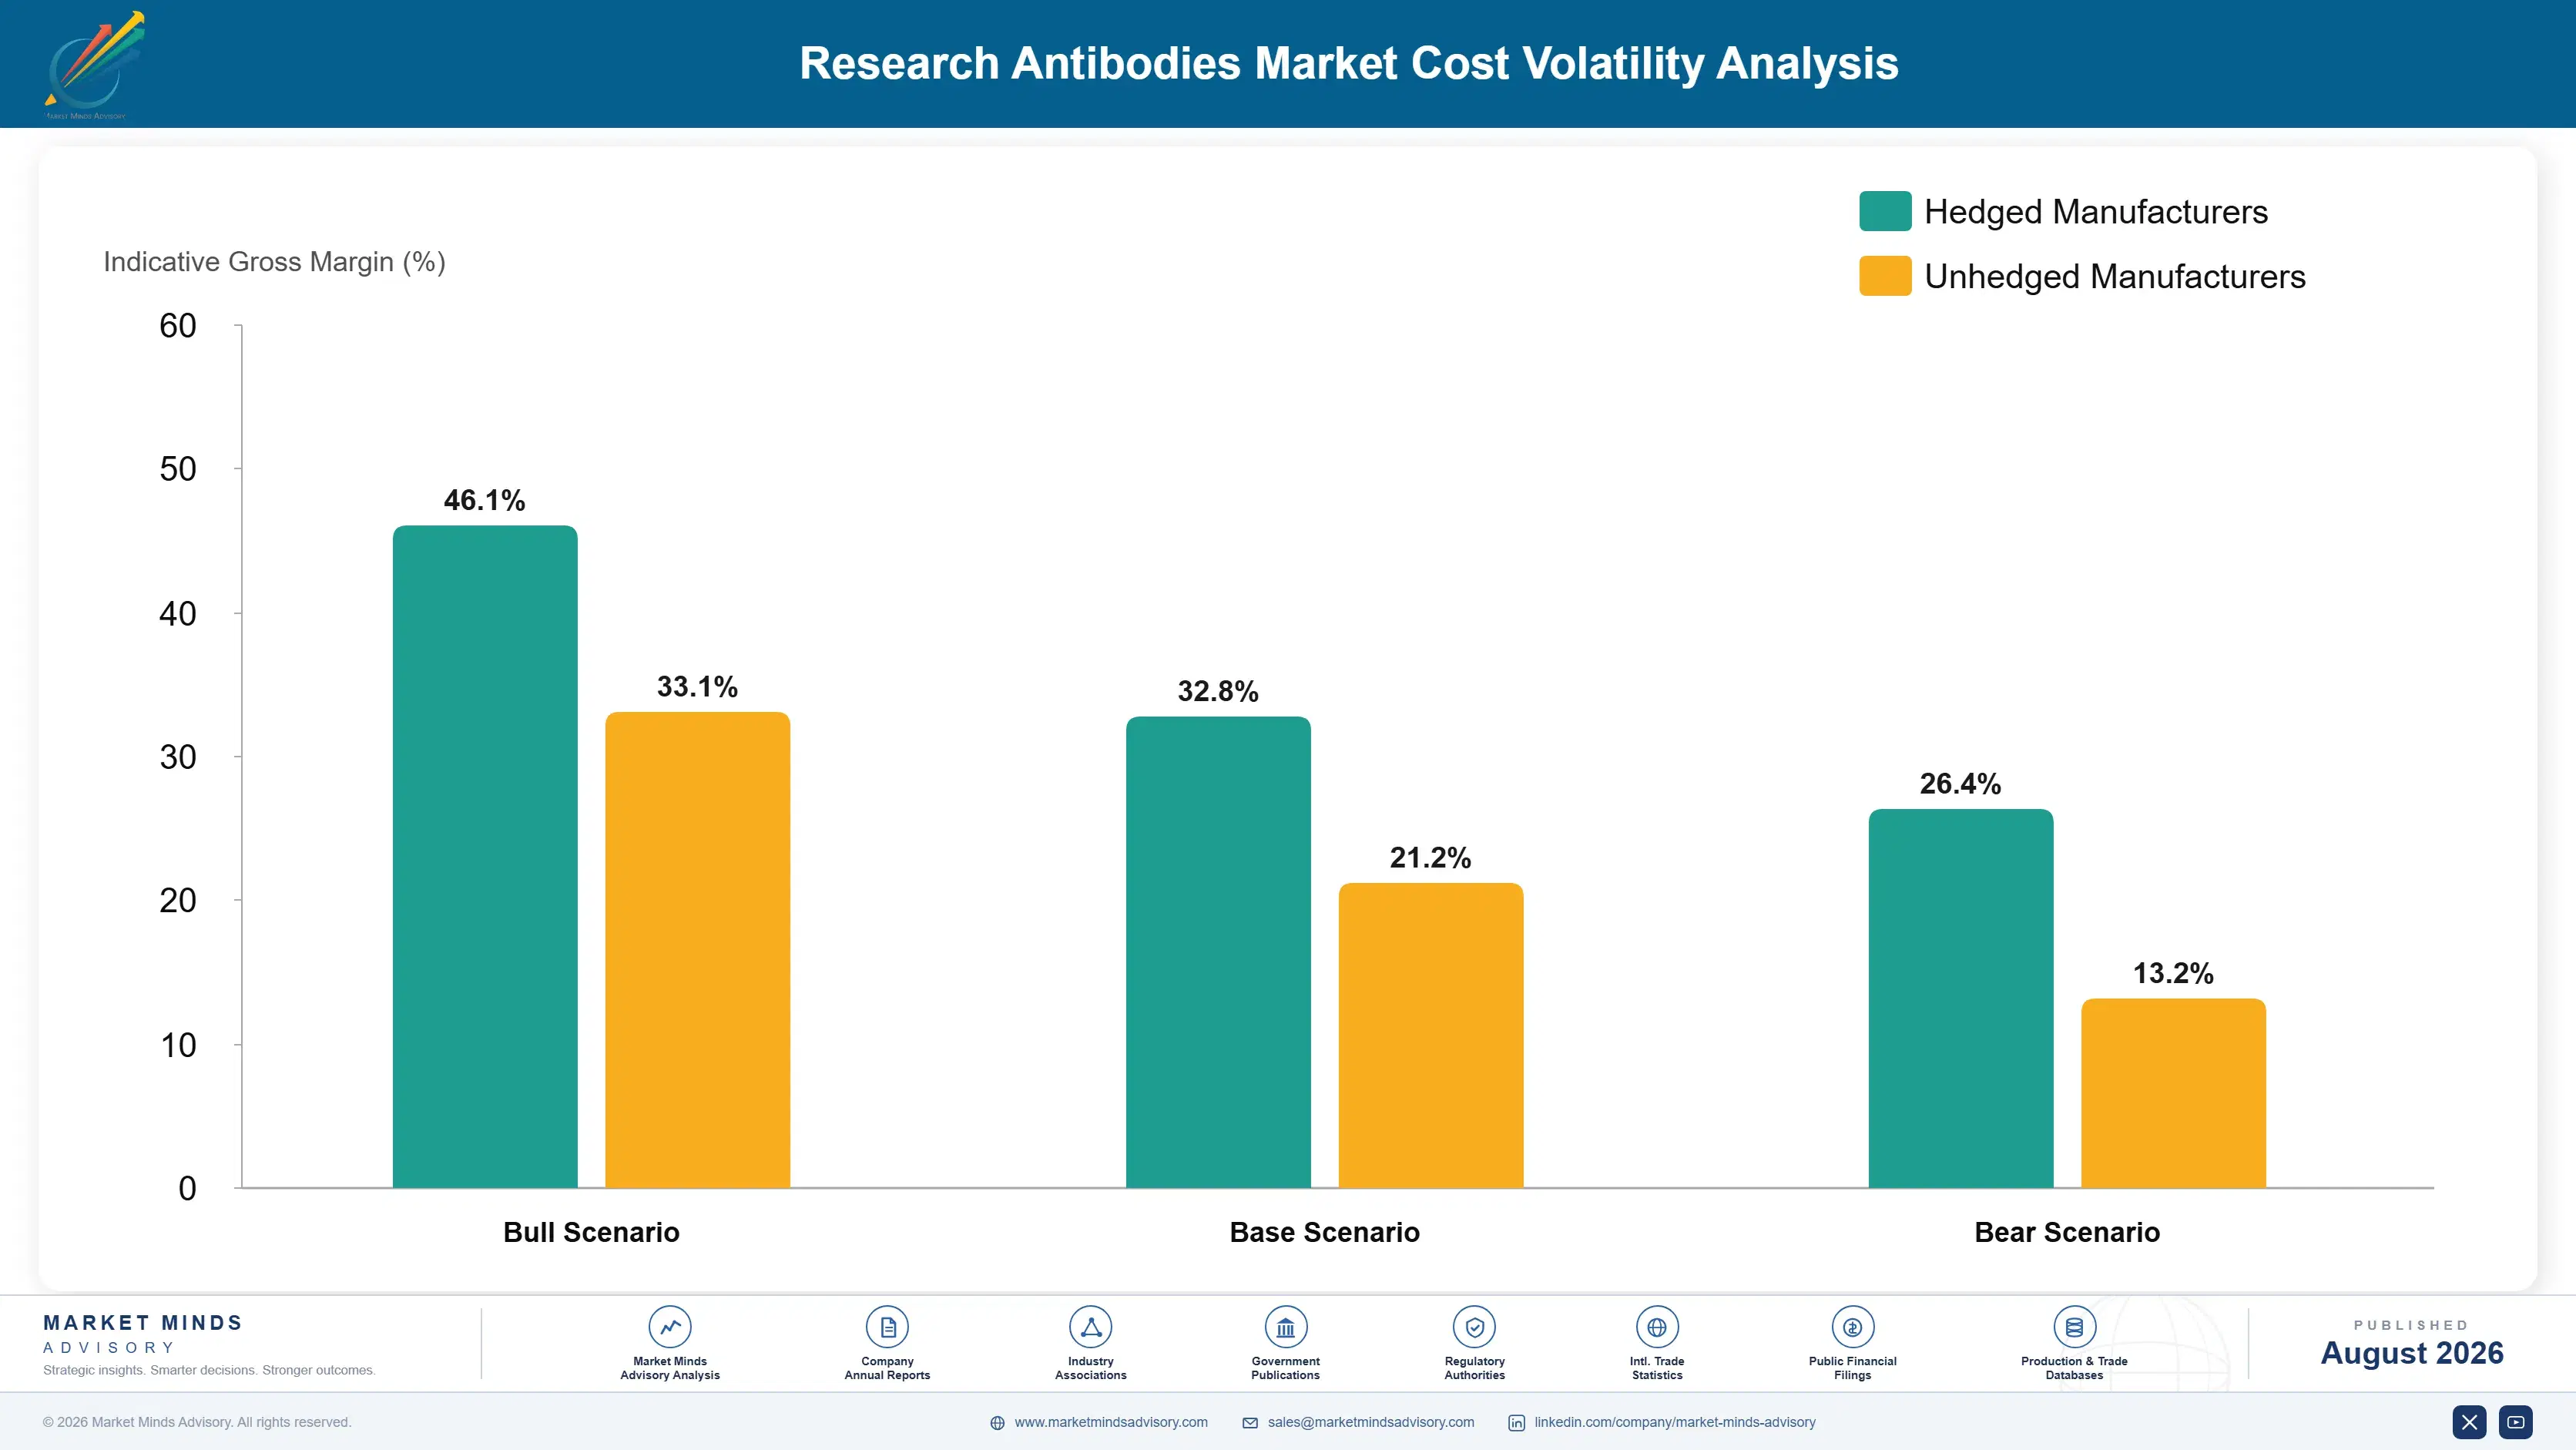
Cell culture and expression consumables account for roughly 26% of production cost for recombinant product, spanning media, transfection reagents and single-use bioreactor materials. Purification resins and chromatography consumables carry about 19%. Characterisation and validation work takes around 23%, which is unusually high and represents the actual differentiation. Cold chain logistics and packaging absorb the balance across a product that degrades invisibly if mishandled.
Single-use bioreactor and cell culture consumable pricing rose sharply through 2021 and 2022 as biopharmaceutical manufacturing demand absorbed available capacity, per national statistical office trade reporting for the period. Research reagent producers competed for the same supply against far larger pharmaceutical buyers and lost on allocation rather than on price. Chromatography resin availability tightened across the same period for similar reasons entirely. Prices normalised afterwards without lasting structural damage.

Exposure divides on production route and on validation commitment. Hybridoma production carries animal facility and cell line maintenance costs that recombinant expression avoids, while recombinant carries expression system and sequence management overhead instead. Validation spending is the discretionary line and the one that separates suppliers commercially, which makes cutting it during a cost pressure period unusually damaging to exactly the position a supplier is trying to build.
research-antibodies-market-cost-volatility-analysis-1787594883916

Secure expression consumable supply against pharmaceutical competition

Cell culture and single-use consumables are around 26% of recombinant production cost, and research reagent producers compete for allocation against pharmaceutical buyers many times their size. Multi-year supply arrangements secure volume when spot availability disappears entirely. Producers without those arrangements lost production time rather than margin during the last shortage, which cost them customers.

Protect validation spending through cost pressure periods

Characterisation work is around 23% of cost and is the only line that differentiates a supplier commercially, since around 48% of commercial reagents fail head to head testing. Cutting it during a downturn removes the position being built at exactly the moment purchasers have started asking for data. It is discretionary spending that behaves like capital investment.

Convert hybridoma production to recombinant expression progressively

Hybridoma lines require animal facilities and continuous cell line maintenance, and they eventually die regardless of how carefully they are kept. Sequencing and converting to recombinant expression removes both cost lines and the continuity risk together. The sequencing investment is modest against the value of preserving a binder that laboratories have built protocols around for years.

Portfolio Architecture for Margin Defence

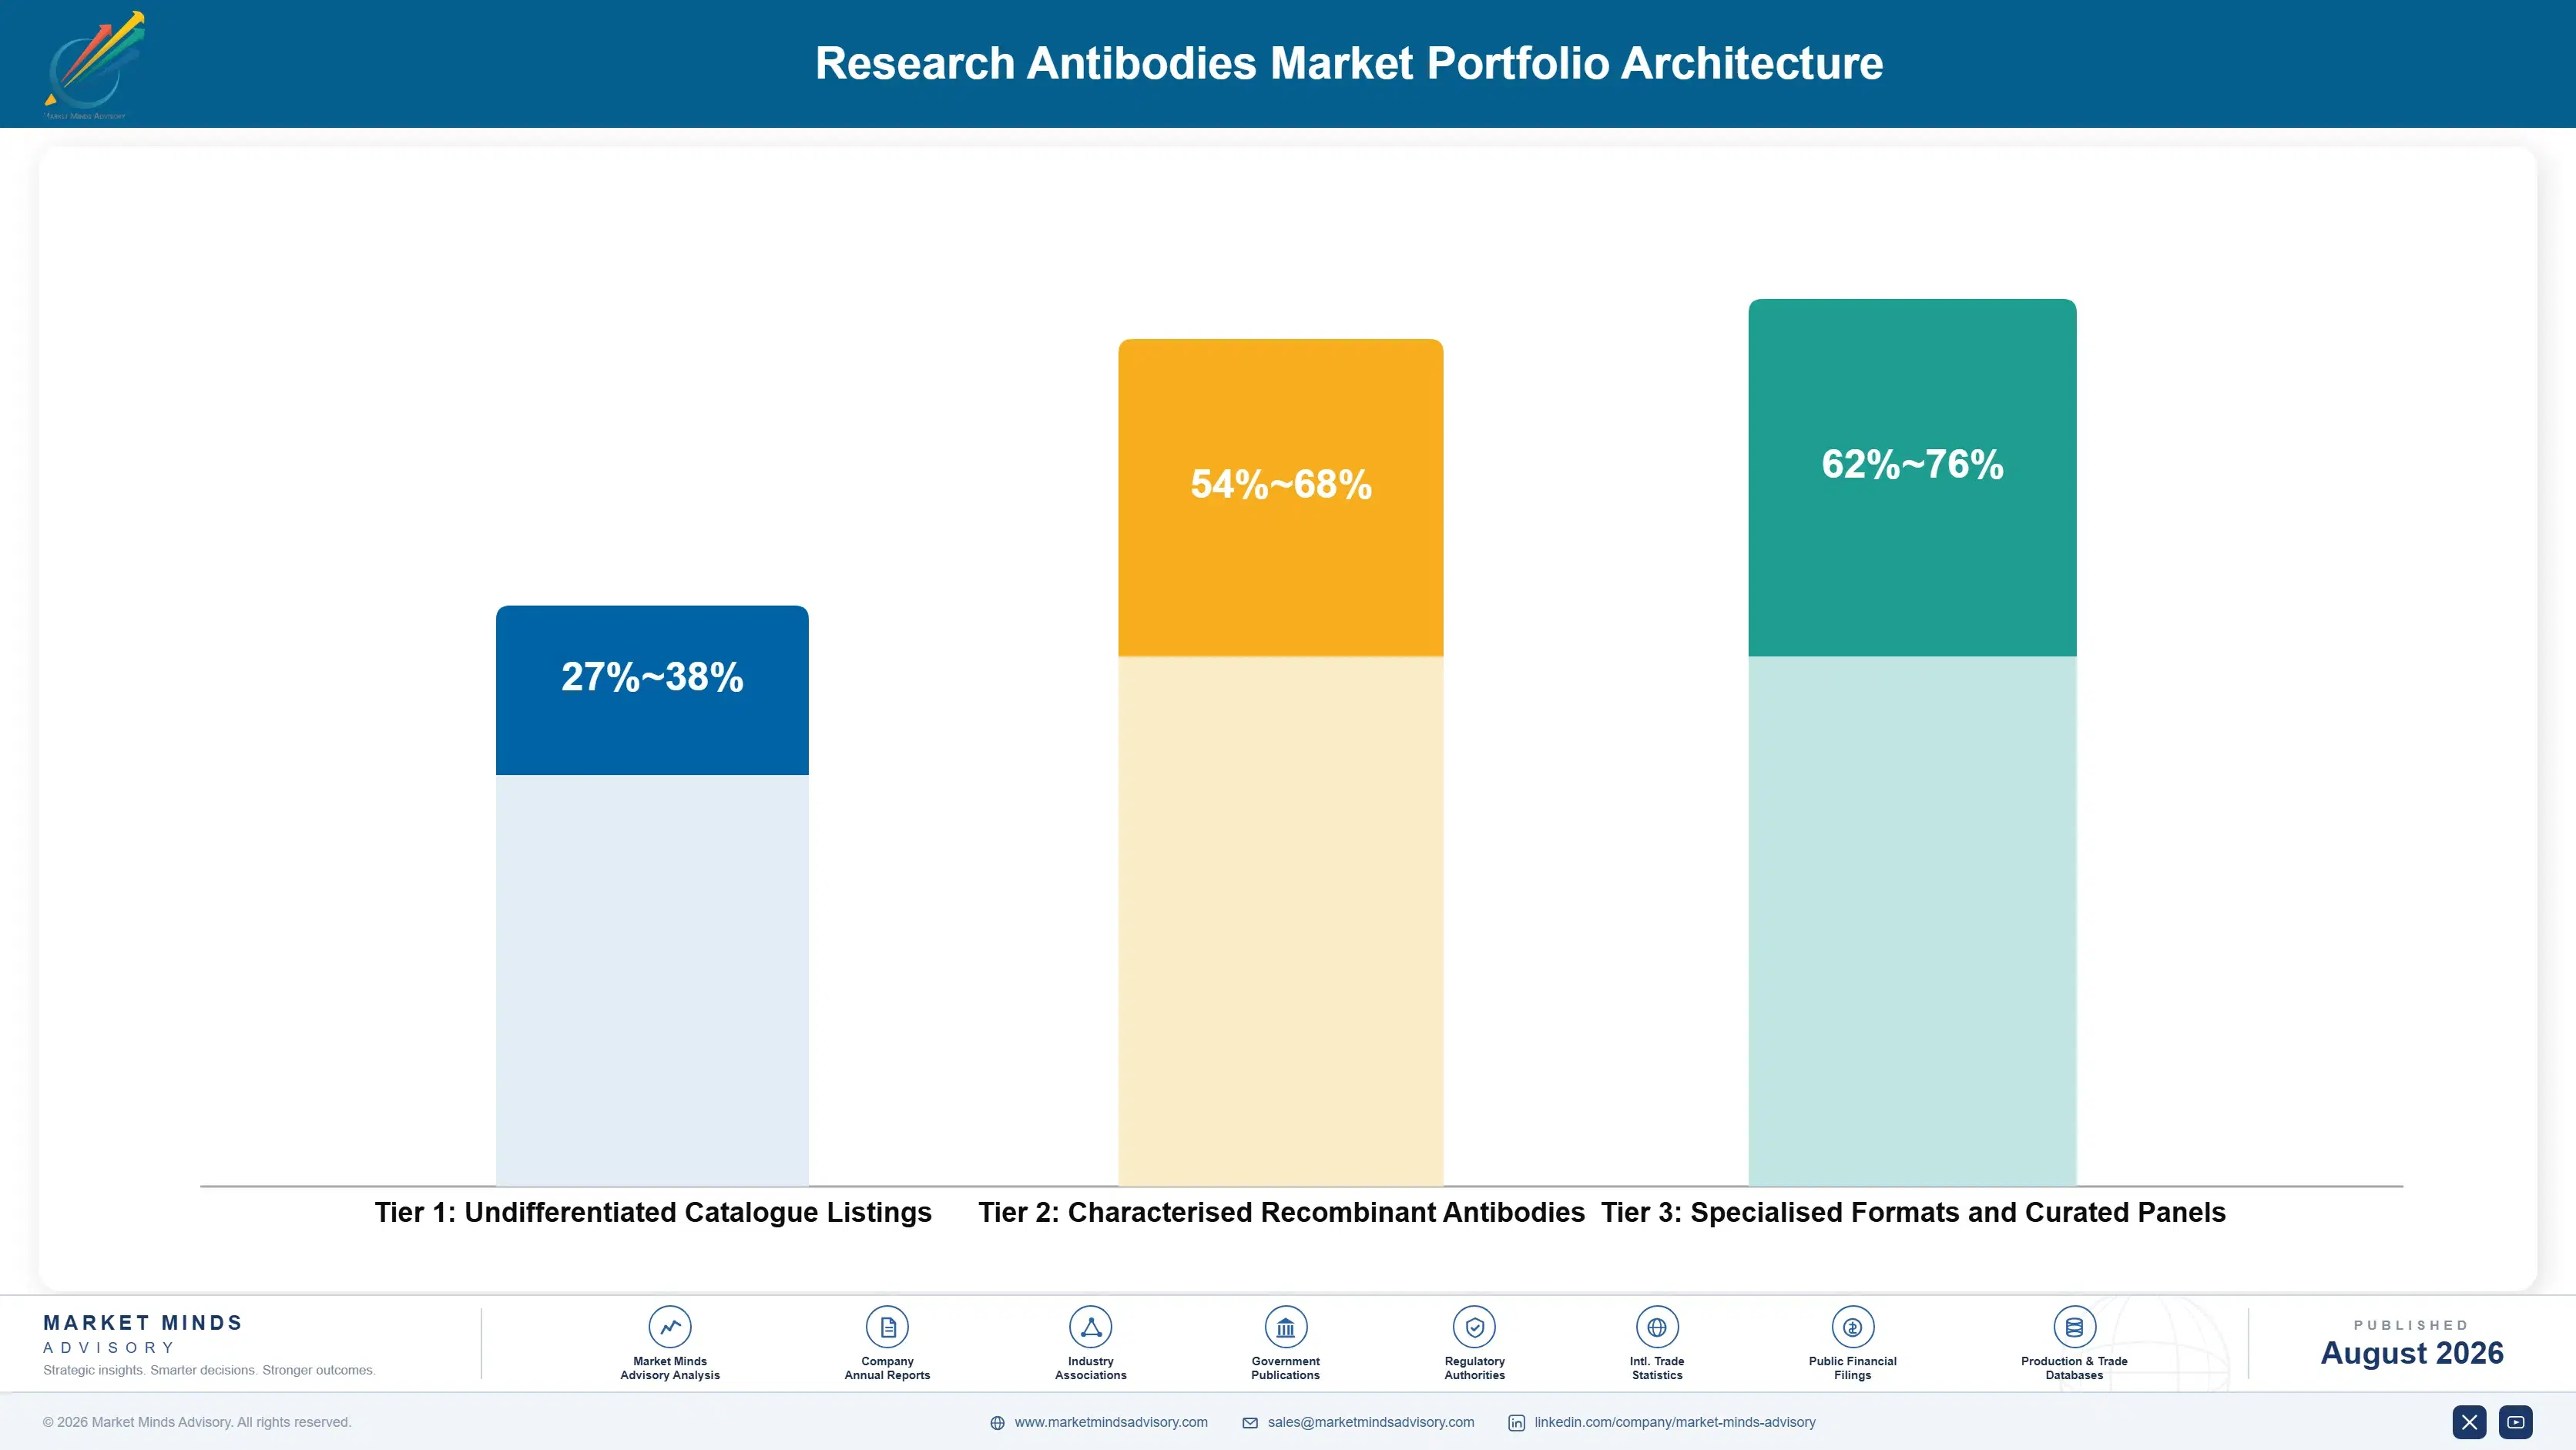
Margin here follows how much a supplier can prove rather than what it costs to produce, which is unusual even among research reagents. Undifferentiated catalogue listings, including resold product and secondary antibodies, earn margins in the high twenties to high thirties, because the same clone appears across many catalogues and purchasers compare on price where nothing else distinguishes the options. Nothing about these listings supports a premium and purchasers know it.
Recombinant product with published application-specific characterisation does considerably better in the mid fifties to high sixties, because the data cannot be assembled quickly by a competitor and the purchaser has begun asking for it. The range reflects characterisation depth and whether knockout controls were used rather than any difference in the antibody itself. Knockout-controlled data takes time to generate and cannot be matched quickly.

Specialised formats and curated panels hold the strongest position, reaching into the mid seventies, because fragment formats, single-domain constructs and validated multiplex sets serve applications where no straightforward alternative exists. Those margins reflect scarcity of qualified options rather than production cost, and they compress as catalogues fill in behind them. Those margins compress as catalogues fill in behind them, which they steadily are.

Undifferentiated Catalogue Listings

Resold product, secondary antibodies and listings without application-specific data. The eleven point range reflects distribution position rather than product difference, since the same clone frequently appears across many competing catalogues.
Gross Margin: 27-38%

Characterised Recombinant Antibodies

Sequence-defined product supplied with published application-specific validation against appropriate biological controls. The fourteen point range reflects characterisation depth and whether knockout controls were used rather than any difference in the binder itself.
Gross Margin: 54-68%

Specialised Formats and Curated Panels

Fragment and single-domain formats alongside validated multiplex reagent sets for demanding applications. The fourteen point range reflects how few qualified alternatives exist rather than any advantage in production cost or process.
Gross Margin: 62-76%
research-antibodies-market-portfolio-architecture-1787594884419

High-value Sub-segments and Strategic Watch-out

Characterised Recombinant Antibodies

High value and the fastest growth at 10.2%, since sequence definition solves reproducibility permanently and validation data is what purchasers have started requiring. Characterisation cannot be assembled quickly by a competitor deciding to match it. Around 61% of new listings already carry a sequence. Conversion is running quickly.
Gross Margin: 56-68%

Fragment and Single-Domain Formats

High value and growing at 8.6% into imaging, structural biology and intracellular applications where full-length antibodies cannot reach the epitope. These formats are sequence-defined by construction rather than by conversion effort. Single-domain constructs are unusually stable and cheap to express in bacterial systems. Adoption remains concentrated.
Gross Margin: 62-76%

Secondary and Detection Antibodies

The volume core, bought repeatedly and compared purely on price because performance differences are small and visible immediately. Nothing about these listings supports a premium, and purchasers have no reason to pay one. Performance differences here are small and immediately visible. Purchasers have no reason to pay more.
Gross Margin: 27-38%

Legacy Hybridoma and Polyclonal Stock

The strategic watch-out. Cell lines drift and die while antisera differ between bleeds, and the twenty-two point range reflects how far suppliers have sequenced legacy clones before losing them permanently. Losing a binder means losing every protocol and published figure built on it over the years.
Gross Margin: 22-44%

One Protocol, Years of Reordering

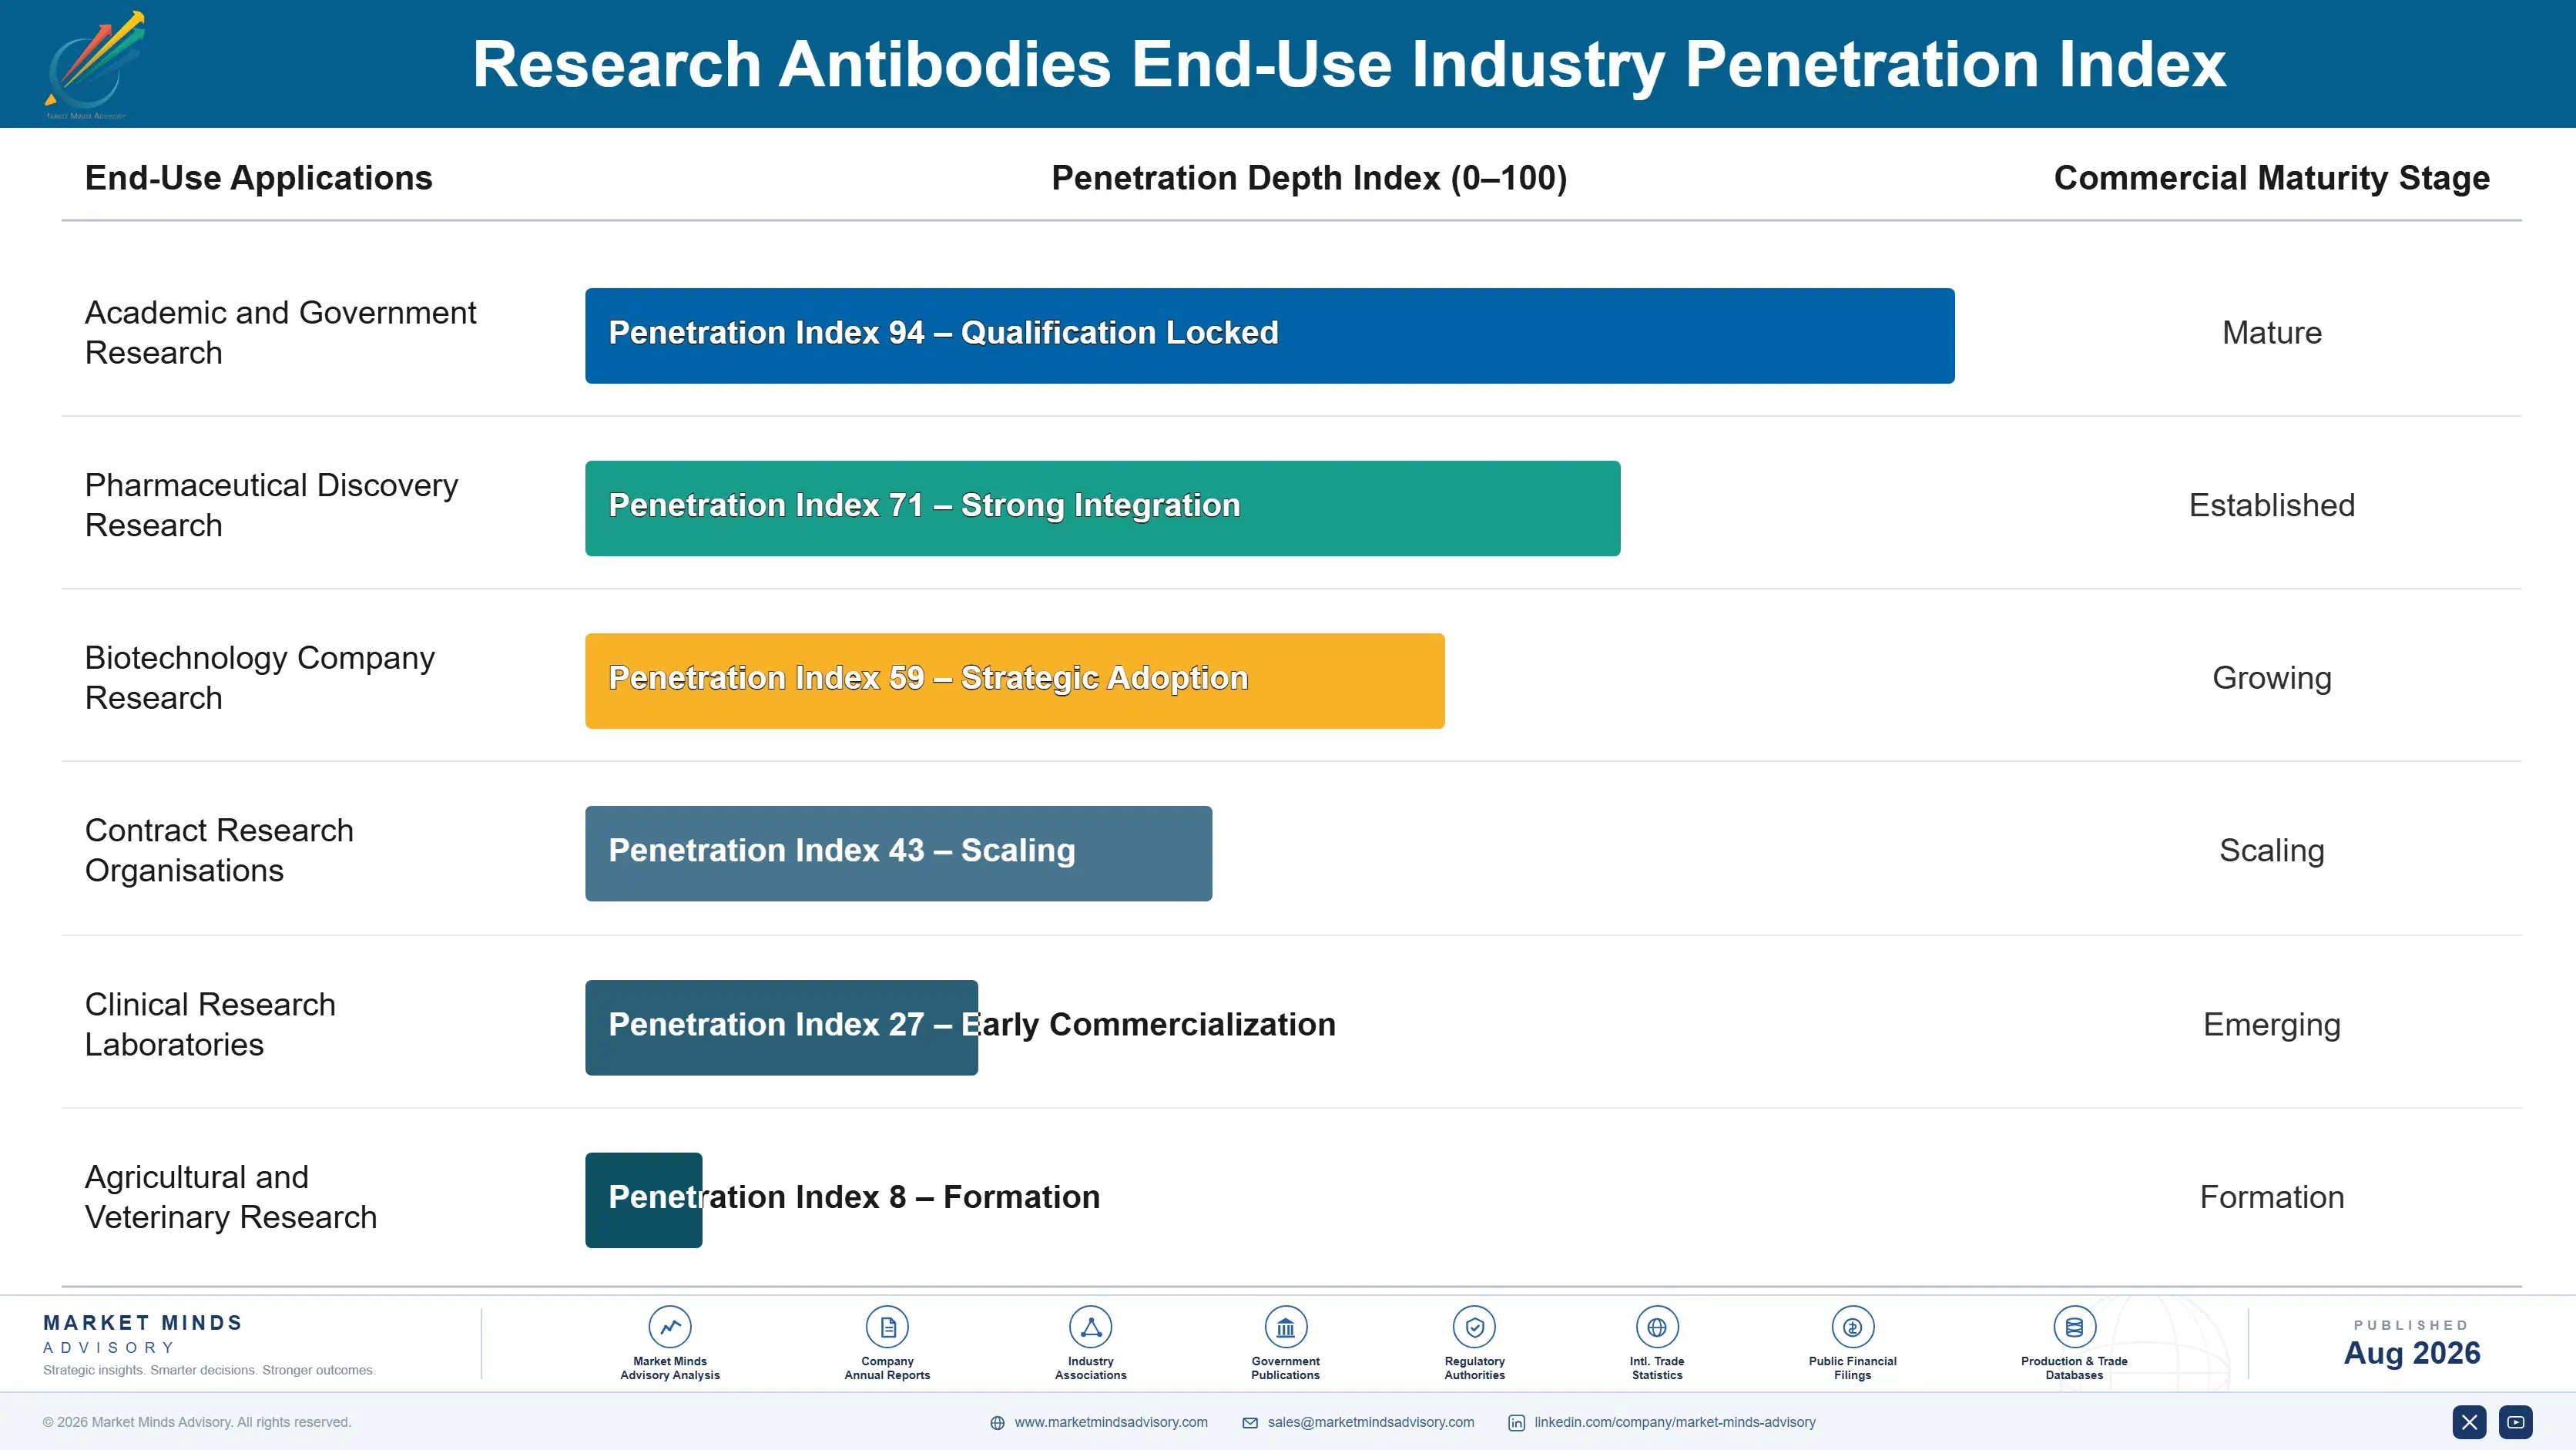
A reagent qualified into a laboratory protocol is reordered for as long as that work continues, which can run for years across multiple grant cycles and multiple students. Nothing prompts reconsideration except supply failure or a result that will not reproduce. That makes the initial selection worth far more than the first order suggests, and it explains why suppliers compete hardest for laboratories starting new programmes rather than for established ones.
Stickiness depends on how much has been built on the reagent. A protocol validated around a specific antibody, with control data and published figures behind it, is genuinely expensive to change because comparability with prior work becomes questionable. Recombinant supply strengthens that further by guaranteeing the same reagent remains available. Secondary antibodies and general detection reagents switch freely on price and availability.

The deciding voice sits with the bench scientist and the principal investigator rather than with purchasing, which handles the transaction afterwards. That has always been true and matters more now, because validation data reaches the scientist while price reaches the purchasing office. Institutional frameworks incorporating characterisation criteria are beginning to bring those two conversations into the same place.
research-antibodies-market-end-use-penetration-index-1787594884922

Where We Would Focus Effort

These are among the four positions where our research anticipates prominent divergence between winners and laggards over the coming forecast period. Each is grounded in the demand model, the regulatory perimeter, and the announced capacity pipeline.
01 / CHARACTERISATION DATA PUBLICATION

Show where it fails, not just where it works

Around 48% of commercial reagents fail when characterised head to head against the target they claim to recognise, and a datasheet listing five applications without supporting data behind it is entirely indistinguishable from one backed by knockout-controlled testing. Publishing characterisation per application, including the applications where the antibody does not perform, separates a supplier in the only way a purchaser can actually verify for themselves. It costs relatively little against a returned reagent and the customer relationship lost behind it afterwards.
02 / CLONE IDENTITY TRANSPARENCY

Tell them when they are comparing the same antibody

A single clone appears roughly nine times across the market under different supplier numbering, which means a researcher comparing two listings is frequently comparing one antibody against itself without having any way at all of knowing it. Publishing clone identifiers and resource identifiers against every listing is uncomfortable for suppliers whose catalogues substantially resell other people's product, and straightforwardly advantageous for those originating their own product. Adoption remains partial enough that moving first still carries a real competitive advantage in this market.
03 / FAILURE COST SELLING

Twenty-four thousand dollars beats a price comparison

A reagent failure consumes roughly twenty-four thousand dollars of work before anyone identifies the cause, which dwarfs any price difference between competing suppliers by several orders of magnitude. That arithmetic reaches a principal investigator directly rather than a purchasing office comparing catalogue listings purely on unit price. Almost nobody presents it, because the cost of failure lands in a different accounting period entirely from the purchase that caused it in the first place, and nothing in the purchasing process connects the two together.
04 / LEGACY STOCK CONVERSION

Sequence the clones before the cells die

Hybridoma lines drift, become contaminated and eventually die out, taking away with them binders that laboratories have built protocols and published figures firmly around across a good many years. Sequencing legacy clones and producing them recombinantly preserves those binders permanently and moves them into the format growing at 10.2% against a market rate of 6.8% overall. It also removes a supply continuity risk that quietly deters purchasers from committing a multi-year study to any one particular antibody at the outset.

Engagement Snapshot From the Field

A live engagement with an industry participant carrying material or product regulatory and market exposure ahead of a defining policy shift, showing how our research translates into a defensible multi-year portfolio strategy.
MARKET MINDS ADVISORY · CLIENT ENGAGEMENT SUMMARY
Research Antibodies Producer Strategic Portfolio Review and Transition Roadmap 2026·Investment Scenario on Research Antibodies Exposure Evaluation 2025-26
CLIENT PROFILE
A European research antibody supplier operating a catalogue of several thousand listings, roughly half originated internally and half resold from other producers, at annual revenue near 62 million euros (client-reported, unverified by MMA). Validation data was inconsistent across listings, clone identifiers were published for some entries only, and hybridoma production still dominated internal output across every product line.
STRATEGIC CHALLENGE
Two institutional purchasing frameworks had recently added characterisation requirements the company could not meet across most of its catalogue, and a Chinese competitor was winning academic accounts on both price and published data. Management were considering broadening the catalogue further, and wanted to know whether breadth or characterisation depth actually determined competitive position.
MMA APPROACH
MMA assessed characterisation coverage across the client's catalogue against emerging framework criteria, quantified duplication between originated and resold listings, benchmarked recombinant conversion progress against competitors, and tested how purchasing decisions were being made across academic and biotechnology accounts. Interviews with 47 experts covered reagent validation, laboratory purchasing and antibody production.
KEY FINDINGS
  1. Almost two thirds of the resold portion of the catalogue duplicated clones already available elsewhere, frequently at lower prices, contributing volume without any defensible commercial position.
  2. Institutional framework criteria excluded the majority of the client's listings on documentation grounds alone, irrespective of whether the underlying antibodies actually performed well.
  3. The Chinese competitor's entirely recombinant catalogue carried published characterisation data across a higher proportion of listings than the client managed on its own originated product.
  4. Internal hybridoma lines supporting several long-standing customer protocols were showing signs of drift, with no sequencing having been performed on any of them.
CLIENT PROFILE
A European research antibody supplier operating a catalogue of several thousand listings, roughly half originated internally and half resold from other producers, at annual revenue near 62 million euros (client-reported, unverified by MMA). Validation data was inconsistent across listings, clone identifiers were published for some entries only, and hybridoma production still dominated internal output across every product line.
STRATEGIC CHALLENGE
Two institutional purchasing frameworks had recently added characterisation requirements the company could not meet across most of its catalogue, and a Chinese competitor was winning academic accounts on both price and published data. Management were considering broadening the catalogue further, and wanted to know whether breadth or characterisation depth actually determined competitive position.
MMA APPROACH
MMA assessed characterisation coverage across the client's catalogue against emerging framework criteria, quantified duplication between originated and resold listings, benchmarked recombinant conversion progress against competitors, and tested how purchasing decisions were being made across academic and biotechnology accounts. Interviews with 47 experts covered reagent validation, laboratory purchasing and antibody production.
KEY FINDINGS
  1. Almost two thirds of the resold portion of the catalogue duplicated clones already available elsewhere, frequently at lower prices, contributing volume without any defensible commercial position.
  2. Institutional framework criteria excluded the majority of the client's listings on documentation grounds alone, irrespective of whether the underlying antibodies actually performed well.
  3. The Chinese competitor's entirely recombinant catalogue carried published characterisation data across a higher proportion of listings than the client managed on its own originated product.
  4. Internal hybridoma lines supporting several long-standing customer protocols were showing signs of drift, with no sequencing having been performed on any of them.
RECOMMENDED STRATEGY
Phase 1: Phase one: sequence internally originated hybridoma clones immediately, since drift is already visible and losing a binder means losing every protocol built on it. Phase 2: Phase two: publish characterisation data and clone identifiers across all originated listings, prioritising those already covered by institutional framework criteria. Phase 3: Phase three: reduce the resold catalogue rather than expanding it, since duplicated listings add volume without adding any competitive position.
OUTCOME
The supplier sequenced its principal hybridoma clones during 2026 and published characterisation across most originated listings (client-reported, unverified by MMA). One institutional framework was regained, resold listings were cut substantially, and catalogue size fell while revenue held broadly flat. Margin improved on a considerably smaller catalogue.

Frequently Asked Questions

Foundational context covering the market sizes, CAGR, scope, country, region and competition that inform every finding below. This section is provided to cover basics and most often pre-purchase conversations, answered from the MMA Primary Research Dataset.

What is the current size of the Research Antibodies Market?

MMA sizes it at USD 4.2 billion in 2025, rising to USD 4.49 billion in 2026. The figure covers antibody reagents supplied for research and preclinical use at supplier selling value.

How large will the Research Antibodies Market be by 2036?

USD 8.67 billion by 2036, an incremental USD 4.18 billion over the 2026 base and an expansion multiple of 1.93 times. Recombinant formats account for a disproportionate share.

What is the CAGR for the Research Antibodies Market 2026 to 2036?

6.8% in the base case, with a bull case at 8.0% and a bear case at 5.6%. The spread turns on whether validation becomes a purchasing requirement or stays a preference.

Which segment is growing fastest?

Recombinant full-length antibodies at 10.2%, half again the market rate of 6.8%. A defined sequence can be reproduced identically indefinitely, which solves reproducibility at its source.

Who are the major companies in the Research Antibodies Market?

Thermo Fisher Scientific, Abcam, Merck KGaA, Cell Signaling Technology and Bio-Techne lead on research antibody revenue. Fifteen further participants are profiled in the full report.

Which country is growing fastest?

China at 11.8%, driven by domestic biotechnology research, an expanding contract research sector and sustained government funding for life science research infrastructure across the country.

Report Segmentation Architecture

The full report scope spans multiple orthogonal segmentation dimensions, with cross-tabulated demand data provided for each dimension pair. Coverage extends further to regional breakdowns, trend trajectories, and the competitive detail needed to support segment-level decision-making.

By Antibody Product Format

  • Recombinant Full-Length Antibodies
  • Recombinant Fragment and Single-Domain Formats
  • Hybridoma-Derived Monoclonal Antibodies
  • Polyclonal Antisera
  • Secondary and Detection Antibodies
  • Antibody Panels and Multiplex Reagent Sets

By End-Use Industry

  • Academic and Government Research
  • Pharmaceutical Discovery Research
  • Biotechnology Company Research
  • Contract Research Organisations
  • Clinical Research Laboratories
  • Agricultural and Veterinary Research

By Commercial Dimension

  • Direct Catalogue Supply
  • Distributor and Reseller Channels
  • Institutional Framework Agreements
  • Bulk and Custom Format Supply
  • Conjugated and Ready-to-Use Formats
  • Export and Cross-Border Supply

By Region

  • North America
  • Western Europe
  • East Asia
  • South Asia and Pacific
  • Latin America
  • Middle East and Africa
  • Eastern Europe

Scope, Methodology, and Coverage

Every figure in this report is reproducible from documented input assumptions. The scope below maps the historical period, the forecast horizon, the segmentation dimensions, and the countries covered, alongside the underlying primary and qualitative methodology.
Historical Period
2020 to 2025
Forecast Period
2026 to 2036
Base Year
2025 (USD billions; MMA Primary Research Dataset, August 2026)
Market Definition
Antibody reagents supplied for research and preclinical use, covering recombinant full-length antibodies, recombinant fragment and single-domain formats, hybridoma-derived monoclonal antibodies, polyclonal antisera, secondary and detection antibodies, and antibody panels and multiplex reagent sets. Measured at supplier selling value across direct and distributed channels. Therapeutic and diagnostic antibodies, in vitro diagnostic kits supplied under regulatory approval, custom antibody development services, and protein and nucleic acid reagents are excluded from scope.
Quantitative Units
USD billions (current prices); million catalogue units shipped; USD per unit by product format
Segmentation Dimensions
Antibody product format; end-use research setting; commercial dimension; region
Regions Covered
North America, Western Europe, East Asia, South Asia and Pacific, Latin America, Middle East and Africa, Eastern Europe
Countries Covered
United States, Canada, Germany, United Kingdom, France, Netherlands, Sweden, Switzerland, China, Japan, South Korea, Singapore, India, Australia, Brazil, Mexico, Saudi Arabia, South Africa, Poland, Czech Republic
Key Companies Profiled
Thermo Fisher Scientific, Abcam, Merck KGaA, Cell Signaling Technology, Bio-Techne, Bio-Rad Laboratories, BD Biosciences, Agilent Technologies, Proteintech Group, Santa Cruz Biotechnology, Jackson ImmunoResearch, Sino Biological, ABclonal Technology, Revvity, Rockland Immunochemicals, GenScript, LI-COR Biosciences, Antibodies Incorporated, Absolute Antibody, Twist Bioscience
Quantitative Methodology
Primary survey, n=3,800 respondents, Q4 2025, six countries; demand-side model with trade association cross-validation
Qualitative Methodology
47 expert interviews, Q4 2025; applied to validate demand model assumptions, identify emerging dynamics, and assess competitive positioning
Report Format
PDF and XLSX data workbook (Word format preview document)
Publisher
Market Minds Advisory
Report Code
MMA-2026-HLT-125
Published
August 2026
Contact
sales@marketmindsadvisory.com | www.marketmindsadvisory.com

Purchase the full Research Antibodies Market Report (2026 to 2036).

The full report treats characterisation quality as the commercial variable rather than catalogue size, which is the reverse of how this industry has historically been assessed. It sizes all six product formats independently through 2036, quantifies catalogue duplication across suppliers by clone, and models recombinant conversion progress against remaining hybridoma dependency by participant. Regional chapters cover all seven regions with research funding and unit volumes tracked separately, because pricing pressure separates the two sharply. Competitive profiling covers 20 participants on a single revenue basis, with characterisation coverage assessed alongside catalogue scale.
Six product formats sized independently through 2036
Catalogue duplication quantified by clone across suppliers
Recombinant conversion progress mapped against hybridoma dependency
Validation criteria tracked across institutional purchasing frameworks
Twenty participants profiled on one consistent revenue basis
Research funding and unit volumes tracked separately by region

Built For The People Who Decide

From boardroom strategy to bench-side execution, this report is read cover-to-cover by leaders shaping the next decade of their industry, turning demand scenarios, market dynamics and valuation benchmarks into decisions.
CXOs/ Presidents/ VPs/ Managers
M&A and Corporate Development
Strategy Teams and R&D Heads
Procurement and Product Directors
Regulatory and Compliance Leaders
Investor Relations and Equity Analysts