Market Minds Advisory
Renewable Naphtha Market

Renewable Naphtha Market: Sustainable Aviation Fuel Co-Production and Bio-Feedstock Economics

Rising sustainable aviation fuel co-production and petrochemical decarbonization demand are pulling renewable naphtha output toward specialized blending applications even as renewable diesel co-product volume remains the largest established category worldwide.

Lead Analyst

Bilal Shaikh

Published

September 2026

Make Smarter Decisions with Customized Research Insights

Request a free sample report and evaluate market opportunities, growth trends, and competitive dynamics relevant to your business needs.

2025 MARKET VALUE$1.4BMarket Size 2025
2036 FORECAST VALUE$4.6BBase Case , 2026 to 2036
CAGR 2026 TO 203611.5 %Bull 12.8% / Bear 10.2%
INCREMENTAL OPPORTUNITY$3.1BNet 10- year value creation
EXPANSION MULTIPLE2.97x2036 value over 2026 base
Strategic Levers
M&A Pipeline
Regional Outlook
Country Rankings
Competitive Intelligence
Segmental Deep-dive
Call-Us : 91 93563 13602

Executive Snapshot and Market Trajectory

Sustainable aviation fuel blending feedstock and bio-naphtha steam cracker applications are pulling volume away from standard renewable diesel co-product use, even as diesel co-production still anchors most category revenue across established biorefinery channels worldwide. Airlines across most major markets are accelerating offtake decisions ahead of prior planning schedules.
Sustainable aviation fuel and steam cracker feedstock formats now drive the fastest growth as biorefiners scale hydroprocessed esters and fatty acids capacity, while renewable diesel co-product applications still represent the largest single segment by volume given entrenched biorefinery production economics. North America anchors the largest share of demand, tied closely to concentrated renewable diesel production capacity under state and federal fuel policy incentives. This concentration shapes producer investment priorities across the value chain.
Neste and Diamond Green Diesel dominate through established biorefinery relationships and decades of hydroprocessing expertise that smaller regional producers cannot easily replicate at comparable qualification scale. Sustainable aviation fuel demand and petrochemical decarbonization mandates are the two forces most likely to reshape category allocation over the next decade, according to underlying survey data collected across six countries. Feedstock sourcing constraints continue reshaping capacity planning.
Market Definition
The renewable naphtha market covers commercial production of bio-based naphtha generated as a co-product of hydroprocessed esters and fatty acids renewable diesel and sustainable aviation fuel production, including bio-based plastics feedstock, sustainable aviation fuel blending, renewable diesel co-product, steam cracker feedstock, marine fuel blending, and specialty solvent applications. It excludes conventional petroleum-derived naphtha and finished renewable fuel products where naphtha is not separately marketed as a distinct co-product stream.
Base Year Value
$1.4B in 2025 (MMA Primary Research Dataset, August 2026)
Forecast Period
2026 to 2036, eleven discrete annual values
CAGR
11.5% base case. Bull 12.8%. Bear 10.2%.
Fastest Growth Segment
Sustainable Aviation Fuel Blending Feedstock: 17.5% CAGR
Fastest Growth Country
India: 14.5% CAGR
Fastest Growth Region
South Asia and Pacific: 13.6% CAGR
Largest Region
North America: 34% of 2025 global value
Market Leaders
Neste Corporation, Diamond Green Diesel, Marathon Petroleum Corporation, Chevron Corporation, Phillips 66. Source: MMA Analysis based on company annual reports.
Primary Survey
n=3,800 procurement and R&D decision-makers, Q4 2025, six countries
Methodology
Demand-side build-up, cross-validated against public data, 47 expert interviews

Renewable Naphtha Market Forecast Scenarios

renewable-naphtha-market-trends-size-forecast-scenario-1787594201121
Between 2020 and 2025 the market grew quickly as renewable diesel capacity expanded rapidly across North America under state low-carbon fuel policy incentives, while sustainable aviation fuel blending demand gained meaningful traction across major aviation markets. European biorefinery capacity expansion provided further steady support throughout this period. Regulatory pressure on aviation emissions across developing markets added steady demand support.
The base case through 2036 rests on three mechanisms: continued renewable diesel production sustaining standard naphtha co-product volume across established biorefinery facilities, expanding sustainable aviation fuel blending demand among airlines pursuing decarbonization mandates, and rising bio-naphtha steam cracker feedstock adoption tied to petrochemical decarbonization commitments across major chemical manufacturing markets. These dynamics support continued category growth even as individual segments diverge meaningfully in pace across regions. Manufacturer qualification budgets favor producers demonstrating validated carbon intensity performance.
The bull case turns on major aviation regulators accelerating sustainable aviation fuel blending mandates faster than currently scheduled, pulling naphtha demand well above base case assumptions. The bear risk is prolonged policy uncertainty around renewable fuel tax credits delaying producer capacity investment decisions, slowing the biorefinery expansion cycle that underpins near-term category revenue growth. Both scenarios assume continued manufacturer commitment to expansion timelines.

Bio-Feedstock Economics and Biorefinery Capital Cycles

Two forces are shaping renewable naphtha at once: rising sustainable aviation fuel demand pulling volume toward premium blending applications, and continued renewable diesel co-production sustaining commodity-grade volume. Each pulls producer investment priorities in a somewhat different direction, splitting the category into distinct margin tiers with genuinely separate qualification economics. Investment decisions hinge on which side of that split a given producer occupies.
MARKET CONCENTRATIONCR5 62%reflects a highly concentrated renewable fuels producer base
AVERAGE SELLING PRICE$1,180/tonnesustainable aviation fuel grades command a substantial pricing premium
TOP PRODUCING COUNTRY SHAREUSA 31%reflects concentrated renewable diesel refining and export capacity
SAF BLENDING ADOPTION RATE14%share of production directed toward aviation fuel applications
FEEDSTOCK COST SHARE61%used cooking oil and animal fat feedstock dominate cost structure
POLICY CREDIT DEPENDENCE RATE44 percentshare of producer margin attributable to fuel tax credit support
Commercially, renewable naphtha supply behaves like a specialized bio-feedstock relationship rather than a pure commodity petrochemical trade. Airlines and chemical manufacturers qualify producers against exacting carbon intensity and traceability standards before committing to multi-year offtake agreements, and sustainable aviation fuel pricing has held even through periods when standard co-product naphtha faced margin pressure from feedstock cost swings. Long-term offtake contracts now embed carbon intensity and traceability clauses that did not exist a decade ago.
The next decade will be shaped by how fast sustainable aviation fuel blending demand scales across major aviation markets, whether petrochemical decarbonization commitments continue expanding steam cracker feedstock demand, and how quickly producers can scale hydroprocessing capacity while maintaining consistent carbon intensity standards across applications. Capital choices made this year will largely determine which producers hold pricing power by the mid-2030s.
"Renewable diesel co-production built this category's volume, but sustainable aviation fuel blending is where the interesting margin story sits now. Aviation decarbonization mandates keep pulling that shift forward."
Director, Renewable Fuels Practice · MMA Renewable Fuels and Bio-Based Petrochemical Feedstocks Practice · August 2026

Market Trends

SAF Mandates Accelerate Blending Feedstock Investment

Sustainable aviation fuel blending feedstock is gaining biorefiner capital investment as aviation regulators intensify blending mandates across major aviation markets pursuing decarbonization commitments. Several leading producers have documented SAF feedstock order growth tied directly to airline offtake agreements announced over the past several years. This shift gives producers with established carbon intensity certification expertise a genuine advantage over competitors reliant purely on standard renewable diesel co-production. Adoption is expected to accelerate through 2029 across most major aviation markets, supported by continued regulatory pressure on aviation carbon emissions. Retailers have responded by expanding shelf space for these fortified lines.
Market Impact: Adds 14 percent volume growth
Petrochemical Decarbonization Reshapes Chemical Manufacturer Priorities

Petrochemical decarbonization commitments are reshaping steam cracker feedstock priorities as chemical manufacturers seek bio-based naphtha alternatives to reduce scope three emissions across major manufacturing markets. Several major chemical producers have documented feedstock supply agreements favoring bio-naphtha suppliers over conventional petroleum-derived naphtha during recent sustainability commitment cycles. This shift raises production complexity for producers investing in steam cracker qualification, though early movers report improved manufacturer qualification success. Smaller specialty producers have led this transition faster than legacy incumbents, forcing established players to accelerate their own capability investment timelines considerably this year.
Market Impact: Adds 11 percent aviation demand

Market Opportunities and Growth Drivers

Low-Carbon Fuel Policy Drives Production Capacity Growth

Low-carbon fuel policy incentives across North America continue to drive substantial demand for renewable naphtha as biorefiners scale hydroprocessed esters and fatty acids capacity to capture state and federal fuel credit value. Several national biofuel associations have documented continued capacity expansion tied directly to policy incentive structures across these established markets. This demand base gives naphtha producers a durable multi-year volume foundation across renewable fuel categories, supporting steady capacity utilization at biorefinery facilities. Established manufacturers favor producers who document consistent carbon intensity performance across shipment batches. This preference increasingly shapes which producers win multi-year replacement contracts.
Market Impact: Adds 9 percent cost pressure

Airline Decarbonization Commitments Sustain SAF Demand

Airline decarbonization commitments continue to sustain growth in sustainable aviation fuel blending feedstock as carriers respond to regulatory mandates and corporate sustainability pledges across major aviation markets. Several international aviation associations have documented continued SAF offtake growth tied directly to updated emissions reduction targets across these markets. This demand base is largely insulated from standard diesel cycle softness, giving SAF-focused producers a durable multi-year revenue runway across airline relationships broadly. Manufacturers increasingly treat certified carbon intensity as a baseline requirement rather than a differentiator. This dynamic supports continued formulation loyalty across most established relationships.
Market Impact: Adds 6 percent financing cost

Market Restraints and Challenges

Feedstock Price Volatility Pressures Producer Margins

Used cooking oil and animal fat feedstock price volatility continues to pressure producer margins, driven by competing demand from multiple biofuel pathways and concentrated collection infrastructure across major sourcing regions. The root cause traces to limited feedstock collection networks globally, where disruption or competing demand can meaningfully tighten available supply for renewable naphtha co-production. The commercial impact shows up fastest in fixed-price offtake contracts, where producers carry limited pricing flexibility once agreements are confirmed. Several producers are exploring multi-supplier sourcing agreements to dampen this exposure, though building those relationships takes time to mature.
Market Impact: Adds 260 million dollars demand

Policy Uncertainty Constrains Long-Term Capacity Planning

Policy uncertainty around renewable fuel tax credits constrains how confidently producers can commit to long-term capacity expansion, given the periodic renewal cycles and political volatility surrounding federal and state incentive structures. The root cause lies in the multi-year legislative renewal process that governs key fuel tax credits, which creates planning uncertainty even for well-capitalized producers. The commercial impact falls hardest on smaller producers attempting capacity expansion, since credit uncertainty can trigger project financing delays and lasting investor caution. Several producers are diversifying revenue across multiple policy jurisdictions to mitigate this exposure over time.
Market Impact: Adds 195 million dollars demand
3 additional market trends, 3 additional growth drivers, and 3 additional restraints and challenges are covered in the full report. Contact sales@marketmindsadvisory.com to access the complete intelligence.

Segment CAGR and Growth Architecture

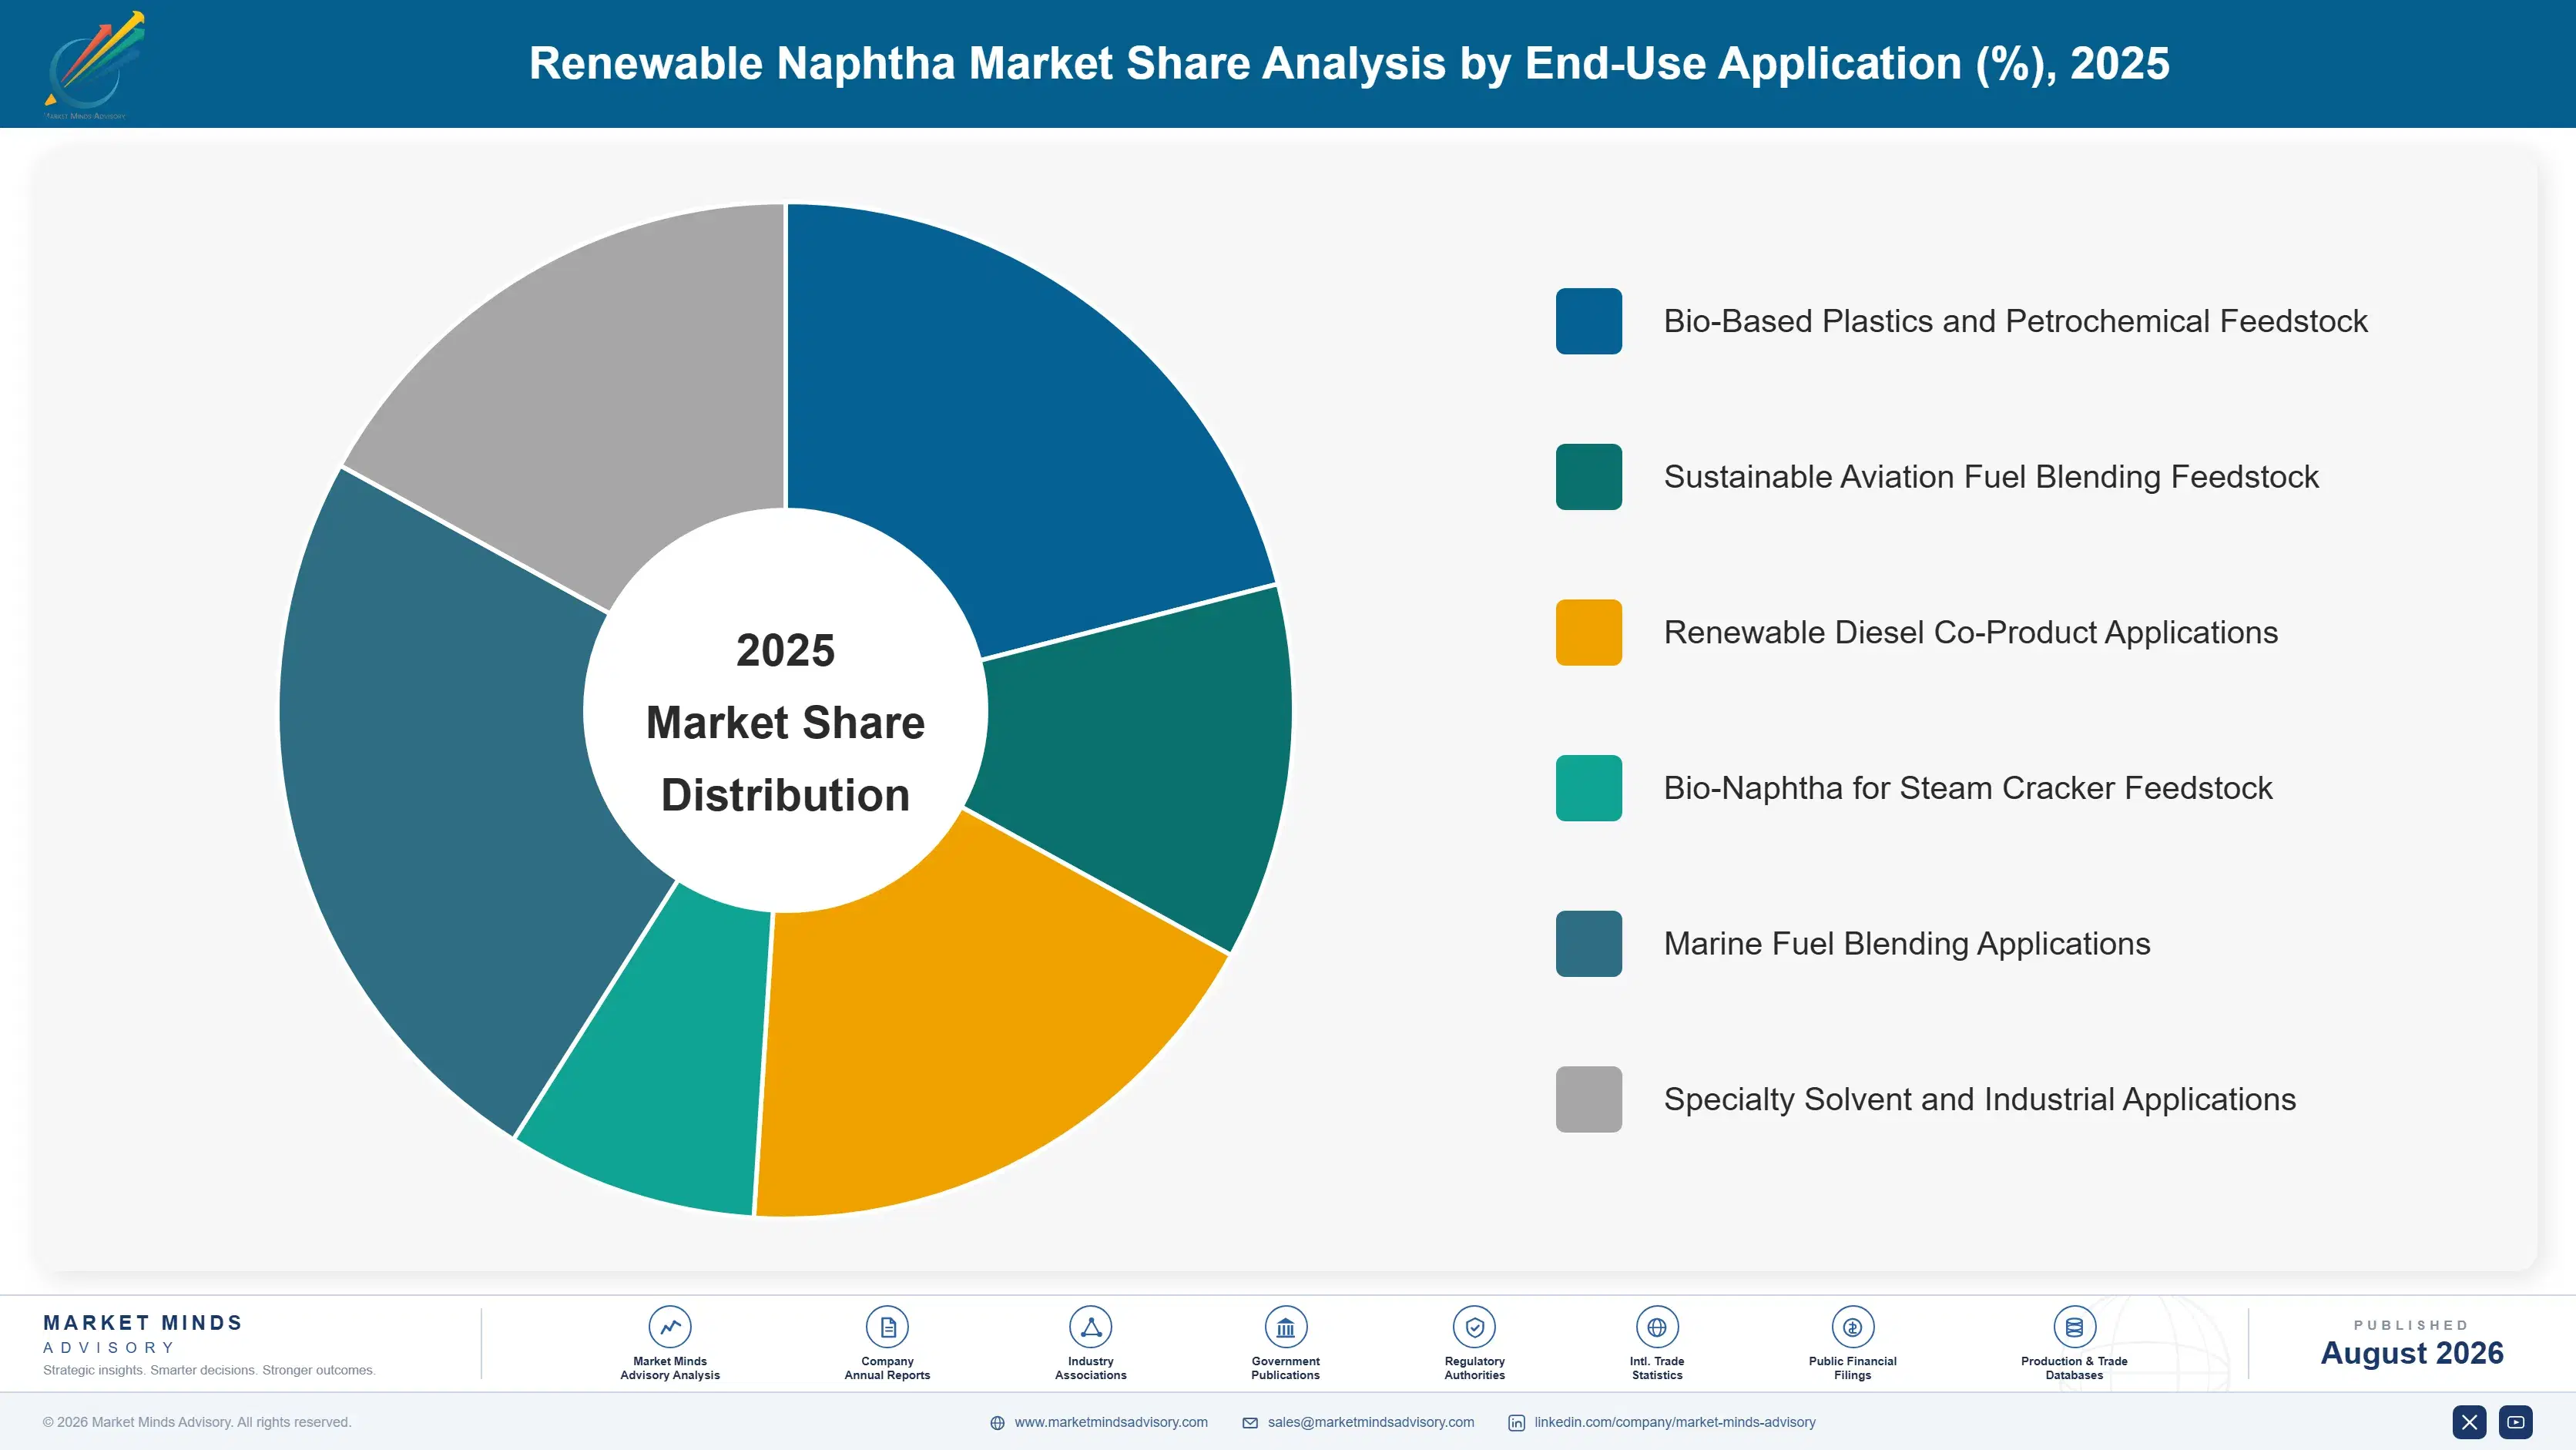
Renewable naphtha is segmented here by end-use application rather than by distribution channel or feedstock origin, since bio-plastics, SAF blending, and steam cracker formats each require genuinely distinct qualification economics. Buyers evaluate categories separately. Each classification reflects a distinct qualification relationship and manufacturing economics, not merely a different capacity choice. Buyers evaluate categories separately.
renewable-naphtha-market-trends-market-share-analysis-1787594201685

Sustainable Aviation Fuel Blending Feedstock

Sustainable aviation fuel blending feedstock is growing fastest as biorefiners respond to intensifying aviation decarbonization mandates across major aviation markets. Neste and Diamond Green Diesel lead this segment, benefiting from established carbon intensity certification expertise that smaller regional producers lack entirely, particularly around traceability documentation and blending ratio optimization. This segment faces less price sensitivity than standard co-product naphtha, since SAF-grade certification carries genuine regulatory compliance value that airlines increasingly recognize across successive offtake cycles. Margins here remain comfortably above standard formulations given the specialized certification these products require. Airlines continue expanding dedicated offtake programs for this category nationally. Airlines increasingly treat traceability validation as a qualification requirement rather than a differentiator.
CAGR 17.5%

Bio-Naphtha for Steam Cracker Feedstock

Bio-naphtha for steam cracker feedstock is growing rapidly as chemical manufacturers respond to scope three emissions reduction commitments across major petrochemical manufacturing markets. Marathon Petroleum and several specialty producers dominate this segment, benefiting from established chemical manufacturer relationships that smaller regional producers struggle to match at comparable purity consistency. This segment commands a meaningful premium over standard diesel co-product naphtha, since steam cracker qualification complexity and traceability requirements both run considerably higher. Demand should stay durable given sustained petrochemical decarbonization momentum across most developed manufacturing markets broadly. This dynamic should persist through the forecast period. Manufacturers continue investing in purity research to improve extraction economics further. This dynamic should persist through the forecast period.
CAGR 14.2%
Full segment breakdown across 6 segments available in the complete report.

Regional Architecture and Country Demand Map

North America represents the largest share of global renewable naphtha demand given concentrated renewable diesel production capacity, while South Asia and Pacific posts the fastest regional growth. Producers weigh both dynamics when allocating new capacity investment across the decade ahead. Both dynamics inform capacity planning across the decade.

North America

The United States hosts the world's largest concentration of renewable diesel biorefinery capacity, a scale advantage driven by state low-carbon fuel policy incentives and federal blender tax credits that pulls this region's share above the standard band applied to broader energy categories. This entrenched policy-driven refining infrastructure gives producers unmatched capacity investment scale relative to any other region covered in this report. Sustainable aviation fuel blending feedstock is where incremental volume now concentrates, as airlines layer decarbonization commitments onto an already substantial renewable diesel production base. Producers across the United States continue expanding hydroprocessing capacity, while Canada contributes a smaller but stable base anchored by established biorefinery relationships. Capital investment in SAF-grade capacity remains a strategic policy priority.
Share: 34% | CAGR: 10.8% (2026 to 2036)

Western Europe

Renewable naphtha demand across Western Europe reflects a mature biorefinery base anchored by Neste's dominant Rotterdam refining position, sustaining steady demand growth even as the region's overall capacity expansion moderates relative to North America. Germany and France host meaningful downstream chemical manufacturing demand for bio-naphtha steam cracker feedstock, supplying both domestic manufacturers and export markets across Europe. Regulatory sustainable aviation fuel blending mandates across the European Union continue to drive premium naphtha adoption, a compliance dynamic that sustains steady demand growth even as new refining capacity additions remain measured. Manufacturers here favor producers with proven carbon intensity documentation over newer entrants, reinforcing incumbent supplier relationships across the region's chemical and aviation sectors.
Share: 24% | CAGR: 10.0% (2026 to 2036)
Regional intelligence for 5 additional markets available in the complete report: East Asia, South Asia and Pacific, Latin America, Middle East and Africa, Eastern Europe. Contact sales@marketmindsadvisory.com.
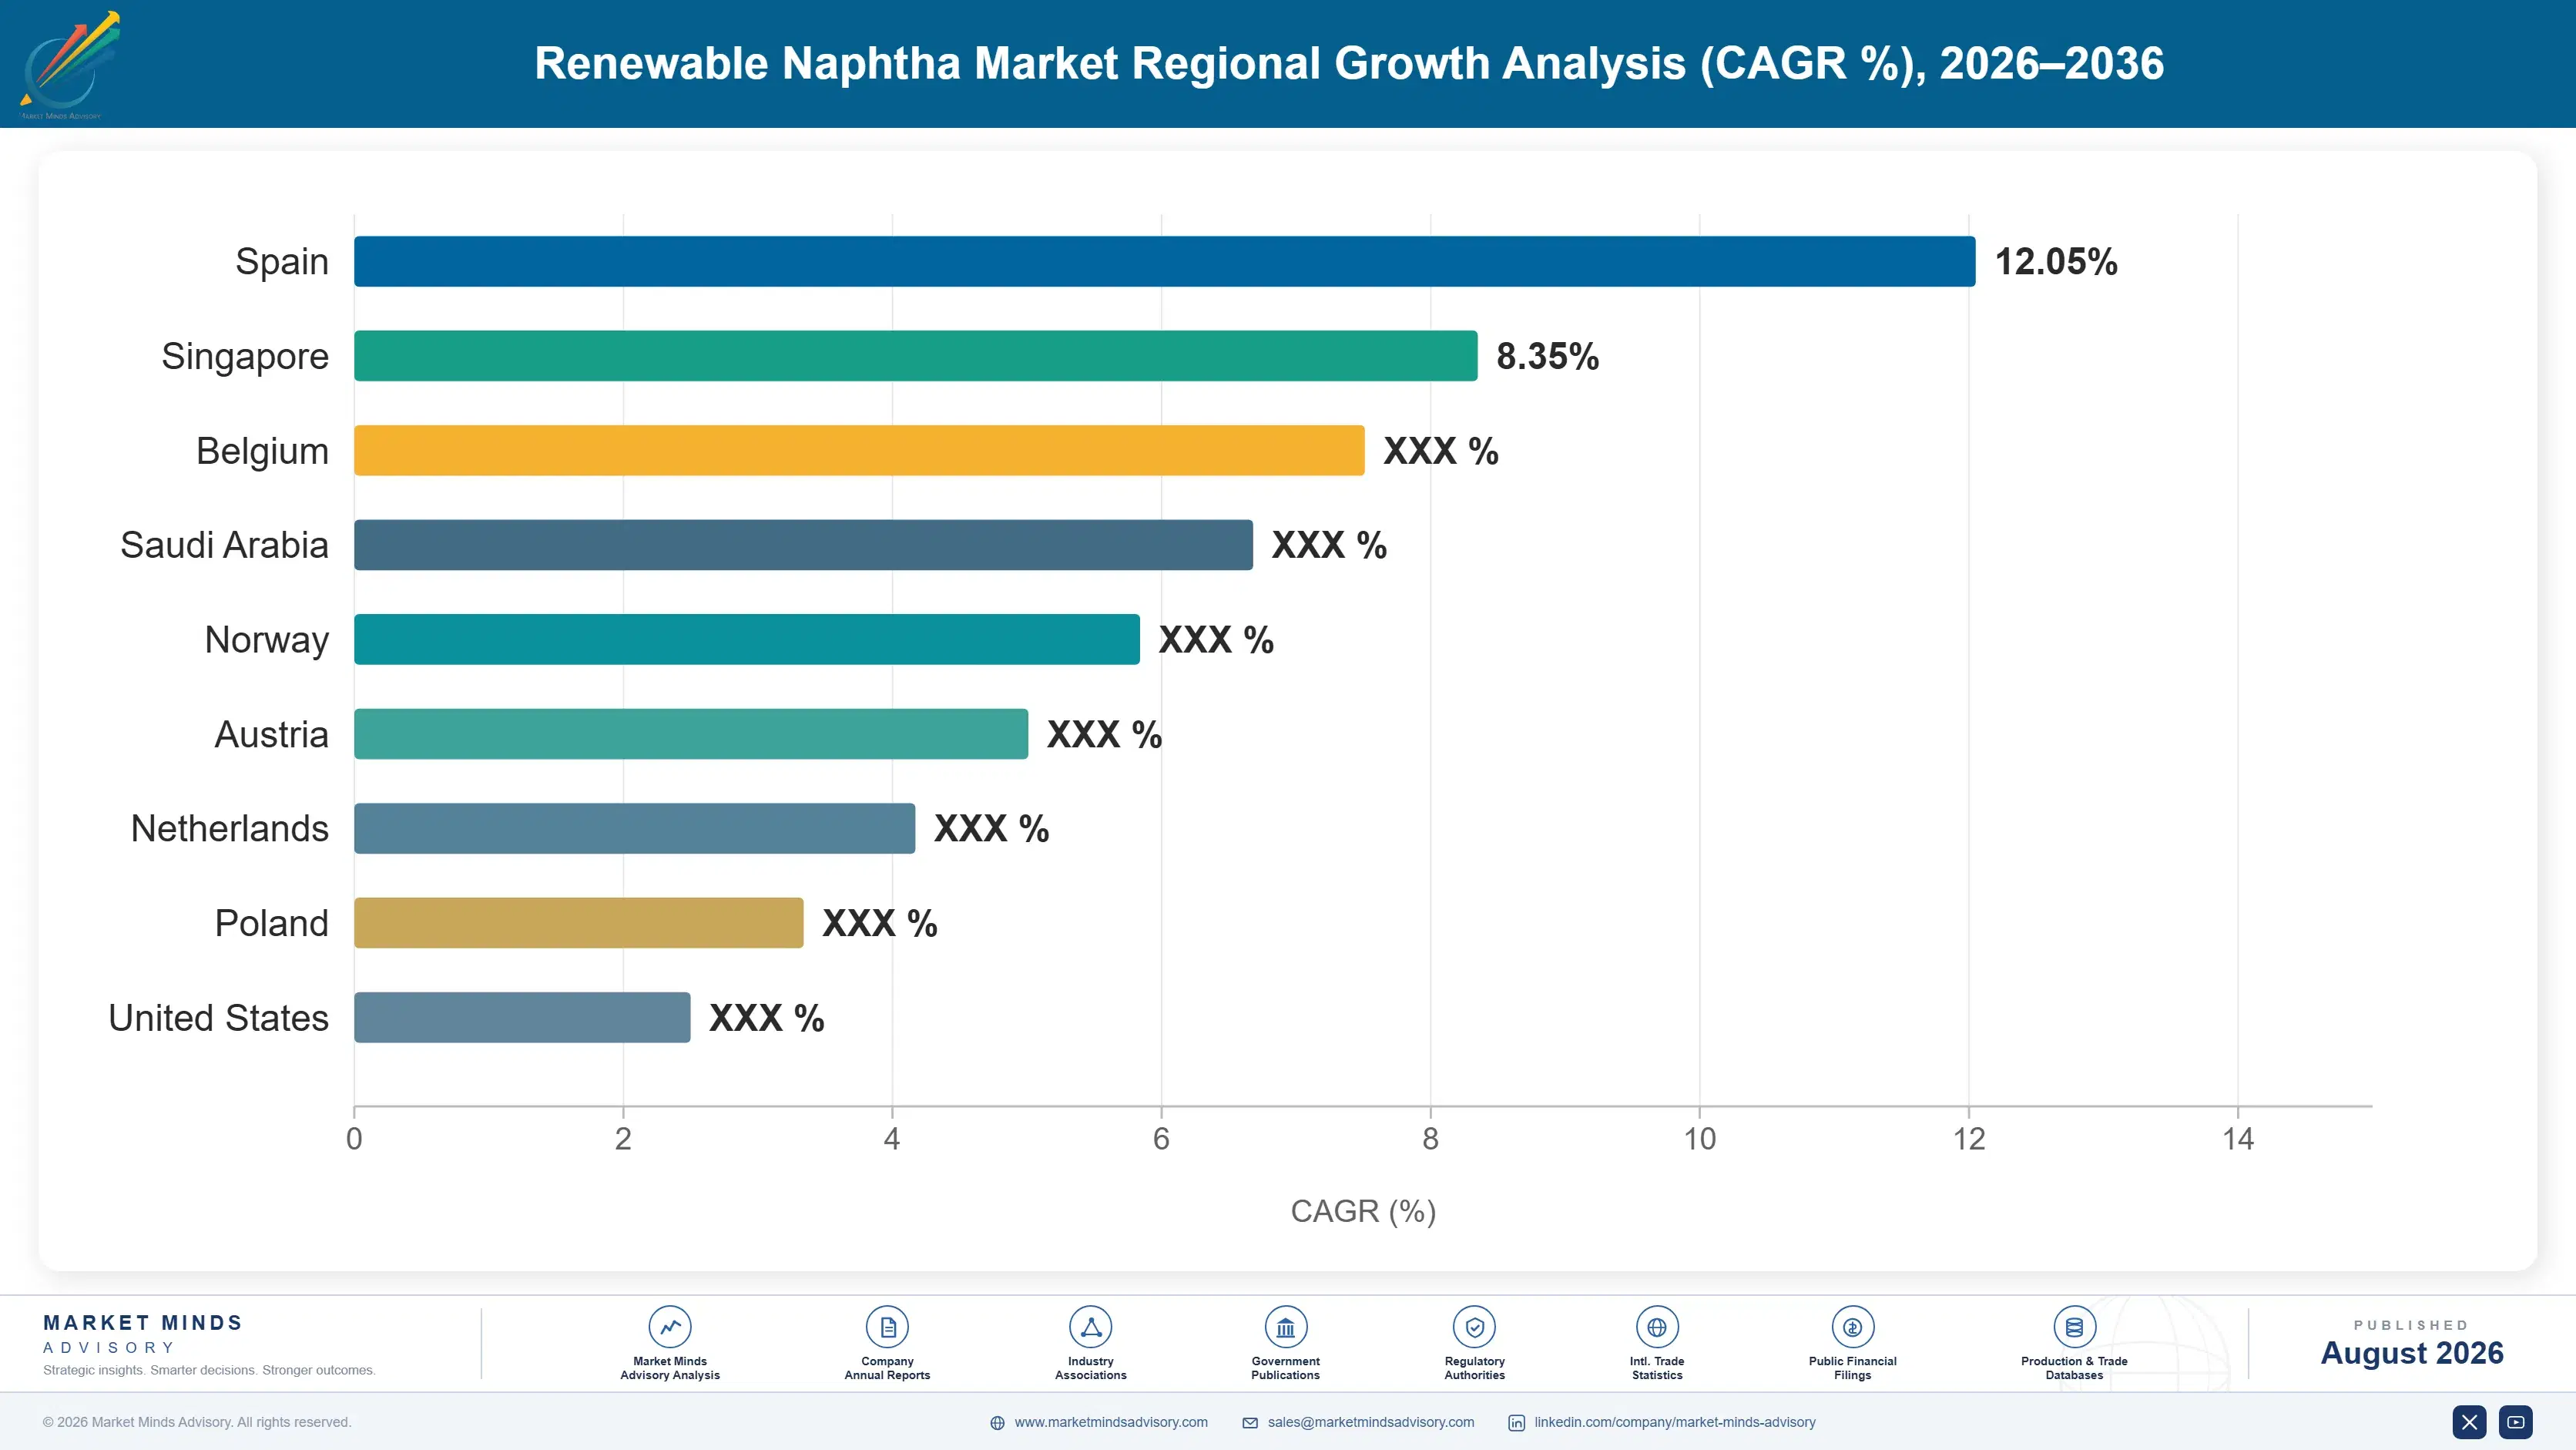
renewable-naphtha-market-trends-country-cagr-analysis-1787594202221

Where Renewable Naphtha Producers Can Capture Margin

Producers can lift margin capture by shifting mix toward sustainable aviation fuel and steam cracker feedstock formulations, expanding airline and chemical manufacturer partnerships, and building long-term feedstock supply agreements ahead of continued demand growth. These moves typically pay back within two to three years. Producers who move earliest on certification specialization tend to hold pricing advantages after competitors follow.

SAF Certification Investment Program Rollout Strategy

Producers who develop dedicated SAF certification capability capture meaningfully better margins from airlines, since customers pay a premium of 24 to 30 percent for validated carbon intensity traceability that reduces overall compliance risk across multi-year offtake contracts. Neste and Diamond Green Diesel, which made this investment earliest, now command pricing consistently above producers still weighted toward standard diesel co-production. The capital investment required is significant, but payback has compressed as SAF demand continues expanding across additional aviation markets. This advantage compounds over successive offtake cycles as airlines standardize around proven suppliers.
Market Impact: Adds 22 to 28 points margin uplift category-wide

Feedstock Sourcing Diversification Program Rollout Plan

Producers who diversify used cooking oil and animal fat feedstock sourcing across multiple regions capture supply reliability advantages that competitors reliant purely on single-region sourcing cannot credibly match during collection network disruption periods. Several producers report winning 12 to 16 percent more long-term offtake contracts after completing this diversification. Building credible multi-region sourcing relationships takes two to four years before this lever converts fully into meaningful new revenue across biorefinery categories. Producers without this diversification face meaningfully higher volatility in quarterly volume commitments during disruptions. Building this network takes considerable time to mature fully into a genuinely diversified supply base.
Market Impact: Adds 12 to 16 percent contract wins annually

Steam Cracker Qualification Acceleration Program Rollout

Producers who accelerate steam cracker feedstock qualification ahead of competitors capture offtake contract advantages from chemical manufacturers actively reallocating supplier relationships toward bio-based formats during decarbonization commitment cycles. Several specialty producers report winning 15 to 19 percent more qualification contracts after completing capability programs. Building credible steam cracker positioning takes eighteen to twenty-four months of process validation before this lever converts fully into meaningful new revenue across categories. Producers lacking dedicated qualification capability risk losing contracts to more agile competitors. This positioning increasingly factors into how major chemical manufacturers score prospective suppliers during category reviews and qualification decisions.
Market Impact: Adds 15 to 19 percent contract wins per cycle

Long-Term Airline Offtake Agreement Program Rollout

Locking multi-year offtake agreements with major airlines and chemical manufacturers trades some spot-market pricing upside for guaranteed volume and considerably reduced customer acquisition cost, an arrangement buyers increasingly prefer since it insulates fuel procurement schedules from producer capacity disruption during peak demand phases. Producers with such agreements report churn rates roughly 17 percent lower than those competing primarily on individual contract bids, supporting more confident capacity planning years ahead. This gap widens further during periods of tight feedstock supply. Producers with such agreements report considerably more confident capacity planning years ahead of anticipated demand growth.
Market Impact: Adds 17 points retention improvement nationally per cycle

Who Controls the Margin Pool

The top five producers hold roughly 62 percent of renewable feedstock production capacity, leaving a meaningful gap between Neste and Diamond Green Diesel at the top and a long tail of regional producers competing mainly on standard co-product price rather than SAF certification scale. Neste's carbon intensity certification expertise and Diamond Green Diesel's North American refining scale together anchor most category volume across developed biorefinery markets.
Current competitive activity centers on three dimensions: SAF certification launches targeting major airlines, steam cracker feedstock capability expansion to capture petrochemical decarbonization demand, and expanded feedstock sourcing partnerships as producers seek supply security. Several mid-tier players have also pursued selective acquisitions of regional feedstock collection specialists to accelerate capability entry.

Emerging pressure comes from Chinese and Southeast Asian producers expanding export capability with increasingly competitive pricing on standard co-product formulations, challenging Western incumbents in third-country markets they once dominated. Regional specialists in India are also steadily closing the certification capability gap with global incumbents, particularly around SAF traceability techniques that once required extensive proprietary expertise. Global incumbents remain comparatively cautious in responding to these emerging competitive threats given the strategic sensitivity of renewable fuel policy credits.
renewable-naphtha-market-trends-company-positioning-matrix-1787594202744

Competitive Moat and Risk Dimensions

NESTE CORPORATION

Moat: Deep carbon intensity certification expertise

Neste benefits from decades of accumulated carbon intensity certification and hydroprocessing expertise that newer entrants cannot easily replicate, giving it negotiating leverage with major airlines and chemical manufacturers that smaller regional producers simply lack across most markets. This scale advantage also gives Neste preferential access to key airline engineering teams during capital planning cycles.
NESTE CORPORATION

Risk: Slower emerging market pricing response

Neste's premium positioning and higher cost base can slow its response to increasingly competitive Asian pricing in developing markets, a complexity that gives regional producers an opening among price-sensitive mid-tier manufacturers seeking basic formulations. This dynamic gives regional producers an opening among price-sensitive mid-tier manufacturers seeking basic formulations.
DIAMOND GREEN DIESEL

Moat: Established North American refining scale

Diamond Green Diesel's extensive North American refining capacity gives it durable feedstock and offtake relationships that smaller regional producers lacking equivalent infrastructure cannot easily replicate, informing long-term purchasing decisions across comparable biorefinery facilities. This scale also translates into favorable long-term feedstock contract terms across most established North American markets.
DIAMOND GREEN DIESEL

Risk: Exposure to policy credit cycles

Diamond Green Diesel's revenue remains heavily exposed to federal and state fuel tax credit renewal timing, leaving it more exposed than diversified energy competitors to any single policy cycle's decision to move sharply against producer margin assumptions. Diversified fuel revenue only partially offsets this exposure given the scale of Diamond Green Diesel's naphtha co-product order book.

Players Tracked

Prominent Players

Neste Corporation
Diamond Green Diesel
Marathon Petroleum Corporation
Chevron Corporation
Phillips 66

Other Key Players

Valero Energy Corporation
Darling Ingredients Inc
World Energy LLC
TotalEnergies SE
Eni SpA
Repsol SA
Gevo Inc
Fulcrum BioEnergy Inc
LanzaJet Inc
Preem AB
Green Plains Inc
Cepsa
Shell plc
BP plc
Renewable Energy Group Inc

Recent Developments

FEBRUARY 2026

Neste Commissions SAF-Grade Naphtha Production Expansion

Neste Corporation commissioned an expansion of SAF-grade naphtha production capacity at one of its facilities, aimed at meeting growing demand from airlines seeking validated carbon intensity formulations. The expansion followed several years of steady order growth. Observers called it a signal of confidence in continued SAF demand.
Signal: Signals incumbents investing well ahead of confirmed long-term SAF demand growth despite still-uncertain near-term demand signals across categories
OCTOBER 2025

Diamond Green Diesel Launches Steam Cracker Feedstock Line

Diamond Green Diesel introduced a new bio-naphtha steam cracker feedstock line designed for petrochemical decarbonization applications in response to chemical manufacturer demand. The launch followed growing manufacturer demand across decarbonization categories for validated products. Executives cited rising scrutiny of scope three emissions as the reason.
Signal: Confirms steam cracker qualification is becoming a key competitive differentiator ahead of broader industry adoption timelines nationwide
JUNE 2025

Indian Refiner Commissions New Biorefinery Facility

A leading Indian energy company commissioned a new renewable diesel and naphtha co-production facility, materially increasing domestic capacity to serve both local aviation demand and export markets seeking reliable supply. Executives cited rising domestic biofuel policy investment as a key motivation. This facility also targets nearby export markets.
Signal: Signals Indian producers steadily closing the certification capability gap with incumbents even as pricing power remains concentrated

Used Cooking Oil and Feedstock Sourcing Risk

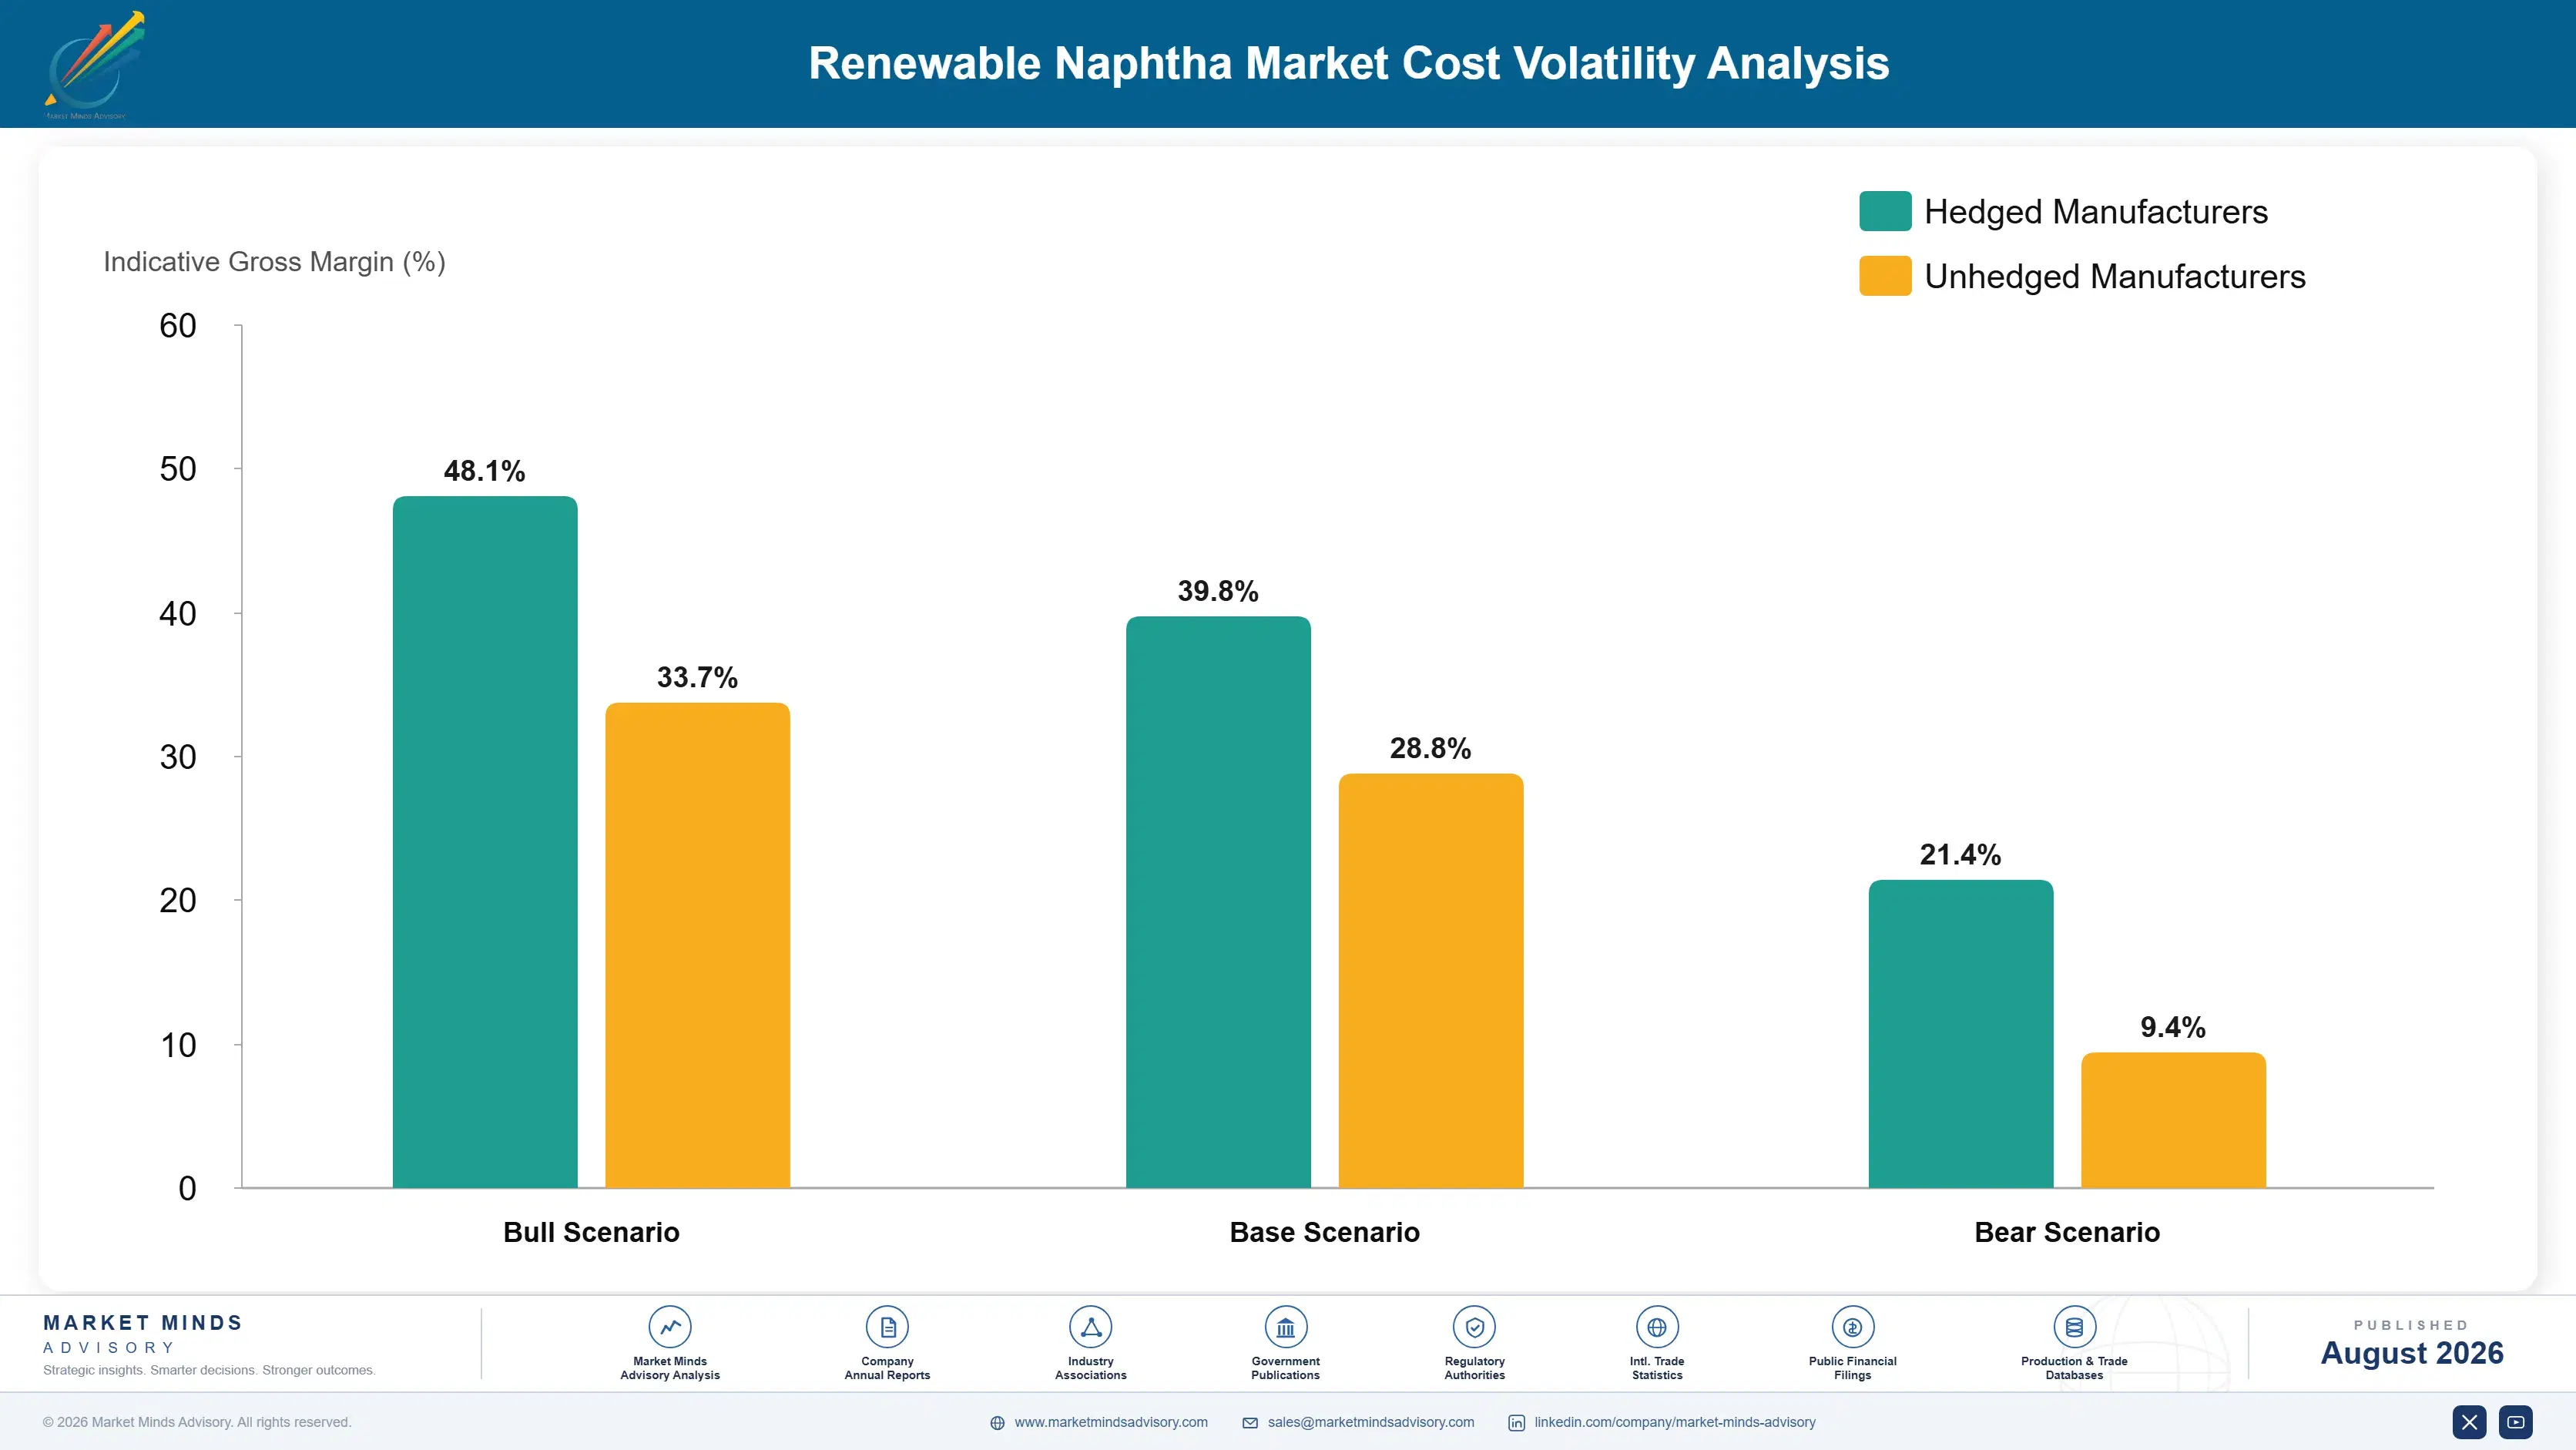
Used cooking oil and animal fat feedstock together account for roughly sixty-one percent of production cost of goods sold for most renewable naphtha producers, sourced primarily from collection networks in the United States, Europe, and Southeast Asia. Hydroprocessing catalyst and energy costs add a further meaningful input, particularly for producers manufacturing SAF-grade formulations requiring precise carbon intensity control.
Used cooking oil prices spiked sharply during 2022 to 2023 following competing biofuel demand documented in EIA renewable fuels reporting, pushing production costs up by an estimated twenty-three percent within a single year before gradually easing through 2024. Several mid-tier producers reported margin compression severe enough to delay planned capacity expansions during this period. Several producers reported delaying planned capacity investment decisions in response to sustained elevated costs during this window.

Cost exposure varies considerably by producer scale and feedstock diversification. Large integrated producers like Neste and Diamond Green Diesel, which maintain multi-year feedstock supply contracts, absorb volatility more easily than standalone regional specialists reliant on spot market purchasing. Geographically, producers with diversified feedstock sourcing across multiple regions benefit from more stable costs, while smaller regional producers face higher exposure during periods of sharp price appreciation.
renewable-naphtha-market-trends-cost-volatility-analysis-1787594202938

Multi-Year Feedstock Supply Agreements

Several producers have moved to multi-year used cooking oil and animal fat purchase agreements with collection networks, trading some pricing flexibility for protection against the kind of sharp spikes documented during the 2022 to 2023 disruption, reducing quarter-to-quarter cost unpredictability meaningfully for finance teams and offtake partners alike. Several suppliers have extended these agreements to five-year terms for planning certainty.

Feedstock Sourcing Geographic Diversification

Producers are diversifying feedstock sourcing across multiple countries and collection networks to reduce dependence on any single region's supply disruption, trading some sourcing complexity for meaningfully improved delivery security across cycles and geographies going forward. Producers report this approach has meaningfully reduced quarter-to-quarter delivery delays during recent disruptions. This strategy takes time to build fully into a diversified network.

Backward Integration Into Collection Networks

The largest producers are integrating backward into feedstock collection and pre-processing operations, capturing margin previously paid to third-party aggregators while also gaining direct visibility into feedstock cost trends ahead of broader market-wide price movements affecting smaller competitors. This integration requires significant upfront capital that smaller regional producers generally cannot access easily today. Several plan further integration steps ahead.

Portfolio Architecture for Margin Defence

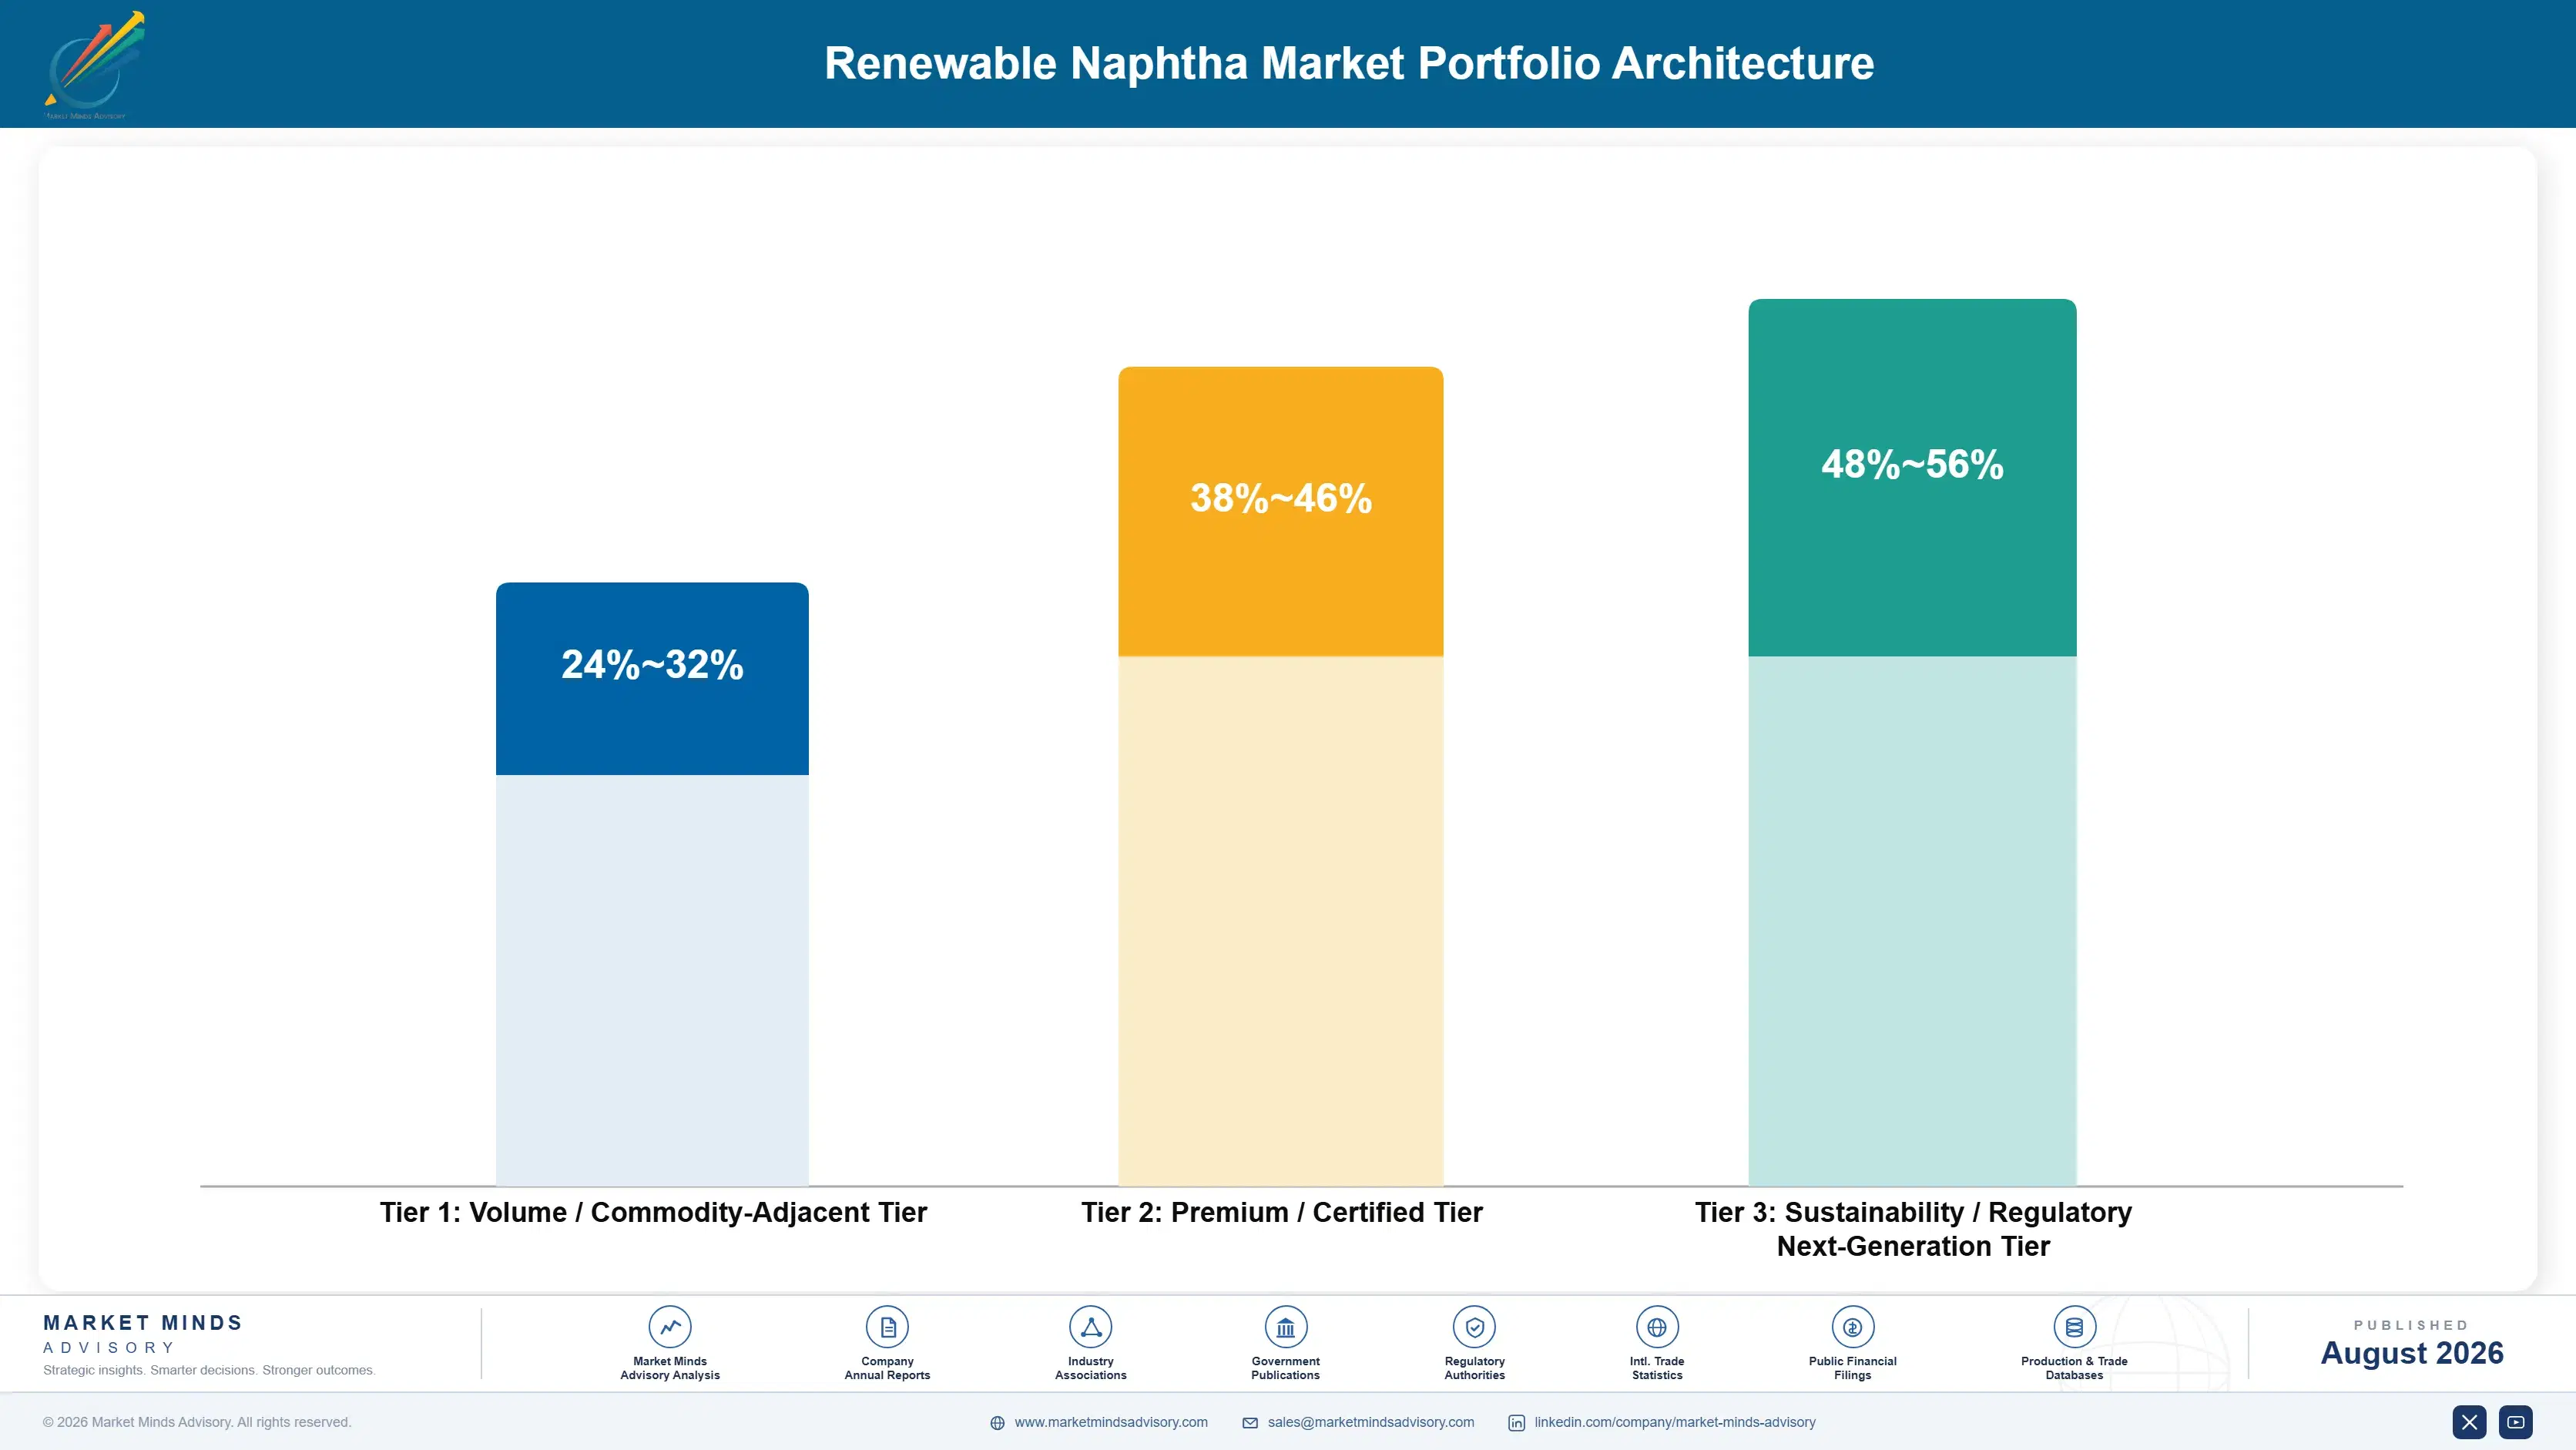
Renewable naphtha portfolios split into three tiers with genuinely different margin economics. Volume commodity-adjacent standard co-product naphtha carries the thinnest margins but the broadest biorefinery base, premium certified bio-plastics and marine fuel formulations command meaningfully wider margins on lower absolute volume, and next-generation SAF-grade and steam cracker formats sit at the top of the pricing ladder despite modest overall volume. This structure lets producers pursue distinct competitive strategies.
The tension between volume and premium positioning shapes most producer investment decisions. Standard co-product naphtha still generates meaningful category revenue given its broad biorefinery base, but margin growth increasingly concentrates in premium and next-generation tiers where producers can differentiate on certification rather than competing purely on price against regional challengers. Manufacturers reward producers who straddle both tiers. Manufacturers reward producers who straddle both positioning strategies.

High-value margin pools concentrate most heavily in SAF-grade and steam cracker premium formats, where airlines and chemical manufacturers actively expand offtake budgets and demonstrate genuine willingness to pay above standard category pricing. Producers positioned early in these tiers are best placed to capture disproportionate profit growth over the coming decade. Producers positioned early in these higher-value tiers are best placed to capture disproportionate profit growth.

Volume / Commodity-Adjacent Tier

Standard renewable diesel co-product naphtha sold primarily on price and basic carbon intensity documentation, where petrochemical buyers dominate purchasing decisions and margins stay comparatively thin despite substantial overall biorefinery volume.
Gross Margin: 24-32%

Premium / Certified Tier

Bio-plastics feedstock and marine fuel blending formulations sold to manufacturers seeking validated sustainability beyond standard co-product naphtha, commanding a meaningful and durable pricing premium across most manufacturing markets. These formulations increasingly serve as the default premium choice for manufacturers nationwide.
Gross Margin: 38-46%

Sustainability / Regulatory / Next-Generation Tier

SAF-grade and steam cracker feedstock formats serving airlines and manufacturers with the most demanding carbon intensity and traceability requirements, commanding the category's widest margins on comparatively modest current volume. These formats require the most demanding certification and validation work across the entire category.
Gross Margin: 48-56%
renewable-naphtha-market-trends-portfolio-architecture-1787594203440

High-value Sub-segments and Strategic Watch-out

Sustainable Aviation Fuel Blending Feedstock

This segment combines the fastest volume growth with the strongest margins in the category, driven by aviation decarbonization demand and rewarding producers with dedicated certification capability already in place today. Producers positioned here early hold pricing power well into the next decade ahead. Building this pipeline further strengthens producer positioning.
Gross Margin: 48-56%

Bio-Naphtha for Steam Cracker Feedstock

Manufacturers increasingly demand validated traceability documentation here, supporting strong margins in the category, though volume remains smaller than standard co-product naphtha across the broader industry base currently. Building this capability credibly takes years of investment. Retail-facing manufacturers increasingly reward early movers in this segment. Building this pipeline takes years.
Gross Margin: 40-48%

Renewable Diesel Co-Product Applications

This remains the largest volume base in the category, with pricing under continuous competitive pressure, leaving margins thinner than premium and next-generation tiers by a wide margin overall. Producers largely view this as a stable revenue floor rather than a growth priority worth chasing aggressively.
Gross Margin: 24-32%

Bio-Based Plastics and Petrochemical Feedstock

A strategic watch-out segment where prolonged feedstock price volatility in major sourcing markets could delay reformulation investment currently supporting above-average category growth. Diversification into SAF production can help offset this concentration risk meaningfully for exposed producers. Producers most exposed lack diversified customer bases today. This exposure compounds during downturn cycles.
Gross Margin: 34-42%

Offtake Loyalty Meets Policy Cycles

Renewable naphtha demand behaves like an annuity for established producers, since airline and chemical manufacturer offtake agreements lock in supplier relationships for three to five years once carbon intensity certification is secured. This recurring qualification pattern gives producers a durable revenue base that smooths out the volatility feedstock cost swings otherwise introduce into quarterly earnings. Producers who overlook this stability risk underinvesting in genuine long-term value. Producers who overlook this stability risk underinvesting in genuine long-term value.
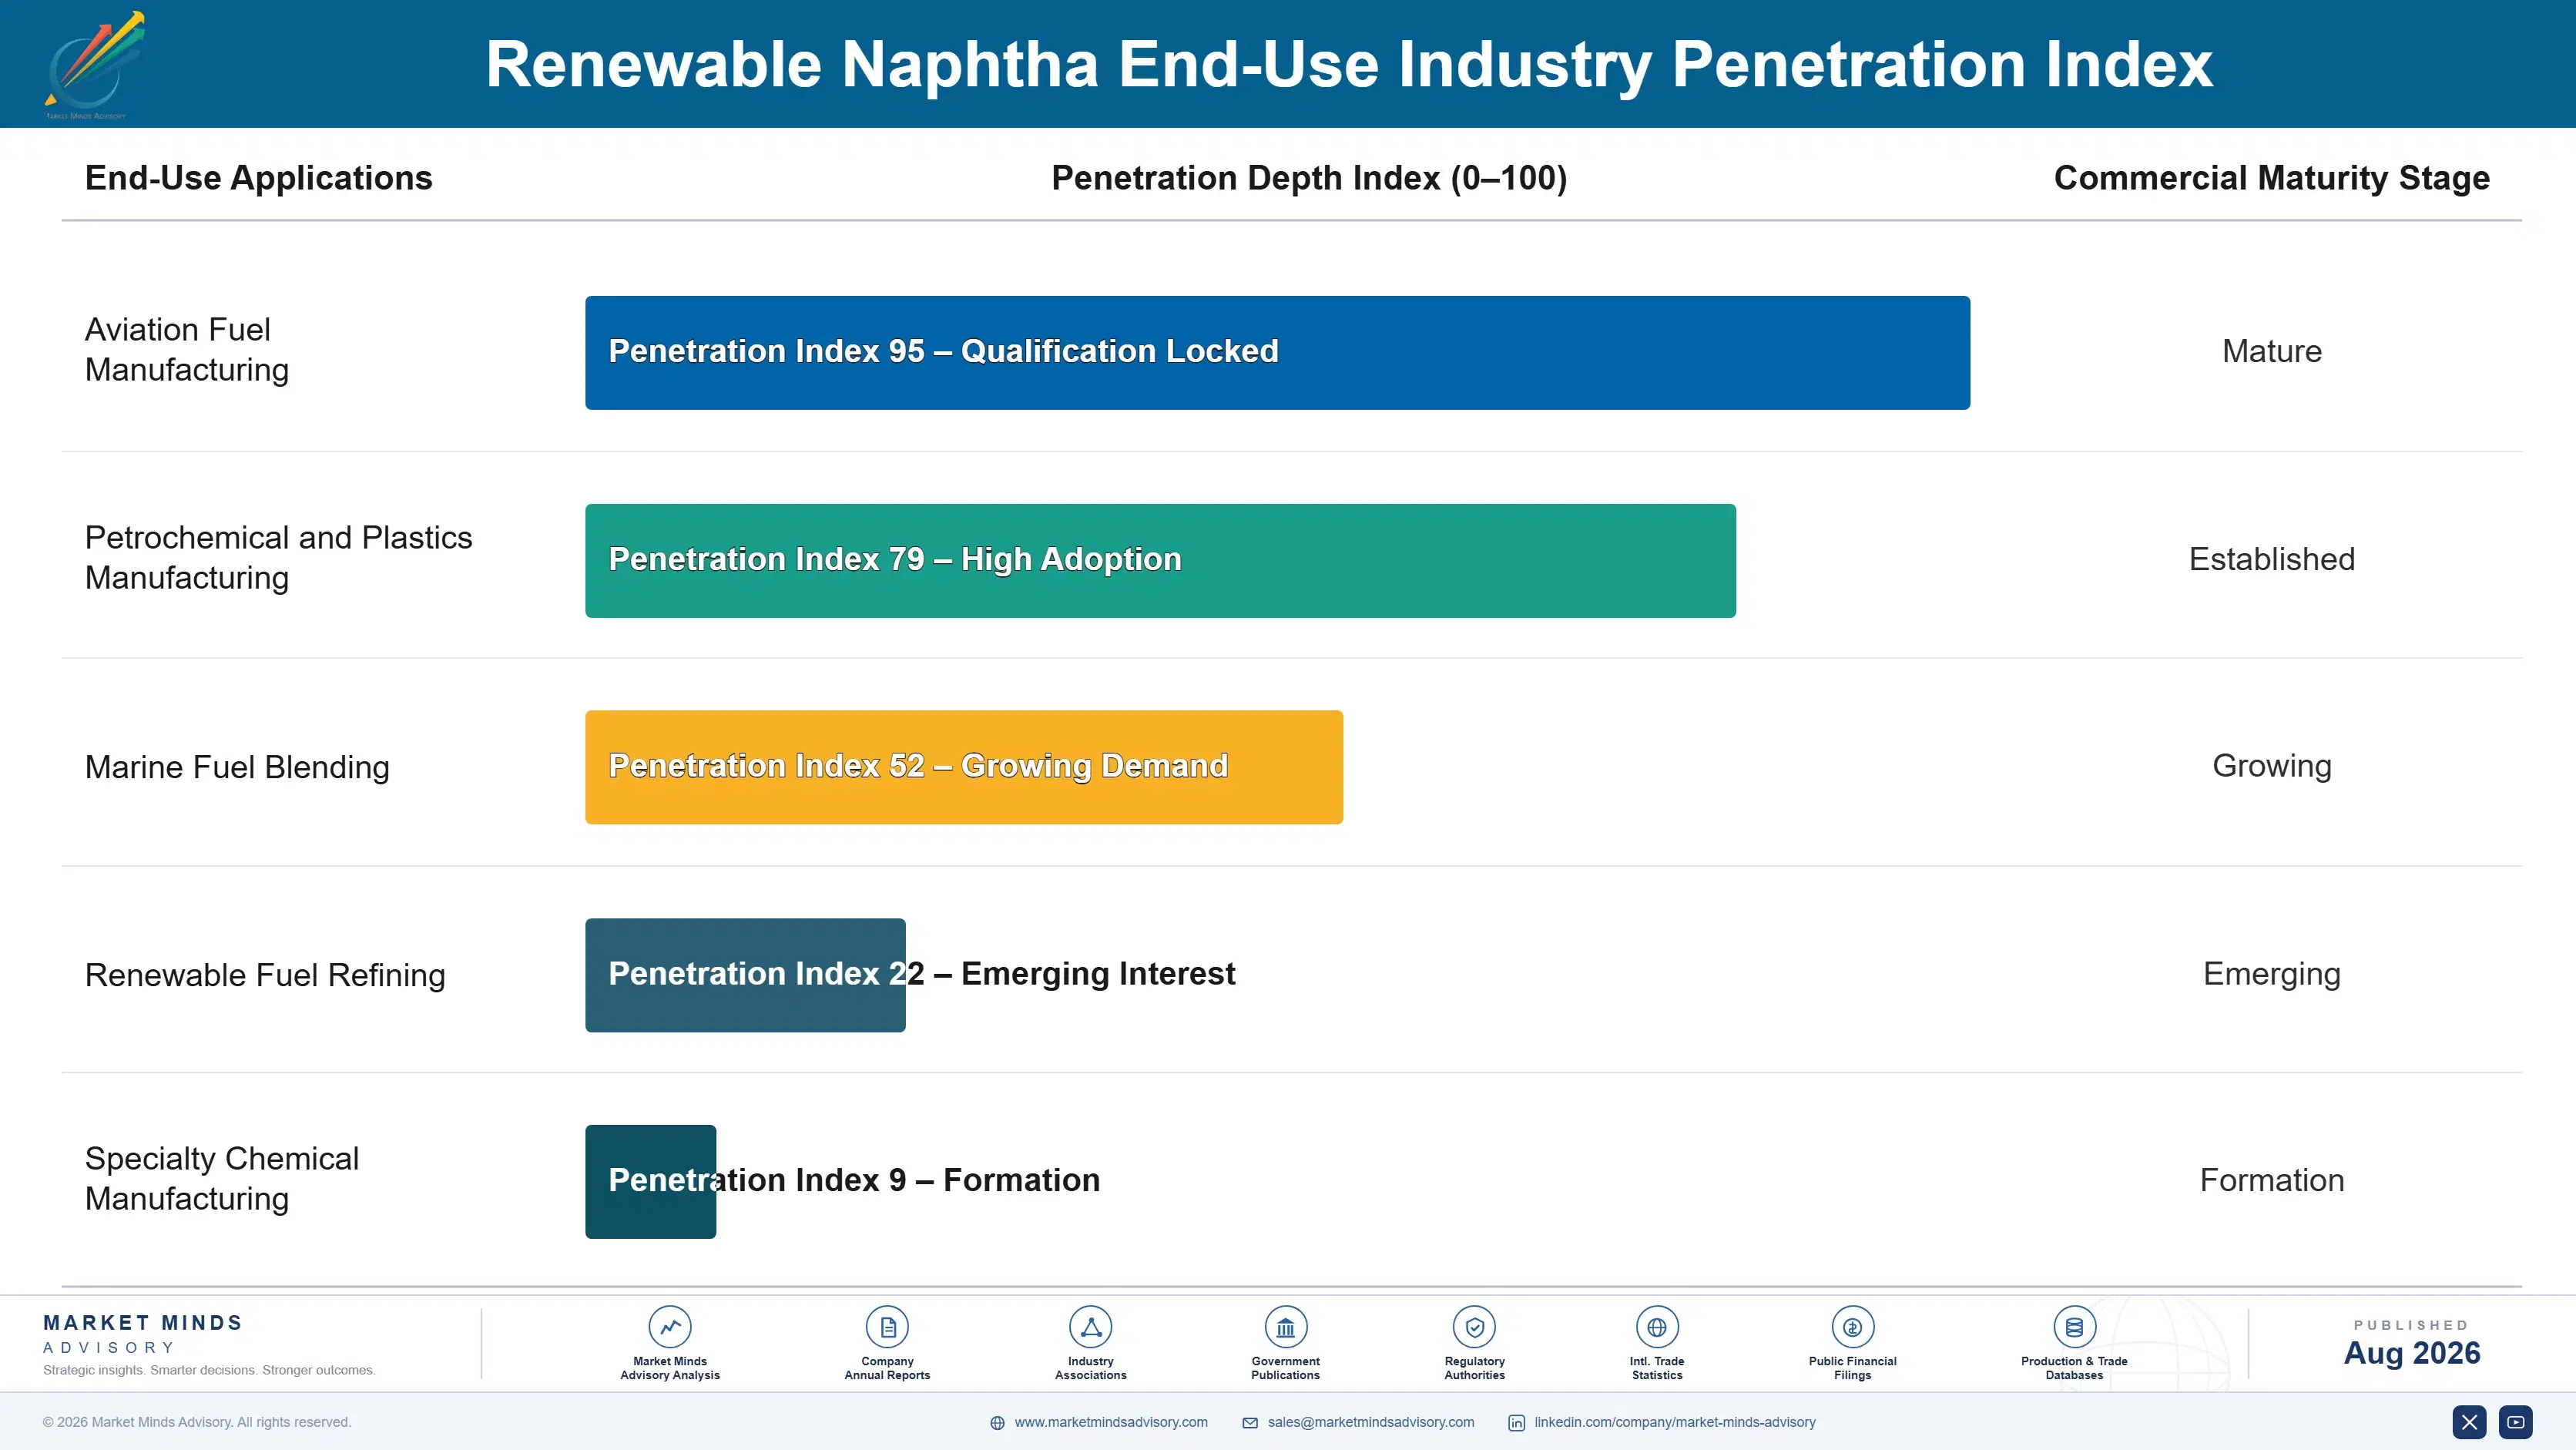
Adoption depth varies meaningfully by end-use vertical. Aviation fuel blending remains the deepest and most certification-intensive vertical, petrochemical manufacturing has grown steadily as a stable base demand channel, and marine fuel blending represents the shallowest but fastest-growing vertical as shipping decarbonization scales globally. This layered pattern shapes distribution priorities. This layered pattern shapes distribution priorities.

Generational buyer shifts are reshaping category expectations meaningfully. Younger sustainability procurement managers increasingly treat carbon intensity documentation and traceability as baseline requirements rather than optional upgrades, favoring producers who offer validated compliance data over legacy suppliers their predecessors were comfortable purchasing from without such scrutiny. Producers who fail to adapt risk losing relevance with the next generation of sustainability buyers.
renewable-naphtha-market-trends-end-use-penetration-index-1787594203928

Where Producers Should Focus Now

These are among the four positions where our research anticipates prominent divergence between winners and laggards over the coming forecast period. Each is grounded in the demand model, the regulatory perimeter, and the announced capacity pipeline.
01 / SAF INVESTMENT PRIORITY

Build SAF certification capability before competitors close the gap

Airlines increasingly require validated carbon intensity traceability that only producers with dedicated certification expertise can credibly demonstrate ahead of expanding aviation decarbonization demand. Producers without this capability risk losing meaningful contract share as competitors finalize SAF-grade product lines over the coming several years across every major aviation market and adjacent petrochemical segment. This window will not stay open indefinitely, particularly as ambitious regional rivals accelerate their own certification investment programs this year, narrowing the gap considerably across every major market.
02 / FEEDSTOCK SOURCING RESILIENCE

Diversify used cooking oil sourcing across multiple regions

Used cooking oil and animal fat price volatility tied to concentrated collection networks remains the category's most persistent and recurring margin risk across nearly every producer type. Producers who diversify sourcing across multiple regions and countries meaningfully reduce their exposure to any single supply disruption or competing biofuel demand affecting availability. Building this resilience takes years of supplier relationship development, but it increasingly separates durable margin performers from producers exposed to sharp quarterly cost swings across successive supply cycles and disruptions.
03 / GEOGRAPHIC EXPANSION FOCUS

Prioritize South Asia and Pacific ahead of slower-growing regions

South Asia and Pacific is growing faster than every other region tracked in this report, on the strength of India's emerging biofuel policy investment and rising aviation decarbonization mandates across the broader region. Producers sequencing capacity expansion should weight this region ahead of slower-growing Eastern Europe or Latin America markets, where naphtha demand growth remains comparatively muted for now and unlikely to accelerate soon. Early positioning here compounds this advantage meaningfully over the coming years across the broader category, well before slower-moving competitors can respond.
04 / STEAM CRACKER TIMING URGENCY

Accelerate steam cracker qualification ahead of specialty pressure

Specialty producers have led steam cracker feedstock qualification considerably faster than legacy incumbents, forcing established players to respond quickly or risk losing contracts during chemical manufacturer decarbonization cycles nationwide. Producers who delay qualification investment risk ceding premium contract share entirely to smaller, more agile competitors already several steps ahead on certification science and manufacturer trust. This urgency will only intensify as manufacturers continue reallocating supplier relationships toward bio-based formats, rewarding early movers disproportionately over the coming several years across most markets.

Engagement Snapshot From the Field

A live engagement with an industry participant carrying material or product regulatory and market exposure ahead of a defining policy shift, showing how our research translates into a defensible multi-year portfolio strategy.
MARKET MINDS ADVISORY · CLIENT ENGAGEMENT SUMMARY
Renewable Naphtha Producer Strategic Portfolio Review and Transition Roadmap 2026·Investment Scenario on Renewable Naphtha Exposure Evaluation 2025-26
CLIENT PROFILE
The client is a mid-tier North American biorefinery operator with an established renewable diesel co-product production base but limited presence in the faster-growing SAF and steam cracker segments. Annual revenue was approximately 310 million dollars at the time of engagement (client-reported, unverified by MMA), concentrated heavily in standard diesel co-product naphtha production. The client had begun evaluating SAF capability but lacked confidence in projected payback timelines.
STRATEGIC CHALLENGE
The client faced declining margins on standard co-product naphtha amid intensifying regional competition, while lacking the technical expertise to evaluate SAF certification opportunities and negotiate favorable airline offtake partnerships. Leadership needed independent, data-driven clarity before committing capital to any single formulation upgrade pathway this planning cycle. Leadership needed independent, data-driven clarity before committing capital.
MMA APPROACH
MMA conducted primary interviews with airline fuel procurement managers and feedstock aggregators, benchmarked the client's production capability against leading SAF competitors, and modeled realistic margin uplift scenarios across three formulation investment pathways. The engagement combined quantitative survey data with qualitative expert interviews to triangulate a defensible recommendation for leadership. Leadership required a defensible view.
KEY FINDINGS
  1. SAF certification conversion offered a projected margin improvement of roughly 22 percentage points compared to the client's existing co-product portfolio (client-reported, unverified by MMA) for validated formulations meeting current standards.
  2. Airline fuel procurement managers indicated willingness to pay a validated carbon intensity premium of up to 29 percent for consistent SAF-grade formulations.
  3. SAF offtake partnerships required a minimum twenty-month certification validation timeline before airlines would commit to expanded supply agreements. before airlines committed to expanded distribution
  4. Competing producers who delayed SAF investment lost an estimated 11 percent of premium contract share during the most recent certification reset cycle.
CLIENT PROFILE
The client is a mid-tier North American biorefinery operator with an established renewable diesel co-product production base but limited presence in the faster-growing SAF and steam cracker segments. Annual revenue was approximately 310 million dollars at the time of engagement (client-reported, unverified by MMA), concentrated heavily in standard diesel co-product naphtha production. The client had begun evaluating SAF capability but lacked confidence in projected payback timelines.
STRATEGIC CHALLENGE
The client faced declining margins on standard co-product naphtha amid intensifying regional competition, while lacking the technical expertise to evaluate SAF certification opportunities and negotiate favorable airline offtake partnerships. Leadership needed independent, data-driven clarity before committing capital to any single formulation upgrade pathway this planning cycle. Leadership needed independent, data-driven clarity before committing capital.
MMA APPROACH
MMA conducted primary interviews with airline fuel procurement managers and feedstock aggregators, benchmarked the client's production capability against leading SAF competitors, and modeled realistic margin uplift scenarios across three formulation investment pathways. The engagement combined quantitative survey data with qualitative expert interviews to triangulate a defensible recommendation for leadership. Leadership required a defensible view.
KEY FINDINGS
  1. SAF certification conversion offered a projected margin improvement of roughly 22 percentage points compared to the client's existing co-product portfolio (client-reported, unverified by MMA) for validated formulations meeting current standards.
  2. Airline fuel procurement managers indicated willingness to pay a validated carbon intensity premium of up to 29 percent for consistent SAF-grade formulations.
  3. SAF offtake partnerships required a minimum twenty-month certification validation timeline before airlines would commit to expanded supply agreements. before airlines committed to expanded distribution
  4. Competing producers who delayed SAF investment lost an estimated 11 percent of premium contract share during the most recent certification reset cycle.
RECOMMENDED STRATEGY
Phase 1: Phase 1 (0-6 months): Commission a detailed SAF capability assessment and secure internal leadership buy-in across production functions and production functions Phase 2: Phase 2 (6-18 months): Select an airline offtake partner and begin phased SAF certification development and validation testing with clear performance milestones Phase 3: Phase 3 (18-36 months): Complete airline qualification for initial formulations and evaluate expansion into additional categories and additional category expansion
OUTCOME
Eighteen months after implementation, the client reported securing one new airline offtake partnership and expanding SAF-related revenue by approximately 24 percent (client-reported, unverified by MMA). Leadership credited the phased validation approach with reducing certification risk during the transition. Leadership credited the phased validation approach with reducing risk during the transition.

Frequently Asked Questions

Foundational context covering the market sizes, CAGR, scope, country, region and competition that inform every finding below. This section is provided to cover basics and most often pre-purchase conversations, answered from the MMA Primary Research Dataset.

What is the current size of the Renewable Naphtha Market?

The global renewable naphtha market reached approximately 1.4 billion dollars in 2025, with the United States as the single largest producing country. Growth is concentrated in SAF and steam cracker feedstock formulations.

How large will the Renewable Naphtha Market be by 2036?

The market is projected to reach approximately 4.64 billion dollars by 2036, roughly 2.97 times its 2026 value. This reflects sustained aviation decarbonization and petrochemical demand.

What is the CAGR for the Renewable Naphtha Market 2026 to 2036?

The market is projected to grow at a compound annual rate of 11.5 percent through 2036, among the fastest of adjacent renewable fuel categories. Bull and bear scenarios range from 10.2 to 12.8 percent.

Which segment is growing fastest?

Sustainable aviation fuel blending feedstock is growing fastest, at roughly 17.5 percent annually, well ahead of standard co-product formats. This outpaces the overall market's 11.5 percent rate by a meaningful margin.

Who are the major companies in the Renewable Naphtha Market?

Leading companies include Neste, Diamond Green Diesel, Marathon Petroleum, Chevron, and Phillips 66, together holding roughly 62 percent of renewable feedstock production capacity. A long tail of regional producers competes on price.

Which country is growing fastest?

India is growing fastest among countries tracked, at approximately 14.5 percent annually, outpacing every other market covered. Emerging biofuel policy investment and rising aviation decarbonization mandates drive this acceleration.

Report Segmentation Architecture

The full report scope spans multiple orthogonal segmentation dimensions, with cross-tabulated demand data provided for each dimension pair. Coverage extends further to regional breakdowns, trend trajectories, and the competitive detail needed to support segment-level decision-making.

By End-Use Application

  • Bio-Based Plastics and Petrochemical Feedstock
  • Sustainable Aviation Fuel Blending Feedstock
  • Renewable Diesel Co-Product Applications
  • Bio-Naphtha for Steam Cracker Feedstock
  • Marine Fuel Blending Applications
  • Specialty Solvent and Industrial Applications

By End-Use Industry

  • Aviation Fuel Manufacturing
  • Petrochemical and Plastics Manufacturing
  • Marine Fuel Blending
  • Renewable Fuel Refining
  • Specialty Chemical Manufacturing

By Commercial Dimension

  • Direct Offtake Supply
  • Specialty Distribution
  • Contract Refining Supply
  • Export Wholesale

By Region

  • North America
  • Western Europe
  • East Asia
  • South Asia and Pacific
  • Latin America
  • Middle East and Africa
  • Eastern Europe

Scope, Methodology, and Coverage

Every figure in this report is reproducible from documented input assumptions. The scope below maps the historical period, the forecast horizon, the segmentation dimensions, and the countries covered, alongside the underlying primary and qualitative methodology.
Historical Period
2020 to 2025
Forecast Period
2026 to 2036
Base Year
2025 (USD billions; MMA Primary Research Dataset, August 2026)
Market Definition
The renewable naphtha market covers commercial production of bio-based naphtha generated as a co-product of hydroprocessed esters and fatty acids renewable diesel and sustainable aviation fuel production. It excludes conventional petroleum-derived naphtha and finished renewable fuel products where naphtha is not separately marketed as a distinct co-product stream.
Quantitative Units
USD billions (current prices); metric tons for volume-referenced commentary
Segmentation Dimensions
By End-Use Application; By End-Use Industry; By Commercial Dimension; By Region
Regions Covered
North America, Western Europe, East Asia, South Asia and Pacific, Latin America, Middle East and Africa, Eastern Europe
Countries Covered
USA, China, Germany, France, UK, Japan, South Korea, India, Australia, Canada, Brazil, Mexico, Indonesia, Vietnam, Thailand, Malaysia, UAE, Saudi Arabia, South Africa, Nigeria, Turkey, Poland, Netherlands, Italy, Spain, Sweden, Switzerland, Argentina, Colombia, Singapore, and additional markets relevant to this sector
Key Companies Profiled
Neste Corporation, Diamond Green Diesel, Marathon Petroleum Corporation, Chevron Corporation, Phillips 66, Valero Energy Corporation, Darling Ingredients Inc, World Energy LLC, TotalEnergies SE, Eni SpA, Repsol SA, Gevo Inc, Fulcrum BioEnergy Inc, LanzaJet Inc, Preem AB, Green Plains Inc, Cepsa, Shell plc, BP plc, Renewable Energy Group Inc
Quantitative Methodology
Primary survey, n=3,800 respondents, Q4 2025, six countries; demand-side model with trade association cross-validation
Qualitative Methodology
47 expert interviews, Q4 2025; applied to validate demand model assumptions, identify emerging dynamics, and assess competitive positioning
Report Format
PDF and XLSX data workbook (Word format preview document)
Publisher
Market Minds Advisory
Report Code
MMA-2026-ENE-101
Published
August 2026
Contact
sales@marketmindsadvisory.com | www.marketmindsadvisory.com

Purchase the full Renewable Naphtha Market Report (2026 to 2036).

This report delivers a complete assessment of the global renewable naphtha market through 2036, covering demand drivers, competitive dynamics, and segmentation across six end-use application categories. It includes detailed regional analysis across all seven world regions, profiles of twenty leading producers, and quantified revenue lever analysis for margin improvement. The report draws on primary survey data from 3,800 respondents and 47 expert interviews conducted in the fourth quarter of 2025. Readers gain a defensible, data-driven view of where category investment should concentrate over the next decade.
Seven-region demand and CAGR breakdown analysis
Twenty-company competitive profile matrix with moat details
Quantified revenue lever impact modeling and ROI ranges
Primary survey data across six countries
Forty-seven expert interview synthesis summary insights
Anonymized client case study application and outcome

Built For The People Who Decide

From boardroom strategy to bench-side execution, this report is read cover-to-cover by leaders shaping the next decade of their industry, turning demand scenarios, market dynamics and valuation benchmarks into decisions.
CXOs/ Presidents/ VPs/ Managers
M&A and Corporate Development
Strategy Teams and R&D Heads
Procurement and Product Directors
Regulatory and Compliance Leaders
Investor Relations and Equity Analysts