Market Minds Advisory
Renewable Energy Insurance Market

Renewable Energy Insurance Market: Cables, Hail And Untested Turbines

Around 77% of offshore wind loss value comes from cables worth roughly a tenth of project cost. Onshore, it is hail rather than wind that quietly destroys entire solar farms.

Lead Analyst

Published

September 2026

Make Smarter Decisions with Customized Research Insights

Request a free sample report and evaluate market opportunities, growth trends, and competitive dynamics relevant to your business needs.

2025 MARKET VALUE$8.2BMarket Size 2025
2036 FORECAST VALUE$23.9BBase Case , 2026 to 2036
CAGR 2026 TO 203610.2 %Bull 11.4% / Bear 9.0%
INCREMENTAL OPPORTUNITY$14.8BNet 10- year value creation
EXPANSION MULTIPLE2.64x2036 value over 2026 base
Strategic Levers
M&A Pipeline
Regional Outlook
Country Rankings
Competitive Intelligence
Segmental Deep-dive
Call-Us : 91 93563 13602

Executive Snapshot and Market Trajectory

The loss drivers are not the ones anybody expects. Cables carry around 77% of offshore wind claim value while representing roughly a tenth of capital cost, and onshore it is hail rather than wind that destroys solar. Nobody actually surveys the cable that closely.
East Asia writes 29% of premium on installed capacity that exceeds anywhere else, though placement value per megawatt runs below Western equivalents. Battery storage and hybrid asset cover grows at 15.3%, half again the market rate of 10.2%, as grid-scale installations multiply and underwriters work out what thermal runaway actually costs them across a site. Everybody writing in that class knows perfectly well that the reserves standing behind it are simply estimates still.
Concentration reaches only 33% across specialist underwriters, composite carriers and reinsurers writing different layers of the same risk. Turbine platforms have scaled faster than operating data accumulates, so prototypical exclusions and loss limits apply until roughly three service years exist on any given model. Meanwhile early-life failure sits partly with manufacturer warranties, which leaves insurers quietly exposed to covenant strength they never underwrote and mostly never once checked either.
Market Definition
The market covers gross written premium across renewable energy insurance classes, spanning operational property and machinery breakdown, construction and erection all risks, battery storage and hybrid asset cover, offshore wind marine and cable cover, business interruption and delay in start-up, and liability and third-party cover. Conventional thermal and nuclear power insurance, transmission and distribution network cover unconnected to generation assets, manufacturer product warranty obligations, power price hedging and revenue insurance, and project finance credit insurance are excluded.
Base Year Value
$8.2B in 2025 (MMA Primary Research Dataset, August 2026)
Forecast Period
2026 to 2036, eleven discrete annual values
CAGR
10.2% base case. Bull 11.4%. Bear 9.0%.
Fastest Growth Segment
Battery Storage and Hybrid Asset Cover: 15.3% CAGR
Fastest Growth Country
India: 12.2% CAGR
Fastest Growth Region
South Asia and Pacific: 12.4% CAGR
Largest Region
East Asia: 29% of 2025 global value
Market Leaders
Munich Re, GCube, AXA XL, Chubb, Zurich Insurance Group. Source: MMA Analysis based on disclosed renewable energy and power gross written premium, company annual reports 2025.
Primary Survey
n=3,800 procurement and R&D decision-makers, Q4 2025, six countries
Methodology
Demand-side build-up, cross-validated against public data, 47 expert interviews

Renewable Energy Insurance Market Forecast Scenarios

renewable-energy-insurance-market-size-forecast-scenario-1787913448850
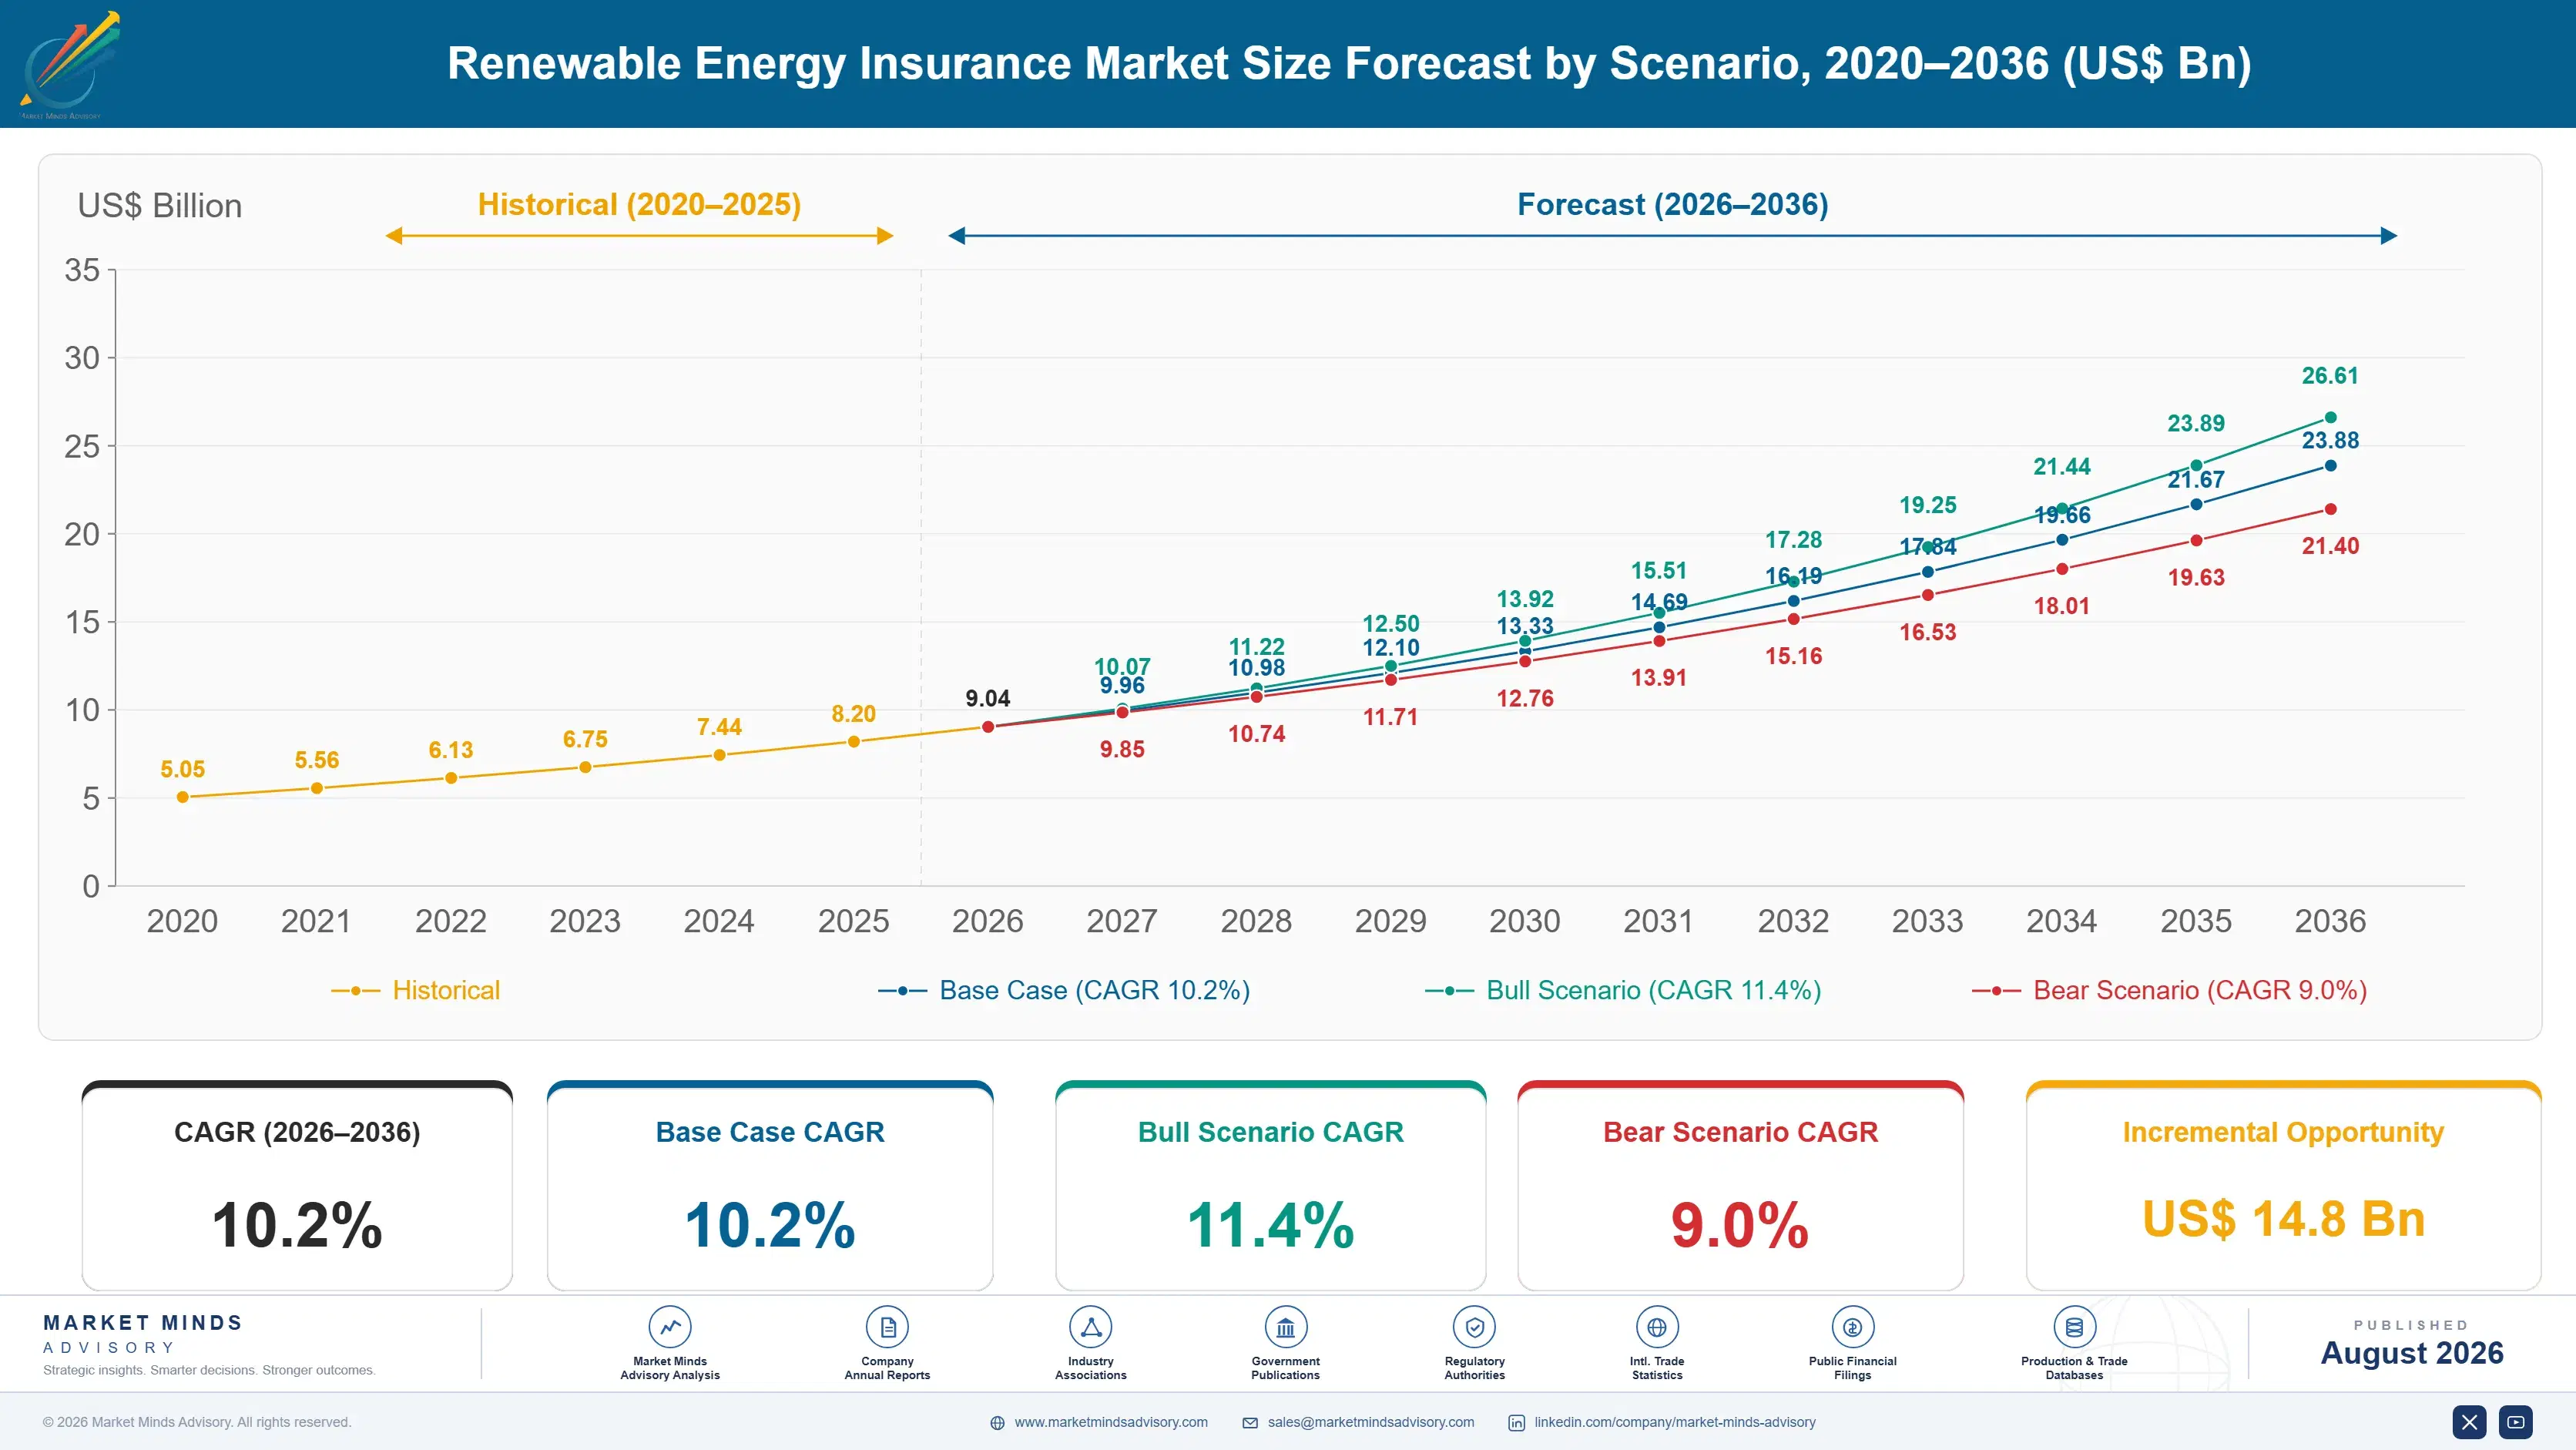
Growth from 2020 to 2025 ran at 9.0% and the loss experience reshaped it as much as capacity growth did. Texas hailstorms produced solar losses in the hundreds of millions from single events and changed how the whole class is rated. Offshore cable failures accumulated steadily. Battery storage fires at grid-scale sites arrived without any actuarial history behind them, and underwriters priced by judgement because nothing else existed.
The 10.2% base case rests on three mechanisms. Battery storage capacity keeps multiplying while underwriters remain genuinely uncertain what a site-wide thermal event costs. Offshore wind construction keeps expanding into deeper water with longer export cable runs. And Indian and Southeast Asian capacity additions keep rising, bringing assets that require cover into markets where local underwriting capability is still developing. None of the three depends on rate hardening simply continuing.
The bull case at 11.4% assumes continued hardening after further hail and storage losses alongside offshore construction values rising with turbine size. The bear case at 9.0% is capacity returning to solar property lines faster than loss experience justifies, which this class has done repeatedly, combined with battery losses proving less severe than the reserves currently held against them.

The Cheap Component Costs Most

Offshore wind loses money through cables and nothing else comes close. Inter-array and export cables represent roughly a tenth of capital cost and account for around 77% of claim value, through installation damage, insufficient burial and failures where a cable enters the foundation. Everything else about an offshore project is engineered and inspected exhaustively. The cable gets laid on a weather window.
FIVE-FIRM CONCENTRATION33%Share of global premium written by the largest renewable underwriters
CABLE CLAIM SHARE77%Portion of offshore wind loss value from one component
HAIL LOSS SHARE54%Solar claim value driven by a single weather peril
PROTOTYPICAL OPERATING YEARS3Service history required before standard policy terms apply
TRACKER STOW REDUCTION68%Hail damage avoided when panels rotate to steep angles
DELAY LOSS MULTIPLIER3.2Financial loss measured against direct property damage alone
Solar is destroyed by hail, which surprises people who assume wind is the problem. Panels lie almost flat across hundreds of acres and hail strikes them squarely, and single Texas events have produced losses in the hundreds of millions. Hail now drives roughly 54% of solar claim value. Trackers that rotate to a steep stow angle when hail is forecast cut damage by around 68%, which is the single most effective control available.
Turbines outgrew their own operating history. Platforms scaled from three megawatts to well beyond fifteen inside a decade, and each new model arrives with no service record at all. Underwriters respond with prototypical technology exclusions and loss limits until roughly three operating years accumulate. Meanwhile early-life risk sits partly with manufacturer warranties, so insurers are quietly exposed to backing they never underwrote.
"Everyone underwrites the turbine because the turbine is expensive. The money leaves through a cable that somebody buried in a hurry on the last decent weather day of October, and nobody surveys that with anything like the same attention."
Director, Energy Risk Practice · MMA Energy Risk and Specialty Insurance Practice · August 2026

Market Trends

Battery Storage Underwriting Runs Ahead Of Any Data

Grid-scale storage capacity is multiplying while underwriters hold almost no credible loss history, and thermal runaway propagating across a site produces a total loss shape that conventional property experience does not describe at all. That segment grows at 15.3%. Terms now specify cell chemistry, enclosure spacing and detection standards, which is engineering underwriting rather than actuarial pricing, and everybody involved knows the reserves are estimates. Nobody has a rate table for this, and the carriers writing it are pricing an exposure they can describe considerably better than they can measure it.
Market Impact: Multiplies losses by 3.2 times
Hail Stow Protocols Become A Rating Variable

Trackers rotating to a steep stow angle when hail is forecast reduce panel damage by around 68%, which is a larger effect than any other control available on a solar site and considerably cheaper than most of them. Underwriters now rate on whether stow protocols exist, whether forecasting triggers them automatically and whether operators actually follow them. Hail drives roughly 54% of solar claim value, so the difference is worth genuine money. Whether an operator actually follows the protocol turns out to matter more than where the site itself sits.
Market Impact: Grows Indian premium at 12.2%

Market Opportunities and Growth Drivers

Offshore Construction Values Rise With Every Turbine Generation

Projects moving into deeper water with larger turbines and longer export cable runs raise both the sums insured and the concentration of value on single installation weather windows. That segment grows at 11.4%. Marine transit, heavy lift and cable laying all carry exposure that operational cover never sees, and delay in start-up multiplies a physical loss by roughly 3.2 times once financing and power purchase obligations are counted properly. A weather window that closes early costs considerably more than the repair it delayed ever did on its own account alone.
Market Impact: Leaves 30% of limits unplaced

Asian Capacity Additions Outpace Local Underwriting Capability

India and Southeast Asian markets are adding solar, wind and storage capacity quickly while domestic underwriting expertise in these classes is still developing, which leaves complex placements travelling to international markets or being written locally at terms nobody has properly tested. India grows fastest at 12.2%. Engineering survey capability rather than capital is the binding constraint, and it takes considerably longer to build than balance sheet does. Capital arrives in these markets long before the engineering judgement required to deploy it sensibly does, which is a recurring pattern in every developing insurance market.
Market Impact: Assumes 3 years of warranty

Market Restraints and Challenges

Nat Cat Capacity Rather Than Price Binds In Hail Belts

Some hail-exposed solar projects cannot buy full limits at any price, because reinsurance retentions moved sharply upward and carriers reduced aggregate exposure to the peril after successive events. Root cause is loss experience that repriced the whole retrocession chain. Commercial impact is that projects proceed underinsured or with sublimits lenders dislike. Mitigation runs through stow protocols, panel selection and parametric structures, none of which fully replaces the missing capacity. Lenders dislike sublimits, and developers dislike paying for capacity that nobody will actually agree to sell them at any price at all.
Market Impact: Grows storage cover at 15.3%

Insurers Carry Warranty Risk They Never Underwrote

Early-life equipment failure sits partly with manufacturer warranties, and underwriters price operational cover assuming that backing holds, which becomes an assumption rather than a fact when a manufacturer runs into financial difficulty. Root cause is risk allocation nobody documents across the whole chain. Commercial impact is exposure appearing where none was priced. Mitigation involves warranty verification at binding and terms that respond differently where manufacturer covenant strength is genuinely uncertain. Almost nobody checks the covenant at binding and everybody discovers its actual strength during a claim instead, much later on.
Market Impact: Reduces hail damage by 68%
3 additional market trends, 4 additional growth drivers, and 2 additional restraints and challenges are covered in the full report. Contact sales@marketmindsadvisory.com to access the complete intelligence.

Segment CAGR and Growth Architecture

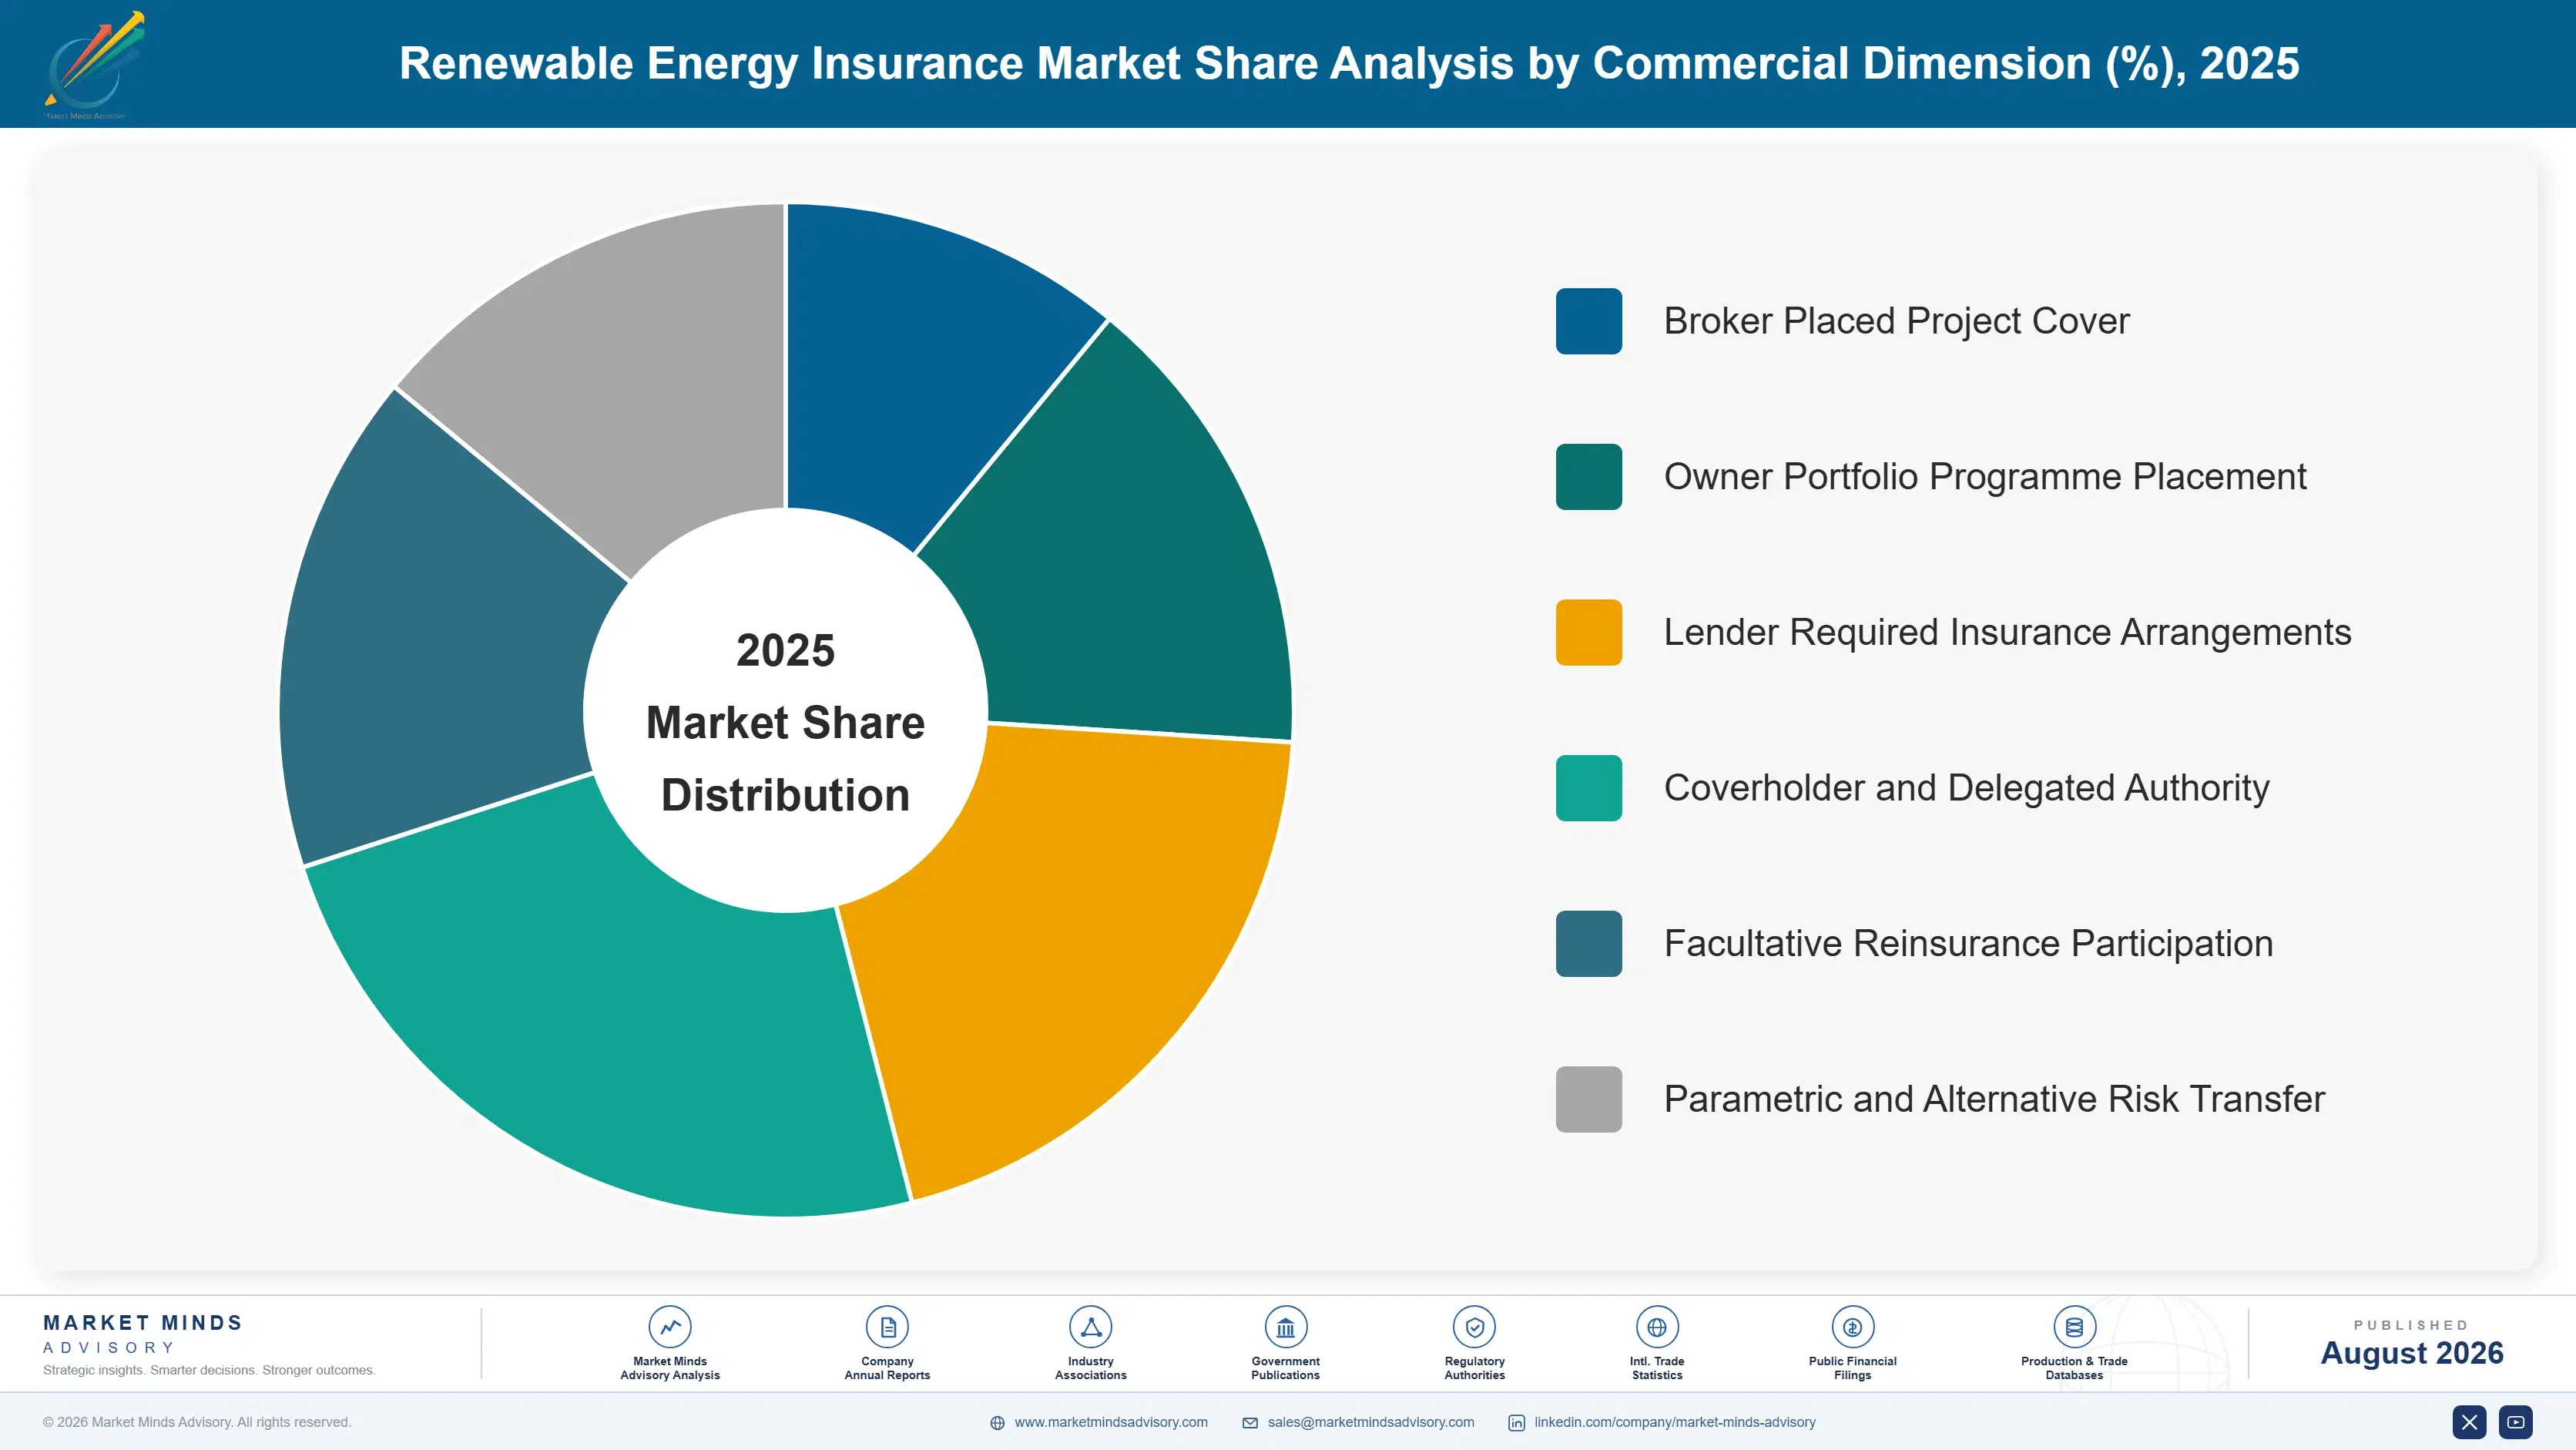
Segmentation follows class of cover, since peril exposure, loss profile and underwriting discipline all differ by class rather than by technology or project stage. Six categories cover the market without overlap. Generation technology, project phase and placement route are treated as separate commercial dimensions throughout this report rather than as segmentation logic in their own right here.
renewable-energy-insurance-market-market-share-analysis-1787913449382

Battery Storage and Hybrid Asset Cover

Storage cover grows at 15.3%, half again the market rate of 10.2%, as grid-scale capacity multiplies while underwriters hold almost no credible loss history and thermal runaway propagating across a site produces a total loss shape conventional property experience never describes. Terms specify cell chemistry, enclosure spacing and detection standards rather than pricing from tables. That is engineering underwriting rather than actuarial work, and everybody writing it understands perfectly well that the reserves behind it are estimates. Capacity is limited to carriers willing to accept an exposure they can describe far better than they can measure, which is precisely why the pricing available is currently as attractive as it is.
CAGR 15.3%

Offshore Wind Marine and Cable Cover

Offshore marine and cable cover grows at 13.2% as projects move into deeper water with longer export cable runs and larger turbines concentrating more value onto single installation weather windows. Cables account for around 77% of offshore claim value while representing roughly a tenth of capital cost, through installation damage, insufficient burial and failures where a cable enters the foundation. Everything else offshore is inspected exhaustively, and the cable is laid whenever the weather briefly permits it. Delay in start-up multiplies a physical loss by roughly 3.2 times once financing and power purchase obligations are properly counted, which turns a repair vessel mobilisation into something considerably more serious than it looks.
CAGR 13.2%
Full segment breakdown across 6 segments available in the complete report.

Regional Architecture and Country Demand Map

Premium follows installed asset value and the perils attached to it rather than generation capacity alone, since a megawatt in a hail belt carries an entirely different risk profile from one that does not. Perils rather than megawatts decide where the premium actually accumulates here.

North America

Hail is the defining peril and it has reshaped solar underwriting across the continent, with single Texas events producing losses in the hundreds of millions and carriers reducing aggregate exposure afterwards. Stow protocols, panel glass thickness and tracker specification now sit in every rating conversation. Grid-scale battery capacity is expanding faster than anywhere outside Asia and underwriters price it largely by engineering judgement. Offshore wind remains modest, with a small number of projects carrying disproportionate placement attention. Delay in start-up cover attracts considerably more attention here than in most markets, since power purchase obligations and tax equity structures both impose financial consequences on late energisation that go well beyond the physical repair itself.
Share: 24% | CAGR: 9.0% (2026 to 2036)

Western Europe

Offshore wind concentrates here more than anywhere else and cable failures accordingly drive the regional loss picture, accounting for the substantial majority of claim value across projects that are otherwise engineered and inspected to exceptional standards. Nordic and North Sea installation windows govern construction exposure directly. Onshore hail risk is materially lower than North American equivalents. Underwriting expertise in offshore marine and cable cover is deeper here than in any other market by a considerable distance. Battery storage capacity is expanding quickly across the region and underwriters here have been among the first to write enclosure spacing and detection standards into policy conditions rather than leaving them as survey recommendations operators may ignore.
Share: 26% | CAGR: 8.6% (2026 to 2036)
Regional intelligence for 5 additional markets available in the complete report: East Asia, South Asia and Pacific, Latin America, Middle East and Africa, Eastern Europe. Contact sales@marketmindsadvisory.com.
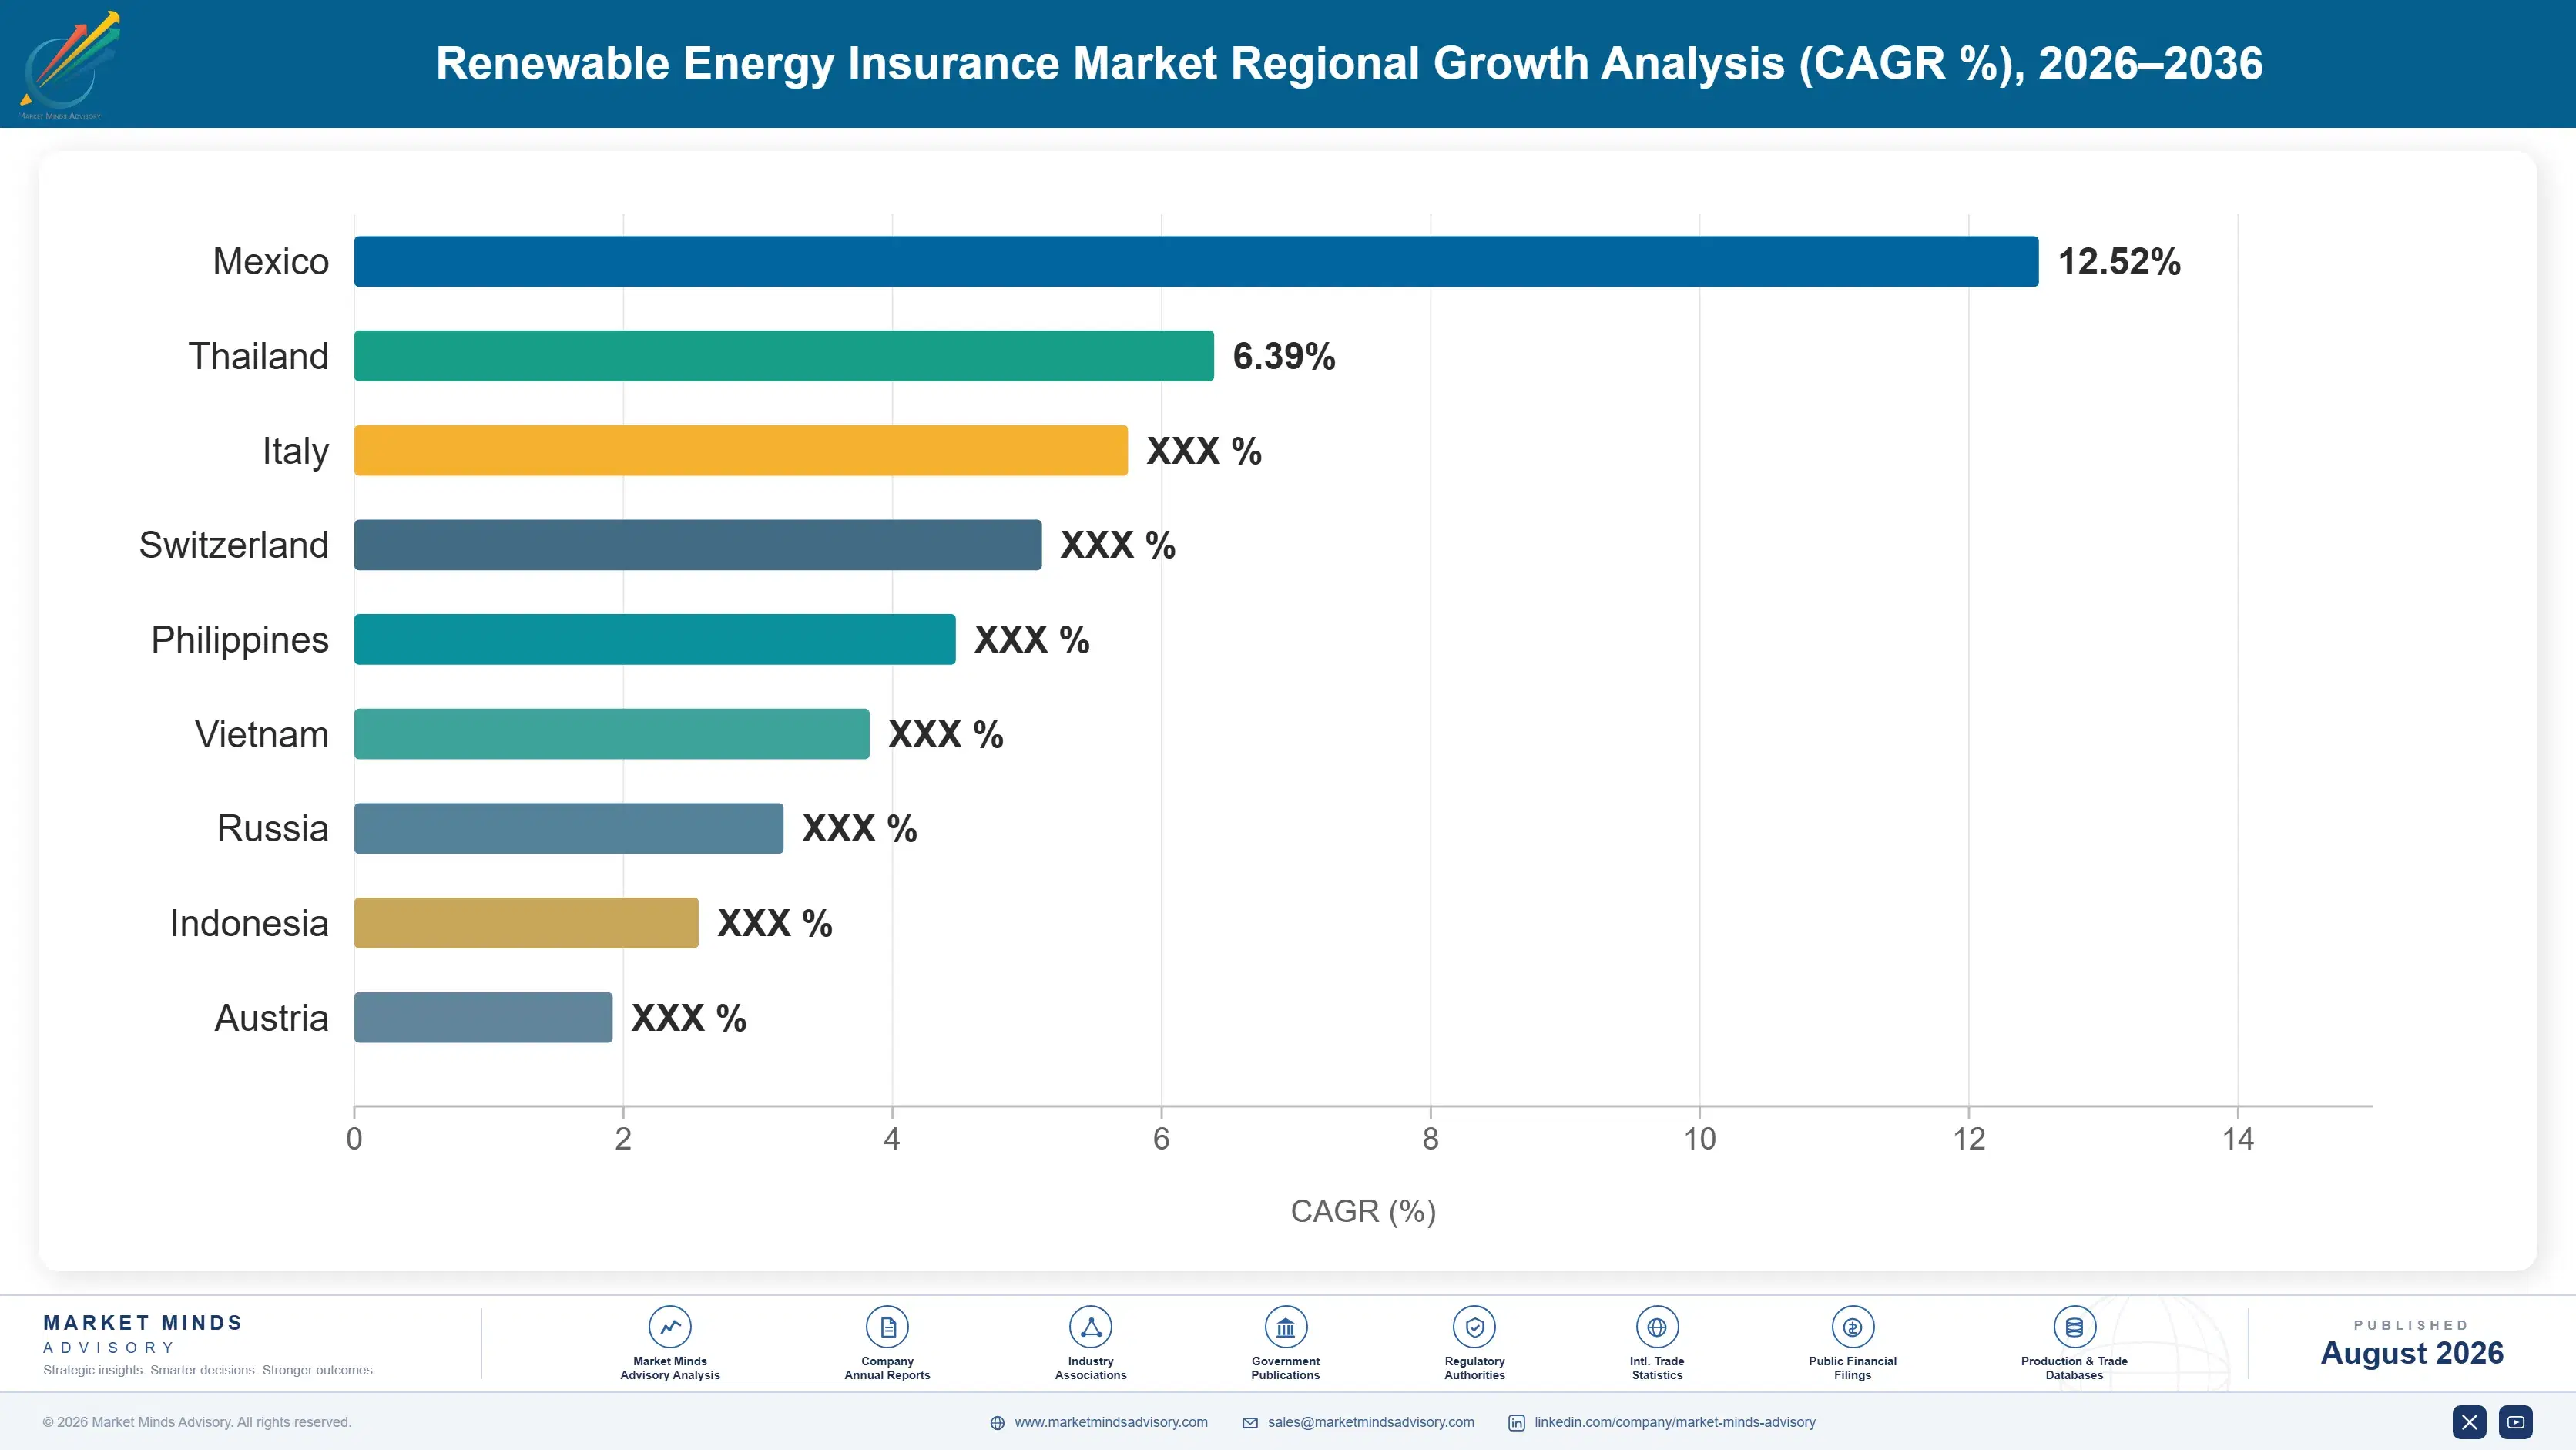
renewable-energy-insurance-market-country-cagr-analysis-1787913449914

Underwrite The Cable And Stow

Cables drive 77% of offshore claim value, hail drives 54% of solar losses, stow protocols cut damage 68% and delay multiplies physical loss 3.2 times. Four levers work on component-level survey, control-based rating, storage engineering and warranty verification rather than on general rate adequacy, which every carrier in this class already claims to have.

Survey The Cable, Not Just The Turbine

Cables represent roughly a tenth of offshore capital cost and around 77% of claim value, yet survey attention and engineering scrutiny concentrate overwhelmingly on the turbines and foundations that rarely fail. Underwriters who review burial specification, installation contractor record, hang-off design and weather window discipline are assessing where the money actually leaves. Those reviewing turbine specification alone are examining the part of the project that already works reliably. Nothing about a turbine specification tells an underwriter whether the cable was buried properly on a closing October weather window somewhere either.
Market Impact: Addresses all 77% of the offshore claim value

Rate Solar On Stow Protocol Rather Than Location

Trackers stowing to steep angles on hail forecast cut damage by around 68%, a larger effect than any other control on a solar site, and hail drives roughly 54% of solar claim value. Underwriters rating on location and panel count alone are missing the variable that decides outcomes. Requiring documented automatic stow triggers, verified forecasting integration and evidence of operator compliance prices the actual risk rather than the postcode it sits in. Two adjacent sites with identical postcodes but different stow discipline will go on to produce completely different loss outcomes entirely.
Market Impact: Prices in a verified 68% hail damage reduction

Charge For Storage Engineering, Not Storage Capacity

Grid-scale storage grows at 15.3% with almost no credible loss history, and thermal runaway propagating across a site produces total loss shapes conventional property experience never describes. Cell chemistry, enclosure spacing, detection and suppression decide whether one unit burns or the whole site does. Underwriters pricing by megawatt hour are pricing the wrong quantity entirely, and the ones surveying enclosure layout are the only participants actually assessing the exposure. Nobody has a table for this yet, which is precisely why the pricing available to those who will write it remains attractive.
Market Impact: Underwrites a whole class growing at 15.3% annually

Verify Warranty Backing Before It Matters

Operational cover is priced assuming manufacturer warranties absorb early-life equipment failure through roughly 3 years, which is an assumption rather than a fact whenever a manufacturer's finances weaken. Underwriters verifying covenant strength at binding and writing terms that respond differently where it is uncertain are pricing an exposure competitors carry unknowingly. Discovering the warranty was worthless during a claim is considerably more expensive than checking beforehand. An assumption nobody wrote down and nobody verified is exactly the kind of exposure that surfaces at the worst possible moment for everybody involved.
Market Impact: Verifies all 3 years of assumed warranty cover

Who Controls the Margin Pool

Measured on disclosed renewable energy and power gross written premium, the five largest carriers hold a CR5 of just 33%, reflecting a market where specialist underwriters, composite carriers and reinsurers write different layers of the same risks on very different capital. Munich Re carries the deepest technical and reinsurance position, GCube holds long-standing specialist renewable expertise, and AXA XL, Chubb and Zurich Insurance Group hold substantial construction and operational books. Nobody outside that group combines specialist renewable expertise with the line size the largest offshore placements now require.
Three contests define activity. Operational property competes on rate against returning capacity. Offshore marine and cable competes on engineering capability that few carriers genuinely hold. Storage competes on willingness to write exposure nobody can model. The three reward completely different organisations, and hardly anybody competes seriously across more than one of them.

Pressure builds from domestic Asian carriers retaining business that once travelled to international markets. Rankings shift toward whoever holds engineering survey capability rather than whoever holds the largest capacity. Capacity is easy to buy and engineering judgement is not, which decides more of this class than any rating decision ever has.
renewable-energy-insurance-market-company-positioning-matrix-1787913450443

Competitive Moat and Risk Dimensions

MUNICH RE

Moat: Technical Depth Across Emerging Technology

Combining primary underwriting with reinsurance and dedicated engineering assessment gives the group visibility across loss experience that individual carriers never assemble, which matters enormously where actuarial history simply does not exist. Storage, floating offshore and new turbine platforms all require judgement built from data nobody else holds. That combination takes decades rather than capital to build.
MUNICH RE

Risk: Aggregate Exposure Through Reinsurance Layers

Writing both primary and reinsurance across the same emerging technologies concentrates exposure to a serial defect or systematic design failure that appears across an entire installed platform simultaneously. Diversification across projects offers little protection when the projects share a component. That risk is genuinely difficult to quantify before the defect actually reveals itself somewhere.
GCUBE

Moat: Specialist Renewable Claims Experience

Two decades of writing nothing but renewable energy risks produces claims and engineering knowledge that composite carriers entering the class cannot assemble quickly, particularly around cable failure modes, blade damage progression and what actually goes wrong during installation. Brokers bring difficult placements to underwriters who have seen the failure before. That accumulated specificity is harder to replicate than capacity.
GCUBE

Risk: Capacity Limits Against Larger Carriers

Specialist underwriting operations write within capacity constraints that composite carriers and reinsurers do not face, which limits participation on the very largest offshore construction placements where values now run into billions. Technical superiority does not overcome a line size limit, and the largest projects increasingly need carriers able to take substantial shares alone.

Players Tracked

Prominent Players

Munich Re
GCube
AXA XL
Chubb
Zurich Insurance Group

Other Key Players

Allianz Commercial
Swiss Re Corporate Solutions
SCOR
Tokio Marine HCC
Sompo
MS&AD Insurance Group
Liberty Specialty Markets
Beazley
Hiscox
Markel
Aspen Insurance
Ariel Re
Everest Group
PICC Property and Casualty
Ping An Property and Casualty

Recent Developments

MARCH 2025

Solar portfolio applies mandatory stow protocol terms across hail regions

An underwriting portfolio introduced mandatory automatic hail stow protocol requirements as a condition of cover across projects in hail-exposed regions. This was an underwriting terms decision rather than any rate change, and projects unable to demonstrate automated triggers faced sublimits instead of any full cover.
Signal: Controls rather than rates are now doing most of the underwriting work in this whole class.
JULY 2025

Offshore project reports export cable failure during commissioning phase

An offshore wind project reported an export cable failure identified during the commissioning phase, requiring survey, repair vessel mobilisation and delayed energisation. This was an operational incident rather than any commercial development, and the delay component exceeded the physical repair cost by quite a substantial margin indeed.
Signal: Delay consequences here again exceeded the physical damage itself by quite a considerable multiple once more.
OCTOBER 2025

Storage underwriters adopt enclosure spacing standards in policy conditions

Several storage underwriters adopted minimum enclosure spacing and detection standards as explicit policy conditions rather than as survey recommendations. This was a wording development rather than any capacity change, and sites unable to meet the standards found placement considerably more difficult afterwards than they had expected.
Signal: Engineering conditions are steadily replacing actuarial pricing wherever no credible loss history yet exists at all.

Reinsurance, Claims, Engineering

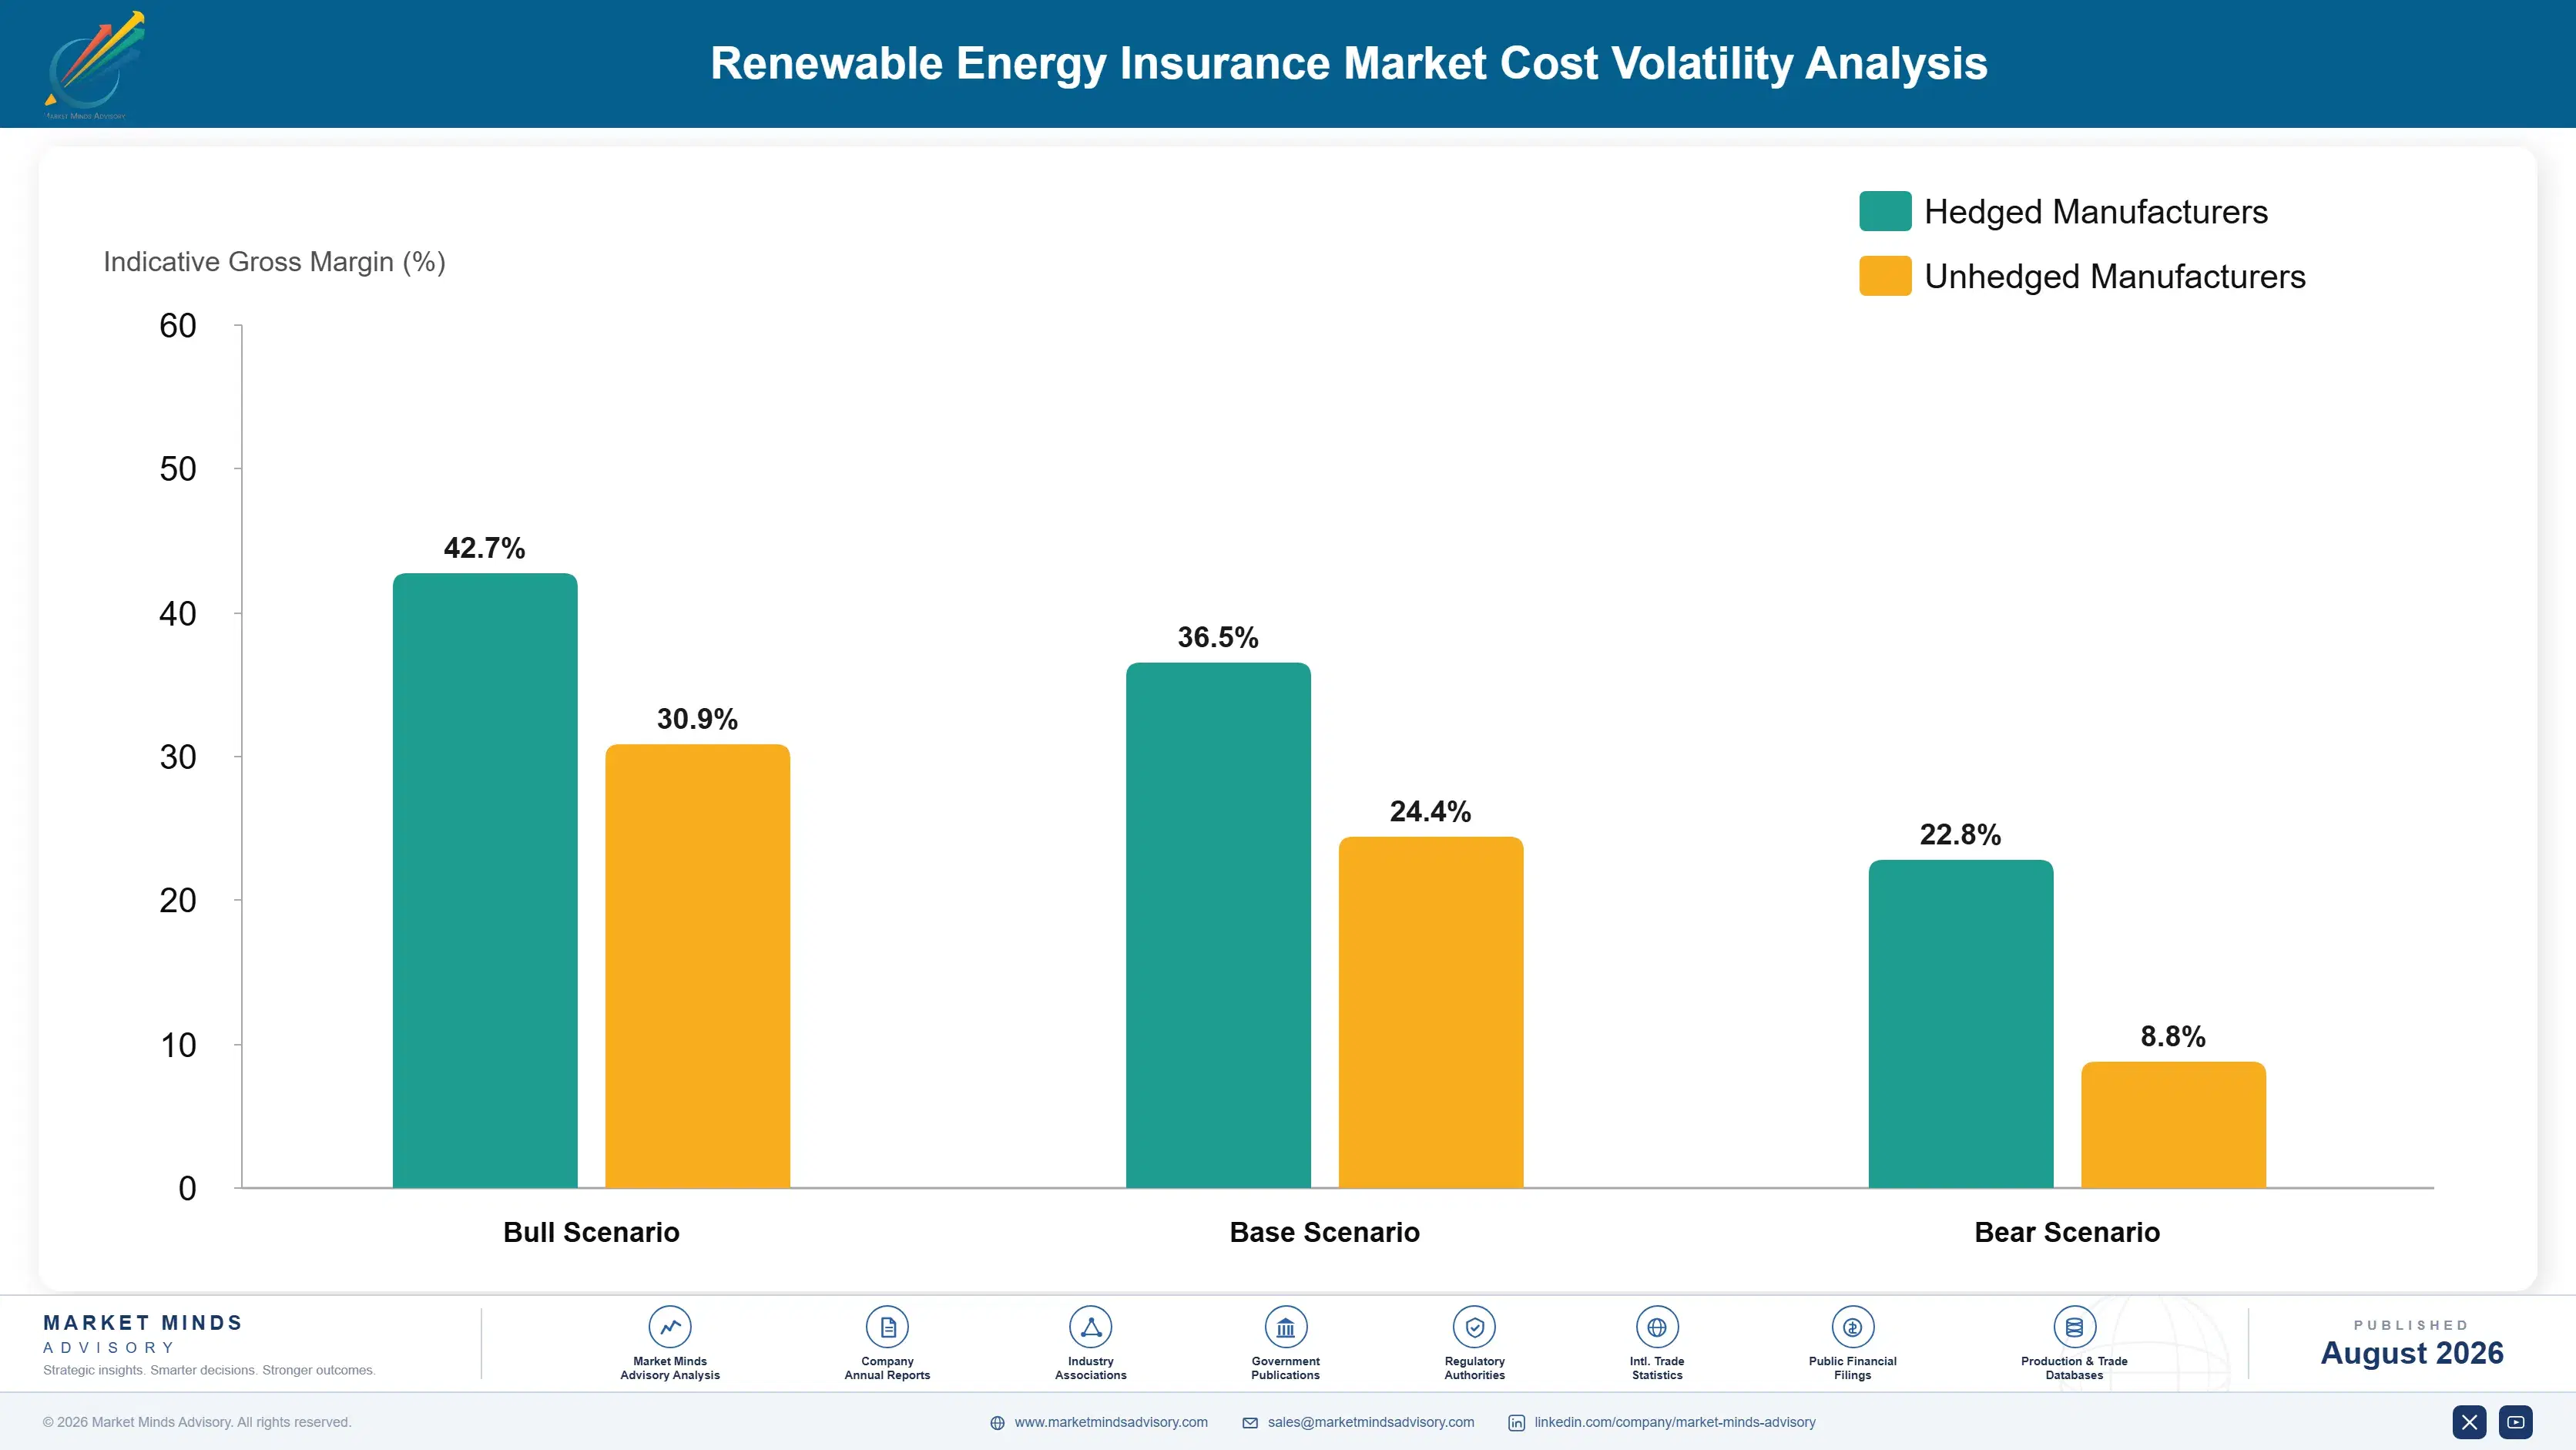
Three costs consume renewable premium. Reinsurance protecting against natural catastrophe accumulation, incurred claims across attritional and catastrophe layers, and broker commission with engineering survey capability together account for 76 to 89% of gross written premium at a typical carrier. Reinsurance is the swing item, since natural catastrophe protection repriced dramatically and attachment points moved upward far enough that primary carriers now retain losses they previously ceded automatically.
Two loss patterns drove the repricing. Hail losses on solar portfolios accumulated across successive events with SEIA capacity data showing how rapidly the exposed asset base had grown. Offshore cable failures accumulated alongside, on an installed base that GWEC data shows expanding into deeper water each year. Munich Re Annual Report 2024 disclosures describe the resulting natural catastrophe and renewable claims environment across primary and reinsurance books together.

Exposure divides by engineering capability rather than by capacity. Carriers with genuine survey and assessment expertise select risks that others cannot distinguish from one another, which matters enormously in a class where controls rather than location decide outcomes. Carriers writing on rate and capacity alone accumulate exactly the risks better underwriters declined. That selection effect compounds quietly across a portfolio and appears all at once.
renewable-energy-insurance-market-cost-volatility-analysis-1787913450648

Buy aggregate catastrophe protection rather than per-risk cover

Hail events strike whole solar portfolios simultaneously rather than damaging one project in isolation, and per-risk reinsurance responds poorly to that pattern. Aggregate and event covers cost more and require exposure data organised by peril footprint rather than by policy. They protect against the accumulation that actually threatens a renewable property account across a season.

Build engineering survey capability before writing new technology

Storage, floating offshore and new turbine platforms all require judgement in the absence of any loss history, and rate tables provide nothing useful whatsoever. Recruiting and retaining genuine engineering assessment capability is expensive and slow to build. It is the only way to distinguish good risks from bad ones in classes where nobody has credible data yet.

Write controls into conditions rather than survey recommendations

Stow protocols cut hail damage by around 68% and enclosure spacing determines whether a storage fire stays local, yet both are frequently recorded as recommendations that operators may or may not follow. Making them explicit policy conditions costs placements at renewal. It converts an underwriting assumption into an enforceable requirement that actually holds up.

Portfolio Architecture for Margin Defence

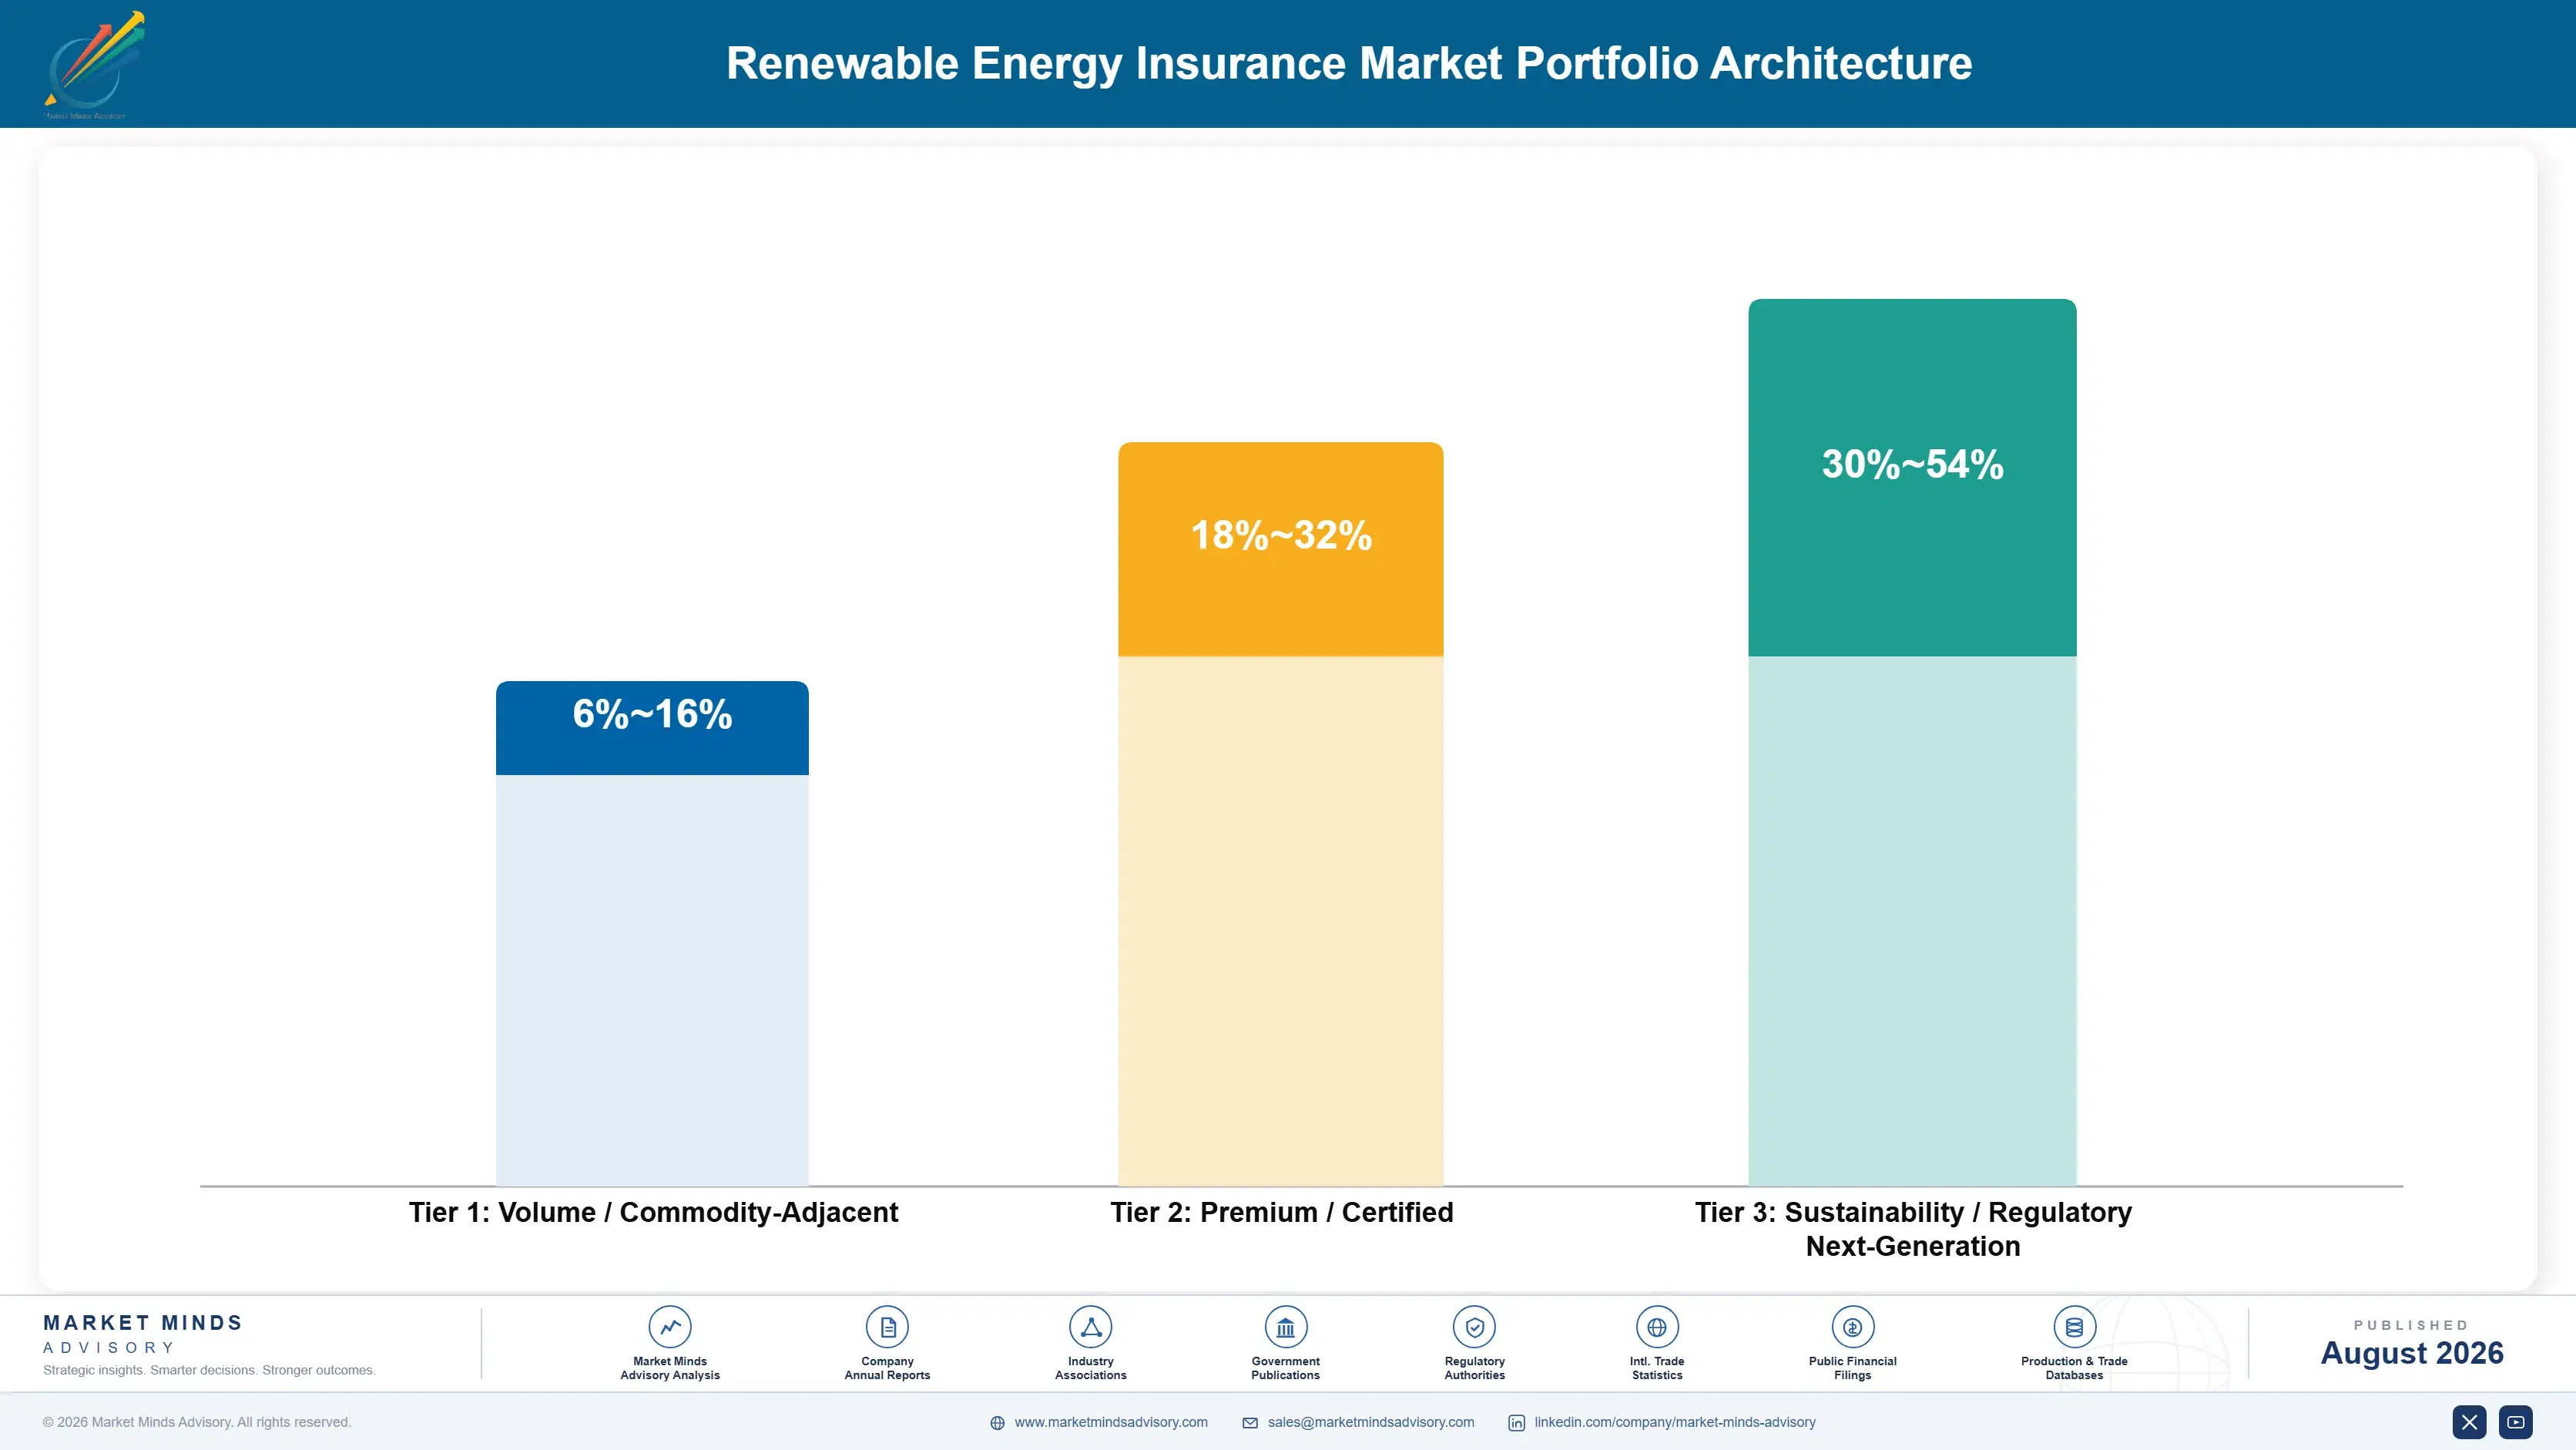
Underwriting margin follows technical scarcity rather than premium volume, which is why the most familiar class earns least. Liability and third-party cover earns thinly against abundant capacity. Operational property earns modestly, with hail consuming most of the rate in exposed regions. Construction all risks earns reasonably on complexity. Business interruption earns well on the multiplier it carries. Offshore marine and cable earns better on genuine engineering scarcity. Storage earns best, while nobody else will write it.
The tension is that the best-earning classes require capability that takes years to build and cannot be bought. Storage and offshore cable underwriting both depend on engineering judgement rather than rate tables, and carriers without that capability are confined to operational property where hail has already consumed the margin. Hiring the capability is slow, and carriers who started early hold an advantage capacity alone does not close.

High-value pools sit in three places. Battery storage cover, where willingness to write exposure nobody can model still commands genuine pricing. Offshore cable and marine, where engineering scarcity is real. And delay in start-up, which multiplies a physical loss by roughly 3.2 times and is priced by very few carriers with the confidence the exposure deserves.

Volume / Commodity-Adjacent

Liability and operational property written into abundant capacity where hail experience has already consumed much of the available rate. The 10-point range separates carriers with genuine risk selection capability from those competing largely on price.
Gross Margin: 6-16%

Premium / Certified

Construction and erection all risks alongside business interruption and delay cover requiring complexity assessment and financial exposure modelling. The 14-point spread reflects how differently onshore construction and delay cover perform across a loss year.
Gross Margin: 18-32%

Sustainability / Regulatory / Next-Generation

Battery storage and offshore marine cable cover requiring engineering judgement where no credible loss history exists at all. The 24-point range is wide because storage margins swing violently with capacity while offshore cable margins move considerably more slowly.
Gross Margin: 30-54%
renewable-energy-insurance-market-portfolio-architecture-1787913451142

High-value Sub-segments and Strategic Watch-out

Battery Storage Underwriting

Highest margin and fastest growth at 15.3%, protected while most carriers remain unwilling to write exposure that no actuarial history describes in any useful way. The risk is that reserves are estimates and a single site-wide event could reset everything. Nobody quite knows that for certain.
Gross Margin: 40-54%

Offshore Cable And Marine

Strong economics from engineering scarcity, since cables carry around 77% of offshore claim value and few carriers genuinely understand the failure modes involved. The risk is that a single large installation loss consumes several years of premium at once. Those losses arrive rarely and severely.
Gross Margin: 32-44%

Operational Property Volume

The volume core, funding the survey capability and broker relationships that everything else is placed through. Carriers hold it for market presence and flow, not because hail-exposed solar property rates itself adequately. Market presence rather than any real margin is what keeps carriers in it.
Gross Margin: 8-18%

Unmanaged Warranty Assumption

The strategic watch-out. Operational cover is priced assuming manufacturer warranties absorb roughly 3 years of early-life failure. The risk is discovering that assumption was worthless during a claim rather than at binding. And that is a very expensive moment indeed at which to find out.
Gross Margin: 4-14%

Lenders Make Cover Compulsory

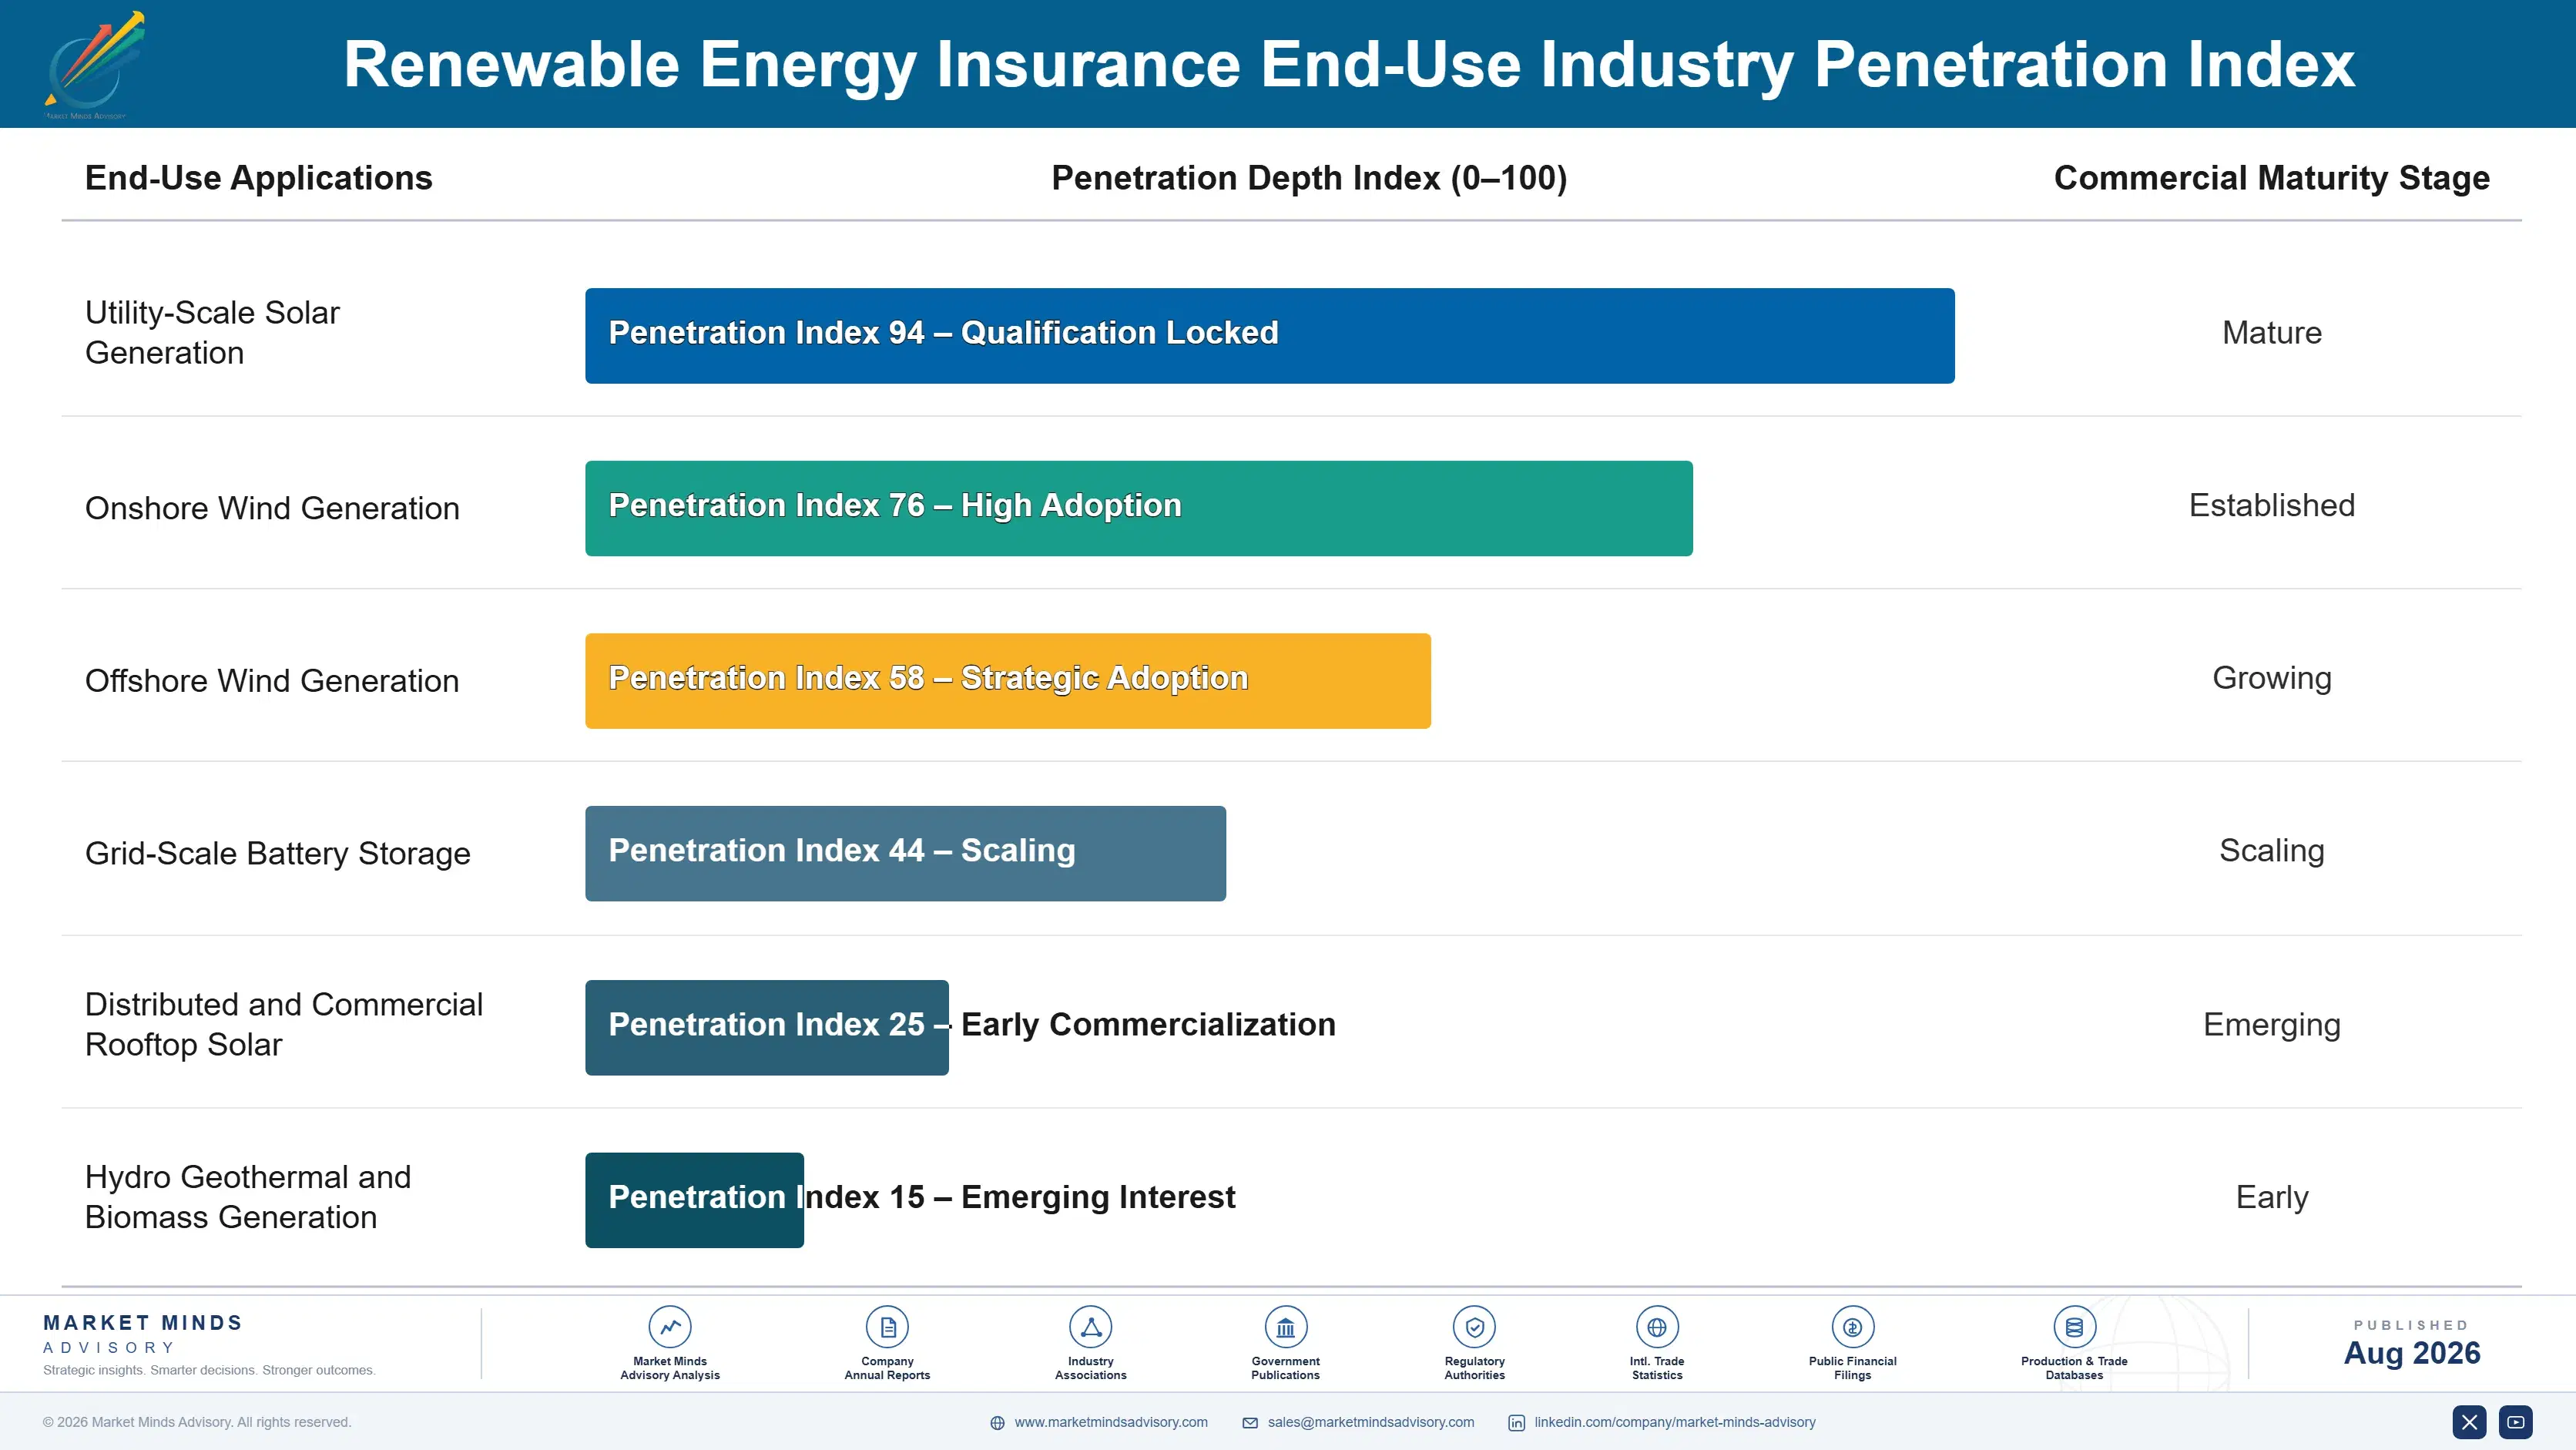
Annuity characteristics here are exceptionally strong because the buyer has no discretion at all. Project finance documents require insurance at specified limits throughout construction and operation, and a lender will not disburse without evidence of it. Demand therefore does not vary with rate, sentiment or economic conditions in any meaningful way. What varies is which carrier holds the placement and at what price, and both move considerably more than volume ever does.
Stickiness divides between operational and construction business quite sharply. Operational property renews annually and moves on rate with limited friction once a broker markets it properly. Construction placements are considerably stickier through the project life, since replacing a carrier mid-build creates gaps nobody wants to explain to a lender. Storage and offshore cable relationships are stickiest of all, because so few carriers will write them at any acceptable terms.

The buyer has professionalised faster than most insurance classes have experienced. Developers once bought through brokers and asked little. Institutional owners now employ risk managers who model retained exposure, negotiate deductibles deliberately and compare carriers on claims behaviour rather than only on price. Lenders and their advisers sit alongside, imposing requirements neither owner nor carrier would have chosen.
renewable-energy-insurance-market-end-use-penetration-index-1787913451628

Engineering Beats Rate Setting

These are among the four positions where our research anticipates prominent divergence between winners and laggards over the coming forecast period. Each is grounded in the demand model, the regulatory perimeter, and the announced capacity pipeline.
01 / CABLE SURVEY PRIORITY

A tenth of the cost, most of the losses

Inter-array and export cables together represent roughly a tenth of offshore project capital cost while accounting for around 77% of the total claim value, through installation damage, insufficient burial depth and failure at the foundation entry point. Survey attention nonetheless still concentrates overwhelmingly on the turbines and foundations that hardly ever fail at all. Underwriters who review burial specification, installation contractor record and weather window discipline are examining the exact place where the money genuinely leaves all of these projects.
02 / STOW PROTOCOL RATING

Panels that tilt survive, panels that lie flat do not

Trackers rotating to a steep stow angle on a hail forecast reduce panel damage by around 68%, which is a considerably larger effect than any other control available on a solar site and cheaper than most of the alternatives. Hail drives roughly 54% of all solar claim value right across the class. Underwriters who are still rating on location and panel count alone are missing the single variable that most reliably determines whether a whole portfolio survives a given season intact.
03 / STORAGE ENGINEERING ASSESSMENT

Spacing decides whether one unit burns or all

Grid-scale storage grows at 15.3% a year with almost no credible loss history behind it at all, and thermal runaway propagating across a whole site produces a total loss shape that conventional property experience simply does not describe anywhere at all. Cell chemistry, enclosure spacing, detection and suppression together determine whether one single unit burns or the entire installation does. Underwriters who are pricing by megawatt hour are measuring the wrong quantity entirely, and they will discover as much rather expensively.
04 / WARRANTY COVENANT VERIFICATION

You are insuring a promise you never checked

Operational cover here gets priced on the assumption that manufacturer warranties will absorb early-life equipment failure through roughly 3 years of service, which is an assumption rather than any kind of established fact once a manufacturer's finances start weakening at all. Underwriters who verify covenant strength at binding are pricing an exposure that their competitors are carrying entirely unknowingly. Finding all of that out during a claim costs a great deal more than simply checking beforehand ever would have done.

Engagement Snapshot From the Field

A live engagement with an industry participant carrying material or product regulatory and market exposure ahead of a defining policy shift, showing how our research translates into a defensible multi-year portfolio strategy.
MARKET MINDS ADVISORY · CLIENT ENGAGEMENT SUMMARY
Renewable Energy Insurance Producer Strategic Portfolio Review and Transition Roadmap 2026·Investment Scenario on Renewable Energy Insurance Exposure Evaluation 2025-26
CLIENT PROFILE
A specialty energy underwriting operation writing renewable property and construction business across European and North American markets, with reported renewable gross written premium of 190 million dollars (client-reported, unverified by MMA). Roughly 68% sat in operational solar and onshore wind property. No dedicated storage capability existed and hail stow protocols were recorded as survey recommendations rather than conditions.
STRATEGIC CHALLENGE
Solar property loss ratios had deteriorated across three consecutive hail seasons while the book grew, and reinsurance attachment points had risen far enough that retained losses were consuming the account. Management proposed a broad rate increase across the solar portfolio. That applied the same correction to well-controlled and poorly controlled sites alike, and the well-controlled ones would leave first.
MMA APPROACH
MMA reconstructed solar loss experience by site against control characteristics, separating tracker stow capability, panel specification and operator compliance evidence. Twenty-four expert interviews with brokers, engineering surveyors, storage integrators and reinsurance underwriters established what actually distinguishes performance. The analysis treated control-based rating and storage capability building as the routes available forward.
KEY FINDINGS
  1. Sites with automated stow protocols had produced dramatically lower hail loss than those without, and the underwriting file recorded that distinction nowhere at all.
  2. A uniform rate rise would have driven away exactly the well-controlled sites the portfolio needed while retaining the poorly controlled ones that could not move.
  3. Storage submissions had been declined for eighteen months for lack of capability, and brokers had stopped sending them entirely as a result.
  4. Warranty covenant strength had never been assessed at binding on any placement, despite operational pricing assuming it held throughout the early years.
CLIENT PROFILE
A specialty energy underwriting operation writing renewable property and construction business across European and North American markets, with reported renewable gross written premium of 190 million dollars (client-reported, unverified by MMA). Roughly 68% sat in operational solar and onshore wind property. No dedicated storage capability existed and hail stow protocols were recorded as survey recommendations rather than conditions.
STRATEGIC CHALLENGE
Solar property loss ratios had deteriorated across three consecutive hail seasons while the book grew, and reinsurance attachment points had risen far enough that retained losses were consuming the account. Management proposed a broad rate increase across the solar portfolio. That applied the same correction to well-controlled and poorly controlled sites alike, and the well-controlled ones would leave first.
MMA APPROACH
MMA reconstructed solar loss experience by site against control characteristics, separating tracker stow capability, panel specification and operator compliance evidence. Twenty-four expert interviews with brokers, engineering surveyors, storage integrators and reinsurance underwriters established what actually distinguishes performance. The analysis treated control-based rating and storage capability building as the routes available forward.
KEY FINDINGS
  1. Sites with automated stow protocols had produced dramatically lower hail loss than those without, and the underwriting file recorded that distinction nowhere at all.
  2. A uniform rate rise would have driven away exactly the well-controlled sites the portfolio needed while retaining the poorly controlled ones that could not move.
  3. Storage submissions had been declined for eighteen months for lack of capability, and brokers had stopped sending them entirely as a result.
  4. Warranty covenant strength had never been assessed at binding on any placement, despite operational pricing assuming it held throughout the early years.
RECOMMENDED STRATEGY
Phase 1: Phase one: convert stow protocols from survey recommendations into explicit policy conditions and reprice by control rather than by location. Phase 2: Phase two: recruit storage engineering assessment capability, since brokers have stopped presenting submissions that the account currently cannot evaluate at all. Phase 3: Phase three: introduce warranty covenant verification at binding across all operational placements rather than simply assuming the backing still holds.
OUTCOME
Control-based repricing retained the well-controlled solar sites and shed a group of uncontrolled ones (client-reported, unverified by MMA). Storage assessment capability was recruited and first submissions returned within two quarters. Warranty verification was introduced at binding. The uniform rate increase was abandoned, having proposed correcting a portfolio by driving out precisely the risks worth keeping.

Frequently Asked Questions

Foundational context covering the market sizes, CAGR, scope, country, region and competition that inform every finding below. This section is provided to cover basics and most often pre-purchase conversations, answered from the MMA Primary Research Dataset.

What is the current size of the Renewable Energy Insurance Market?

The market was worth 8.2 billion dollars in gross written premium in 2025, across operational property, construction, storage, offshore marine, business interruption and liability. It reaches 9.04 billion dollars in 2026.

How large will the Renewable Energy Insurance Market be by 2036?

MMA forecasts 23.88 billion dollars by 2036, an increase of 14.84 billion dollars over the 2026 base. That represents an expansion multiple of 2.64 times across the forecast period.

What is the CAGR for the Renewable Energy Insurance Market 2026 to 2036?

The base case compounds at 10.2% annually. The bull case reaches 11.4% on continued hardening after further hail and storage losses, while the bear case sits at 9.0%.

Which segment is growing fastest?

Battery storage and hybrid asset cover, at 15.3%, half again the market rate of 10.2%. Underwriters hold almost no credible loss history for thermal runaway across a site.

Who are the major companies in the Renewable Energy Insurance Market?

Munich Re, GCube, AXA XL, Chubb and Zurich Insurance Group lead on disclosed renewable and power premium. Concentration is only 33% across specialists, composites and reinsurers.

Which country is growing fastest?

India at 12.2%, adding solar, wind and storage capacity faster than domestic underwriting expertise in these classes has actually managed to develop alongside any of it.

Report Segmentation Architecture

The full report scope spans multiple orthogonal segmentation dimensions, with cross-tabulated demand data provided for each dimension pair. Coverage extends further to regional breakdowns, trend trajectories, and the competitive detail needed to support segment-level decision-making.

By Class of Cover

  • Operational Property and Machinery Breakdown
  • Construction and Erection All Risks
  • Battery Storage and Hybrid Asset Cover
  • Offshore Wind Marine and Cable Cover
  • Business Interruption and Delay in Start-Up
  • Liability and Third-Party Cover

By End-Use Industry

  • Utility-Scale Solar Generation
  • Onshore Wind Generation
  • Offshore Wind Generation
  • Grid-Scale Battery Storage
  • Distributed and Commercial Rooftop Solar
  • Hydro Geothermal and Biomass Generation

By Commercial Dimension

  • Broker Placed Project Cover
  • Owner Portfolio Programme Placement
  • Lender Required Insurance Arrangements
  • Coverholder and Delegated Authority
  • Facultative Reinsurance Participation
  • Parametric and Alternative Risk Transfer

By Region

  • North America
  • Western Europe
  • East Asia
  • South Asia and Pacific
  • Latin America
  • Middle East and Africa
  • Eastern Europe

Scope, Methodology, and Coverage

Every figure in this report is reproducible from documented input assumptions. The scope below maps the historical period, the forecast horizon, the segmentation dimensions, and the countries covered, alongside the underlying primary and qualitative methodology.
Historical Period
2020 to 2025
Forecast Period
2026 to 2036
Base Year
2025 (USD billions; MMA Primary Research Dataset, August 2026)
Market Definition
Scope covers gross written premium across insurance classes written on renewable energy generation and storage assets worldwide, spanning operational property and machinery breakdown cover, construction and erection all risks including marine transit and installation, battery storage and hybrid asset cover, offshore wind marine and cable cover across inter-array and export cable exposure, business interruption and delay in start-up cover, and liability and third-party cover attaching to generation assets. Conventional thermal nuclear and large hydro power insurance, transmission and distribution network cover unconnected to generation assets, manufacturer product warranty obligations, power price hedging and revenue or merchant risk insurance, project finance credit and political risk insurance, and reinsurance ceded between carriers are excluded from the market size and all derived figures.
Quantitative Units
USD billions of gross written premium (current prices); insured asset value in USD billions; claim share by component and peril as percentage; damage reduction from controls as percentage; delay loss multiplier against physical damage
Segmentation Dimensions
By Class of Cover; By End-Use Industry; By Commercial Dimension; By Region
Regions Covered
North America, Western Europe, East Asia, South Asia and Pacific, Latin America, Middle East and Africa, Eastern Europe
Countries Covered
China, USA, Germany, UK, India, Japan, Netherlands, Denmark, Spain, Brazil, France, Australia, Chile, Poland, Saudi Arabia
Key Companies Profiled
Munich Re, GCube, AXA XL, Chubb, Zurich Insurance Group, Allianz Commercial, Swiss Re Corporate Solutions, SCOR, Tokio Marine HCC, Sompo, MS&AD Insurance Group, Liberty Specialty Markets, Beazley, Hiscox, Markel, Aspen Insurance, Ariel Re, Everest Group, PICC Property and Casualty, Ping An Property and Casualty
Quantitative Methodology
Primary survey, n=3,800 respondents, Q4 2025, six countries; demand-side model with trade association cross-validation
Qualitative Methodology
47 expert interviews, Q4 2025; applied to validate demand model assumptions, identify emerging dynamics, and assess competitive positioning
Report Format
PDF and XLSX data workbook (Word format preview document)
Publisher
Market Minds Advisory
Report Code
MMA-2026-ENE-131
Published
August 2026
Contact
sales@marketmindsadvisory.com | www.marketmindsadvisory.com

Purchase the full Renewable Energy Insurance Market Report (2026 to 2036).

The full report runs to 190 pages and covers all six classes of cover, seven regions and 20 profiled carriers in detail. It includes the complete segment CAGR set, regional analysis of installed capacity against peril exposure, and loss attribution by component and peril across offshore wind, solar and storage assets. Company profiles carry evaluation on disclosed renewable energy and power gross written premium, with moat and risk assessment for the top five carriers. The competitive section extends to 14 tracked underwriting, wording and claims developments across 2024 and 2025. Primary research inputs include a quantitative survey of 3,800 respondents and 47 expert interviews conducted in Q4 2025.
Six classes of cover with individual CAGR forecasts
Seven regions compared on installed capacity against peril exposure
Twenty carrier profiles on consistent gross written premium basis
Fourteen tracked underwriting and claims developments with commercial interpretation
Loss attribution modelled by component and peril across technologies
Control effectiveness quantified for stow protocols and storage spacing

Built For The People Who Decide

From boardroom strategy to bench-side execution, this report is read cover-to-cover by leaders shaping the next decade of their industry, turning demand scenarios, market dynamics and valuation benchmarks into decisions.
CXOs/ Presidents/ VPs/ Managers
M&A and Corporate Development
Strategy Teams and R&D Heads
Procurement and Product Directors
Regulatory and Compliance Leaders
Investor Relations and Equity Analysts