Market Minds Advisory
Remote Learning Technology Spending Market

Remote Learning Technology Spending Market: Learning Platforms, Virtual Classrooms, and AI Tutoring Investment Worldwide.

Institutional buyers are shifting spending away from pandemic-era video conferencing licenses toward artificial intelligence tutoring platforms and corporate upskilling systems, as budget holders demand measurable learning outcomes rather than mere access.

Lead Analyst

Published

September 2026

Make Smarter Decisions with Customized Research Insights

Request a free sample report and evaluate market opportunities, growth trends, and competitive dynamics relevant to your business needs.

2025 MARKET VALUE$45.0BMarket Size 2025
2036 FORECAST VALUE$116.1BBase Case , 2026 to 2036
CAGR 2026 TO 20369.0 %Bull 10.2% / Bear 7.8%
INCREMENTAL OPPORTUNITY$67.1BNet 10- year value creation
EXPANSION MULTIPLE2.37x2036 value over 2026 base
Strategic Levers
M&A Pipeline
Regional Outlook
Country Rankings
Competitive Intelligence
Segmental Deep-dive
Call-Us : 91 93563 13602

Executive Snapshot and Market Trajectory.

Remote learning technology spending is moving past its pandemic-driven adoption peak into a more discriminating second phase, as institutional and corporate buyers redirect budgets from basic video conferencing access toward artificial intelligence tutoring and measurable workforce upskilling outcomes. This shift is redefining how procurement teams evaluate every major vendor relationship.
AI-powered tutoring and adaptive learning platforms are absorbing the largest share of new spending as institutions seek personalized instruction at scale, while corporate learning and development platforms grow nearly as fast on the strength of enterprise reskilling budgets. North America and East Asia concentrate the bulk of spending, reflecting both large higher-education systems and expanding corporate training investment. Vendors serving both institutional and corporate buyers increasingly report cross-selling opportunities between the two segments.
Competitive intensity remains moderate, with Microsoft, Google, and Zoom holding durable platform advantages built on existing productivity suite relationships that extend naturally into education and training use cases. Specialized artificial intelligence tutoring vendors are gaining share in specific outcome-focused categories where established platform vendors' broader suites fit less precisely. Institutions increasingly weigh a vendor's outcome data alongside traditional platform features when renewing contracts.
Market Definition
The market covers software and platform spending for learning management systems, virtual classroom tools, content authoring, artificial intelligence tutoring, online proctoring, and corporate learning and development used by educational institutions and enterprises. It excludes hardware devices, campus network infrastructure, and in-person classroom furniture or facilities spending.
Base Year Value
$45.0B in 2025 (MMA Primary Research Dataset, September 2026)
Forecast Period
2026 to 2036, eleven discrete annual values
CAGR
9.0% base case. Bull 10.2%. Bear 7.8%.
Fastest Growth Segment
AI-Powered Tutoring and Adaptive Learning Platforms: 16.0% CAGR
Fastest Growth Country
India: 11.3% CAGR
Fastest Growth Region
South Asia and Pacific: 11.0% CAGR
Largest Region
North America: 30% of 2025 global value
Market Leaders
Microsoft, Google, Zoom, Instructure, Coursera. Source: MMA Analysis based on company annual reports and education technology industry disclosures.
Primary Survey
n=3,800 procurement and R&D decision-makers, Q4 2025, six countries
Methodology
Demand-side build-up, cross-validated against public data, 47 expert interviews

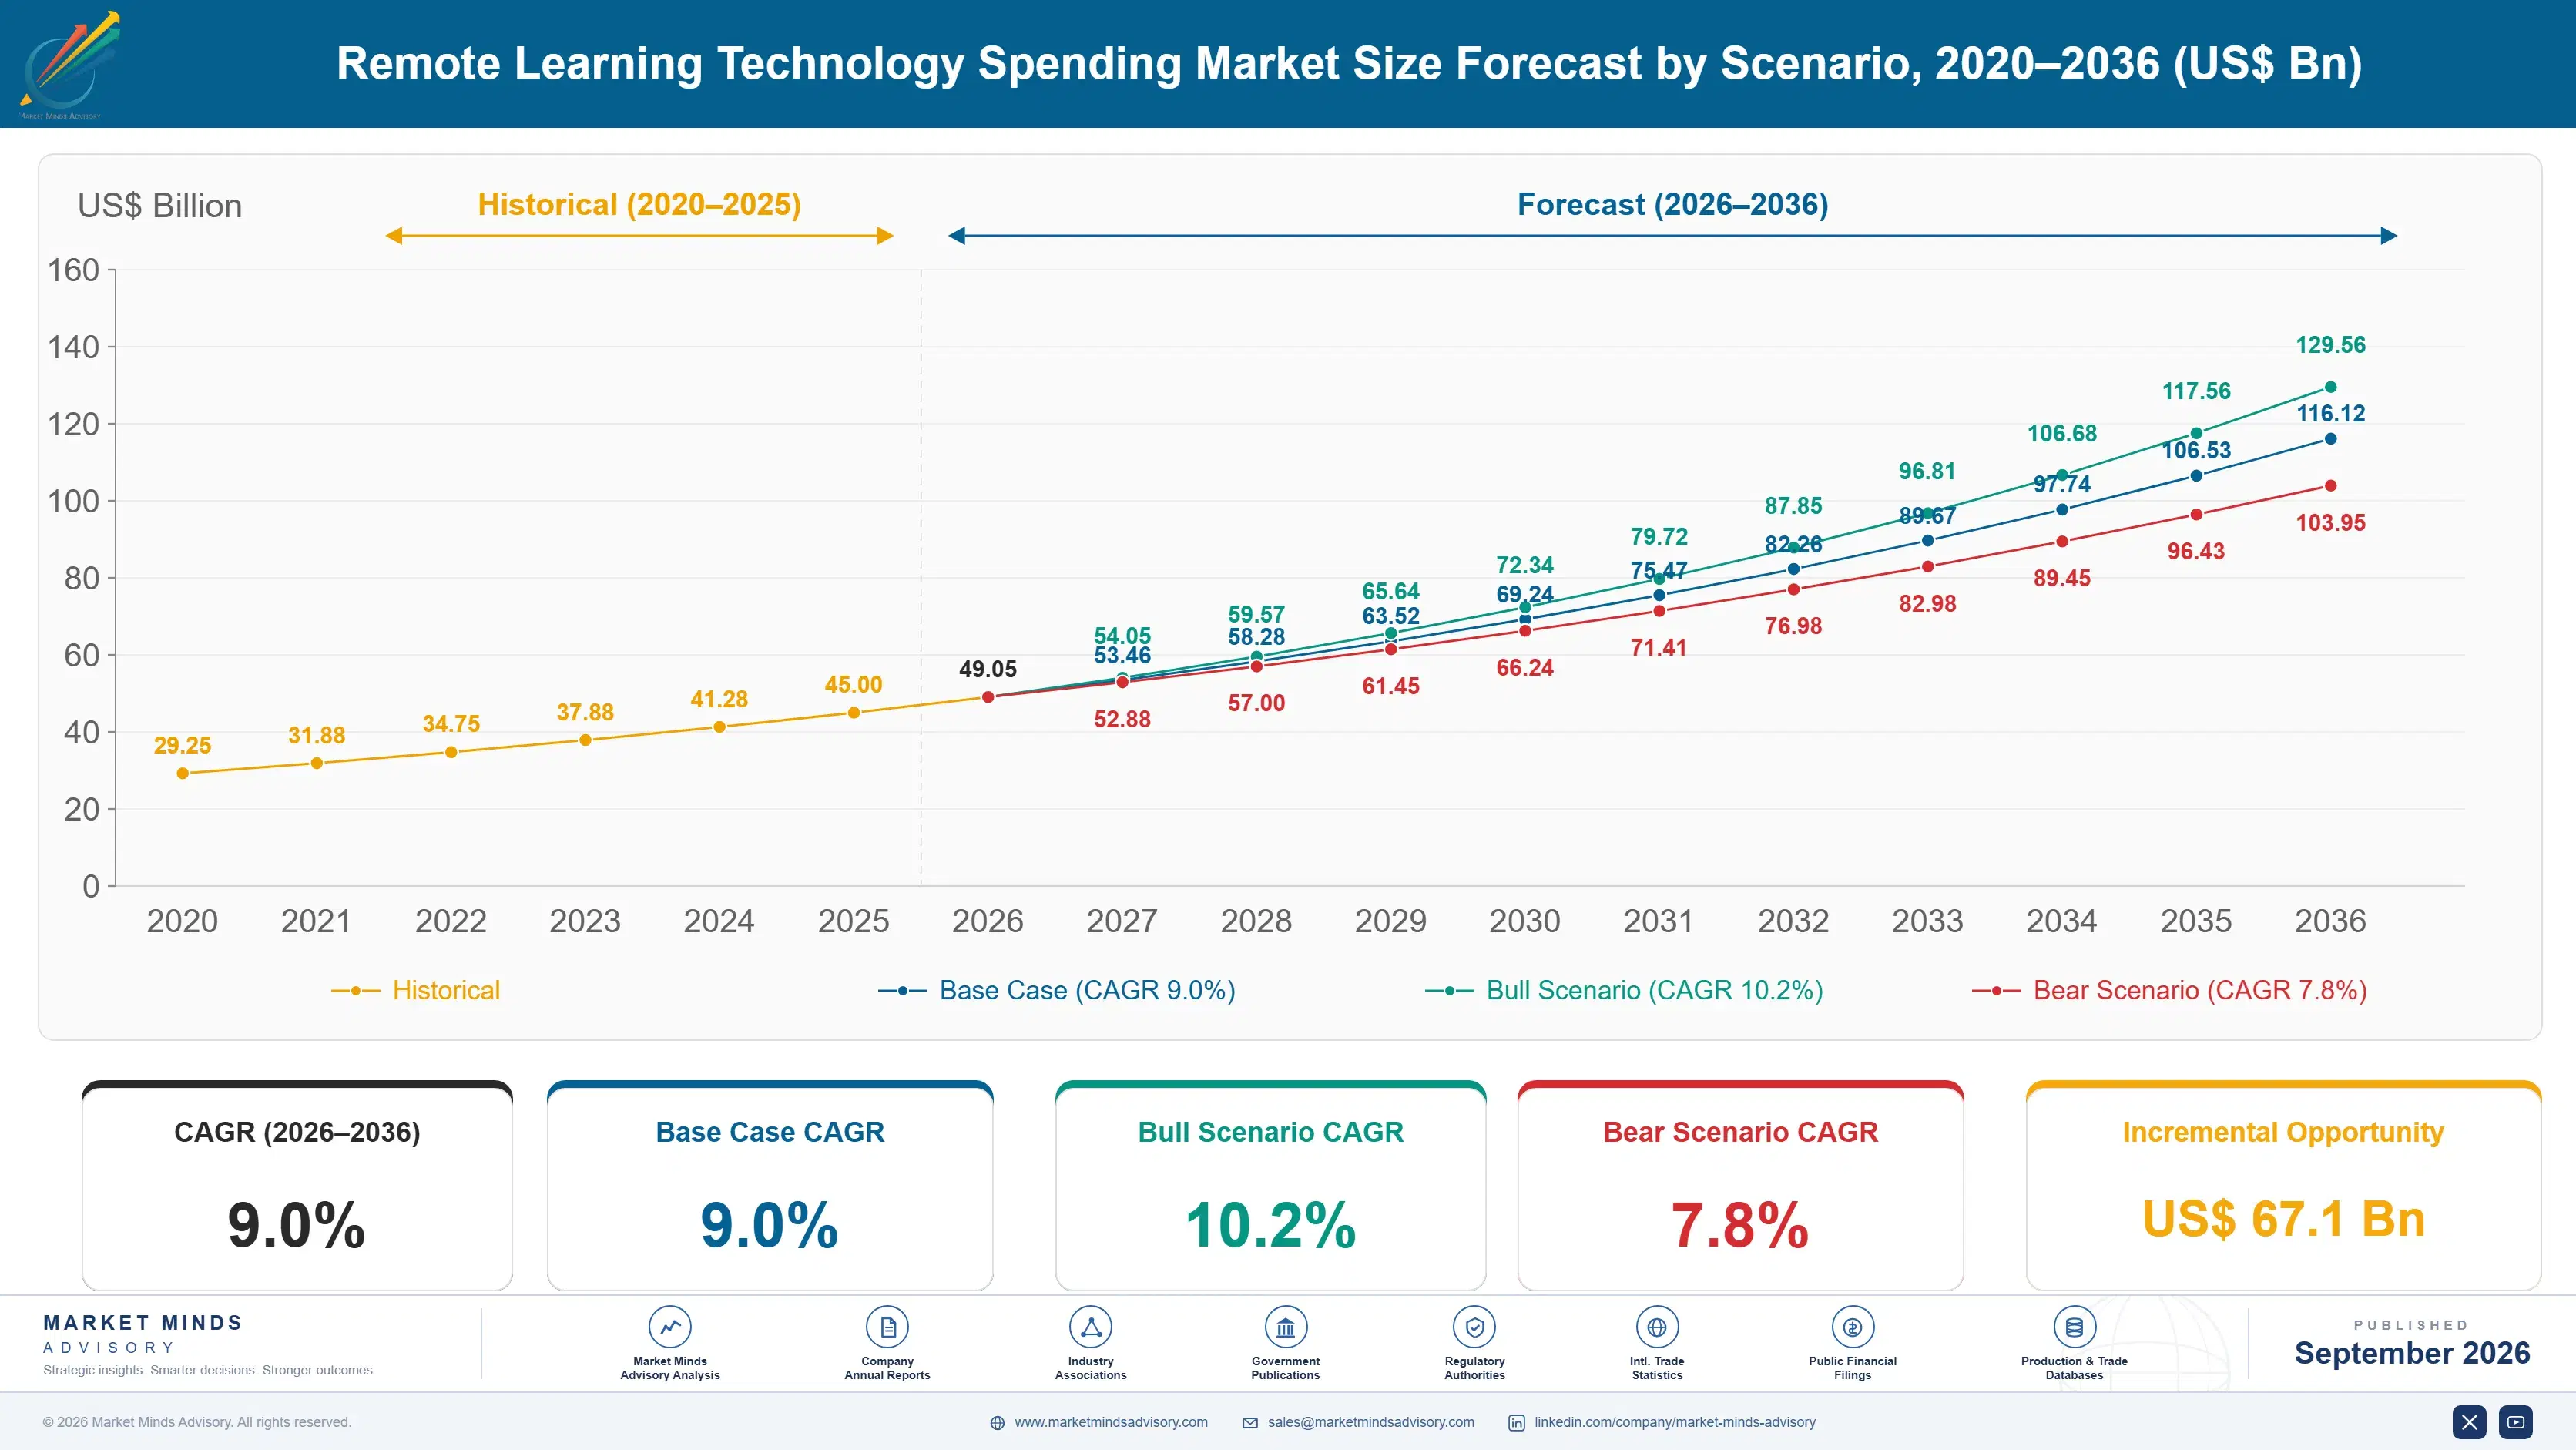
Remote Learning Technology Spending Market Forecast Scenarios

remote-learning-technology-spending-market-size-forecast-scenario-1790001827537
Between 2020 and 2025 remote learning technology spending grew at an estimated 8.0% historical annual rate, following an initial pandemic-driven surge that subsequently moderated as institutions consolidated redundant tools and corporate buyers grew more selective about measurable training return on investment before renewing contracts. Institutions investing early in outcome measurement during this period report steadier renewal rates than late-adopting peers.
The base case assumes renewed acceleration through 2036 as three mechanisms compound: artificial intelligence tutoring platforms demonstrating measurable learning outcome improvements that justify premium pricing, corporate reskilling budgets expanding as automation reshapes workforce skill requirements across industries, and higher-education institutions consolidating fragmented point-tool spending into integrated platform contracts. Universities piloting artificial intelligence teaching assistants illustrate how institutional buyers increasingly evaluate technology on demonstrated outcome improvement rather than access convenience alone.
The bull case centers on artificial intelligence tutoring platforms achieving broader institutional adoption faster than currently modeled, pulling forward spending as measurable outcome data accumulates. The bear case hinges on continued budget consolidation at cash-strapped public education institutions offsetting corporate and higher-education spending growth, particularly if enrollment declines pressure already-constrained public sector technology budgets further.

Institutional Budget Cycles and Outcome-Driven Spending

Remote learning technology spending sits at the intersection of institutional budget cycles and rapidly maturing artificial intelligence capability, converting what were once pandemic-era access tools into platforms increasingly evaluated on measurable learning and workforce outcome improvement. Institutional buyers are increasingly demanding outcome data before renewing contracts rather than accepting usage metrics alone as sufficient justification.
MARKET CONCENTRATION (CR5)34%Reflects a fragmented platform and specialized point-tool vendor base
AVERAGE INSTITUTIONAL LICENSE SPEND$1.2MTypical annual multi-platform technology spending for a mid-sized university
TOP SPENDING COUNTRY SHAREUnited StatesLargest single-country institutional and corporate learning technology spending
AI TUTORING ADOPTION RATE24%Share of higher-education institutions piloting artificial intelligence tutoring
AVERAGE CONTRACT RENEWAL CYCLE3 yearsTypical duration of an institutional multi-year platform licensing agreement
COGS CLOUD INFRASTRUCTURE SHARE28%Cloud hosting and compute infrastructure as share of unit cost
Commercial character today increasingly favors vendors offering integrated platforms spanning learning management, content delivery, and assessment rather than institutions licensing standalone point tools from multiple vendors separately. Procurement decisions increasingly involve both academic leadership and information technology departments jointly, reflecting growing recognition that platform choice affects both pedagogy and total cost of ownership. This joint procurement approach increasingly requires vendors to speak credibly to both academic outcomes and total pipeline cost considerations.
Over the next decade, expect continued consolidation around integrated, outcome-measurable platforms as institutions tire of managing fragmented multi-vendor technology stacks, while artificial intelligence tutoring becomes the primary new value proposition justifying continued technology investment well beyond the initial pandemic-driven access wave that first established the category's baseline spending level. Vendors slow to build this outcome narrative risk losing renewal conversations to competitors offering clearer measurable evidence.
"Nobody buys a video conferencing license anymore just to say class happened online. Budget committees want to see a test score or a completion rate move, and that single change rewired the entire procurement conversation."
Director, Education Technology and Workforce Development Practice · MMA Technology / Education and Workforce Development Software Practice · September 2026

Market Trends

Artificial Intelligence Tutoring Platforms Reach Institutional Scale

Artificial intelligence tutoring platforms capable of providing personalized instruction at scale have matured from experimental pilot programs into production deployments that major universities and school districts now evaluate alongside traditional learning management system contracts rather than treating as a separate, speculative category. Several large public university systems across the United States have moved from single-department pilots to institution-wide artificial intelligence tutoring deployment within the past two years, reflecting growing confidence in measurable outcome data these platforms increasingly generate. Vendors report artificial intelligence tutoring now among the fastest-growing categories, outpacing traditional learning management system license growth.
Market Impact: Cuts vendor count 35%

Corporate Reskilling Budgets Expand Amid Automation Pressure

Large enterprises across technology, financial services, and manufacturing sectors are expanding corporate learning and development budgets substantially as automation and artificial intelligence reshape required workforce skills faster than traditional hiring alone can address. Chief human resources officers increasingly treat reskilling technology spending as a strategic retention and productivity investment rather than a discretionary training line item subject to easy budget cuts during downturns. Vendors report corporate learning platform contract values growing considerably faster than higher-education contracts, reflecting enterprises' generally larger per-seat budgets and faster procurement decision cycles relative to public institution buying processes.
Market Impact: Adds funding across 50,000 schools

Market Opportunities and Growth Drivers

Institutional Platform Consolidation Reduces Vendor Fragmentation

Educational institutions accumulated numerous overlapping point tools during the pandemic-era rapid adoption period, and many are now consolidating this fragmented technology stack into fewer, more integrated platform contracts to reduce both licensing costs and information technology support burden. This consolidation trend favors vendors offering comprehensive platforms spanning multiple functional categories over specialized point-solution vendors serving a single narrow use case. Vendors offering integrated learning management, content authoring, and assessment capability within a single contract report meaningfully higher win rates in competitive institutional tenders than point-solution competitors bidding on individual components separately.
Market Impact: Adds 20% to multi-region compliance cost

Government Digital Education Funding Programs Expand

National and regional governments across India, the European Union, and parts of Africa are directing substantial funding toward digital education infrastructure, recognizing remote and hybrid learning capability as essential rather than optional following pandemic-era experience with fully in-person-dependent education systems. India's national digital education initiatives have directed considerable funding toward both public school and higher-education technology adoption, creating a large addressable market for platform vendors targeting price-sensitive public sector budgets. These funding programs typically require multi-year technology deployment commitments, providing vendors with more predictable long-term revenue visibility than purely discretionary institutional spending alone would offer.
Market Impact: Extends sales cycles 14 months

Market Restraints and Challenges

Data Privacy Regulations Complicate Platform Deployment

Student and employee data privacy regulations across different jurisdictions impose varying compliance requirements that complicate deploying a single standardized platform configuration across multi-country institutional or corporate customers. The root cause is that education and workforce data privacy law developed independently across different countries and even different states within the same country, leaving vendors managing a genuinely fragmented compliance landscape rather than a single harmonized standard. This raises compliance costs considerably for vendors serving multiple jurisdictions. Vendors mitigate the burden by building configurable data residency and privacy controls directly into their platform architecture.
Market Impact: Improves student completion rates 25%

Budget Constraints at Public Institutions Limit Spending

Public school districts and public universities frequently operate under considerably tighter and less flexible technology budgets than corporate or private institution buyers, limiting how quickly they can adopt premium artificial intelligence tutoring or comprehensive platform consolidation even when the underlying case for adoption is otherwise compelling. The root cause traces to public funding formulas that rarely earmark dedicated technology modernization budgets, forcing technology spending to compete directly against other pressing operational priorities like staffing and facilities maintenance. This constrains adoption pace independent of platform quality. Vendors mitigate the constraint through tiered, lower-cost public sector pricing and phased deployment options.
Market Impact: Expands corporate training budgets 30%
3 additional market trends, 4 additional growth drivers, and 3 additional restraints and challenges are covered in the full report. Contact sales@marketmindsadvisory.com to access the complete intelligence.

Segment CAGR and Growth Architecture

Remote learning technology spending is segmented by product and platform type rather than by end-use institution or geography, since procurement decisions center on which functional category a given technology investment addresses. This lens separates learning management platforms from tutoring, assessment, and corporate development tools that serve distinct buyer teams and budget lines entirely. Regulatory requirements differ meaningfully across categories.
remote-learning-technology-spending-market-market-share-analysis-1790001828515

AI-Powered Tutoring and Adaptive Learning Platforms

Artificial intelligence-powered tutoring and adaptive learning platforms represent the fastest-growing segment as institutions and enterprises seek personalized instruction at scale that traditional one-size-fits-all content delivery could never achieve cost-effectively across large student or employee populations. This segment covers adaptive learning software that adjusts content difficulty in real time, artificial intelligence teaching assistants capable of answering student questions, and personalized skill-gap assessment tools that direct learners toward specific content modules. Major public university systems and large enterprises have both moved from single-department pilots to broader institutional and organizational deployment within the past two years, reflecting growing confidence in measurable outcome data these platforms increasingly generate. Contract values here now considerably outpace the broader category's average growth trajectory.
CAGR 16.0%

Corporate Learning and Development Platforms

Corporate learning and development platforms represent the second-fastest-growing segment as enterprises expand reskilling budgets to address workforce skill gaps created by automation and artificial intelligence reshaping job requirements faster than traditional hiring alone can address. This segment covers corporate training content libraries, skills assessment and certification tracking, and compliance training platforms that together let enterprises manage workforce development at scale across distributed employee populations. Chief human resources officers increasingly treat this spending as a strategic retention and productivity investment rather than a discretionary line item subject to easy budget cuts during economic downturns. Vendors report corporate contract values growing considerably faster than public institution contracts, reflecting generally larger per-seat enterprise budgets and faster procurement cycles.
CAGR 11.0%
Full segment breakdown across 6 segments available in the complete report.

Regional Architecture and Country Demand Map

North America and East Asia concentrate the largest share of spending, reflecting large higher-education systems and expanding corporate training investment, while South Asia and the Pacific show the fastest growth from a smaller installed base. Latin America and Eastern Europe trail but grow steadily as public funding extends regionally.

North America

United States higher-education institutions and large enterprises lead regional spending, increasingly consolidating fragmented pandemic-era point tools into integrated platform contracts spanning learning management, tutoring, and assessment capability. Canadian institutions follow a broadly similar consolidation trajectory at smaller absolute scale given the country's considerably smaller higher-education and corporate market relative to its southern neighbor. Regional spending increasingly favors artificial intelligence tutoring platforms as major public university systems move from pilot programs to institution-wide deployment, reflecting growing confidence in measurable student outcome improvement data these platforms generate. Corporate reskilling budgets across major technology and financial services employers add further meaningful regional demand beyond higher-education spending alone. Vendors report bidding activity from this segment growing steadily each quarter.
Share: 30% | CAGR: 9.5% (2026 to 2036)

Western Europe

United Kingdom and German institutions anchor regional spending, pursuing digital education modernization supported by national government funding programs targeting both higher education and vocational training technology adoption. France's education system maintains a distinctive centralized procurement approach that shapes vendor sales strategies differently than the more decentralized institutional buying patterns common across the United Kingdom and Germany. Nordic countries generally lead the region's artificial intelligence tutoring adoption maturity, often cited as a benchmark for peers pursuing comparable modernization programs. Spain and Italy are pursuing comparable but smaller-scale modernization programs, generally following broader European Union digital education funding frameworks rather than independent approaches. Southern European markets continue narrowing this maturity gap gradually.
Share: 21% | CAGR: 7.5% (2026 to 2036)
Regional intelligence for 5 additional markets available in the complete report: East Asia, South Asia and Pacific, Latin America, Middle East and Africa, Eastern Europe. Contact sales@marketmindsadvisory.com.
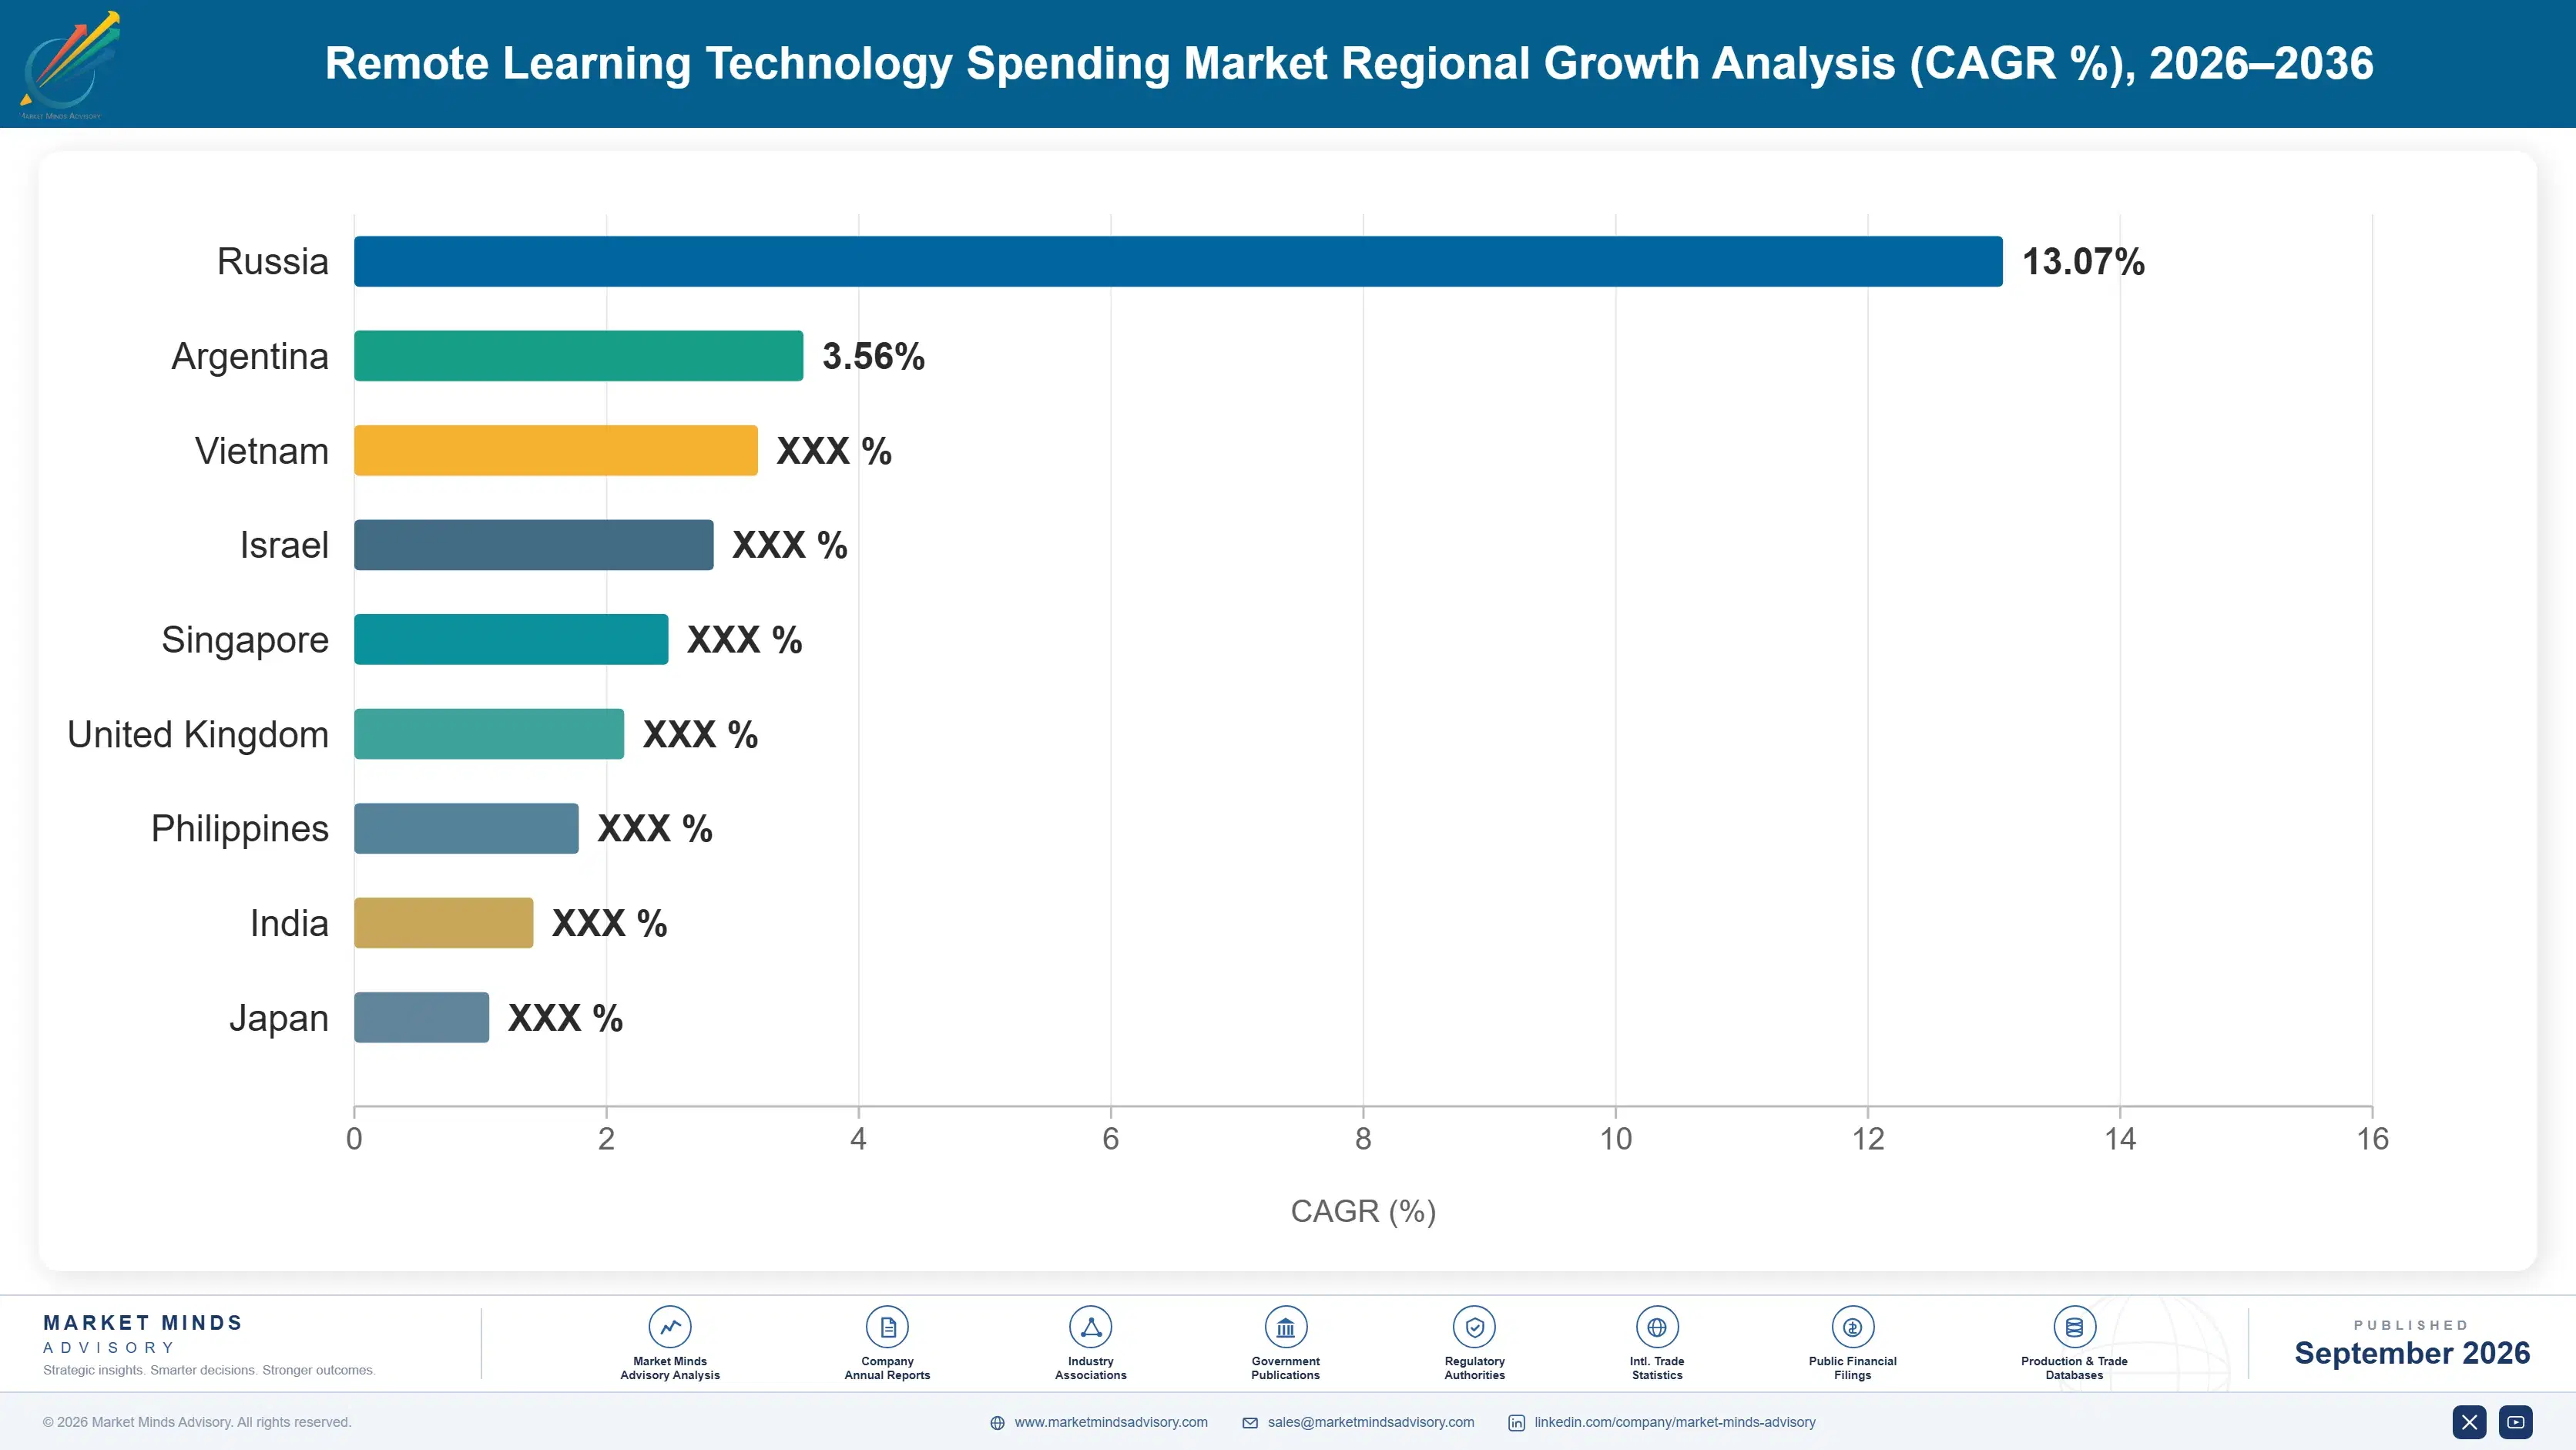
remote-learning-technology-spending-market-country-cagr-analysis-1790001829492

Where Vendors Capture Value Beyond Platform Licensing

Beyond initial platform licensing revenue, vendors are building recurring income through outcome-based pricing models, content marketplace revenue sharing, and professional services engagements that convert one-time contract sales into multi-year recurring vendor relationships worth considerably more over time. This pattern mirrors how enterprise software vendors monetize installed customer bases well after the initial contract closes.

Outcome-Based Pricing and Performance Contract Models

Vendors increasingly offer outcome-based pricing tied to measurable student completion rates or employee skill certification achievement, rather than charging a flat per-seat licensing fee regardless of actual learning outcomes achieved. This shift lets vendors capture premium pricing from institutions willing to pay more for demonstrated results, while also differentiating from competitors still selling purely on access and feature comparison alone. Vendors report outcome-based contracts now representing roughly 20% of new institutional deals, up meaningfully from negligible adoption just several years earlier. This shift also lets institutions align payment terms more closely with actual budget cycles tied to enrollment outcomes.
Market Impact: Lifts outcome-based contract share to roughly 20% overall

Content Marketplace and Third-Party Course Revenue Sharing

Vendors increasingly operate marketplaces where third-party content creators and subject matter experts sell courses and learning materials through the vendor's own platform, capturing revenue-sharing income from transactions that occur entirely within the vendor's distribution channel. This marketplace layer requires minimal incremental vendor investment once the underlying platform infrastructure exists, since third-party creators handle content development while the vendor facilitates discovery and payment processing. Vendors report marketplace transaction volume growing considerably faster than core platform licensing revenue across most major platforms currently operating this model. Marketplace revenue now represents roughly 15% of total contract value on platforms operating this model.
Market Impact: Adds roughly $2.1 million in average annual revenue

Professional Services and Implementation Consulting Revenue

Vendors increasingly offer dedicated implementation consulting and change management services for institutions consolidating fragmented technology stacks into integrated platforms, capturing services revenue that scales with the complexity of a given institutional deployment. This services layer helps institutions navigate the considerable organizational change required to shift faculty and administrative staff onto new platforms successfully, creating a durable advisory relationship beyond the initial software sale itself. Vendors report services attach rates growing considerably faster than core license revenue among institutions pursuing comprehensive platform consolidation projects. Institutions adopting these services report faculty adoption timelines shortening by roughly 30% relative to unassisted rollouts.
Market Impact: Expands services attach rate by roughly 32% overall

Analytics and Institutional Reporting Dashboard Subscriptions

Vendors increasingly license advanced analytics and reporting dashboards separately from core platform access, capturing incremental subscription revenue from institutions seeking detailed outcome data for accreditation reporting and internal decision-making purposes beyond basic usage statistics. This analytics layer typically carries considerably higher margins than core platform licensing alone, since it requires minimal incremental infrastructure cost once the underlying usage data is already being collected across the institution. Vendors report analytics subscription attach rates growing considerably faster than core platform license unit growth across most major institutional accounts. Analytics attach rates have risen roughly 27% among institutions pursuing accreditation reporting modernization.
Market Impact: Grows analytics subscription revenue by roughly 27% yearly

Who Controls the Margin Pool

Concentration is moderate at a CR5 of 34%, reflecting a fragmented vendor landscape spanning large productivity suite platforms, specialized learning management systems, and artificial intelligence tutoring challengers that together prevent any single vendor from dominating the broader category the way concentrated enterprise software markets sometimes do. No single vendor commands the overwhelming incumbency advantage that concentrated enterprise software markets sometimes exhibit among comparable technology categories.
Current competitive activity centers on three fronts: integrating artificial intelligence tutoring capability directly into existing learning management platforms, expanding corporate learning and development offerings to capture growing enterprise reskilling budgets, and consolidating fragmented point-tool functionality into broader integrated suites. Vendors increasingly compete on demonstrated outcome improvement rather than standalone feature comparison alone. Financing and bundling flexibility increasingly serve as a tiebreaker between comparable vendor proposals evaluated by budget-conscious institutions.

Emerging pressure comes from specialized artificial intelligence tutoring startups offering superior personalization capability within narrow categories, challenging broader platform incumbents on pure outcome performance even without comparable institutional relationship depth. Rankings could shift meaningfully if a major technology company enters education-specific artificial intelligence directly through acquisition, or if consolidation among smaller specialists concentrates competitive pressure among fewer, better-capitalized challengers.
remote-learning-technology-spending-market-company-positioning-matrix-1790001830461

Competitive Moat and Risk Dimensions

MICROSOFT

Moat: Existing Productivity Suite Integration

Microsoft's existing Teams and Office productivity suite relationships with institutions and enterprises give it natural entry points into education and training use cases without requiring entirely separate sales relationships. Its considerable artificial intelligence research investment also positions its education-specific tutoring capability favorably against smaller, less-resourced competitors.
MICROSOFT

Risk: Less Specialized for Deep Pedagogy

Microsoft's broad, productivity-focused positioning means its education-specific tools sometimes lack the deep pedagogical specialization that dedicated learning management vendors like Instructure offer for complex academic use cases requiring granular curriculum management. Institutions with highly specialized curriculum requirements may increasingly favor these more focused competitors instead of Microsoft's broader platform.
COURSERA

Moat: Established Content Partner Network

Coursera's deep relationships with major universities and corporate training content partners give it a content library breadth that newer entrants struggle to replicate quickly. Its established brand recognition among both institutional buyers and individual learners further reinforces its market position across both segments. This positioning has helped it retain enterprise customers even as competitors introduce comparable course delivery capability.
COURSERA

Risk: Limited Platform Breadth

Compared with broader productivity suite vendors like Microsoft or Google, Coursera's more narrowly focused content and course delivery platform leaves it more exposed if institutions increasingly prefer single-vendor relationships spanning a wider range of integrated technology categories. Institutions increasingly favor single-vendor relationships spanning learning management, tutoring, and analytics categories together.

Players Tracked

Prominent Players

Microsoft
Google
Zoom
Instructure
Coursera

Other Key Players

Blackboard (Anthology)
D2L
Pearson
Cengage
Udemy
Skillsoft
Cornerstone OnDemand
Docebo
TalentLMS (Epignosis)
Articulate
Examity
Age of Learning
Duolingo
Chegg
Adobe

Recent Developments

MARCH 2025

Microsoft Expands AI Tutoring Integration Within Teams for Education

Microsoft announced expanded artificial intelligence tutoring integration within its Teams for Education platform, allowing institutions to deploy personalized tutoring capability without adopting a separate standalone application. The update builds on earlier artificial intelligence features introduced across the broader Microsoft 365 suite. Financial terms of the expansion were not disclosed.
Signal: Existing productivity suite vendors continue extending artificial intelligence capability directly rather than ceding the category to specialists.
JULY 2025

Coursera Expands Corporate Reskilling Partnership Portfolio

Coursera announced expanded corporate reskilling partnerships with several major enterprise customers, providing customized skill certification pathways aligned with specific employer workforce development needs. The partnerships extend Coursera's existing enterprise learning platform relationships significantly. Deal terms and specific customer names were not publicly disclosed by either company involved.
Signal: Corporate reskilling partnerships continue validating enterprise demand as a durable growth category beyond traditional higher-education spending.
NOVEMBER 2025

Age of Learning Raises Funding for AI Adaptive Learning Expansion

Education technology company Age of Learning announced new funding directed toward expanding its artificial intelligence-powered adaptive learning platform, targeting broader kindergarten through twelfth-grade market adoption beyond its existing early-childhood education focus. The funding will support platform capability development. Terms of the funding round were not disclosed publicly.
Signal: Specialized adaptive learning challengers continue attracting investment across the broader specialist category on the strength of measurable outcome data.

Cloud Infrastructure and Content Development Cost Exposure

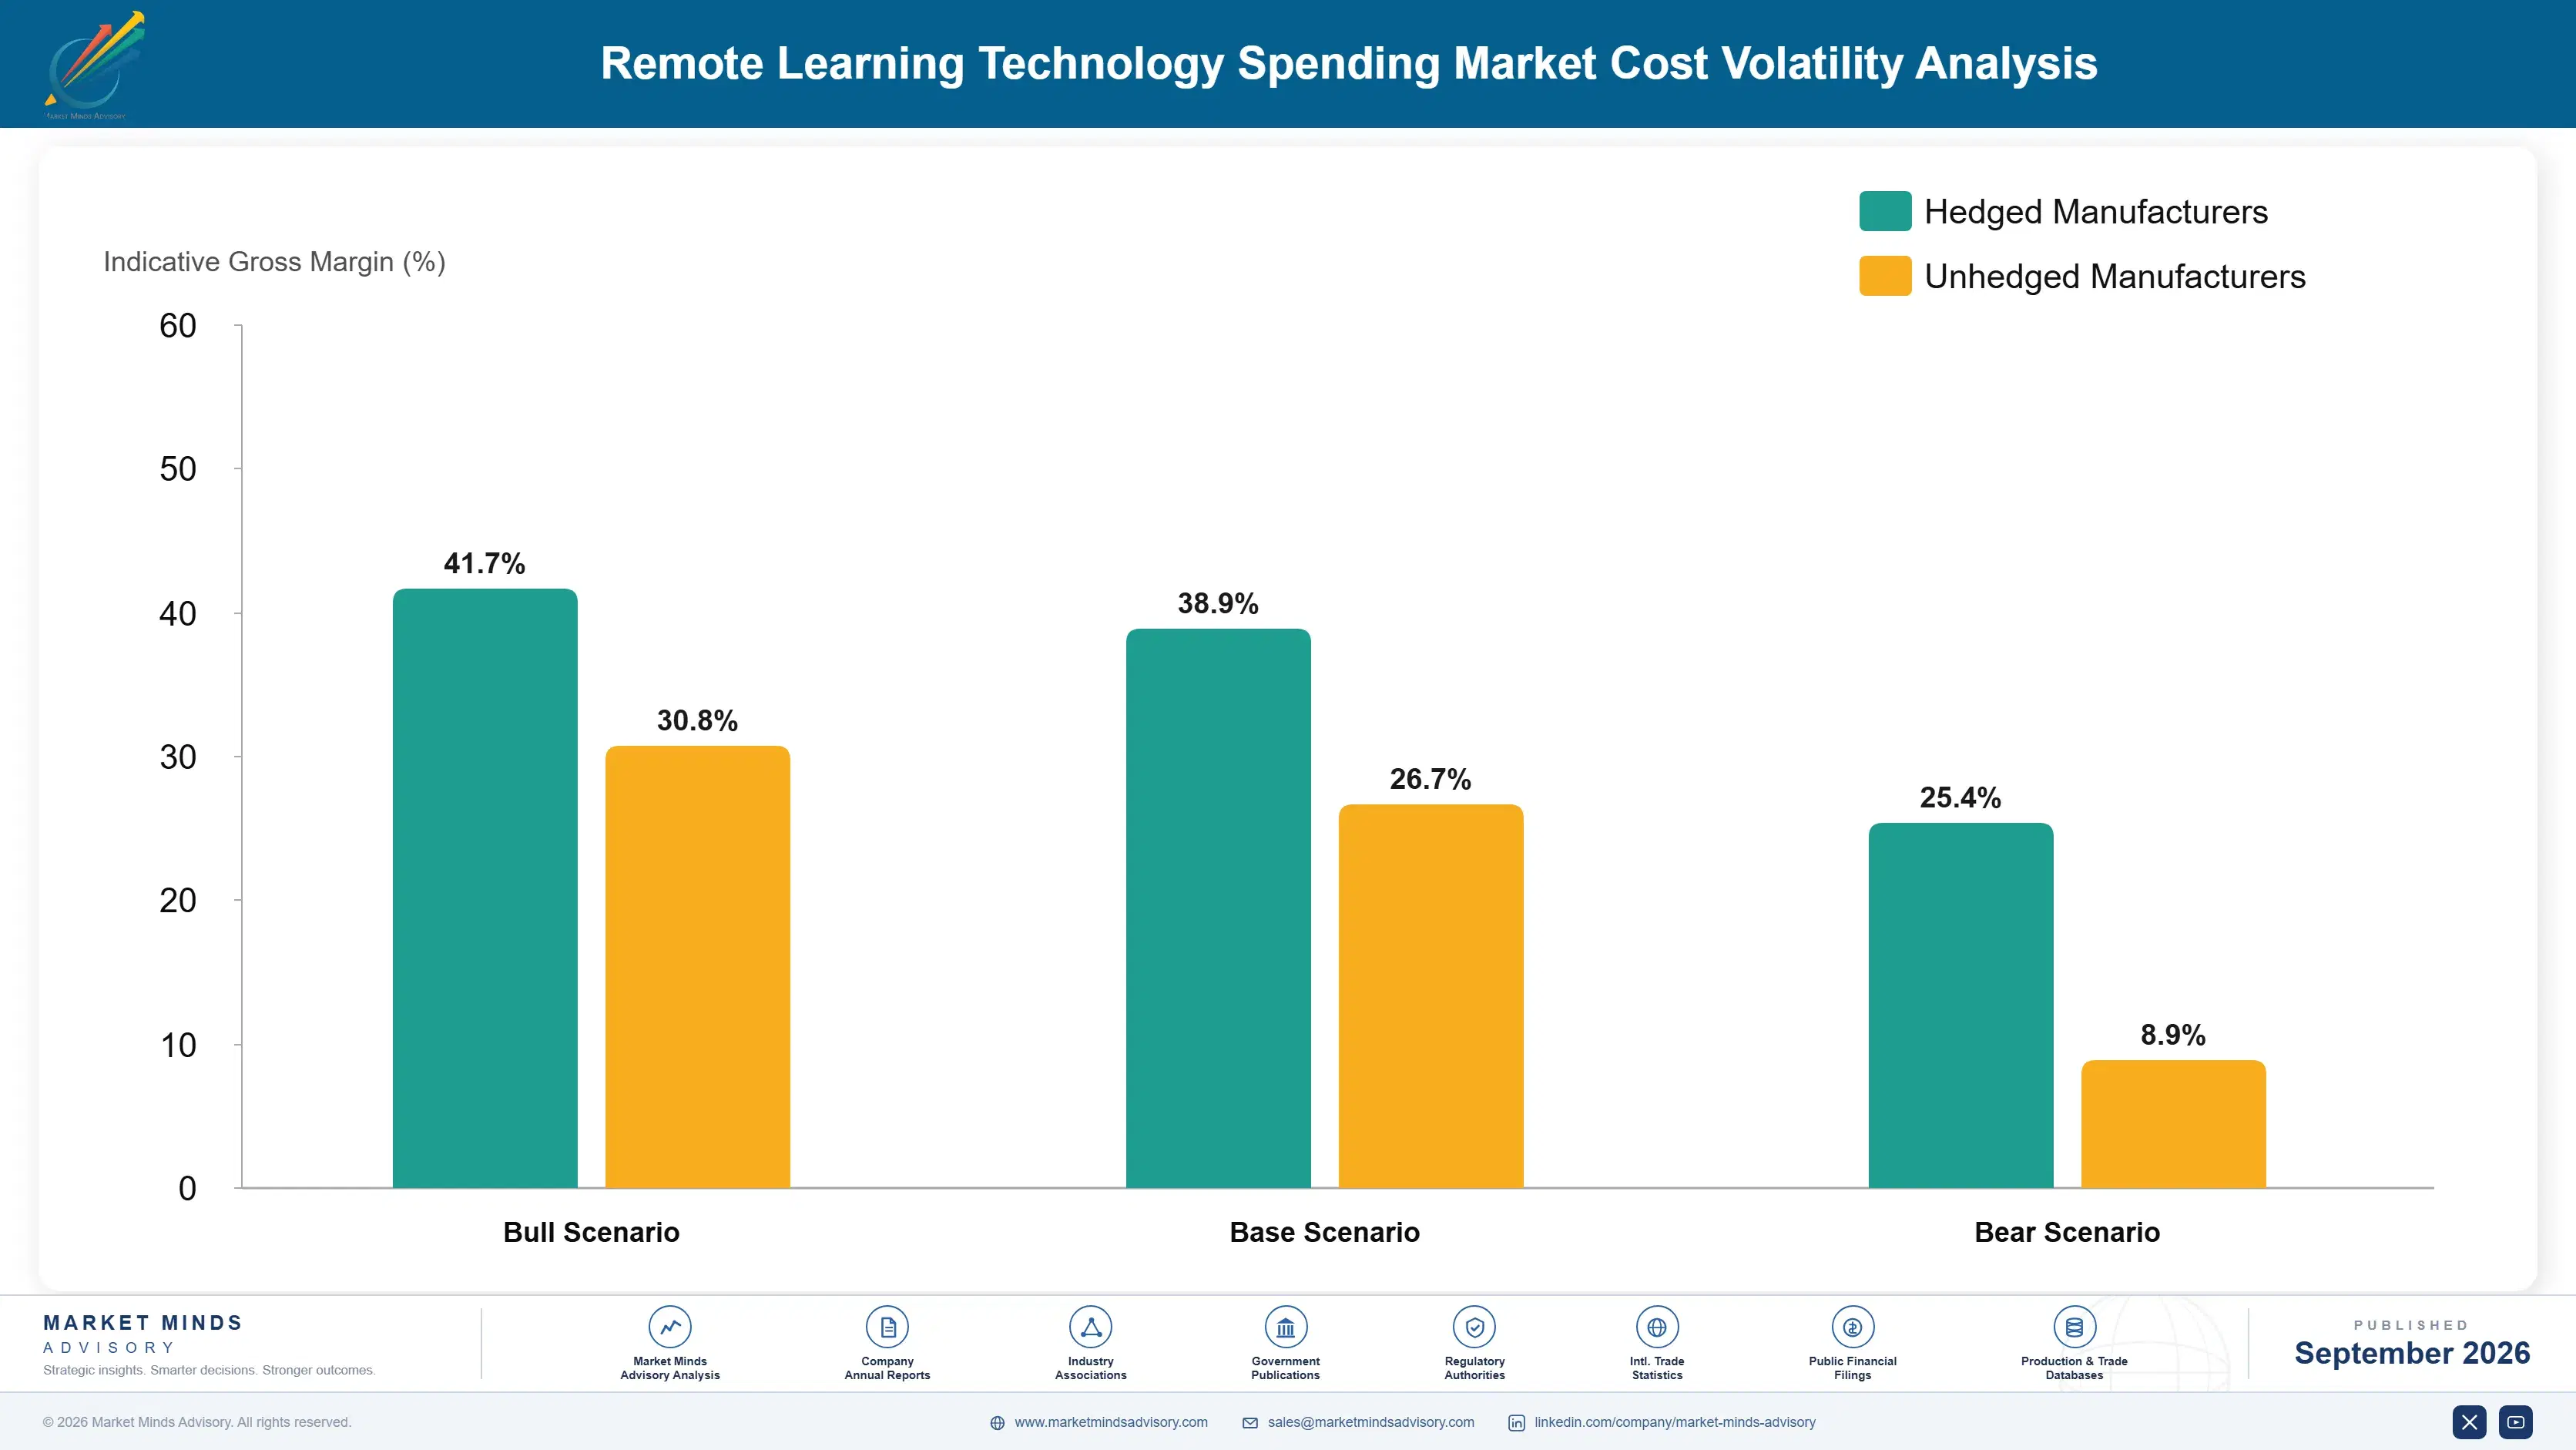
Cloud hosting infrastructure and content development, including video production and instructional design talent, together represent roughly 28% of unit cost of goods sold for vendors, with cloud computing costs sourced predominantly from major hyperscale providers concentrated in the United States and specialized instructional design talent drawn from a competitive, globally distributed talent pool. Vendors relying more heavily on standardized cloud infrastructure face a somewhat different exposure profile.
Cloud computing costs rose meaningfully during periods of elevated global demand for artificial intelligence compute capacity, with several vendor annual reports documenting elevated infrastructure costs during 2023 and 2024 as artificial intelligence tutoring platform training and inference workloads competed directly with other compute-intensive customer categories across shared hyperscale provider infrastructure. Vendors without pre-existing enterprise agreements experienced comparatively longer capacity delays than those holding standing contracts already in place.

Smaller specialized vendors carry disproportionately higher exposure since they lack the purchase volume to negotiate favorable long-term cloud infrastructure agreements the way large vendors like Microsoft or Google can. This dynamic compounds during periods of elevated artificial intelligence compute demand, since smaller vendors sit further back in capacity allocation queues behind larger customers holding standing enterprise agreements across multiple cloud infrastructure categories simultaneously.
remote-learning-technology-spending-market-cost-volatility-analysis-1790001830792

Multi-Cloud Infrastructure Deployment Flexibility

Vendors increasingly architect platforms to run across multiple cloud infrastructure providers, reducing dependency on any single provider's pricing and capacity decisions while maintaining service flexibility across institutional data residency requirements. Terms vary by provider considerably. Some vendors now formalize this into standing multi-provider deployment templates rather than one-off contract negotiations. Carrier customers increasingly favor this practice.

Long-Term Cloud Capacity Reservation Agreements

Larger vendors increasingly sign multi-year capacity reservation agreements with hyperscale cloud providers, trading pricing flexibility for guaranteed allocation priority during future periods of elevated artificial intelligence compute demand across the industry. These agreements typically span multiple years and include negotiated price ceilings tied to broader cloud market indices. Smaller vendors often cannot secure comparable terms.

Distributed Content Development Talent Sourcing

Vendors increasingly source instructional design and content development talent from a broader global talent pool beyond traditional technology hub cities, reducing cost pressure while maintaining content quality standards. This approach broadens the qualified candidate base considerably. This approach has expanded the qualified candidate pool considerably beyond traditional technology hub geographies. It also improves overall talent retention.

Portfolio Architecture for Margin Defence

The market organizes into three tiers reflecting institutional scale and revenue durability. Volume-tier standard per-seat licenses sold to smaller institutions and departments carry thinner margins driven by price competition among several similarly capable vendors, while premium integrated platforms bundled with artificial intelligence tutoring and analytics command considerably better economics for vendors positioned there. This tiering reflects both institutional scale and how much of a given contract's value is recurring rather than one-time.
Tension between commoditizing standard per-seat licensing and premium recurring outcome-based and analytics revenue defines vendor strategy today, as point-solution software vendors face continuous margin pressure while those successfully building subscription analytics and services revenue construct more durable, higher-margin recurring income streams over time. Vendors making this shift successfully report meaningfully steadier revenue than peers still dependent on lumpy license renewal cycles.

High-value pools concentrate in outcome-based pricing contracts, artificial intelligence tutoring subscriptions, and analytics dashboard licensing, where vendors capture recurring income well beyond the initial platform license transaction itself. Next-generation artificial intelligence-native tutoring platforms serving institutions pursuing comprehensive outcome measurement represent the newest and fastest-growing high-margin pool available to vendors currently. Vendors positioned early in outcome measurement capture the largest share of this expanding high-margin opportunity.

Volume / Commodity-Adjacent Tier

Standard per-seat licenses sold primarily on price to smaller institutions and departments with limited service bundling attached. Renewal rates here run considerably lower than premium tier relationships across comparable institution segments.
Gross Margin: 45%-55%

Premium / Certified Tier

Integrated platforms bundling learning management, content authoring, and analytics with multi-year contracts sold to large institution customers. Renewal rates on these bundled contracts run considerably higher than per-seat license relationships alone.
Gross Margin: 58%-66%

Sustainability / Regulatory / Next-Generation Tier

Artificial intelligence tutoring subscriptions, outcome-based pricing contracts, and analytics dashboards for institutions pursuing comprehensive outcome measurement currently underway. Margins benefit from limited direct competition and considerable specialized artificial intelligence engineering expertise required.
Gross Margin: 62%-70%
remote-learning-technology-spending-market-portfolio-architecture-1790001831648

High-value Sub-segments and Strategic Watch-out

AI Tutoring Subscription Revenue

Recurring artificial intelligence tutoring subscription revenue growing fastest as institutions seek measurable personalized instruction outcomes beyond baseline platform functionality. Margins remain attractive. Source: MMA Estimate, July 2026. Growth here outpaces every other tracked category. Adoption keeps rising quickly. Margins remain quite attractive. Vendor count here remains relatively small.
Gross Margin: 64%-72%

Corporate Learning Platform Subscriptions

Enterprise reskilling and workforce development subscription revenue growing steadily as automation reshapes required workforce skills across most major industries. Margins remain solid. Source: MMA Estimate, July 2026. Contract renewal rates remain notably strong. Adoption keeps accelerating steadily. Margins remain quite solid overall. Adoption keeps expanding across most industries.
Gross Margin: 56%-64%

Standard Per-Seat License Sales

The volume core of the market, sold primarily to smaller institutions where price competition among established vendors keeps margins comparatively thinner overall industry-wide. Pricing pressure persists across most competing vendor tiers. Vendor count here remains high. Competition stays intense here throughout. Vendor count here remains the highest overall.
Gross Margin: 46%-54%

Legacy Video Conferencing-Only Contracts

Declining pandemic-era standalone video conferencing contracts facing sustained pressure as institutions increasingly favor integrated platforms over single-function legacy tools. Vendors are exiting this category gradually over time. Decline pace varies by institution. Vendors with diversified portfolios face less exposure. Institutions phase these contracts out gradually.
Gross Margin: 30%-38%

Recurring Institutional Relationships Over Multi-Year Cycles

Demand increasingly behaves like an annuity rather than a one-time software purchase, since institutions require continuous platform updates, artificial intelligence model improvements, and technical support for the life of a multi-year contract that typically runs three to five years before a full technology stack review across an institution's entire portfolio. Vendors that let this relationship lapse risk losing the account at the next major technology stack review cycle.
Adoption depth varies meaningfully by institution type: large research universities and major enterprises tend toward comprehensive, integrated platform adoption once they commit to a vendor relationship, while smaller institutions and departments often adopt only core learning management functionality initially, adding artificial intelligence tutoring and analytics incrementally as budget allows over successive fiscal years. This uneven pattern means vendors must maintain both enterprise sales capability and incremental-adoption expertise.

Buyer profiles are shifting generationally as academic technology officers and workforce development specialists, rather than purely traditional information technology procurement staff, increasingly lead vendor selection decisions, favoring vendors who can demonstrate measurable outcome improvement rather than pure feature comparison sheets that procurement teams historically prioritized. Vendors slow to build this commercial fluency risk being sidelined in vendor selection conversations increasingly led by technology specialists.
remote-learning-technology-spending-market-end-use-penetration-index-1790001832552

Where MMA Sees the Real Opportunity

These are among the four positions where our research anticipates prominent divergence between winners and laggards over the coming forecast period. Each is grounded in the demand model, the regulatory perimeter, and the announced capacity pipeline.
01 / OUTCOME MEASUREMENT STRATEGY

Build demonstrated outcome data before competitors do

Vendors should prioritize building demonstrated learning and workforce outcome data now, since institutional and corporate buyers increasingly demand this evidence before renewing or expanding contracts. Vendors with credible outcome measurement capability can command premium pricing and win competitive tenders against vendors still selling primarily on feature comparison and access convenience alone. Vendors slow to build this evidence base risk losing renewal negotiations to competitors presenting a more compelling outcome-based value proposition, particularly to increasingly skeptical budget committees weighing multiple competing vendor proposals.
02 / AI TUTORING INVESTMENT

Accelerate artificial intelligence tutoring capability now

The vendors capturing the most durable new revenue are those investing in artificial intelligence tutoring capability now rather than waiting for competitive pressure to force reactive development later. Building this capability early positions vendors to capture premium subscription revenue as institutions increasingly prioritize personalized instruction outcomes over generic content delivery. Vendors without credible artificial intelligence roadmaps risk being perceived as legacy access tools rather than strategic learning outcome partners, a positioning gap that widens further with every renewal cycle that passes.
03 / PLATFORM CONSOLIDATION FOCUS

Position as the integrated consolidation platform choice

Vendors should position their platforms as the natural consolidation choice for institutions managing fragmented, pandemic-era point-tool technology stacks accumulated during rapid emergency adoption. This consolidation positioning considerably improves customer lifetime value and provides more predictable, higher-margin recurring income than competing purely on individual point-tool feature comparison. Vendors slow to build this broader platform narrative risk ceding the most durable, comprehensive institutional relationships to more consolidation-focused competitors who gain meaningful lead time by building this narrative early rather than selling individual point tools separately.
04 / CORPORATE SEGMENT EXPANSION

Expand enterprise reskilling offerings more aggressively

Corporate reskilling budgets are expanding considerably faster than public institution technology spending, and vendors with credible enterprise-focused offerings stand to capture disproportionate share of this faster-growing, higher-margin buyer segment. This corporate expansion increasingly differentiates vendors beyond their traditional higher-education roots, particularly among enterprises evaluating which platform can demonstrate the deepest workforce reskilling outcome track record over the coming years. Vendors slow to build enterprise-focused capability risk ceding this faster-growing segment entirely to competitors already deeply embedded in corporate reskilling budgets.

Engagement Snapshot From the Field

A live engagement with an industry participant carrying material or product regulatory and market exposure ahead of a defining policy shift, showing how our research translates into a defensible multi-year portfolio strategy.
MARKET MINDS ADVISORY · CLIENT ENGAGEMENT SUMMARY
Remote Learning Technology Spending Producer Strategic Portfolio Review and Transition Roadmap 2026·Investment Scenario on Remote Learning Technology Spending Exposure Evaluation 2025-26
CLIENT PROFILE
The client is a regional public university system serving approximately 65,000 students across several campuses, operating a fragmented technology stack accumulated during pandemic-era emergency remote learning adoption that included numerous overlapping point tools purchased under considerable time pressure without a coordinated procurement strategy. System leadership had previously deferred technology consolidation for several years given other competing capital priorities.
STRATEGIC CHALLENGE
The university system needed to consolidate its fragmented technology stack into an integrated platform while demonstrating measurable improvement in student outcomes to a board of trustees increasingly skeptical of technology spending following several years of budget pressure and enrollment uncertainty across the broader system. Board members also required clear evidence of measurable improvement before approving any additional technology investment.
MMA APPROACH
MMA's team benchmarked integrated platform vendor options against the system's specific enrollment scale and existing faculty technology proficiency profile, evaluating both established platform vendors and newer artificial intelligence-native challengers. MMA modeled total cost of ownership across a five-year horizon and structured a phased consolidation and training plan aligned with the system's academic calendar.
KEY FINDINGS
  1. An integrated platform consolidation was projected to reduce total technology licensing cost by approximately 22% (client-reported, unverified by MMA) relative to the system's existing fragmented point-tool spending.
  2. Roughly 45% of faculty across the system required structured retraining to fully use the new integrated platform's artificial intelligence tutoring features effectively.
  3. A phased two-year consolidation plan, completed ahead of the system's original internal timeline projection, was expected to stay within the existing technology budget without additional board appropriation.
  4. System leadership had significantly underestimated how quickly, during the early months of rollout, artificial intelligence tutoring would generate measurable completion rate improvements.
CLIENT PROFILE
The client is a regional public university system serving approximately 65,000 students across several campuses, operating a fragmented technology stack accumulated during pandemic-era emergency remote learning adoption that included numerous overlapping point tools purchased under considerable time pressure without a coordinated procurement strategy. System leadership had previously deferred technology consolidation for several years given other competing capital priorities.
STRATEGIC CHALLENGE
The university system needed to consolidate its fragmented technology stack into an integrated platform while demonstrating measurable improvement in student outcomes to a board of trustees increasingly skeptical of technology spending following several years of budget pressure and enrollment uncertainty across the broader system. Board members also required clear evidence of measurable improvement before approving any additional technology investment.
MMA APPROACH
MMA's team benchmarked integrated platform vendor options against the system's specific enrollment scale and existing faculty technology proficiency profile, evaluating both established platform vendors and newer artificial intelligence-native challengers. MMA modeled total cost of ownership across a five-year horizon and structured a phased consolidation and training plan aligned with the system's academic calendar.
KEY FINDINGS
  1. An integrated platform consolidation was projected to reduce total technology licensing cost by approximately 22% (client-reported, unverified by MMA) relative to the system's existing fragmented point-tool spending.
  2. Roughly 45% of faculty across the system required structured retraining to fully use the new integrated platform's artificial intelligence tutoring features effectively.
  3. A phased two-year consolidation plan, completed ahead of the system's original internal timeline projection, was expected to stay within the existing technology budget without additional board appropriation.
  4. System leadership had significantly underestimated how quickly, during the early months of rollout, artificial intelligence tutoring would generate measurable completion rate improvements.
RECOMMENDED STRATEGY
Phase 1: Phase 1 (Months 1-6): Deploy the integrated platform across the system's largest campus, prioritizing departments with the highest existing technology fragmentation. Phase 2: Phase 2 (Months 7-16): Expand deployment system-wide, prioritizing structured faculty retraining alongside phased rollout scheduling., coordinating closely with department chairs on training schedules Phase 3: Phase 3 (Months 17-24): Transition to outcome-based contract terms tied to measurable student completion and retention rate improvements., while documenting lessons learned for future consolidation phases
OUTCOME
The university system approved the phased consolidation plan and began Phase 1 rollout in early 2026, with system-wide completion targeted for mid-2028 (client-reported, unverified by MMA). Projected annual technology cost savings were estimated at approximately $2.4 million (client-reported, unverified by MMA) once the full consolidated platform reaches operational status system-wide.

Frequently Asked Questions

Foundational context covering the market sizes, CAGR, scope, country, region and competition that inform every finding below. This section is provided to cover basics and most often pre-purchase conversations, answered from the MMA Primary Research Dataset.

What is the current size of the Remote Learning Technology Spending Market?

The global Remote Learning Technology Spending Market was valued at approximately $45.0 billion in 2025. Growth reflects both artificial intelligence tutoring adoption and expanding corporate reskilling budgets.

How large will the Remote Learning Technology Spending Market be by 2036?

MMA projects the market will reach approximately $116.13 billion by 2036, more than double its 2026 value. Artificial intelligence tutoring and corporate learning platforms both contribute meaningfully.

What is the CAGR for the Remote Learning Technology Spending Market 2026 to 2036?

The market is projected to grow at a 9.0% compound annual growth rate over the forecast period. This places it within the technology-enabled, transitioning growth band.

Which segment is growing fastest?

AI-Powered Tutoring and Adaptive Learning Platforms lead growth at a 16.0% CAGR. This is roughly 1.78 times the overall market growth rate across the forecast period.

Who are the major companies in the Remote Learning Technology Spending Market?

Leading companies include Microsoft, Google, Zoom, Instructure, and Coursera. Together these five hold an estimated 34% combined market presence, measured consistently on platform revenue as the evaluation basis.

Which country is growing fastest?

India leads global growth at an estimated 11.3% CAGR, as national digital education initiatives direct substantial funding toward public school and higher-education technology adoption nationwide.

Report Segmentation Architecture

The full report scope spans multiple orthogonal segmentation dimensions, with cross-tabulated demand data provided for each dimension pair. Coverage extends further to regional breakdowns, trend trajectories, and the competitive detail needed to support segment-level decision-making.

By Product Type

  • Learning Management System Platforms
  • Virtual Classroom and Video Conferencing Software
  • Content Authoring and Course Creation Tools
  • AI-Powered Tutoring and Adaptive Learning Platforms
  • Online Proctoring and Assessment Software
  • Corporate Learning and Development Platforms

By End-Use Industry

  • Higher Education
  • K-12 Education
  • Corporate and Enterprise
  • Government and Public Sector Training
  • Professional Certification Bodies

By Commercial Dimension

  • Platform Licensing
  • Outcome-Based Pricing Contracts
  • Content Marketplace Revenue Sharing
  • Professional Services and Consulting

By Region

  • North America
  • Western Europe
  • East Asia
  • South Asia and Pacific
  • Latin America
  • Middle East and Africa
  • Eastern Europe

Scope, Methodology, and Coverage

Every figure in this report is reproducible from documented input assumptions. The scope below maps the historical period, the forecast horizon, the segmentation dimensions, and the countries covered, alongside the underlying primary and qualitative methodology.
Historical Period
2020 to 2025
Forecast Period
2026 to 2036
Base Year
2025 (USD billions; MMA Primary Research Dataset, September 2026)
Market Definition
The market covers software and platform spending for learning management systems, virtual classroom tools, content authoring, artificial intelligence tutoring, online proctoring, and corporate learning and development used by educational institutions and enterprises. It excludes hardware devices, campus network infrastructure, and in-person classroom furniture or facilities spending.
Quantitative Units
USD billions (current prices); institutional license seat counts; platform adoption rates
Segmentation Dimensions
By Product Type; By End-Use Industry; By Commercial Dimension; By Region
Regions Covered
North America, Western Europe, East Asia, South Asia and Pacific, Latin America, Middle East and Africa, Eastern Europe
Countries Covered
USA, China, Germany, France, UK, Japan, South Korea, India, Australia, Canada, Brazil, Mexico, Indonesia, Vietnam, Thailand, Malaysia, UAE, Saudi Arabia, South Africa, Nigeria, Turkey, Poland, Netherlands, Italy, Spain, Sweden, Switzerland, Argentina, Colombia, Singapore, and additional markets relevant to this sector
Key Companies Profiled
Microsoft, Google, Zoom, Instructure, Coursera, Blackboard (Anthology), D2L, Pearson, Cengage, Udemy, Skillsoft, Cornerstone OnDemand, Docebo, TalentLMS (Epignosis), Articulate, Examity, Age of Learning, Duolingo, Chegg, Adobe
Quantitative Methodology
Primary survey, n=3,800 respondents, Q4 2025, six countries; demand-side model with trade association cross-validation
Qualitative Methodology
47 expert interviews, Q4 2025; applied to validate demand model assumptions, identify emerging dynamics, and assess competitive positioning
Report Format
PDF and XLSX data workbook (Word format preview document)
Publisher
Market Minds Advisory
Report Code
MMA-2026-TEC-235
Published
September 2026
Contact
sales@marketmindsadvisory.com | www.marketmindsadvisory.com

Purchase the full Remote Learning Technology Spending Market Report (2026 to 2036).

The full report provides detailed market sizing, ten-year forecasts, and competitive benchmarking across the remote learning technology spending category worldwide. It includes country-level institutional funding tracking, vendor outcome measurement capability comparisons, and segment-level growth analysis across learning management, tutoring, and corporate development tool categories. Buyers receive access to MMA's proprietary institutional adoption tracker updated quarterly throughout the subscription period. The report also includes detailed input-cost analysis for cloud infrastructure and content development talent sourcing. Subscribers can request a customized briefing call to discuss findings relevant to their specific investment or procurement questions.
Country-level institutional funding tracking dashboard updates
Vendor outcome measurement capability scorecards included
Segment-level ten-year growth forecasts by category
Competitive benchmarking covering every profiled vendor
Institutional adoption tracker updated each quarter
Input-cost and talent supply risk analysis included

Built For The People Who Decide

From boardroom strategy to bench-side execution, this report is read cover-to-cover by leaders shaping the next decade of their industry, turning demand scenarios, market dynamics and valuation benchmarks into decisions.
CXOs/ Presidents/ VPs/ Managers
M&A and Corporate Development
Strategy Teams and R&D Heads
Procurement and Product Directors
Regulatory and Compliance Leaders
Investor Relations and Equity Analysts