Market Minds Advisory
Regenerative Medicine Market

Regenerative Medicine Market: Selling A Cure Into Systems Built For Chronic Treatment

A one-time therapy delivers value across decades and demands payment on the day it is given. Every payment system in healthcare was designed for the opposite, and that mismatch limits uptake more than science does.

Lead Analyst

Alice Ballenger

Published

September 2026

Make Smarter Decisions with Customized Research Insights

Request a free sample report and evaluate market opportunities, growth trends, and competitive dynamics relevant to your business needs.

2025 MARKET VALUE$38.0BMarket Size 2025
2036 FORECAST VALUE$166.9BBase Case , 2026 to 2036
CAGR 2026 TO 203614.4 %Bull 15.7% / Bear 13.1%
INCREMENTAL OPPORTUNITY$123.4BNet 10- year value creation
EXPANSION MULTIPLE3.84x2036 value over 2026 base
Strategic Levers
M&A Pipeline
Regional Outlook
Country Rankings
Competitive Intelligence
Segmental Deep-dive
Call-Us : 91 93563 13602

Executive Snapshot and Market Trajectory

The binding constraint here has never been the science. A one-time therapy priced near USD 2.8 million delivers benefit across decades and demands payment on the day of administration, from a payer who may not hold that member in five years. Nothing in healthcare finance was built for it.
The market reaches USD 38.0 billion in 2025 and compounds at 14.4% to USD 166.91 billion by 2036, an expansion multiple of 3.84 times. In vivo gene therapy grows fastest at 21.6%, exactly 1.50 times the market rate, precisely because it escapes the bespoke per-patient manufacturing that limits everything else. North America holds 34% of value, above the band this framework applies, on pricing and approval sequence.
Concentration is low at 31% across the top five, since cell therapy, gene therapy, tissue engineering, and orthobiologics barely compete with one another at all. Manufacturing remains the unsolved problem: autologous products take around 24 days from collection to infusion and roughly 6% of runs never yield a usable product at all, Allogeneic and in vivo approaches exist largely to escape exactly that constraint, and their economics improve by an order of magnitude.
Market Definition
The regenerative medicine market covers therapies and products that repair, replace, or restore biological function, spanning in vivo gene therapy, ex vivo engineered cell therapy, induced pluripotent and allogeneic cell products, tissue-engineered products and scaffolds, orthobiologics and regenerative biomaterials, and non-engineered cell preparations. Contract development and manufacturing services sold separately, research reagents and laboratory equipment, conventional biologics and small molecules, organ transplantation, and cosmetic aesthetic procedures using autologous material are excluded.
Base Year Value
$38.0B in 2025 (MMA Primary Research Dataset, August 2026)
Forecast Period
2026 to 2036, eleven discrete annual values
CAGR
14.4% base case. Bull 15.7%. Bear 13.1%.
Fastest Growth Segment
In Vivo Gene Therapy: 21.6% CAGR
Fastest Growth Country
China: 18.4% CAGR
Fastest Growth Region
South Asia and Pacific: 16.6% CAGR
Largest Region
North America: 34% of 2025 global value
Market Leaders
Novartis, Vertex Pharmaceuticals, Gilead Sciences, Bristol Myers Squibb, Organogenesis. Source: MMA Primary Research Dataset, July 2026.
Primary Survey
n=3,800 procurement and R&D decision-makers, Q4 2025, six countries
Methodology
Demand-side build-up, cross-validated against public data, 47 expert interviews

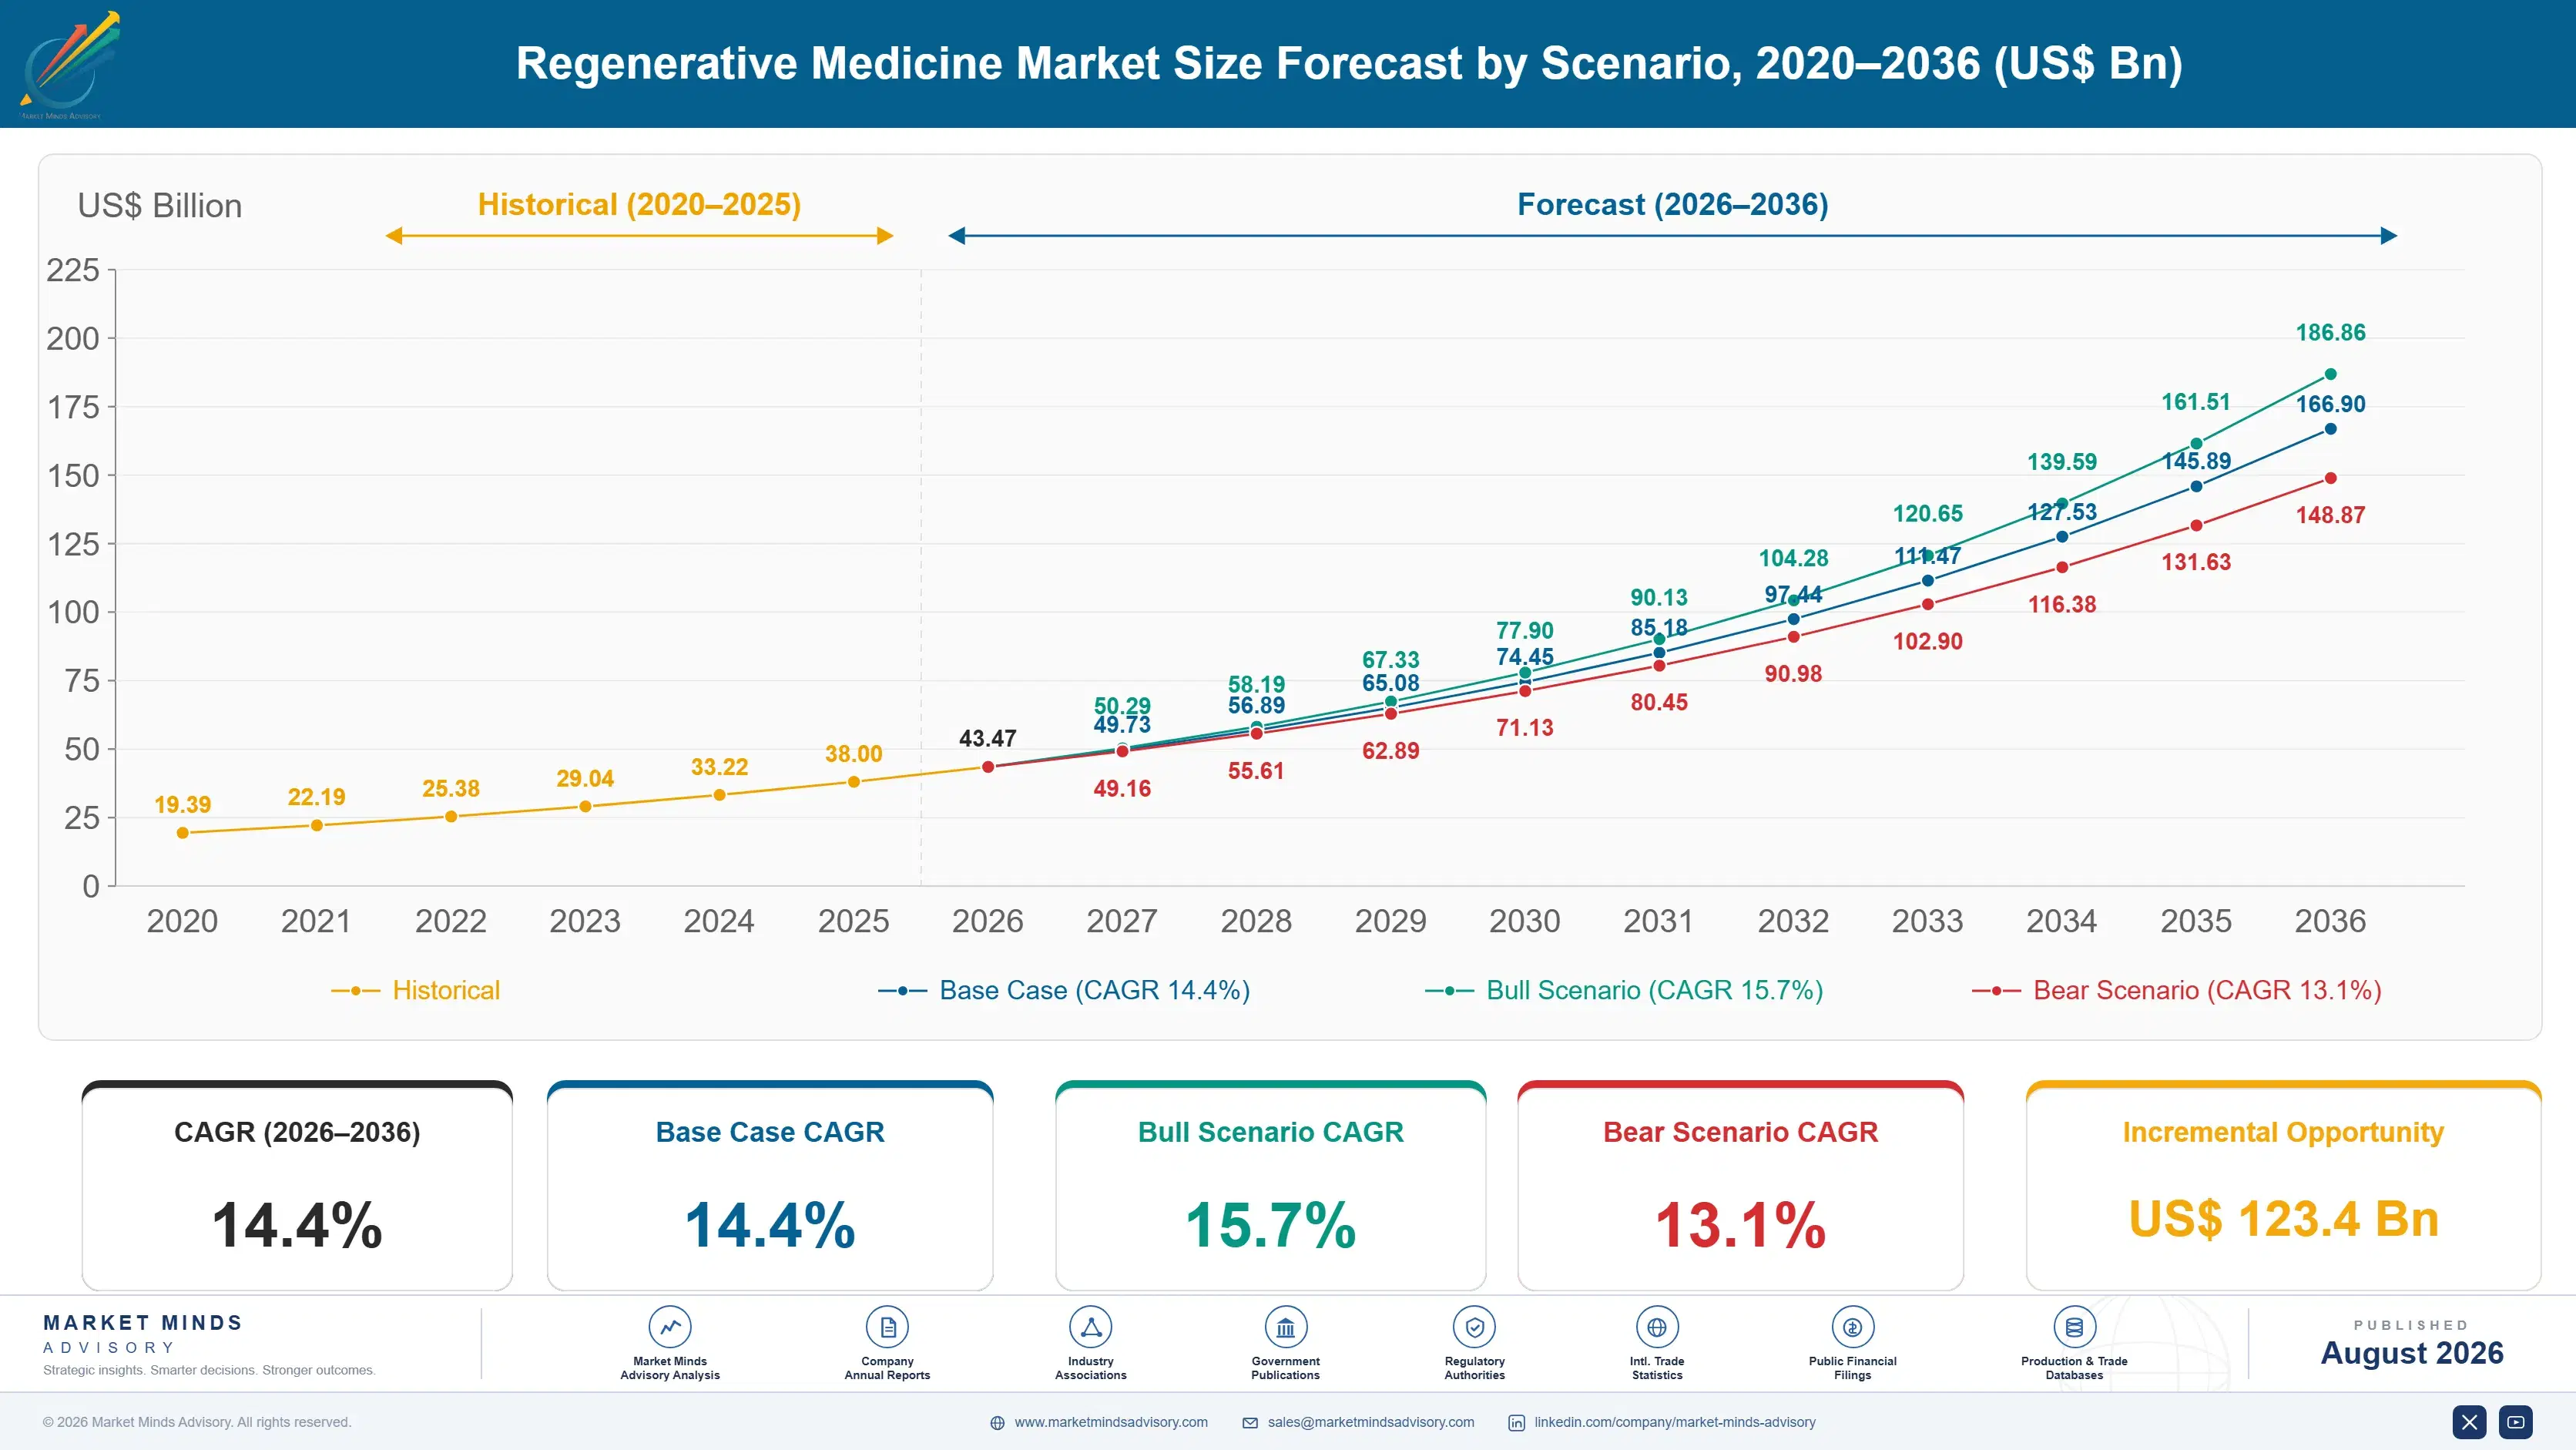
Regenerative Medicine Market Forecast Scenarios

regenerative-medicine-market-size-forecast-scenario-1787298734081
The 2020 to 2025 period delivered approvals faster than health systems could absorb them. Gene therapies for haemophilia, sickle cell disease, and inherited retinal and neuromuscular conditions all reached market, and several launched into payer environments with no mechanism for paying millions upfront. Uptake consistently lagged eligibility. A 13.2% historical CAGR reflects strong approval momentum meeting reimbursement structures that were never designed for one-time cures.
Three mechanisms carry the 14.4% base case. In vivo gene therapy is the largest, since delivering a construct directly avoids the bespoke per-patient manufacturing that caps autologous throughput. Outcomes-based and instalment payment agreements are the second, slowly reconciling one-time therapy with annual payer budgets. And Asian regulatory pathways are the third, where conditional approval in Japan and rapid Chinese development bring products to patients sooner and at far lower prices.
The 15.7% bull case rests on annuity and outcomes-based payment models becoming standard rather than exceptional, which would remove the budget shock that currently gates adoption regardless of clinical enthusiasm. The 13.1% bear case is manufacturing capacity and cost failing to improve, since a therapy that cannot be produced reliably at acceptable cost will not reach the eligible population however compelling its trial data looks.

A Cure Meets An Annual Budget

Healthcare finance is built around spreading cost across years of chronic treatment, and regenerative medicine inverts that completely. A single administration priced near USD 2.8 million delivers benefit over a lifetime and lands entirely in one annual budget, held by a payer who cannot be certain of retaining that member long enough to see the saving. Clinical enthusiasm has rarely been the obstacle to uptake.
TOP FIVE CONCENTRATION31%Fragmented across modalities that barely compete with each other
ONE-TIME THERAPY PRICEUSD 2.8 millionList cost of a single administration for an inherited condition
VEIN-TO-VEIN TIME24 daysInterval from patient collection to infusion of the product
MANUFACTURING FAILURE RATE6%Share of autologous runs never reaching a usable product
OUTCOMES AGREEMENT COVERAGE34%Portion of launches carrying payment tied to patient response
QUALIFIED TREATMENT CENTRES1,400Sites worldwide able to administer these therapies safely
Manufacturing is the second unsolved problem and it is more prosaic. An autologous therapy requires a bespoke production run for each patient, taking around 24 days from collection to infusion, with roughly 6% of runs failing to yield a usable product at all. A patient with aggressive disease may not have 24 days. In vivo and allogeneic approaches exist largely to escape that constraint, which is exactly why they grow fastest.
The market is also far less consolidated than its reputation suggests. Cell therapy, gene therapy, tissue engineering, and orthobiologics share a category label and almost nothing else: different manufacturing, different regulators, different buyers, different economics. A top five holding 31% reflects a set of adjacent businesses rather than a single competitive arena, and analysis treating them as one usually misleads.
"Every company in this field can tell you their durability data. Almost none can tell you how a payer with a two percent annual member turnover is supposed to justify paying three million dollars for a benefit that arrives in year seven."
Director, Advanced Therapies And Cell Manufacturing Practice · MMA Healthcare Pr

Market Trends

In Vivo Delivery Escapes Per-Patient Manufacturing Entirely

Autologous therapies require an individual manufacturing run for every patient, which caps throughput, adds around 24 days of vein-to-vein time, and carries a failure rate near 6% that nobody has eliminated. Delivering a genetic construct directly into the patient removes all of it: the product becomes a batch-manufactured biologic administered like any other infusion. That single change transforms cost, capacity, and treatment centre requirements simultaneously, which is why in vivo approaches attract disproportionate development investment across almost every indication, Vector supply capacity rather than the underlying science is the practical constraint now.
Market Impact: Reaches patients 3 years earlier
Payment Structure Becomes The Real Product Innovation

Outcomes-based agreements, instalment payments spread across years, and warranty structures returning money if benefit fails now accompany roughly 34% of launches, up from almost none five years ago. These are financial products rather than clinical ones and they determine uptake more reliably than efficacy data does. Payers facing a multi-million dollar single payment need a mechanism that matches the cash flow to the benefit, and companies arriving without one find eligible patients going untreated for months, Companies arriving without one find eligible patients untreated for a year or more, however good the trial data reads.
Market Impact: Removes 6% manufacturing failure rate

Market Opportunities and Growth Drivers

Asian Conditional Approval Pathways Reach Patients Sooner

Japan's regenerative medicine framework allows conditional time-limited approval on demonstrated safety and probable benefit, with full approval following real-world evidence, which brings products to patients years earlier than conventional pathways permit. Korean and Chinese frameworks have adopted broadly similar logic. That changes where developers file first and where early revenue accumulates, and it has drawn substantial Western sponsor activity toward the region for exactly that reason, Real-world evidence gathered under those approvals then supports later Western submissions, which is a considerable secondary benefit, and shortens the whole global sequence, Filing sequence has changed for several Western developers as a result.
Market Impact: Single payment reaches USD 2.8 million

Allogeneic Products Remove The Bespoke Manufacturing Cap

Off-the-shelf cell products manufactured in batches from donor or induced pluripotent sources can be stored, shipped, and administered without any patient-specific production run at all. That removes the 24-day vein-to-vein delay, the 6% manufacturing failure rate, and the throughput ceiling that limits how many patients an autologous programme can serve. Persistence and immune rejection remain genuine scientific challenges, and the commercial pull toward solving them is enormous because the economics improve by an order of magnitude, Storage and shipment work exactly as they do for any conventional biologic product, which changes treatment centre requirements entirely.
Market Impact: 6% of runs fail outright

Market Restraints and Challenges

Payers Cannot Absorb Multi-Million Single Payments

A therapy priced near USD 2.8 million delivers decades of benefit and demands the entire payment in one budget year, from an organisation whose members change and whose budgets are set annually. The root cause is that healthcare financing evolved around chronic treatment spread over time. Commercially this leaves eligible patients untreated regardless of clinical consensus. Participants are mitigating through instalment and outcomes-based agreements, through reinsurance pools covering high-cost single events, and through national funding mechanisms carved out from routine budgets, Clinical consensus has rarely been the obstacle in any of these negotiations.
Market Impact: Removes 24 days of delay

Autologous Manufacturing Caps Throughput And Adds Risk

Every autologous patient needs an individual production run taking around 24 days, with roughly 6% failing to produce a usable product and no simple recovery when that happens. The root cause is that the patient's own cells are the starting material, which cannot be pooled, banked, or manufactured ahead of demand. Commercially this limits how many patients a programme can treat regardless of eligibility. Mitigation runs toward allogeneic and in vivo approaches, toward automated closed manufacturing systems, and toward decentralised production closer to treatment centres, A patient with aggressive disease may simply not have twenty-four days available.
Market Impact: Structures cover 34% of launches
3 additional market trends, 4 additional growth drivers, and 2 additional restraints and challenges are covered in the full report. Contact sales@marketmindsadvisory.com to access the complete intelligence.

Segment CAGR and Growth Architecture

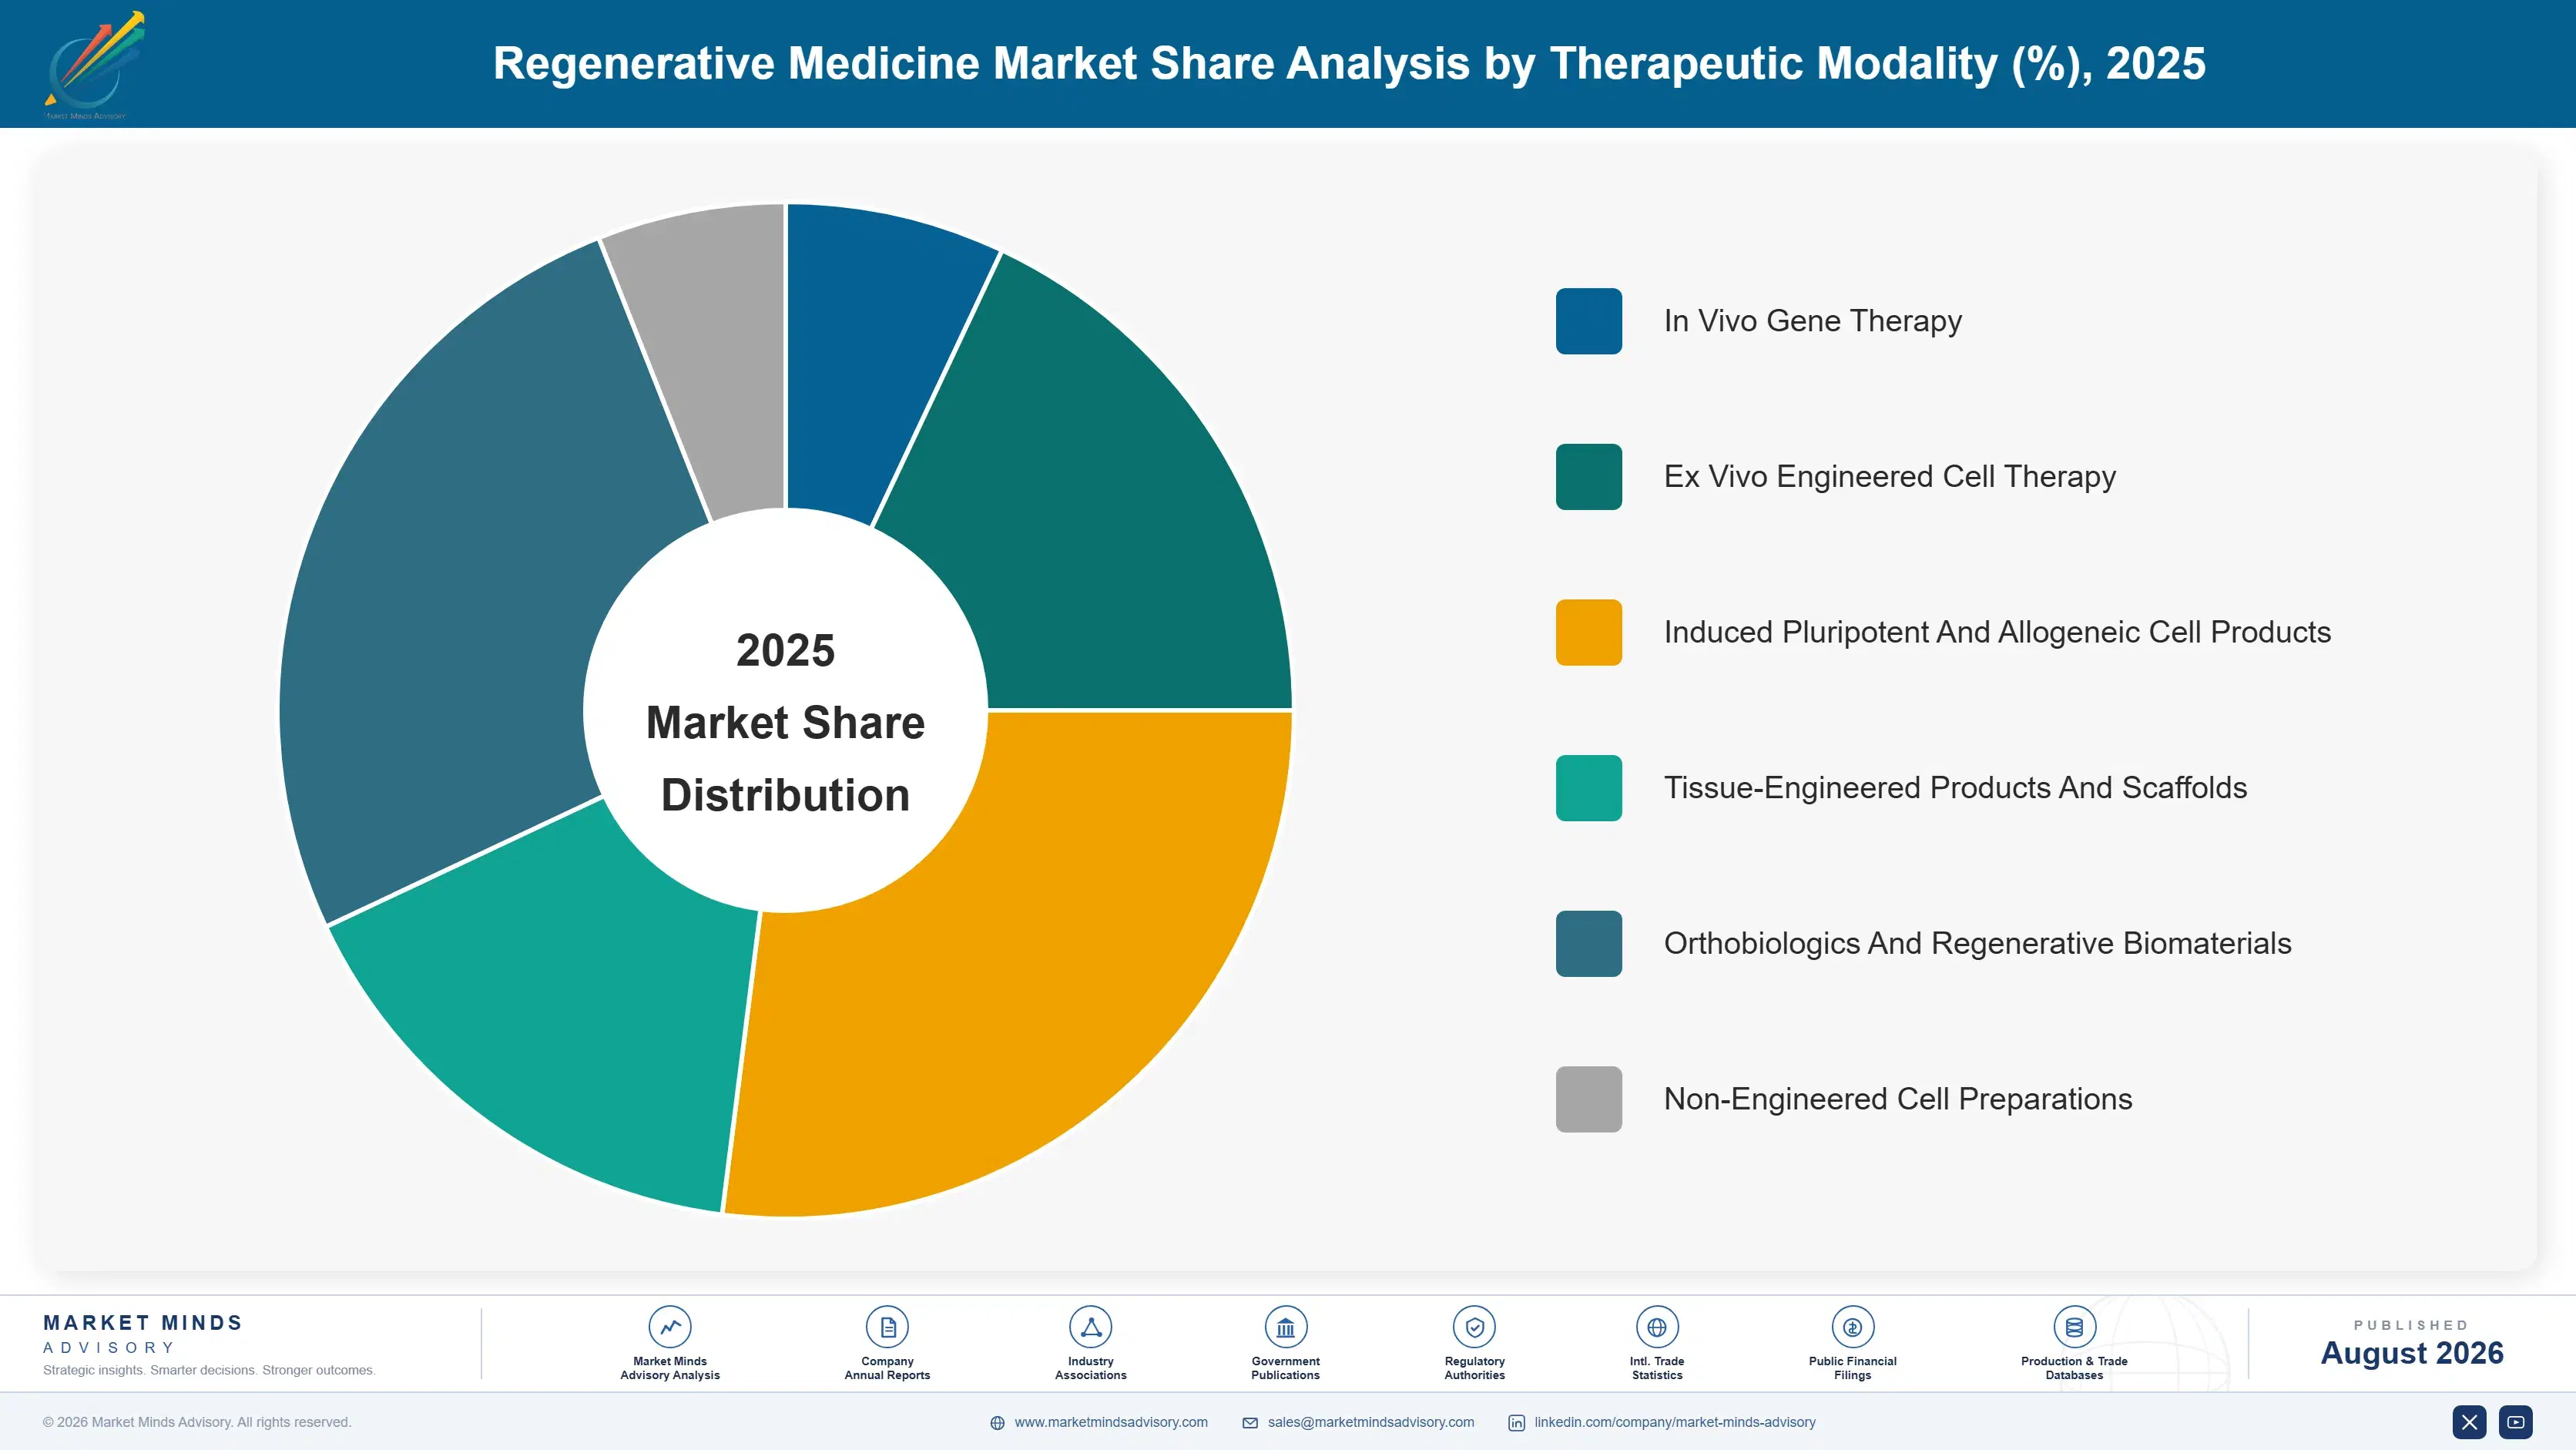
Segmentation follows the therapeutic modality, because modality determines how a product is manufactured, whether it can be made ahead of demand, which regulator reviews it, and what a payer is being asked to fund. Indication, care setting, and payment route sit in the framework instead, and none of those three changes how a product is physically manufactured.
regenerative-medicine-market-market-share-analysis-1787298734620

In Vivo Gene Therapy

In vivo gene therapy grows fastest at 21.6%, exactly 1.50 times the market rate, delivering a genetic construct directly into the patient rather than manufacturing anything from their own cells. That converts an individually produced therapy into a batch-manufactured biologic administered like any other infusion, removing vein-to-vein delay, per-patient failure risk, and the throughput ceiling all at once. Adeno-associated viral vectors carry most current volume with lipid nanoparticle and other delivery approaches advancing. Manufacturing scale-up and immunogenicity remain the genuine constraints rather than anything about the underlying concept, Treatment centre requirements also fall away, since administration resembles any other infusion, which widens the deliverable population considerably, Cost of goods improves by an order of magnitude at commercial scale.
CAGR 21.6%

Ex Vivo Engineered Cell Therapy

Ex vivo engineered cell therapy grows at 18.2%, covering chimeric antigen receptor products and gene-modified stem cell approaches where a patient's cells are collected, modified, expanded, and returned. Clinical results in haematological malignancy and inherited haemoglobin disorders have been genuinely transformative, which is why the modality attracts the investment it does. The commercial limitation is entirely operational: around 24 days of vein-to-vein time, a 6% manufacturing failure rate, and a hard cap on how many patients any facility can serve at once, Clean room occupancy consumed per patient cannot be spread across volume in any way, which caps cost of goods permanently, Automation and closed processing help at the margin without changing the ceiling.
CAGR 18.2%
Full segment breakdown across 6 segments available in the complete report.

Regional Architecture and Country Demand Map

Regional shares here track approval sequence, treatment centre capability, and what each health system will actually pay for a single administration. Disease prevalence barely features at all, and treatment centre numbers alone predict very little, which makes the table below worth reading rather closely indeed.

North America

North America holds 34% of value against a 32% ceiling in this framework, and pricing plus approval sequence rather than patient numbers explains the breach. Therapies routinely launch here first at prices no other market approaches, and the qualified treatment centre network is the densest anywhere. Commercial payers have experimented furthest with outcomes-based and instalment agreements, though coverage remains inconsistent across plans. Orthobiologics and tissue-engineered products also carry substantial volume outside the advanced therapy conversation entirely. Growth at 13.6% trails the global rate on an already large and maturing base, Vector manufacturing capacity is also concentrated here more than anywhere else, which shapes where programmes can realistically scale, and reimbursement remains inconsistent between plans.
Share: 34% | CAGR: 13.6% (2026 to 2036)

East Asia

Twenty-five percent of value sits in East Asia, and regulatory structure rather than market size explains why it sits so high. Japan's regenerative medicine framework permits conditional time-limited approval on safety and probable benefit, bringing products to patients years before conventional pathways would, and Korea operates comparable logic. Chinese cell therapy development is enormous in volume, with domestic chimeric antigen receptor products approved and priced far below Western equivalents. Growth at 15.6% exceeds the global rate on Chinese approvals and Japanese conditional pathway activity together, Treatment centre networks in Japan and Korea are well organised and nationally coordinated, and capacity is not the binding constraint, Pricing across Chinese products sits far below any Western equivalent.
Share: 25% | CAGR: 15.6% (2026 to 2036)
Regional intelligence for 5 additional markets available in the complete report: Western Europe, South Asia and Pacific, Latin America, Middle East and Africa, Eastern Europe. Contact sales@marketmindsadvisory.com.
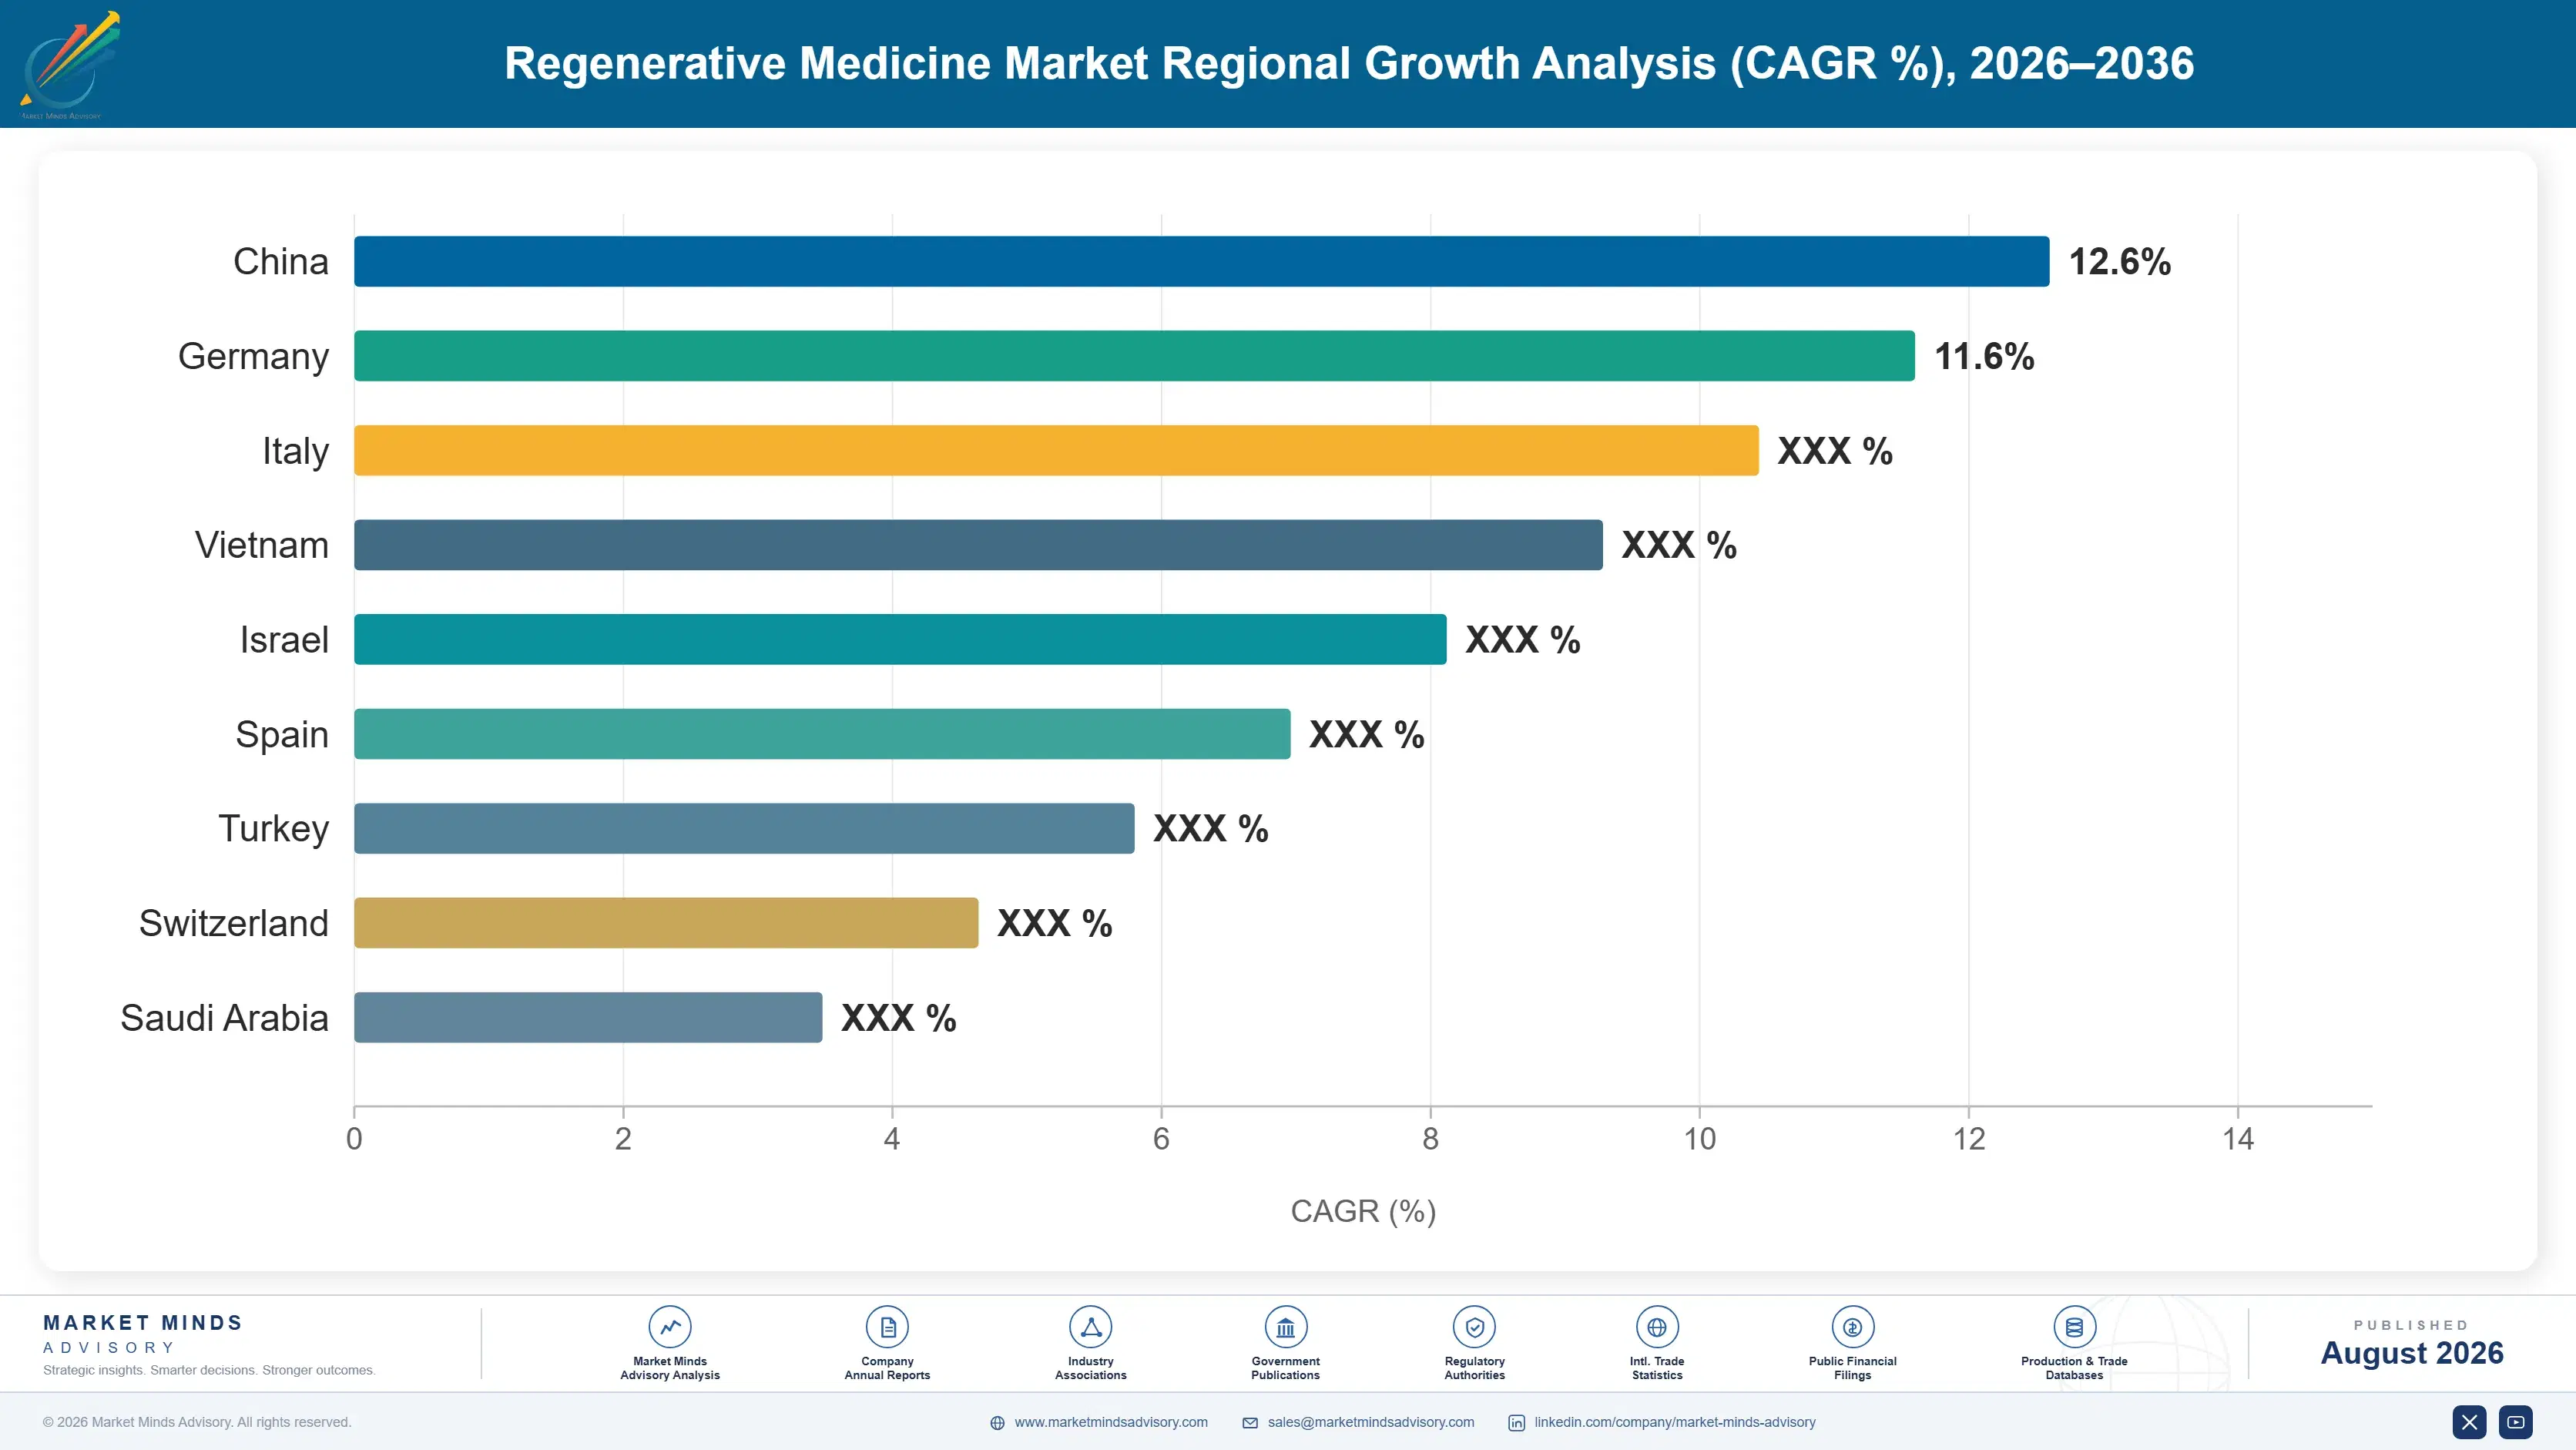
regenerative-medicine-market-country-cagr-analysis-1787298735136

Making An Expensive Cure Payable

Approval is no longer the hard part in this field and reimbursement structure is. Payment engineering, manufacturing escape, durability evidence, and conditional pathway sequencing each address what actually gates uptake. Four levers follow, and the first is worth more than any incremental efficacy improvement a development programme could deliver, and it sits almost entirely outside the clinical organisation.

Design The Payment Model Before The Launch Plan

A payer asked for USD 2.8 million in a single budget year cannot say yes easily however good the data is, and roughly 34% of launches now carry outcomes-based or instalment structures because the alternative is eligible patients going untreated. Building the payment architecture during phase three rather than after approval shortens time to first reimbursed patient by nine to fifteen months. That is the single largest commercial variable in this entire field and it sits outside the clinical organisation, Comparator launches without one have reached first reimbursed patient around 19 months after approval.
Market Impact: Shortens access by 9 to 15 months typically

Escape Per-Patient Manufacturing Wherever Biology Allows

Autologous production caps throughput absolutely, adds around 24 days of vein-to-vein time, and fails outright on roughly 6% of runs with no straightforward recovery. Allogeneic and in vivo approaches remove all three constraints simultaneously and improve cost of goods by an order of magnitude at scale. Development programmes choosing autologous routes for scientific convenience rather than necessity are accepting a permanent commercial ceiling that no amount of process improvement later will lift, Clean room occupancy consumed per patient simply cannot be spread across any volume, which is why the ceiling is permanent.
Market Impact: Cuts cost of goods by around 10 times

Treat Long-Term Registries As Commercial Infrastructure

Payers funding a cure need evidence the effect persists, and durability data accumulates only with time and systematic follow-up. Registries capturing outcomes across several years cost USD 3 million to USD 9 million and convert conditional or restricted reimbursement into routine funding. They also underpin the outcomes-based agreements that make payment feasible in the first place, which means the same investment serves both the evidence and the financing problem simultaneously, Conditional approval pathways generate exactly this evidence while revenue is already accruing, which is a considerable efficiency, Very few companies have recognised that the same spend solves both problems.
Market Impact: Registries cost USD 3 to 9 million each

Sequence Filings Through Conditional Approval Pathways

Japanese and Korean frameworks permit conditional time-limited approval on safety and probable benefit, with full approval following real-world evidence gathered from treated patients. Filing there first brings revenue two to four years earlier than conventional pathways allow and generates exactly the durability evidence Western assessment bodies will later demand. Developers sequencing filings this way arrive at Western assessment with real-world data rather than trial data alone, which changes the conversation entirely, Revenue accruing 2 to 4 years earlier also funds the Western programme itself, which very few developers have exploited.
Market Impact: Brings revenue 2 to 4 years further forward

Who Controls the Margin Pool

Concentration at 31% across the top five is low for a field this technically demanding, and it reflects a category containing several adjacent businesses rather than one competitive arena. All participants here are compared on measured global revenue from regenerative medicine products, which requires apportioning advanced therapy revenue inside large pharmaceutical groups and separating regenerative biomaterials from wider surgical portfolios.
Competition happens within modality and indication rather than across the category. Novartis holds positions in both engineered cell therapy and in vivo gene therapy. Vertex arrived with a gene-edited therapy for inherited haemoglobin disorders that reset expectations for the field. Gilead and Bristol Myers Squibb compete directly in chimeric antigen receptor products. Organogenesis and comparable companies operate an entirely separate tissue-engineered and wound care business.

Pressure is building around manufacturing economics and payment structure rather than around efficacy. Companies with allogeneic or in vivo platforms escape the throughput ceiling that constrains autologous competitors, and companies arriving with a workable payment model reach patients months earlier. Rankings shift on reimbursement decisions and manufacturing scale-up far more than on any clinical readout in this field, Approval itself has stopped being the decisive commercial event here.
regenerative-medicine-market-company-positioning-matrix-1787298735659

Competitive Moat and Risk Dimensions

NOVARTIS

Moat: Positions Across Both Major Modalities

Novartis holds approved products in engineered cell therapy and in vivo gene therapy simultaneously, which is rare and gives it manufacturing, regulatory, and payer negotiation experience across both technical routes. Treatment centre relationships built for one product support the other. That breadth also spreads the risk that any single modality proves commercially harder than expected.
NOVARTIS

Risk: Autologous Throughput And Cost Exposure

A substantial part of the company's advanced therapy revenue depends on autologous manufacturing that caps throughput and carries persistent cost of goods challenges no process improvement has resolved. Allogeneic competitors entering the same indications would compete on economics the company cannot match with its current platform. Payment structure innovation has also lagged smaller, more focused competitors.
VERTEX PHARMACEUTICALS

Moat: Editing Platform And Payer Standing

Vertex established genuine credibility with payers through years of disciplined pricing and outcomes discussion in cystic fibrosis before bringing a gene-edited therapy to market, which is an unusual asset in a field where most companies arrive as first-time negotiators. The editing platform itself extends across further inherited conditions with the same manufacturing and regulatory experience behind it.
VERTEX PHARMACEUTICALS

Risk: Narrow Indication Base Currently

Advanced therapy revenue rests on a small number of inherited conditions with defined and finite eligible populations, which limits how far the current portfolio can grow without new indications reaching approval. Ex vivo manufacturing carries the same throughput ceiling as competing autologous products. Pipeline execution therefore matters more here than for a company with several modalities running.

Players Tracked

Prominent Players

Novartis
Vertex Pharmaceuticals
Gilead Sciences
Bristol Myers Squibb
Organogenesis

Other Key Players

Johnson and Johnson
Sarepta Therapeutics
bluebird bio
Roche
Pfizer
Astellas Pharma
Takeda
Smith and Nephew
Integra LifeSciences
MiMedx
Stryker
Medtronic
JCR Pharmaceuticals
Terumo
Legend Biotech

Recent Developments

JANUARY 2025

European Assessment Body Rejects One-Time Therapy On Budget Impact

A European health technology assessment body declined to recommend routine funding for an approved one-time advanced therapy, citing budget impact and uncertainty about long-term durability rather than any doubt about short-term clinical effect. Managed entry discussions continued separately, leaving access dependent on individual case arrangements.
Signal: Assessment bodies reject on payment structure long before they ever begin questioning the clinical evidence presented
APRIL 2025

Manufacturer Launches Instalment Payment Structure Across Several Markets

An advanced therapy manufacturer introduced instalment payment arrangements spreading the cost of a one-time treatment across five years, with continuation contingent on documented patient response. The structure is a commercial reimbursement arrangement rather than any change to the product, its label, or its clinical evidence base.
Signal: Payment engineering is now the product innovation that genuinely determines whether any patients get access at all
AUGUST 2025

Japanese Regulator Grants Conditional Approval To Cell Therapy Product

Japanese authorities granted conditional time-limited approval to a regenerative cell therapy on the basis of safety data and probable benefit, with full approval contingent on real-world evidence collected from treated patients. The pathway is a regulatory framework specific to regenerative products rather than any accelerated review of conventional evidence.
Signal: Conditional pathways generate precisely the real-world durability data that Western assessment bodies will later be demanding

Vectors, Media And Clean Rooms

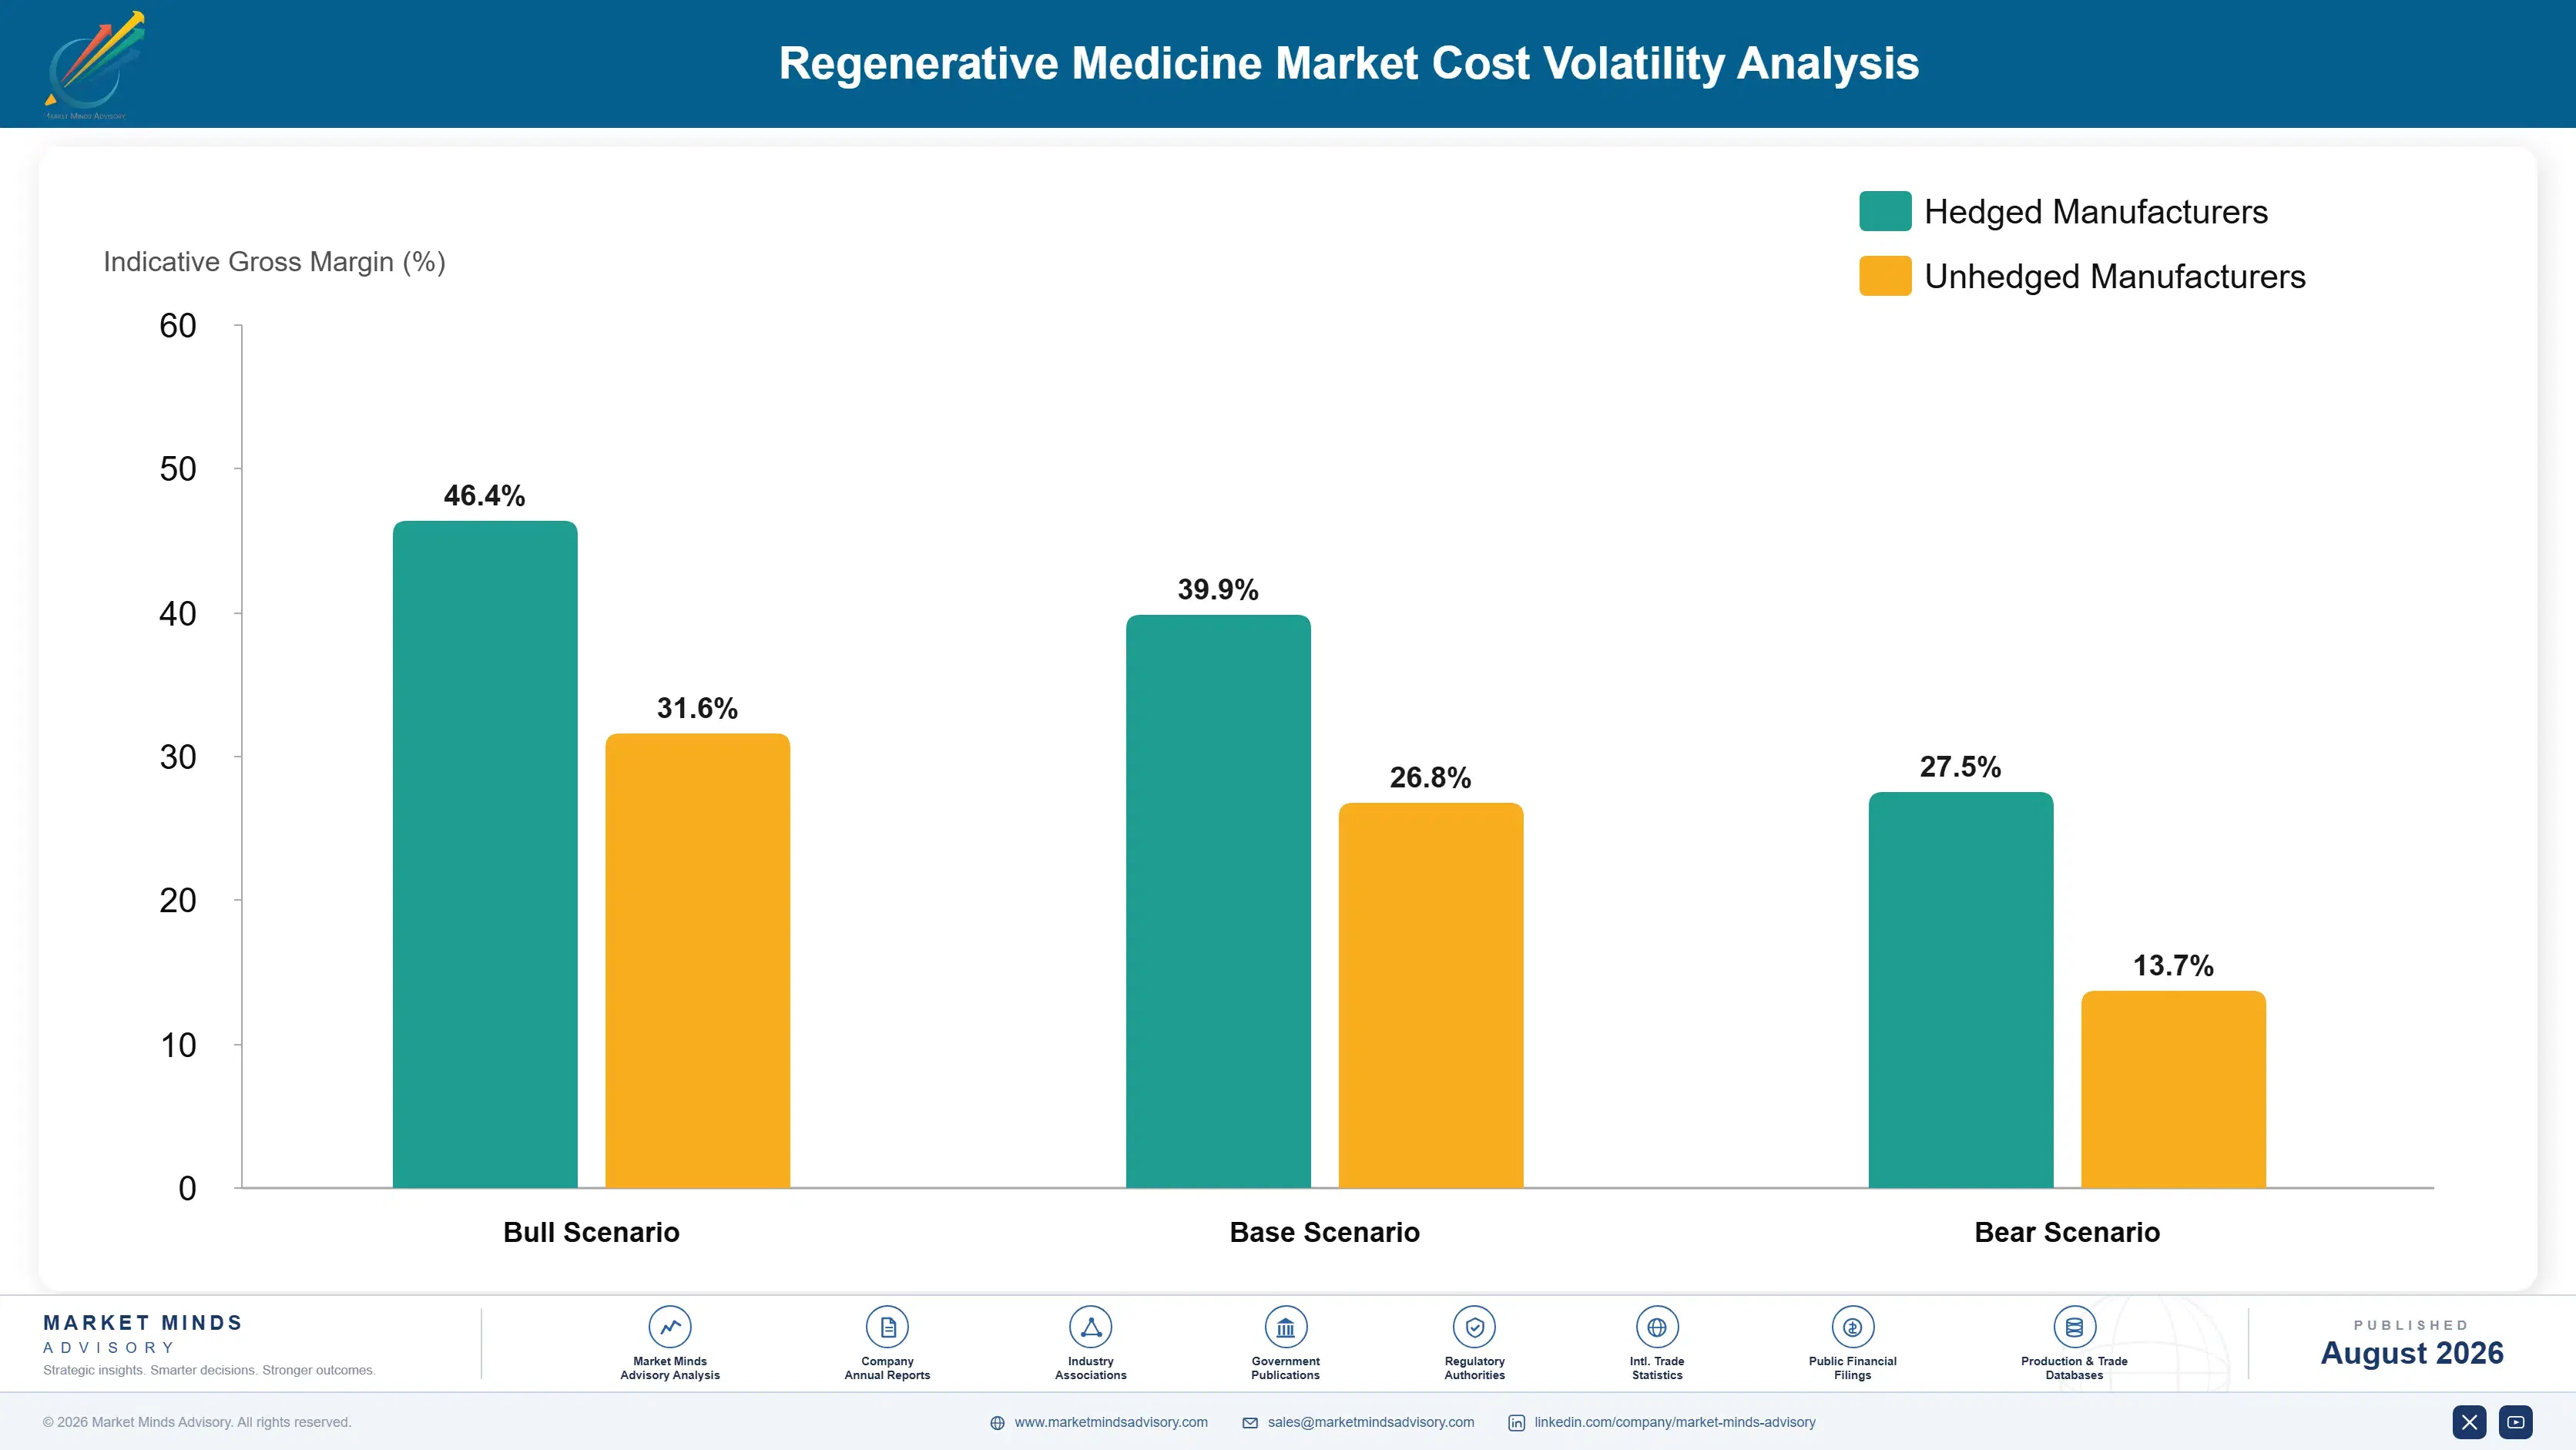
Viral vector supply accounts for roughly 26% to 38% of cost of goods on gene-modified products, produced at a limited number of qualified facilities where capacity has been contested for years. Cell culture media, cytokines, and single-use consumables add 18% to 26%. Clean room occupancy, quality control release testing, and specialist labour carry most of the remainder, and none of it scales down for small batches.
Viral vector capacity constrained the entire field through 2021 and 2022 as clinical and commercial programmes competed for the same suites, and lead times on contracted production ran past eighteen months at several providers. Catalent described sustained demand and capacity constraint across its cell and gene therapy network in its 2022 annual reporting. Programmes without contracted vector supply found timelines slipping regardless of clinical readiness.

Exposure separates by manufacturing ownership more than by scale. A company operating its own vector production and fill capacity controls its own timeline and cost curve, while one buying contract capacity competes for slots against every other programme and pays accordingly. Autologous producers face a further problem entirely, since clean room occupancy is consumed per patient rather than per batch and simply cannot be spread across volume.
regenerative-medicine-market-cost-volatility-analysis-1787298735854

Secure Vector Capacity Years Ahead Of Commercial Need

Viral vector production capacity has been contested across the field for years and contracted lead times have run past eighteen months at several providers. Reserving suites during clinical development rather than at approval prevents a timeline slipping for reasons entirely unrelated to the science, and reservation terms are considerably better negotiated before a product has an approval date attached.

Move Toward Allogeneic Or In Vivo Where Biology Permits

Clean room occupancy consumed per patient cannot be spread across volume in any meaningful way, which means autologous cost of goods barely improves with scale. Batch-manufactured allogeneic and in vivo products spread the same facility cost across hundreds or thousands of doses instead, and that difference is worth an order of magnitude rather than a percentage.

Automate Closed Manufacturing To Cut Labour And Failure

Manual open processing consumes specialist labour that is genuinely scarce and contributes materially to the roughly 6% autologous failure rate through contamination and handling error. Closed automated systems reduce both simultaneously, and the capital cost is recovered quickly at any commercial volume because a failed run wastes an entire patient's material and clean room slot.

Portfolio Architecture for Margin Defence

Margin architecture here separates by whether a product can be manufactured ahead of demand. Autologous engineered therapies earn 32% to 48% because clean room occupancy is consumed per patient and cost of goods barely improves with volume. In vivo and allogeneic products earn 66% to 82%, since batch manufacturing spreads the same facility cost across hundreds of doses rather than one.
The tension is that the highest clinical impact so far has come from the least scalable format. Autologous engineered cell therapy delivered genuinely transformative results in haematological malignancy and inherited haemoglobin disorders, and it cannot reach the eligible population at the throughput available. Companies committed to that platform have exceptional data and a permanent ceiling, which is an awkward combination to explain to investors.

High-value pools concentrate in in vivo gene therapy, allogeneic platforms, and the payment structures that make any of it reimbursable. The first two escape the manufacturing constraint and the third escapes the budget one. Tissue-engineered and orthobiologic products carry the widest margin range, because a wound care matrix and an engineered tissue construct share a category and share almost no economics.

Volume / Commodity-Adjacent

Orthobiologics, regenerative biomaterials, and non-engineered cell preparations sold through surgical and wound care channels against established competition. The fourteen-point range separates differentiated matrix and scaffold products from commoditised allograft and bone substitute supply.
Gross Margin: 38% to 52%

Premium / Certified

In vivo gene therapy and allogeneic cell products manufactured in batches ahead of demand and administered like conventional biologics. The sixteen-point range separates established launches with reimbursement in place from newer products still negotiating payment structure with major payers.
Gross Margin: 66% to 82%

Sustainability / Regulatory / Next-Generation

Autologous engineered therapies, conditional approval pathway products, and outcomes-based payment arrangements. The forty-six point range reflects genuine divergence: autologous cost of goods remains stubbornly high while conditionally approved products can price ahead of full evidence.
Gross Margin: 28% to 74%
regenerative-medicine-market-portfolio-architecture-1787298736359

High-value Sub-segments and Strategic Watch-out

In Vivo Gene Therapy Platforms

Highest growth and strongest economics, because batch manufacturing spreads facility cost across hundreds of doses rather than one patient. Vector supply capacity rather than science is the practical constraint, and reserving it years ahead separates programmes that launch on time, from the ones that slip for entirely non-scientific reasons.
Gross Margin: 72% to 82%

Allogeneic Cell Products

Off-the-shelf products removing vein-to-vein delay, per-patient failure risk, and the throughput ceiling simultaneously. Persistence and immune rejection remain genuine scientific problems, and the commercial pull toward solving them is enormous because the economics improve by an order of magnitude, and several major developers have shifted platform accordingly.
Gross Margin: 62% to 76%

Autologous Engineered Therapies

Exceptional clinical results attached to a permanent throughput ceiling, since clean room occupancy is consumed per patient and cannot be spread. Roughly six percent of runs fail outright, and no process improvement has changed that materially across a decade of effort, which is an awkward combination to explain to investors.
Gross Margin: 32% to 48%

Commodity Orthobiologic Supply

Strategic watch-out. Allograft, bone substitute, and basic matrix products compete on surgical tender pricing with minimal differentiation and no advanced therapy premium whatsoever. They share a category label with gene therapy and share nothing else commercially at all, Analysts treating this category as one market consistently misread it.
Gross Margin: 38% to 52%

One Patient, One Payment, Forever

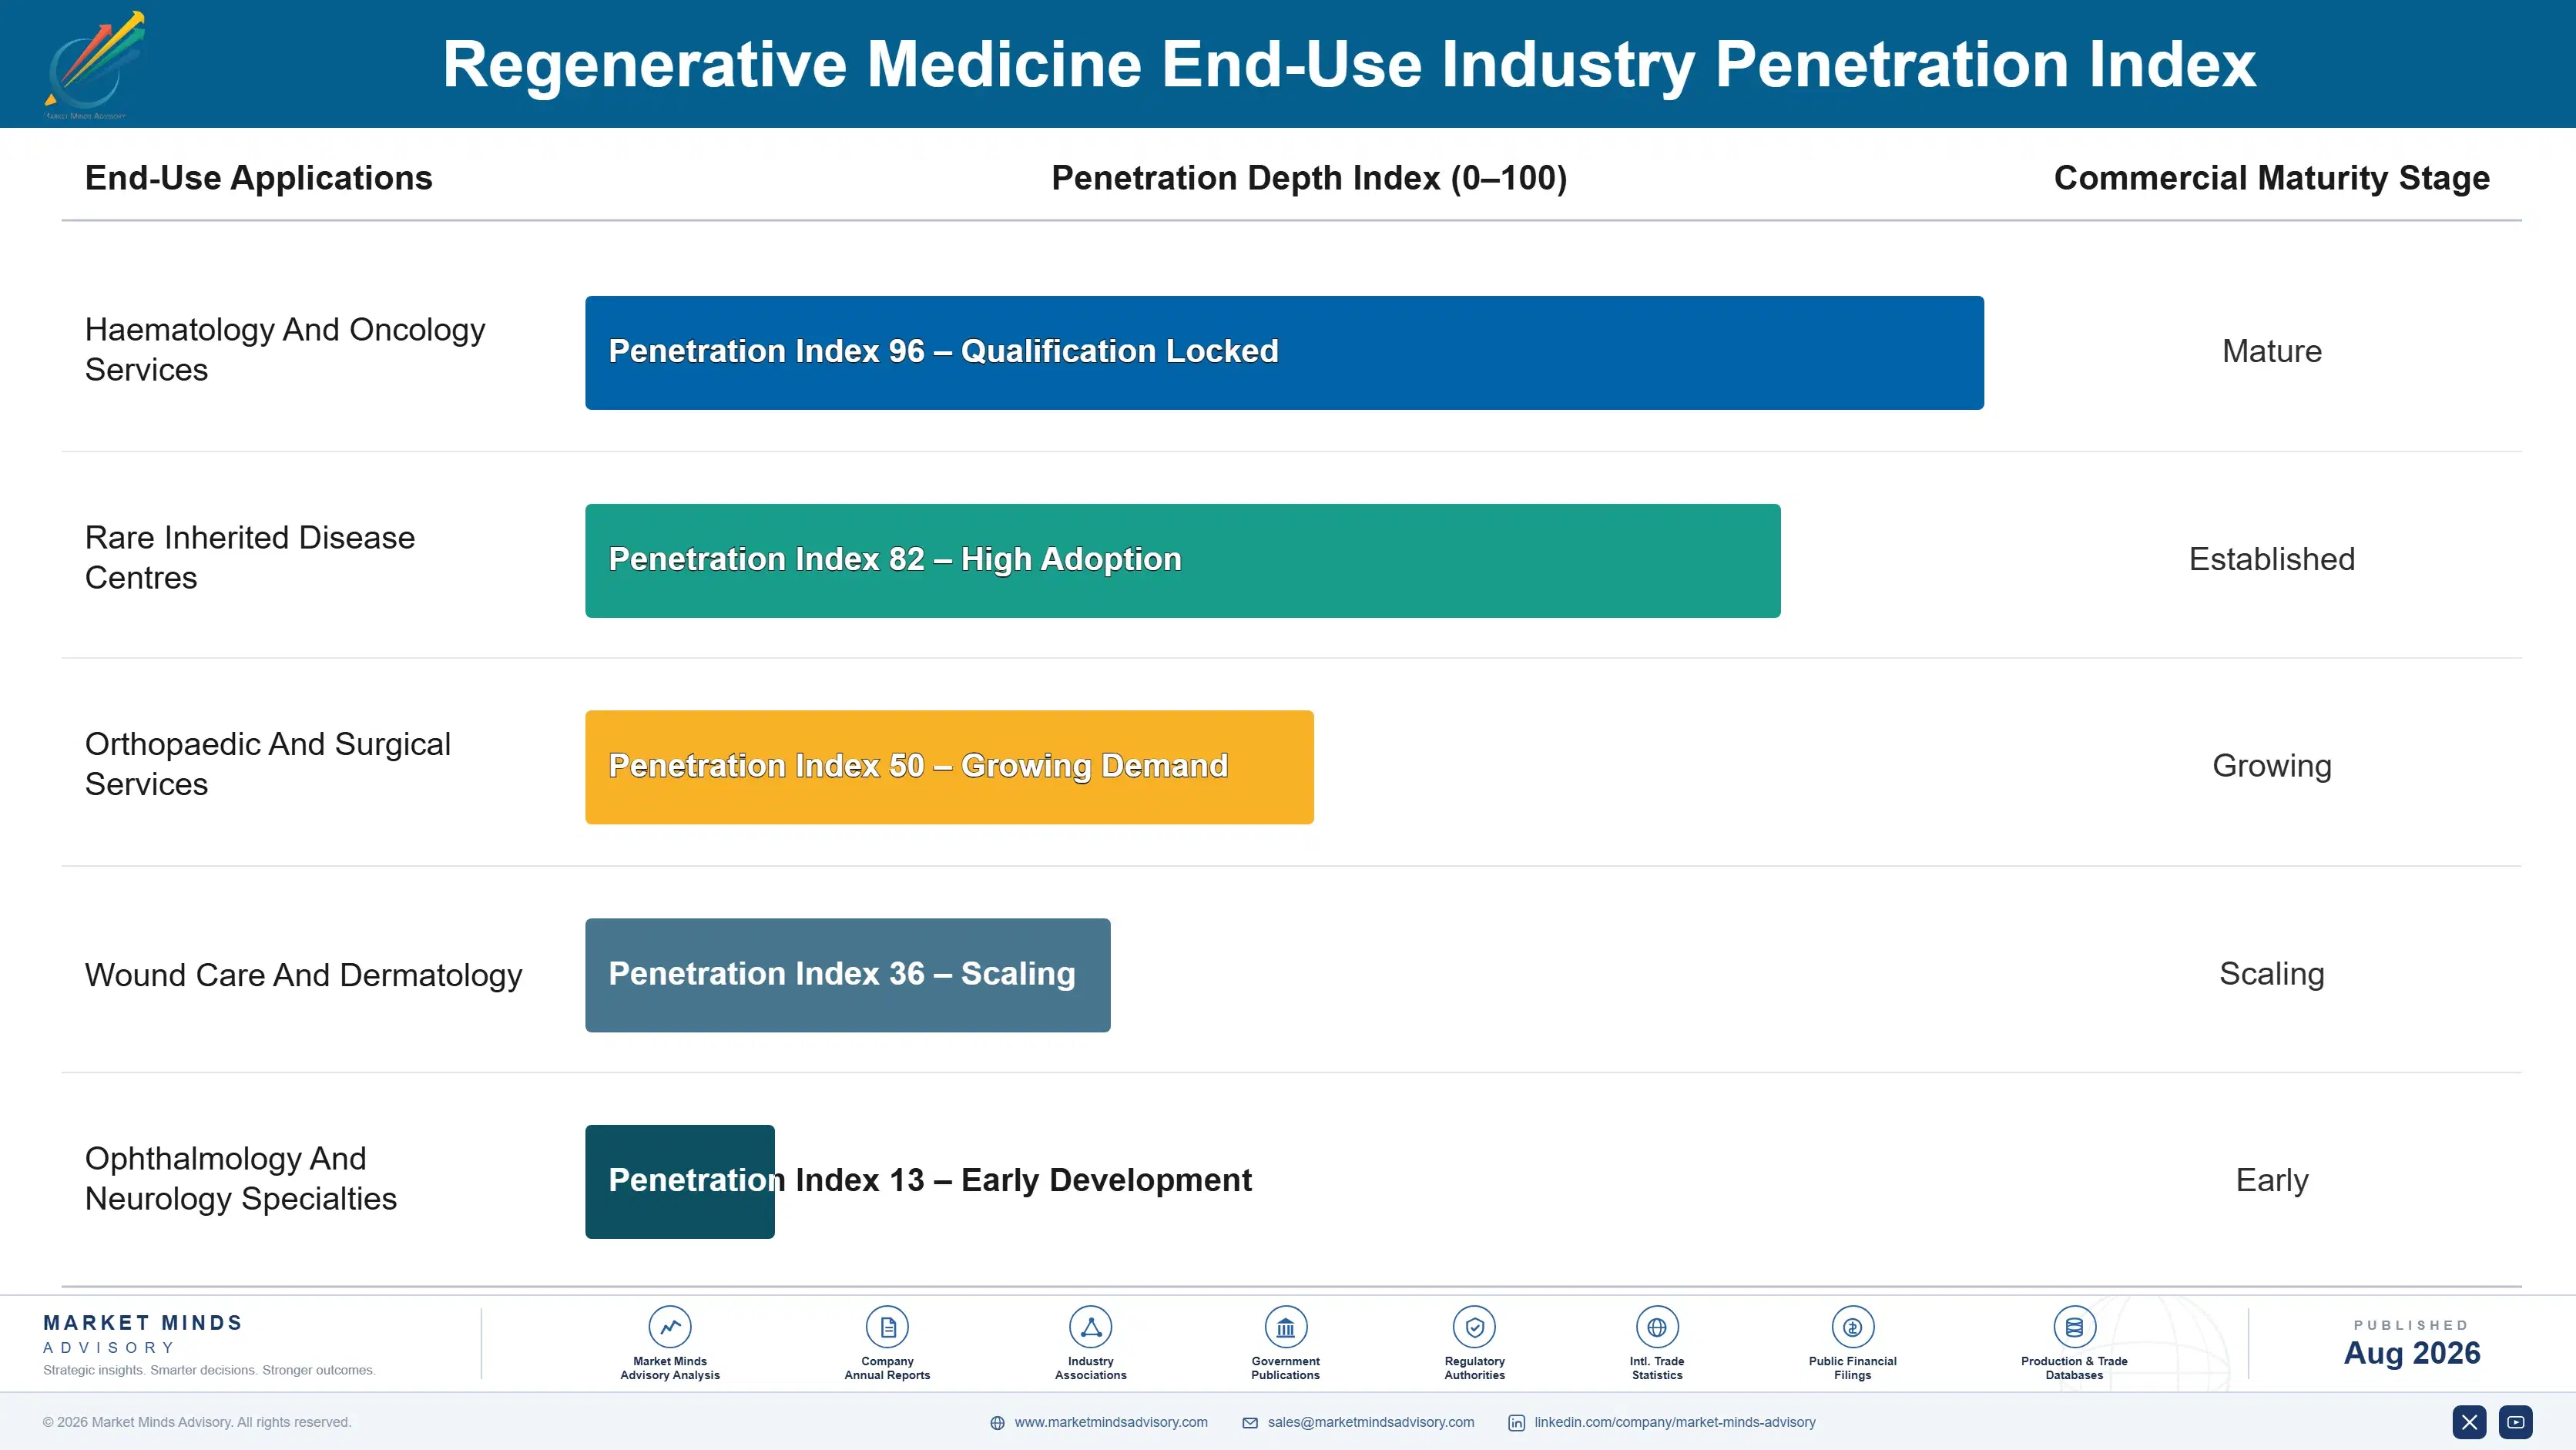
There is no annuity in a cure, which is the fundamental commercial oddity of this field. A patient treated once is treated permanently, generating a single payment and no further revenue for the rest of their life, so growth depends entirely on finding and treating new eligible patients. In a rare inherited condition with a defined prevalence, the addressable population is genuinely finite and depletes as treatment proceeds.
Depth varies by how the payment was structured rather than by any clinical relationship. Outcomes-based and instalment agreements create multi-year revenue from a single administration and tie the payer into a continuing arrangement. Conditional approval products generate ongoing evidence obligations that keep the manufacturer engaged with treatment centres. Commodity orthobiologics recur through surgical volume and behave like any other consumable business entirely.

Buyer profiles have shifted decisively toward finance. Treatment decisions still rest with clinicians, but access decisions now rest with payers, health technology assessment bodies, and hospital finance directors evaluating budget impact rather than clinical benefit. Both changes reward companies that arrive with a payment structure and durability evidence, and they penalise anybody who assumed approval was the difficult part of the process.
regenerative-medicine-market-end-use-penetration-index-1787298736860

Where We Come Out

These are among the four positions where our research anticipates prominent divergence between winners and laggards over the coming forecast period. Each is grounded in the demand model, the regulatory perimeter, and the announced capacity pipeline.
01 / PAYMENT ARCHITECTURE PRIORITY

Design the reimbursement structure during phase three

A payer asked for two point eight million dollars in a single budget year cannot easily say yes however strong the clinical data happens to be, and eligible patients go untreated while the argument continues. Roughly thirty-four percent of launches now carry outcomes-based or instalment structures because the alternative simply does not work in practice. Building that architecture during development rather than after approval shortens time to first reimbursed patient by nine to fifteen months, which is the largest commercial variable in this field.
02 / MANUFACTURING ROUTE SELECTION

Autologous is a permanent ceiling, not a temporary one

Clean room occupancy consumed per patient cannot be spread across volume, which is why autologous cost of goods has barely improved across a decade of determined process engineering. Add twenty-four days of vein-to-vein time and a six percent run failure rate and the throughput limit becomes absolute rather than economic. Programmes choosing autologous routes for scientific convenience rather than genuine necessity are accepting a commercial ceiling that no amount of later optimisation will ever lift meaningfully, Allogeneic and in vivo routes escape all three constraints at once.
03 / DURABILITY EVIDENCE INVESTMENT

Registries finance the therapy as much as they evidence it

A payer funding a cure needs to know the effect lasts, and that evidence accumulates only through years of systematic follow-up on treated patients. Registries costing three to nine million dollars convert conditional or restricted reimbursement into routine funding, and they simultaneously underpin the outcomes-based agreements that make the payment feasible at all. One investment therefore solves the evidence problem and the financing problem together, which very few companies have recognised properly, Conditional approval pathways generate the same evidence while revenue already accrues.
04 / REGULATORY SEQUENCING STRATEGY

File where conditional approval generates the evidence you need

Japanese and Korean frameworks grant conditional time-limited approval on safety and probable benefit, with full approval following real-world evidence gathered from patients actually treated under it. Filing there first brings revenue two to four years earlier and produces precisely the durability data that Western assessment bodies will subsequently demand. Developers sequencing this way arrive at European assessment carrying real-world outcomes rather than trial data alone, which changes that conversation completely, The revenue arriving earlier also part-funds the Western programme itself.

Engagement Snapshot From the Field

A live engagement with an industry participant carrying material or product regulatory and market exposure ahead of a defining policy shift, showing how our research translates into a defensible multi-year portfolio strategy.
MARKET MINDS ADVISORY · CLIENT ENGAGEMENT SUMMARY
Regenerative Medicine Producer Strategic Portfolio Review and Transition Roadmap 2026·Investment Scenario on Regenerative Medicine Exposure Evaluation 2025-26
CLIENT PROFILE
A clinical-stage advanced therapy developer approaching approval for an autologous engineered cell product in a rare inherited condition, with roughly USD 40 million in annual revenue from partnered programmes (client-reported, unverified by MMA). The organisation was built around clinical development, held no market access function of any scale, and had made no decision on payment structure with fewer than twelve months to approval.
STRATEGIC CHALLENGE
Two competitor products in adjacent indications had launched into payer environments with no reimbursement mechanism and treated very few patients in their first eighteen months. The board needed to establish whether the same fate awaited its own launch and what could realistically be changed with under a year of runway before approval.
MMA APPROACH
MMA modelled time to first reimbursed patient under three payment structures across nine markets, interviewed twenty-seven payers, health technology assessment members, and treatment centre directors on what would make a multi-million single payment approvable, and assessed the client's manufacturing throughput against the eligible population it planned to serve, Conditional approval pathway options were assessed against the existing evidence package.
KEY FINDINGS
  1. Comparator launches without a payment structure reached first reimbursed patient at a median of 19 months after approval, against 7 months for those launching with an instalment or outcomes arrangement.
  2. Twenty-two of twenty-seven payer contacts said budget impact rather than clinical evidence would determine their decision, and none had been approached by the client at that point.
  3. The client's contracted manufacturing throughput could serve 34% of the eligible population annually, and no expansion was possible within three years given clean room availability.
  4. Conditional approval filing in Japan was feasible on existing data and would generate real-world durability evidence roughly two years ahead of any European assessment submission.
CLIENT PROFILE
A clinical-stage advanced therapy developer approaching approval for an autologous engineered cell product in a rare inherited condition, with roughly USD 40 million in annual revenue from partnered programmes (client-reported, unverified by MMA). The organisation was built around clinical development, held no market access function of any scale, and had made no decision on payment structure with fewer than twelve months to approval.
STRATEGIC CHALLENGE
Two competitor products in adjacent indications had launched into payer environments with no reimbursement mechanism and treated very few patients in their first eighteen months. The board needed to establish whether the same fate awaited its own launch and what could realistically be changed with under a year of runway before approval.
MMA APPROACH
MMA modelled time to first reimbursed patient under three payment structures across nine markets, interviewed twenty-seven payers, health technology assessment members, and treatment centre directors on what would make a multi-million single payment approvable, and assessed the client's manufacturing throughput against the eligible population it planned to serve, Conditional approval pathway options were assessed against the existing evidence package.
KEY FINDINGS
  1. Comparator launches without a payment structure reached first reimbursed patient at a median of 19 months after approval, against 7 months for those launching with an instalment or outcomes arrangement.
  2. Twenty-two of twenty-seven payer contacts said budget impact rather than clinical evidence would determine their decision, and none had been approached by the client at that point.
  3. The client's contracted manufacturing throughput could serve 34% of the eligible population annually, and no expansion was possible within three years given clean room availability.
  4. Conditional approval filing in Japan was feasible on existing data and would generate real-world durability evidence roughly two years ahead of any European assessment submission.
RECOMMENDED STRATEGY
Phase 1: Phase one: build a market access function immediately and negotiate outcomes-based payment frameworks in the four largest markets before approval rather than after it. Phase 2: Phase two: file for conditional approval in Japan on existing evidence, using the resulting real-world data to support subsequent European and American submissions. Phase 3: Phase three: begin allogeneic platform development in parallel, accepting that the autologous product will never reach most of its eligible population.
OUTCOME
The client built an access team and secured outcomes-based frameworks in three markets ahead of approval. First reimbursed patient came 8 months after approval against a 19 month comparator median, and Japanese conditional approval was granted in the same period, generating durability data ahead of European submission (client-reported, unverified by MMA).

Frequently Asked Questions

Foundational context covering the market sizes, CAGR, scope, country, region and competition that inform every finding below. This section is provided to cover basics and most often pre-purchase conversations, answered from the MMA Primary Research Dataset.

What is the current size of the Regenerative Medicine Market?

The global regenerative medicine market reached USD 38.0 billion in 2025, covering therapies that repair, replace, or restore biological function across gene therapy, cell therapy, tissue engineering, and orthobiologics. Contract manufacturing services are excluded.

How large will the Regenerative Medicine Market be by 2036?

MMA forecasts USD 166.91 billion by 2036, up from USD 43.47 billion in 2026, an increase of USD 123.43 billion. That represents an expansion multiple of 3.84 times across the forecast period.

What is the CAGR for the Regenerative Medicine Market 2026 to 2036?

The base case CAGR is 14.4%, with a bull case of 15.7% and a bear case of 13.1%. Historical growth between 2020 and 2025 ran at 13.2%, as approval momentum met reimbursement structures never designed for one-time cures.

Which segment is growing fastest?

In vivo gene therapy grows fastest at 21.6%, exactly 1.50 times the market rate, because it escapes the bespoke per-patient manufacturing limiting everything else. Ex vivo engineered cell therapy follows at 18.2%.

Who are the major companies in the Regenerative Medicine Market?

Novartis, Vertex Pharmaceuticals, Gilead Sciences, Bristol Myers Squibb, and Organogenesis lead, together holding 31% of the market. Cell therapy, gene therapy, and tissue engineering barely compete with one another.

Which country is growing fastest?

China grows fastest at 18.4%, driven by extensive domestic cell therapy development and approved products priced far below Western equivalents. Regulatory pathways there have moved considerably faster than in Europe.

Report Segmentation Architecture

The full report scope spans multiple orthogonal segmentation dimensions, with cross-tabulated demand data provided for each dimension pair. Coverage extends further to regional breakdowns, trend trajectories, and the competitive detail needed to support segment-level decision-making.

By Therapeutic Modality

  • In Vivo Gene Therapy
  • Ex Vivo Engineered Cell Therapy
  • Induced Pluripotent And Allogeneic Cell Products
  • Tissue-Engineered Products And Scaffolds
  • Orthobiologics And Regenerative Biomaterials
  • Non-Engineered Cell Preparations

By End-Use Industry

  • Haematology And Oncology Services
  • Rare Inherited Disease Centres
  • Orthopaedic And Surgical Services
  • Wound Care And Dermatology
  • Ophthalmology And Neurology Specialties

By Commercial Dimension

  • Standard Reimbursed Supply
  • Outcomes-Based Payment Agreements
  • Instalment And Annuity Structures
  • Conditional Approval Pathway Supply
  • Surgical Tender And Distributor Channels

By Region

  • North America
  • East Asia
  • Western Europe
  • South Asia and Pacific
  • Latin America
  • Middle East and Africa
  • Eastern Europe

Scope, Methodology, and Coverage

Every figure in this report is reproducible from documented input assumptions. The scope below maps the historical period, the forecast horizon, the segmentation dimensions, and the countries covered, alongside the underlying primary and qualitative methodology.
Historical Period
2020 to 2025
Forecast Period
2026 to 2036
Base Year
2025 (USD billions; MMA Primary Research Dataset, August 2026)
Market Definition
The regenerative medicine market covers therapies and products intended to repair, replace, or restore biological structure and function, across clinical and surgical settings worldwide. Scope spans in vivo gene therapy, ex vivo engineered cell therapy, induced pluripotent and allogeneic cell products, tissue-engineered products and scaffolds, orthobiologics and regenerative biomaterials, and non-engineered cell preparations, together with the payment and outcomes arrangements attached to them. Contract development and manufacturing services sold separately, research reagents and equipment, conventional biologics, organ transplantation, and aesthetic procedures are excluded.
Quantitative Units
USD billions at manufacturer revenue level; patients treated annually; cost per treated patient by modality.
Segmentation Dimensions
By therapeutic modality; by end-use industry; by commercial dimension; by region.
Regions Covered
North America, East Asia, Western Europe, South Asia and Pacific, Latin America, Middle East and Africa, Eastern Europe
Countries Covered
United States, Canada, United Kingdom, Germany, France, Italy, Spain, Netherlands, Poland, Czech Republic, Japan, South Korea, China, India, Australia, Singapore, Brazil, Mexico, Saudi Arabia, South Africa.
Key Companies Profiled
Novartis, Vertex Pharmaceuticals, Gilead Sciences, Bristol Myers Squibb, Organogenesis, Johnson and Johnson, Sarepta Therapeutics, bluebird bio, Roche, Pfizer, Astellas Pharma, Takeda, Smith and Nephew, Integra LifeSciences, MiMedx, Stryker, Medtronic, JCR Pharmaceuticals, Terumo, Legend Biotech.
Quantitative Methodology
Primary survey, n=3,800 respondents, Q4 2025, six countries; demand-side model with trade association cross-validation
Qualitative Methodology
47 expert interviews, Q4 2025; applied to validate demand model assumptions, identify emerging dynamics, and assess competitive positioning
Report Format
PDF and XLSX data workbook (Word format preview document)
Publisher
Market Minds Advisory
Report Code
MMA-2026-HLT-925
Published
August 2026
Contact
sales@marketmindsadvisory.com | www.marketmindsadvisory.com

Purchase the full Regenerative Medicine Market Report (2026 to 2036).

The full MMA report on regenerative medicine covers modality, regional, and competitive analysis in detail, with separate treatment of the payment architecture and manufacturing economics that determine access far more than clinical evidence does. It includes time to first reimbursed patient modelling by payment structure, autologous against allogeneic cost of goods analysis at scale, conditional approval pathway sequencing across jurisdictions, and vector capacity availability tracking. Regional chapters cover twenty countries with reimbursement mechanism and treatment centre capability assessed individually. Competitive profiling spans twenty companies on a consistent revenue basis.
Twenty country reimbursement mechanism and capability chapters
Time to first reimbursed patient by payment structure
Autologous against allogeneic cost of goods analysis at scale
Conditional approval pathway sequencing across major jurisdictions
Twenty company competitive profiles compared consistently
Viral vector capacity availability and lead time tracking

Built For The People Who Decide

From boardroom strategy to bench-side execution, this report is read cover-to-cover by leaders shaping the next decade of their industry, turning demand scenarios, market dynamics and valuation benchmarks into decisions.
CXOs/ Presidents/ VPs/ Managers
M&A and Corporate Development
Strategy Teams and R&D Heads
Procurement and Product Directors
Regulatory and Compliance Leaders
Investor Relations and Equity Analysts