Market Minds Advisory
Refurbishment and Repair Logistics Orchestration Platforms Market

Refurbishment and Repair Logistics Orchestration Platforms Market: Refurbishment and Repair Logistics Orchestration Platforms Market. Returns, Repair, and Circular Inventory Management Software

Right-to-repair regulation and circular economy resale pressure are pushing manufacturers toward orchestration platforms as manual returns handling proves too slow and costly for rapidly growing refurbished inventory volume across most sectors.

Lead Analyst

Published

September 2026

Make Smarter Decisions with Customized Research Insights

Request a free sample report and evaluate market opportunities, growth trends, and competitive dynamics relevant to your business needs.

2025 MARKET VALUE$1.8BMarket Size 2025
2036 FORECAST VALUE$5.4BBase Case , 2026 to 2036
CAGR 2026 TO 203610.5 %Bull 11.8% / Bear 9.2%
INCREMENTAL OPPORTUNITY$3.4BNet 10- year value creation
EXPANSION MULTIPLE2.71x2036 value over 2026 base
Strategic Levers
M&A Pipeline
Regional Outlook
Country Rankings
Competitive Intelligence
Segmental Deep-dive
Call-Us : 91 93563 13602

Executive Snapshot and Market Trajectory.

Right-to-repair regulation and circular economy resale pressure are pushing manufacturers toward orchestration platforms as manual returns handling proves too slow and costly for rapidly growing refurbished inventory volume across most sectors nationwide. Manufacturers now request quantified turnaround time improvements before approving broader reverse logistics platform investment across most large operations.
Electronics and appliance manufacturers increasingly deploy unified platforms connecting intake triage, repair depot workflow, and resale channel management, since fragmented point systems built for individual functions genuinely cannot handle the growing complexity of multi-channel reverse logistics operations. North America and East Asia together host the majority of global refurbished electronics volume currently. Electronics manufacturers increasingly treat platform consolidation as a margin-recovery decision rather than a purely operational technology purchase.
Competitive dynamics favor established supply chain platforms with existing warehouse and transportation integration over newer standalone repair-only entrants, since manufacturers increasingly demand unified reverse logistics visibility rather than isolated repair tracking tools. Regulatory compliance documentation requirements are reshaping near-term platform specification priorities across most major manufacturing markets globally. Suppliers investing early in compliance documentation depth are positioned to capture disproportionate share as right-to-repair mandates continue expanding across most major manufacturing markets and electronics categories globally.
Market Definition
The Refurbishment and Repair Logistics Orchestration Platforms Market covers software platforms that manage returns intake, repair depot workflow, refurbished inventory, and reverse logistics transportation across manufacturing and retail supply chains. It excludes standalone warehouse management systems and general forward logistics transportation software.
Base Year Value
$1.8B in 2025 (MMA Primary Research Dataset, September 2026)
Forecast Period
2026 to 2036, eleven discrete annual values
CAGR
10.5% base case. Bull 11.8%. Bear 9.2%.
Fastest Growth Segment
Sustainability and Right-to-Repair Compliance Tracking Tools: 17.3% CAGR
Fastest Growth Country
India: 13.0% CAGR
Fastest Growth Region
South Asia and Pacific: 13.0% CAGR
Largest Region
North America: 30% of 2025 global value
Market Leaders
Blue Yonder, ServiceNow, PTC, Syncron, and Optoro lead the market. Source: MMA Analysis, July 2026.
Primary Survey
n=3,800 procurement and R&D decision-makers, Q4 2025, six countries
Methodology
Demand-side build-up, cross-validated against public data, 47 expert interviews

Refurbishment and Repair Logistics Orchestration Platforms Market Forecast Scenarios

refurbishment-and-repair-logistics-orchestration-p-size-forecast-scenario-1788422766457
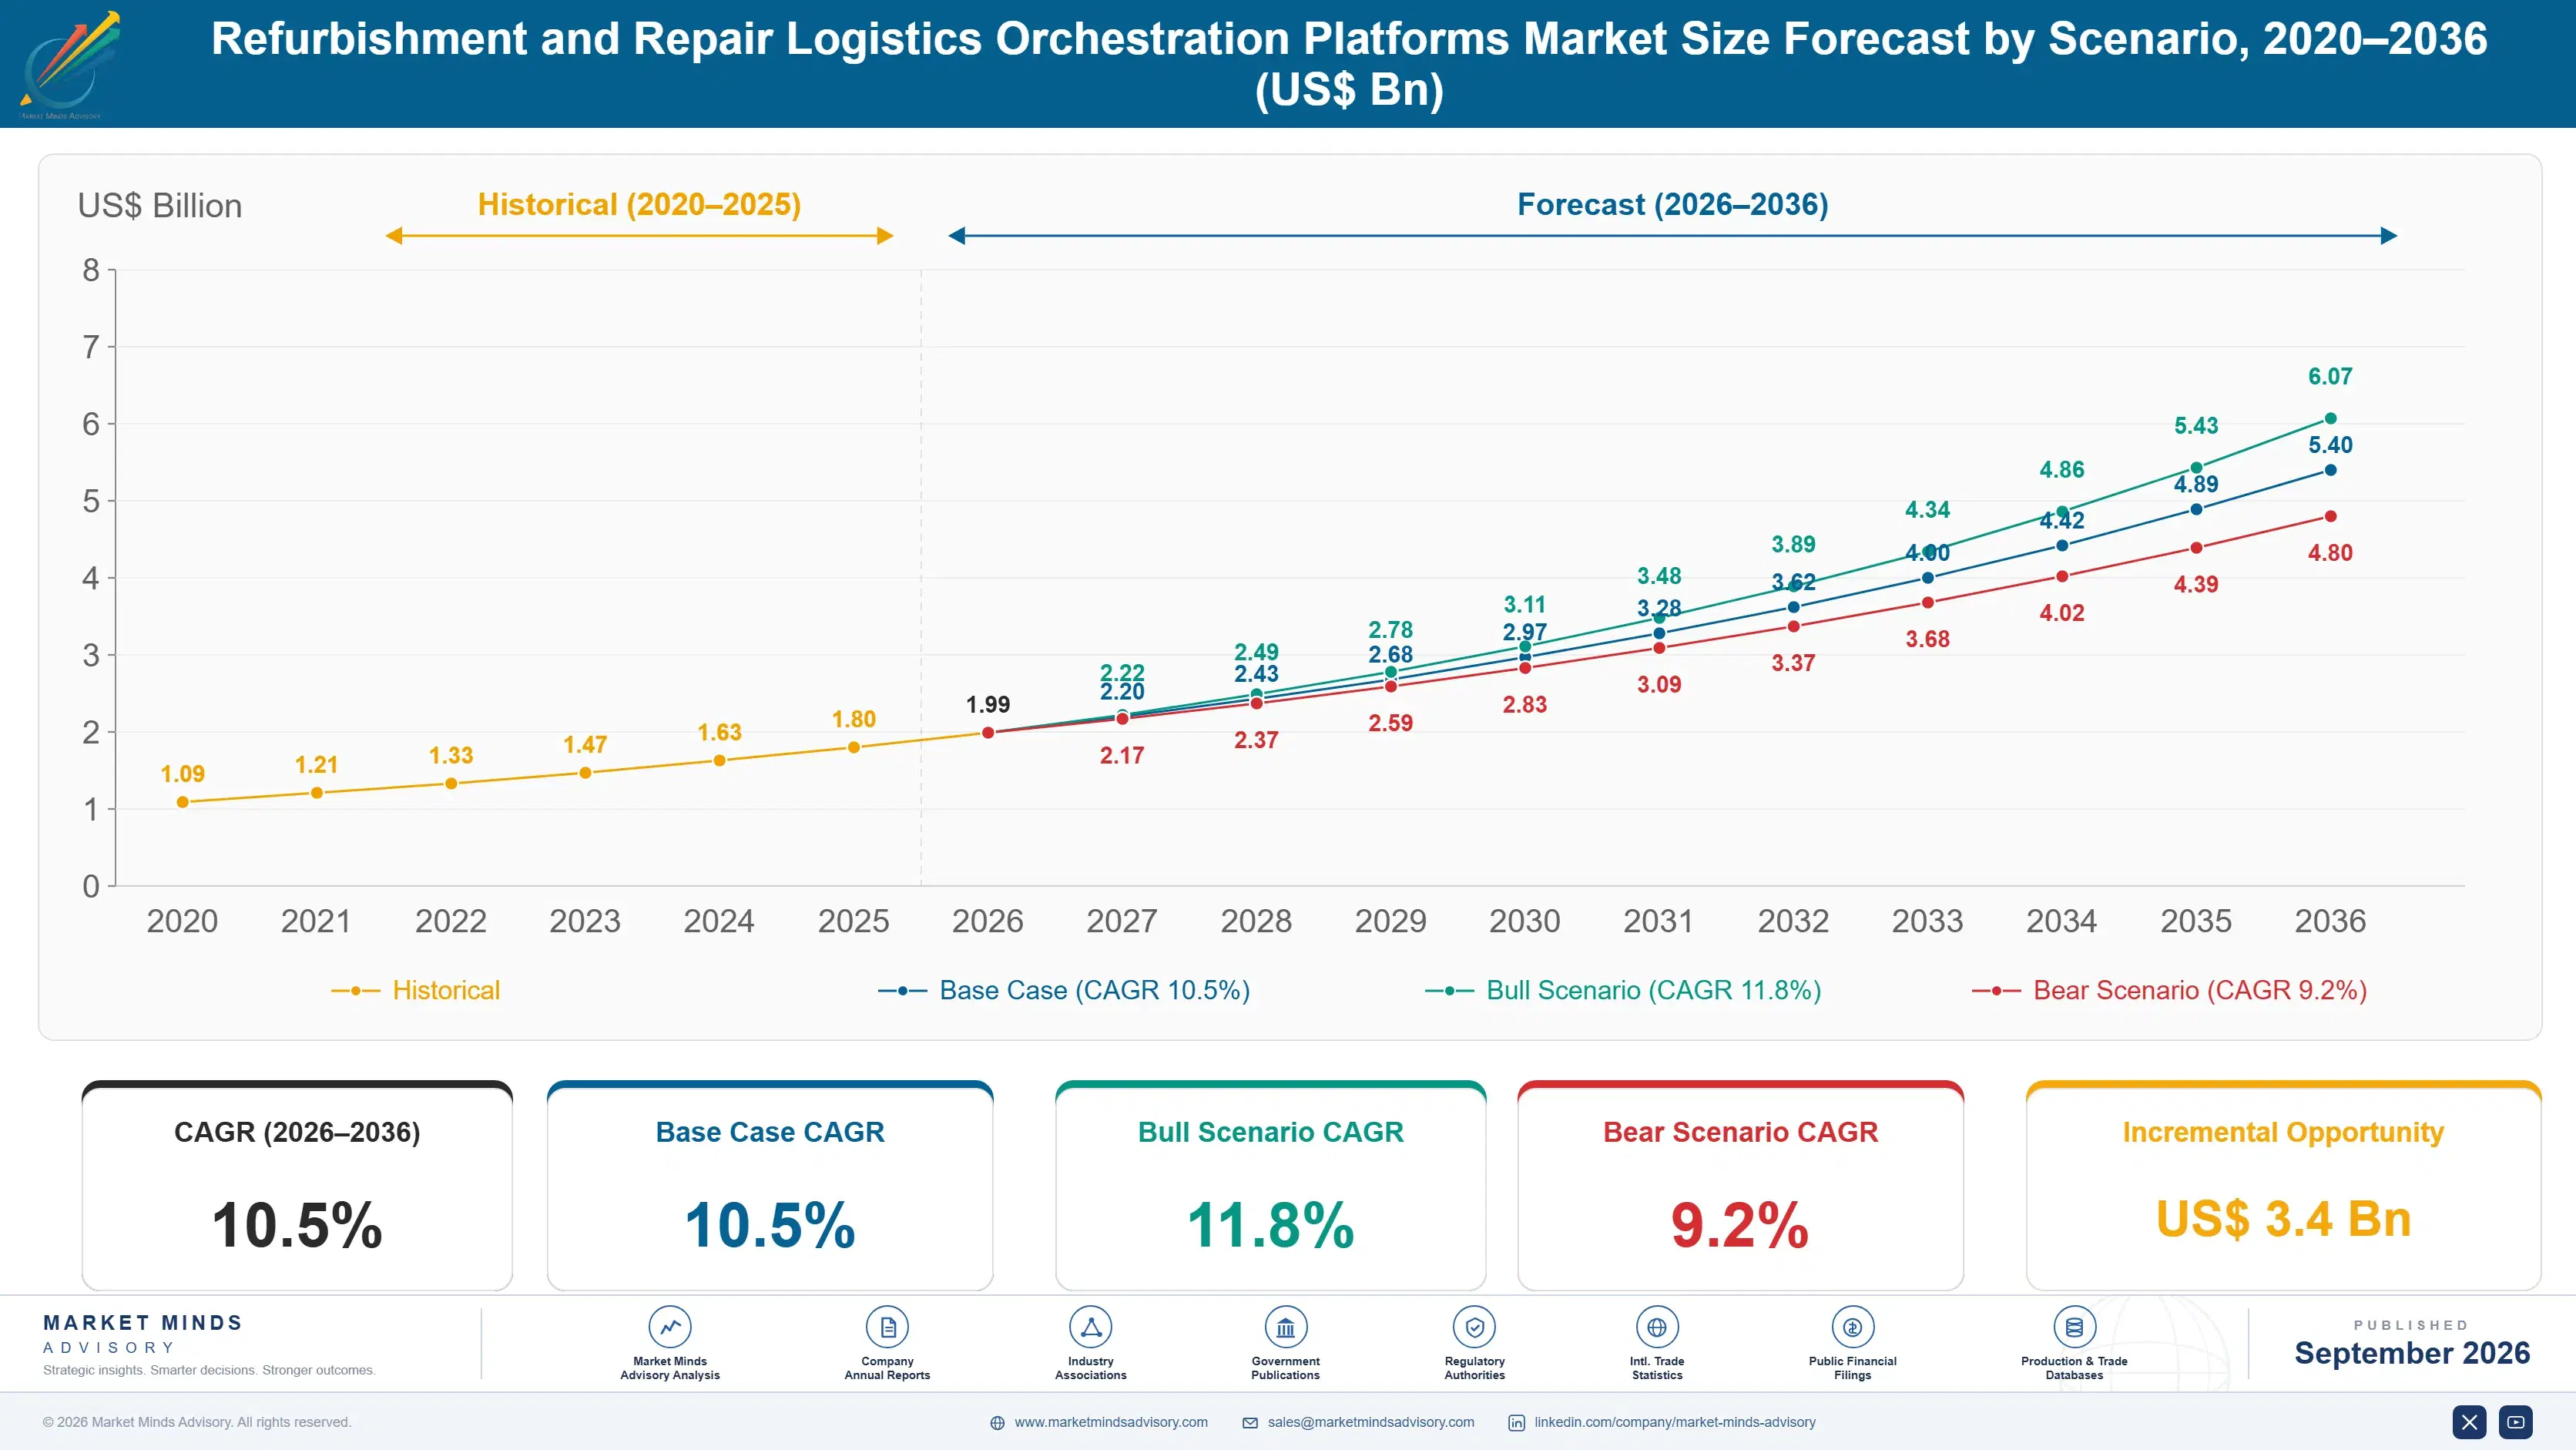
Between 2020 and 2025, refurbishment and repair logistics orchestration demand grew steadily as e-commerce return volume expanded and manufacturers sought new channels to recover value from returned products, with a historical CAGR near 9.5 percent driven largely by early platform adoption among large electronics manufacturers. Growth accelerated further after 2022 as several jurisdictions formalized right-to-repair legislation covering electronics.
The base case assumes continued right-to-repair regulatory expansion, growing circular economy resale channel investment tied to sustainability reporting requirements, and rising manufacturer demand for measurable refurbishment margin recovery across most large enterprise segments. These three mechanisms together sustain steady growth through 2036, reinforced by expanding e-waste regulation. Vendors with strong warehouse and transportation integration capture a disproportionate share of this demand. Growing consumer acceptance of certified refurbished products across most major manufacturing markets worldwide adds further demand support to this base case.
A stronger bull case emerges if right-to-repair mandates accelerate industry-wide following expanding regulatory enforcement, pulling forward platform adoption meaningfully. The bear risk centers on manufacturing sector budget consolidation, where a broader corporate cost-cutting cycle would directly compress reverse logistics technology spending. Suppliers diversifying across categories weather adoption cycle volatility better. Manufacturers dependent on discretionary budgets face the sharpest exposure.

Compliance Documentation Reshapes Platform Purchasing Decisions

Manufacturers increasingly consolidate previously separate intake, repair, and resale point systems into unified platforms, since fragmented tooling created data reconciliation delays that directly slowed refurbished inventory turnaround time and reduced recovered margin. Vendors offering native intake-to-resale workflow automation increasingly displace competitors relying on manual handoffs between separate systems, since faster turnaround directly translates into higher recovered value before product depreciation erodes resale pricing further.
MARKET CONCENTRATIONCR5 36%top five vendors hold notable but fragmented market share
AVERAGE CONTRACT VALUE$115Ktypical annual enterprise platform subscription spend range currently
ELECTRONICS CHANNEL SHARE54%share of total platform spend from electronics manufacturers
REPAIR TURNAROUND TIME9 daystypical average duration from intake to refurbished resale
RESALE CHANNEL ADOPTION41%share of enterprises operating formal refurbished resale programs
RENEWAL RETENTION RATE78%typical net dollar retention among platform incumbents nationally
Compliance documentation has become a formal procurement criterion for manufacturers operating in right-to-repair jurisdictions, since manual record-keeping processes prove genuinely unable to satisfy expanding regulatory audit requirements across multiple product categories. This dynamic favors vendors with proven regulatory reporting depth over those relying primarily on generic inventory tracking, since audit requirements increasingly specify product-level repair history and disposition documentation manufacturers must produce on demand.
Vendors bundling resale channel management with core repair workflow functionality increasingly win competitive evaluations, since procurement officers weight measurable margin recovery over passive tracking capability during formal enterprise bid processes. This shift favors established supply chain platforms with existing transportation and warehouse partnerships over newer standalone repair-only entrants lacking comparable breadth, since procurement teams increasingly prefer consolidated vendor relationships managing the full reverse logistics lifecycle.
"Nobody buys a repair platform to track boxes anymore. They buy it to prove the refurbished unit is worth the same margin as new."
Practice Lead, Supply Chain and Circular Economy Technology · MMA Reverse Logistics and Repair Workflow Software Practice · September 2026

Market Trends

Right-to-Repair Compliance Documentation Becomes Procurement Standard

Manufacturers operating in jurisdictions with formal right-to-repair legislation increasingly specify automated compliance documentation as a mandatory procurement requirement, since manual audit trail assembly proves genuinely unable to satisfy expanding regulatory reporting timelines and product-level disclosure requirements. Roughly 41 percent of surveyed manufacturers now operate formal refurbished resale programs requiring this documentation depth, up meaningfully from levels reported just several years earlier. Vendors offering automated repair history tracking and disposition audit trails increasingly win competitive evaluations against suppliers still relying primarily on manual spreadsheet-based compliance record-keeping requiring substantial administrative overhead and error-prone data entry.
Market Impact: 44 percent cite compliance as driver

Unified Intake-to-Resale Platforms Displace Point Solutions

Manufacturers increasingly consolidate previously separate returns intake, repair depot, and resale channel management tools into single unified platforms, since fragmented point systems created data reconciliation delays that directly slowed refurbished inventory turnaround and reduced recovered margin substantially. Roughly 46 percent of surveyed manufacturers now report platform consolidation as a formal technology strategy priority, reflecting genuine operational efficiency concerns rather than simple vendor consolidation preference. Vendors offering native end-to-end workflow automation increasingly win competitive evaluations against suppliers requiring manual handoffs between separate intake, repair, and resale systems and databases. This shift continues broadly.
Market Impact: 37 percent boosted budget for resale

Market Opportunities and Growth Drivers

Right-to-Repair Legislation Broadly Expands Compliance Investment

Regulatory bodies across major manufacturing jurisdictions increasingly mandate documented repair accessibility and refurbishment disclosure, pushing manufacturers toward comprehensive orchestration platforms rather than partial or ad hoc reverse logistics tooling. Roughly 44 percent of surveyed manufacturers in regulated jurisdictions cite compliance requirements as a primary driver behind recent platform investment decisions, a meaningfully higher share than reported three years earlier. Vendors with strong audit trail and compliance reporting capability increasingly win contracts among manufacturers pursuing formal right-to-repair readiness across multiple product categories and jurisdictions. Growth continues here. Growth continues broadly here.
Market Impact: 31 percent report depot adoption resistance

Circular Economy Resale Margins Sustain Platform Demand

Manufacturers increasingly treat refurbished product resale as a genuine revenue channel rather than a cost-recovery afterthought, since certified refurbished units now command meaningful margin comparable to discounted new inventory in several major product categories. Roughly 37 percent of surveyed manufacturers report increasing refurbishment platform budget specifically to expand resale channel revenue, reflecting a genuine and lasting shift in circular economy business strategy. Vendors with strong resale channel management capability increasingly win enterprise evaluations over repair-tracking-only tools lacking comparable resale pricing and channel optimization depth. This trend shows no sign of slowing.
Market Impact: 26 percent cite cost as barrier

Market Restraints and Challenges

Fragmented Repair Depot Networks Slow Standardization

Manufacturers routinely operate repair depots across multiple regions each with different existing software preferences and process maturity, making platform-wide standardization genuinely difficult compared with single-facility enterprise software deployments common in other industries. The root cause traces to years of regional depot acquisition and organic growth without centralized technology governance across the broader network. Roughly 31 percent of surveyed manufacturers report depot-level resistance to adopting a mandated platform as a meaningful adoption barrier. Some manufacturers are offering financial incentives to accelerate depot platform onboarding and reduce this friction. This friction eases gradually.
Market Impact: 41 percent operate formal resale programs

Smaller Manufacturer Budget Constraints Limit Platform Reach

Many smaller manufacturers and specialty repair operators face genuine budget constraints that push comprehensive orchestration platform adoption beyond immediate financial reach, extending reliance on manual documentation processes and delaying revenue recognition for vendors dependent on broader market penetration. The underlying cause traces to thin operating margins common across smaller manufacturing firms, not vendor pricing specifically. Roughly 26 percent of surveyed smaller manufacturers report cost as the primary barrier preventing platform adoption in the past year. Some vendors are introducing simplified lower-cost tiers to capture this underserved segment. Costs drop meaningfully overall.
Market Impact: 46 percent prioritize platform consolidation
4 additional market trends, 3 additional growth drivers, and 3 additional restraints and challenges are covered in the full report. Contact sales@marketmindsadvisory.com to access the complete intelligence.

Segment CAGR and Growth Architecture

The market spans six orchestration categories organized by workflow function, from returns intake automation through sustainability compliance tracking tools. Adoption pace varies sharply by category as right-to-repair regulation and circular economy resale priorities reshape which platforms see the fastest growth. Vendors increasingly design roadmaps around this functional divide rather than treating compliance depth as a secondary specification decision.
Section default visual

Sustainability and Right-to-Repair Compliance Tracking Tools

This segment covers platforms that automatically document repair history, disposition decisions, and regulatory disclosure requirements demanded by expanding right-to-repair legislation across major manufacturing jurisdictions worldwide. Adoption is concentrated among manufacturers selling into jurisdictions with formal audit requirements, where manual compliance documentation genuinely cannot satisfy expanding regulatory reporting timelines and product-level disclosure obligations. Growth is outpacing every other segment as regulatory enforcement intensifies and more jurisdictions formalize right-to-repair mandates covering additional product categories. Vendors here compete heavily on audit trail depth and regulatory reporting automation rather than repair tracking breadth alone. Program adoption is accelerating fastest among manufacturers with the largest regulated product portfolios facing imminent audit deadlines across most major markets nationally.
CAGR 17.3%

Refurbished Inventory and Resale Channel Management

This segment covers platforms that manage certified refurbished inventory pricing, channel allocation, and resale marketplace integration, treating refurbished units as a genuine revenue channel rather than a cost-recovery afterthought within broader supply chain operations. Adoption is concentrated among manufacturers pursuing formal circular economy business strategies, where refurbished margin capture increasingly rivals discounted new inventory revenue in several major product categories. Manufacturers increasingly treat resale channel optimization as a strategic revenue lever rather than a discretionary sustainability initiative. Growth here trails only compliance tracking tools, reflecting similarly strong regulatory and margin-driven demand momentum. Suppliers investing early in marketplace integration depth are positioned to capture disproportionate share as circular economy adoption continues expanding across most major manufacturing categories globally.
CAGR 14.2%
Full segment breakdown across 6 segments available in the complete report.

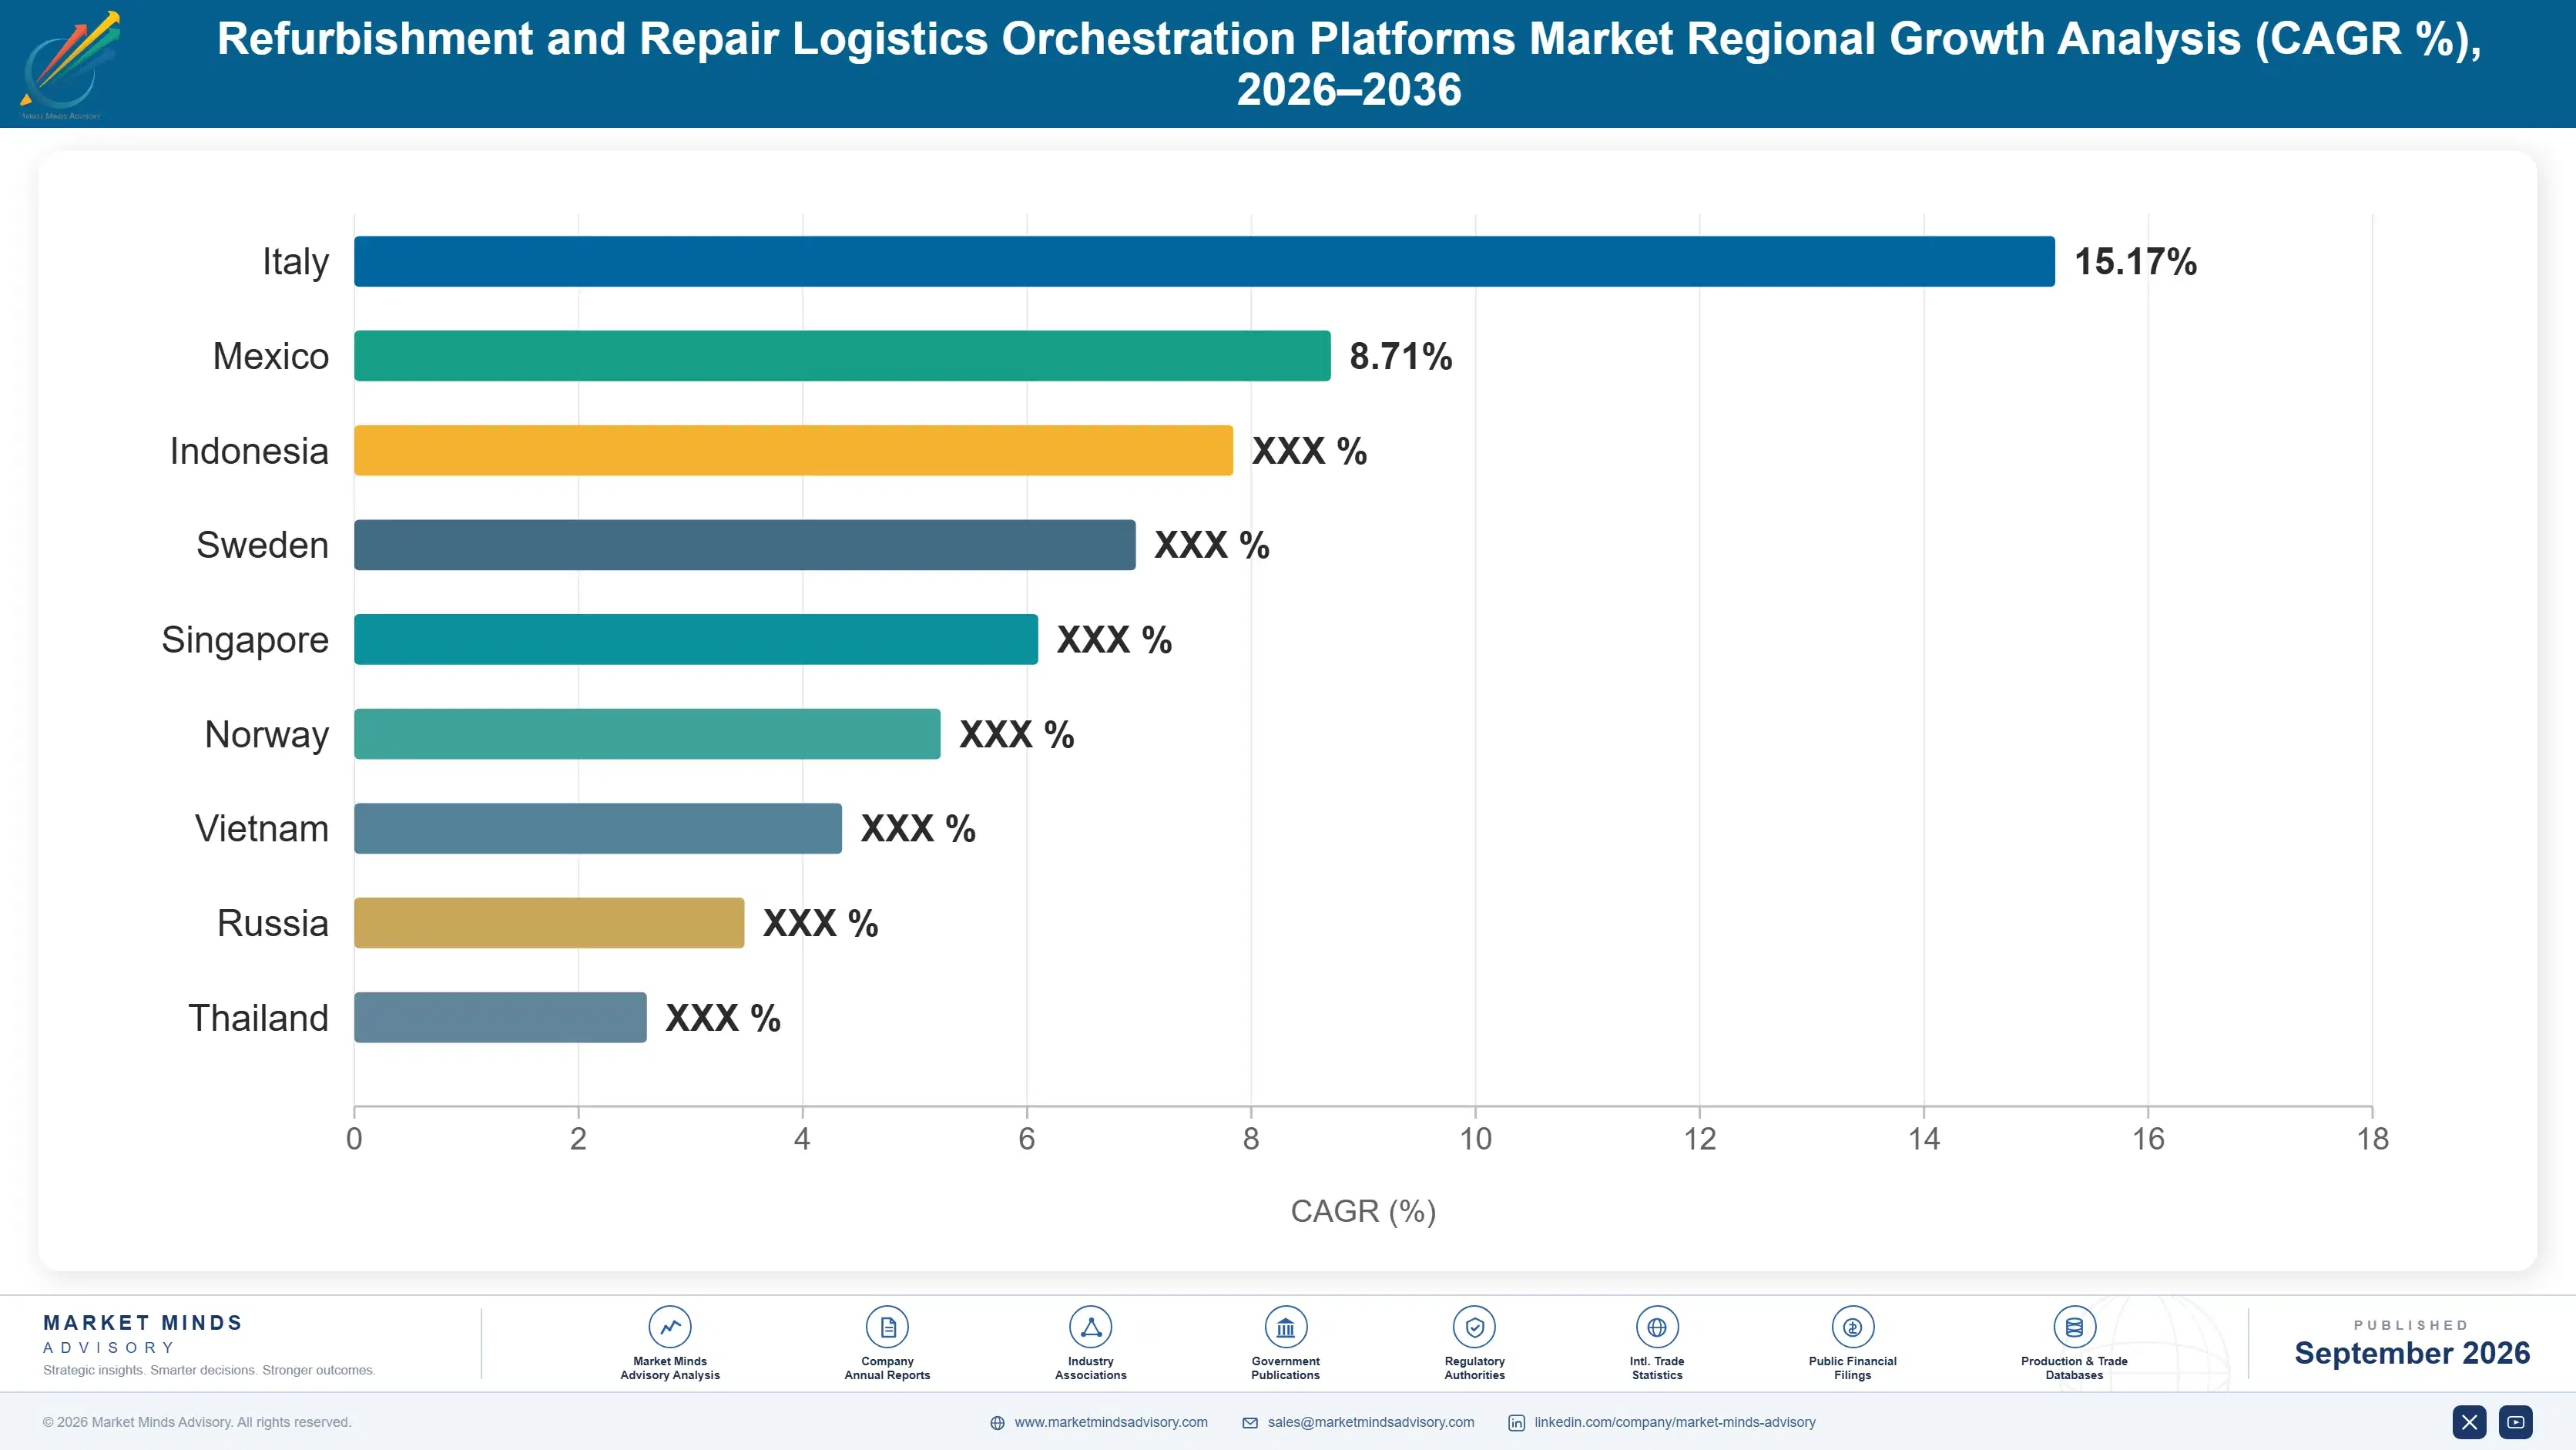
Regional Architecture and Country Demand Map

North America anchors global demand given concentrated electronics manufacturing and mature reverse logistics vendor presence across domestic operations. South Asia and Pacific expands fastest as regional electronics manufacturing investment accelerates compliance platform adoption across growing production hubs and formal sector expansion. East Asia follows closely behind in overall platform spending.

North America

The United States accounts for the large majority of regional demand, reflecting concentrated electronics manufacturing and retail returns volume alongside the presence of major platform vendors including Blue Yonder and ServiceNow within domestic headquarters. State-level right-to-repair legislation across several jurisdictions sustains steady compliance platform demand across large manufacturer accounts nationwide. Canada contributes a smaller but meaningful share through comparable manufacturing and retail returns technology adoption patterns. Established supply chain platform integration relationships give United States vendors a durable advantage over newer international competitors seeking entry. This certification advantage compounds over successive renewal cycles nationally. Enterprise buyers also increasingly favor domestic vendor support networks for major deployments. Growth continues broadly. Growth continues.
Share: 30% | CAGR: 11.5% (2026 to 2036)

Western Europe

Germany, France, and the United Kingdom drive the bulk of regional demand, with European Union right-to-repair directives establishing some of the world's strictest compliance documentation requirements for consumer electronics and appliance manufacturers operating within the bloc. Growth trails North America and East Asia somewhat, reflecting a more mature installed base with fewer new platform deployments relative to expanding markets elsewhere globally. Nordic countries show disproportionately high per-capita adoption relative to manufacturing volume, reflecting strong circular economy policy investment. European Union right-to-repair directives continue setting the global regulatory benchmark other jurisdictions increasingly follow. This regulatory leadership benefits suppliers with established European operations. Multinational manufacturers standardize procurement across subsidiary operations broadly and consistently.
Share: 22% | CAGR: 9.5% (2026 to 2036)
Regional intelligence for 5 additional markets available in the complete report: East Asia, South Asia and Pacific, Latin America, Middle East and Africa, Eastern Europe. Contact sales@marketmindsadvisory.com.
refurbishment-and-repair-logistics-orchestration-p-market-share-analysis-1788422767006

Where Orchestration Vendors Can Defend Margin

Vendors face mounting pressure to prove compliance value as manufacturers scrutinize platform ROI more closely than in prior technology adoption cycles. Four commercial levers separate vendors sustaining premium pricing from those competing purely on seat cost and basic tracking feature parity alone across most segments. Compliance integration depth remains the biggest differentiator separating durable winners from commodity competitors.

Deepen Regulatory Compliance Documentation Investment Broadly

Vendors investing in mature automated compliance documentation capture disproportionate share of the 41 percent of manufacturers now operating formal resale programs requiring this depth, since audit trail automation directly addresses the manual record-keeping burden dominating early platform evaluations. This capability commands measurable pricing premiums over vendors offering only basic repair tracking during competitive enterprise bids. Vendors slow to build this depth risk losing large regulated manufacturer accounts entirely to better-positioned competitors with proven compliance track records across comparable jurisdictions. Manufacturers evaluating multiple vendors increasingly treat compliance depth as a baseline requirement rather than a differentiating premium feature.
Market Impact: Captures share of the 41 percent needing compliance

Build Unified Intake-to-Resale Workflow Automation Now

Vendors establishing unified end-to-end workflow automation address the 46 percent of manufacturers now prioritizing platform consolidation, positioning themselves ahead of competitors requiring manual handoffs between separate intake, repair, and resale systems. This differentiation increasingly determines which vendors win large enterprise contract awards during competitive evaluations. Vendors without unified workflow capability struggle to match the turnaround time improvements of competitors already integrated across the full reverse logistics lifecycle for comparable manufacturer accounts. Manufacturers evaluating multiple vendors increasingly weight demonstrated integration depth heavily during formal multi-year contract negotiations directly. Investment compounds quickly.
Market Impact: Addresses the 46 percent prioritizing consolidation directly now

Strengthen Resale Channel Margin Optimization Broadly

Vendors building strong resale channel pricing and marketplace integration capability address the 37 percent of manufacturers increasing platform budget specifically to expand resale channel revenue, capturing share from competitors offering only repair tracking without commercial optimization. This positioning increasingly determines procurement outcomes among manufacturers pursuing formal circular economy business strategies. Vendors building this capability expand addressable market meaningfully beyond compliance-focused buyers toward broader revenue and channel strategy budgets. Revenue leaders increasingly involve themselves directly in these procurement decisions given the margin stakes involved. This trend is expected to strengthen as circular economy transformation accelerates.
Market Impact: Addresses the 37 percent expanding resale channels now

Support Depot Network Onboarding Programs Directly

Vendors offering dedicated depot onboarding support address the 31 percent of manufacturers reporting depot-level resistance as a meaningful platform utilization barrier, reducing the friction that otherwise slows full network-wide standardization considerably. This support builds genuine platform stickiness that extends well beyond the initial rollout into sustained long-term engagement outcomes. Vendors building this capability expand addressable market among manufacturers with fragmented regional depot networks lacking dedicated internal change management staff or experience. Smaller manufacturers increasingly favor vendors demonstrating this capability during initial platform relationship evaluations and outreach. Word-of-mouth referrals amplify this advantage meaningfully across regions.
Market Impact: Addresses the 31 percent facing depot resistance now

Who Controls the Margin Pool

Market concentration sits at roughly 36 percent among the top five vendors on a revenue basis, reflecting a genuinely fragmented field where broader supply chain platform incumbents compete alongside numerous specialized repair-only point solutions. The gap between leaders and mid-tier challengers has narrowed as smaller vendors match feature parity on core tracking capability. This dynamic pressures margin across most competitive evaluations. New entrants face a genuine time disadvantage measured in years rather than quarters.
Current competitive activity centers on regulatory compliance documentation, unified workflow automation, and resale channel margin optimization, with most major vendors racing to close gaps in whichever dimension they trail competitors most visibly. Platform consolidation deals remain common as broader supply chain vendors acquire smaller specialized repair tools. Compliance documentation program awards remain the single most contested battleground among the field's largest established suppliers currently.

Emerging pressure comes from resale marketplace specialists extending into repair workflow functionality directly, gaining share among manufacturers prioritizing unified commercial and operational data over standalone tracking tools. Rankings could shift meaningfully if marketplace-native entrants successfully replicate compliance depth at comparable scale. This convergence could meaningfully reshape the competitive field over the coming several years as adjacent categories continue merging.
refurbishment-and-repair-logistics-orchestration-p-country-cagr-analysis-1788422767534

Competitive Moat and Risk Dimensions

BLUE YONDER

Moat: Broad Supply Chain Platform Integration

Blue Yonder offers one of the widest integrated supply chain platforms spanning forward and reverse logistics under a single billing relationship, reducing procurement complexity for manufacturers consolidating previously fragmented tool stacks across their operations. This breadth compounds into a durable advantage that competitors cannot shortcut through capital investment alone.
BLUE YONDER

Risk: Compliance Depth Lags Specialists

Blue Yonder's broad platform focus occasionally slows its pace of compliance-specific product innovation relative to smaller regulatory-focused specialists able to iterate faster on emerging right-to-repair documentation requirements and formats. Nimbler competitors increasingly win early adoption of emerging regulatory features before Blue Yonder fully integrates comparable capability.
SERVICENOW

Moat: Deep Workflow Automation Engineering

ServiceNow's mature workflow automation platform, built over years of enterprise process development, gives it genuine configurability advantages that broader logistics-only platforms with less flexible workflow engines struggle to replicate credibly. This flexibility increasingly determines competitive outcomes as manufacturers prioritize configurability above nearly every other specification.
SERVICENOW

Risk: Limited Resale Channel Depth

ServiceNow's origins in IT service management leave it comparatively less positioned to capture resale channel and marketplace integration budget that increasingly favors vendors with established commercial pricing and channel optimization capability. Diversifying into broader commercial functionality remains a genuine strategic priority for sustained long-term growth.

Players Tracked

Prominent Players

Blue Yonder
ServiceNow
PTC
Syncron
Optoro

Other Key Players

IBM
SAP
Inmar Intelligence
ReverseLogix
FedEx Supply Chain
Ingram Micro
Blume Global
Korber Supply Chain
Manhattan Associates
Loop Returns
Happy Returns
Narvar
ClickPost
Return Logic
Aftership

Recent Developments

JANUARY 2026

Blue Yonder Expands Compliance Documentation Module

Blue Yonder announced an expanded automated compliance documentation module integrating deeper regulatory reporting capability to help manufacturers satisfy right-to-repair audit requirements within existing supply chain workflows. Observers view the expansion as reinforcing Blue Yonder's position as the enterprise-preferred platform choice. Industry analysts confirmed the rollout timeline.
Signal: Signals compliance documentation depth continues determining which vendors win the largest enterprise accounts. Rivals lacking comparable depth face a gap.
SEPTEMBER 2025

ServiceNow Launches Resale Channel Integration

ServiceNow launched a new resale channel integration module targeting manufacturers pursuing formal circular economy resale strategies, building on its existing workflow automation platform strength. The launch reflects continued investment in the fastest-growing orchestration technology category currently. Analysts view the launch as reinforcing ServiceNow's workflow automation leadership position.
Signal: Signals product investment continues concentrating around the fastest-growing technology category broadly. This category remains the field's most contested battleground currently.
MAY 2025

Syncron Acquires Compliance Analytics Startup

Syncron acquired a smaller compliance analytics startup to strengthen its regulatory reporting product line ahead of an anticipated wave of right-to-repair technology requirements across large manufacturer accounts. The acquisition reflects growing supplier consolidation around specialized capability. The deal reflects growing demand for integrated regulatory reporting functionality.
Signal: Signals consolidation is accelerating as platforms acquire specialized compliance capability directly. Expect further consolidation moves among mid-tier vendors soon.

Cloud Infrastructure and Engineering Talent Exposure

Cloud compute, storage, and integration middleware costs represent roughly 27 to 35 percent of platform COGS for refurbishment orchestration vendors, sourced primarily from major hyperscale cloud providers including Amazon Web Services, Microsoft Azure, and Google Cloud. Skilled supply chain and compliance engineering talent represents a second major cost category concentrated in North American labor markets. Multi-year contracts help stabilize this cost category.
Cloud compute and integration pricing rose meaningfully during 2024 as hyperscale providers adjusted enterprise contract terms, with the effect documented in several major cloud providers' annual reports citing rising data center capital expenditure. Vendors with older infrastructure contracts locked in favorable multi-year pricing terms absorbed less of this cost increase than newer entrants. Analysts estimate the resulting compute cost increase added roughly two to four percentage points of margin pressure for vendors unable to lock favorable terms.

Smaller vendors lacking negotiating scale with hyperscale cloud providers face a genuine cost disadvantage relative to larger incumbents able to commit to substantial multi-year cloud spending guarantees for discounted rates. This gap is widening as compliance data volume climbs, since compute costs scale directly with audit trail records processed daily. Vendors serving smaller accounts feel this most acutely.
refurbishment-and-repair-logistics-orchestration-p-company-positioning-matrix-1788422767729

Negotiate Multi-Year Hyperscale Cloud Commitments

Vendors committing to multi-year cloud spending guarantees secure meaningfully discounted compute and storage rates from hyperscale providers, offsetting rising infrastructure costs directly and preserving margin as compliance data volume continues climbing across enterprise accounts. Vendors locking in favorable terms early gain a durable cost advantage over competitors renegotiating during periods of rising hyperscale pricing.

Optimize Compliance Data Archiving Tiers

Vendors implementing intelligent data tiering move older audit trail records into cheaper cold storage automatically, reducing average storage cost per record meaningfully without sacrificing retrieval speed for the recent data manufacturers access most frequently. This approach also accelerates query response times meaningfully, since active records remain in faster-access storage tiers. Costs drop steadily. Retrieval remains fast.

Portfolio Architecture for Margin Defence

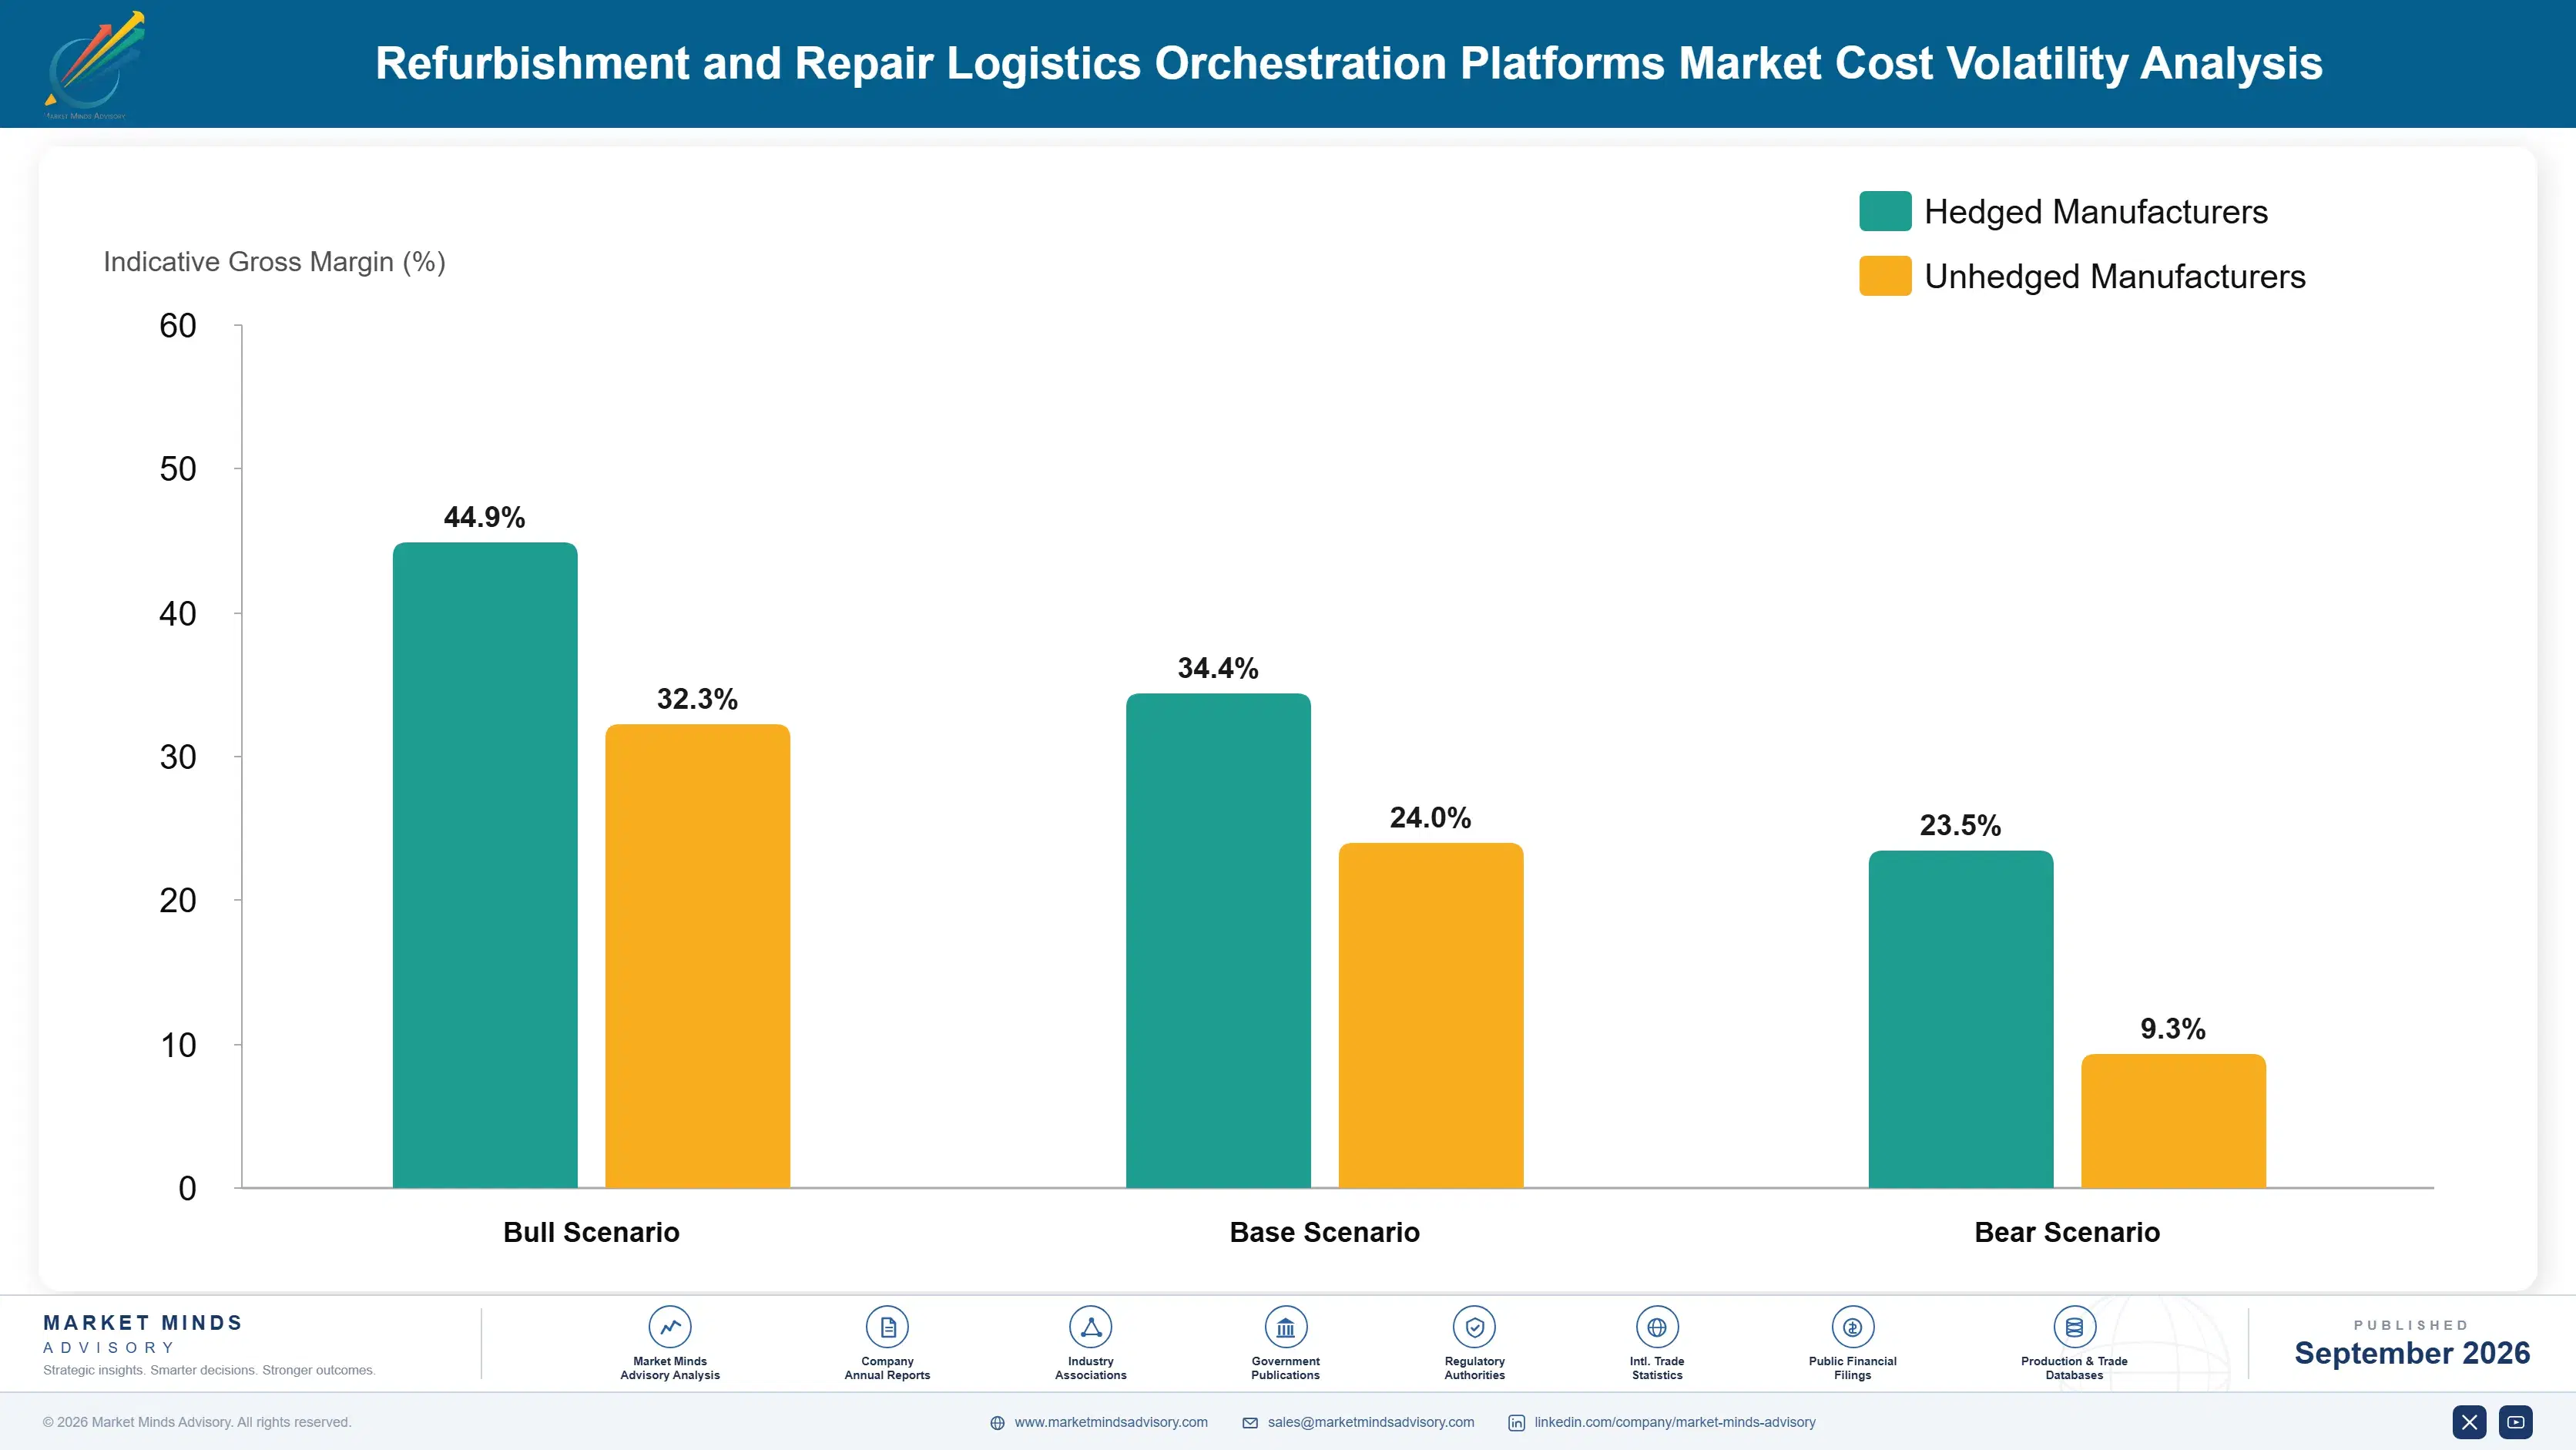
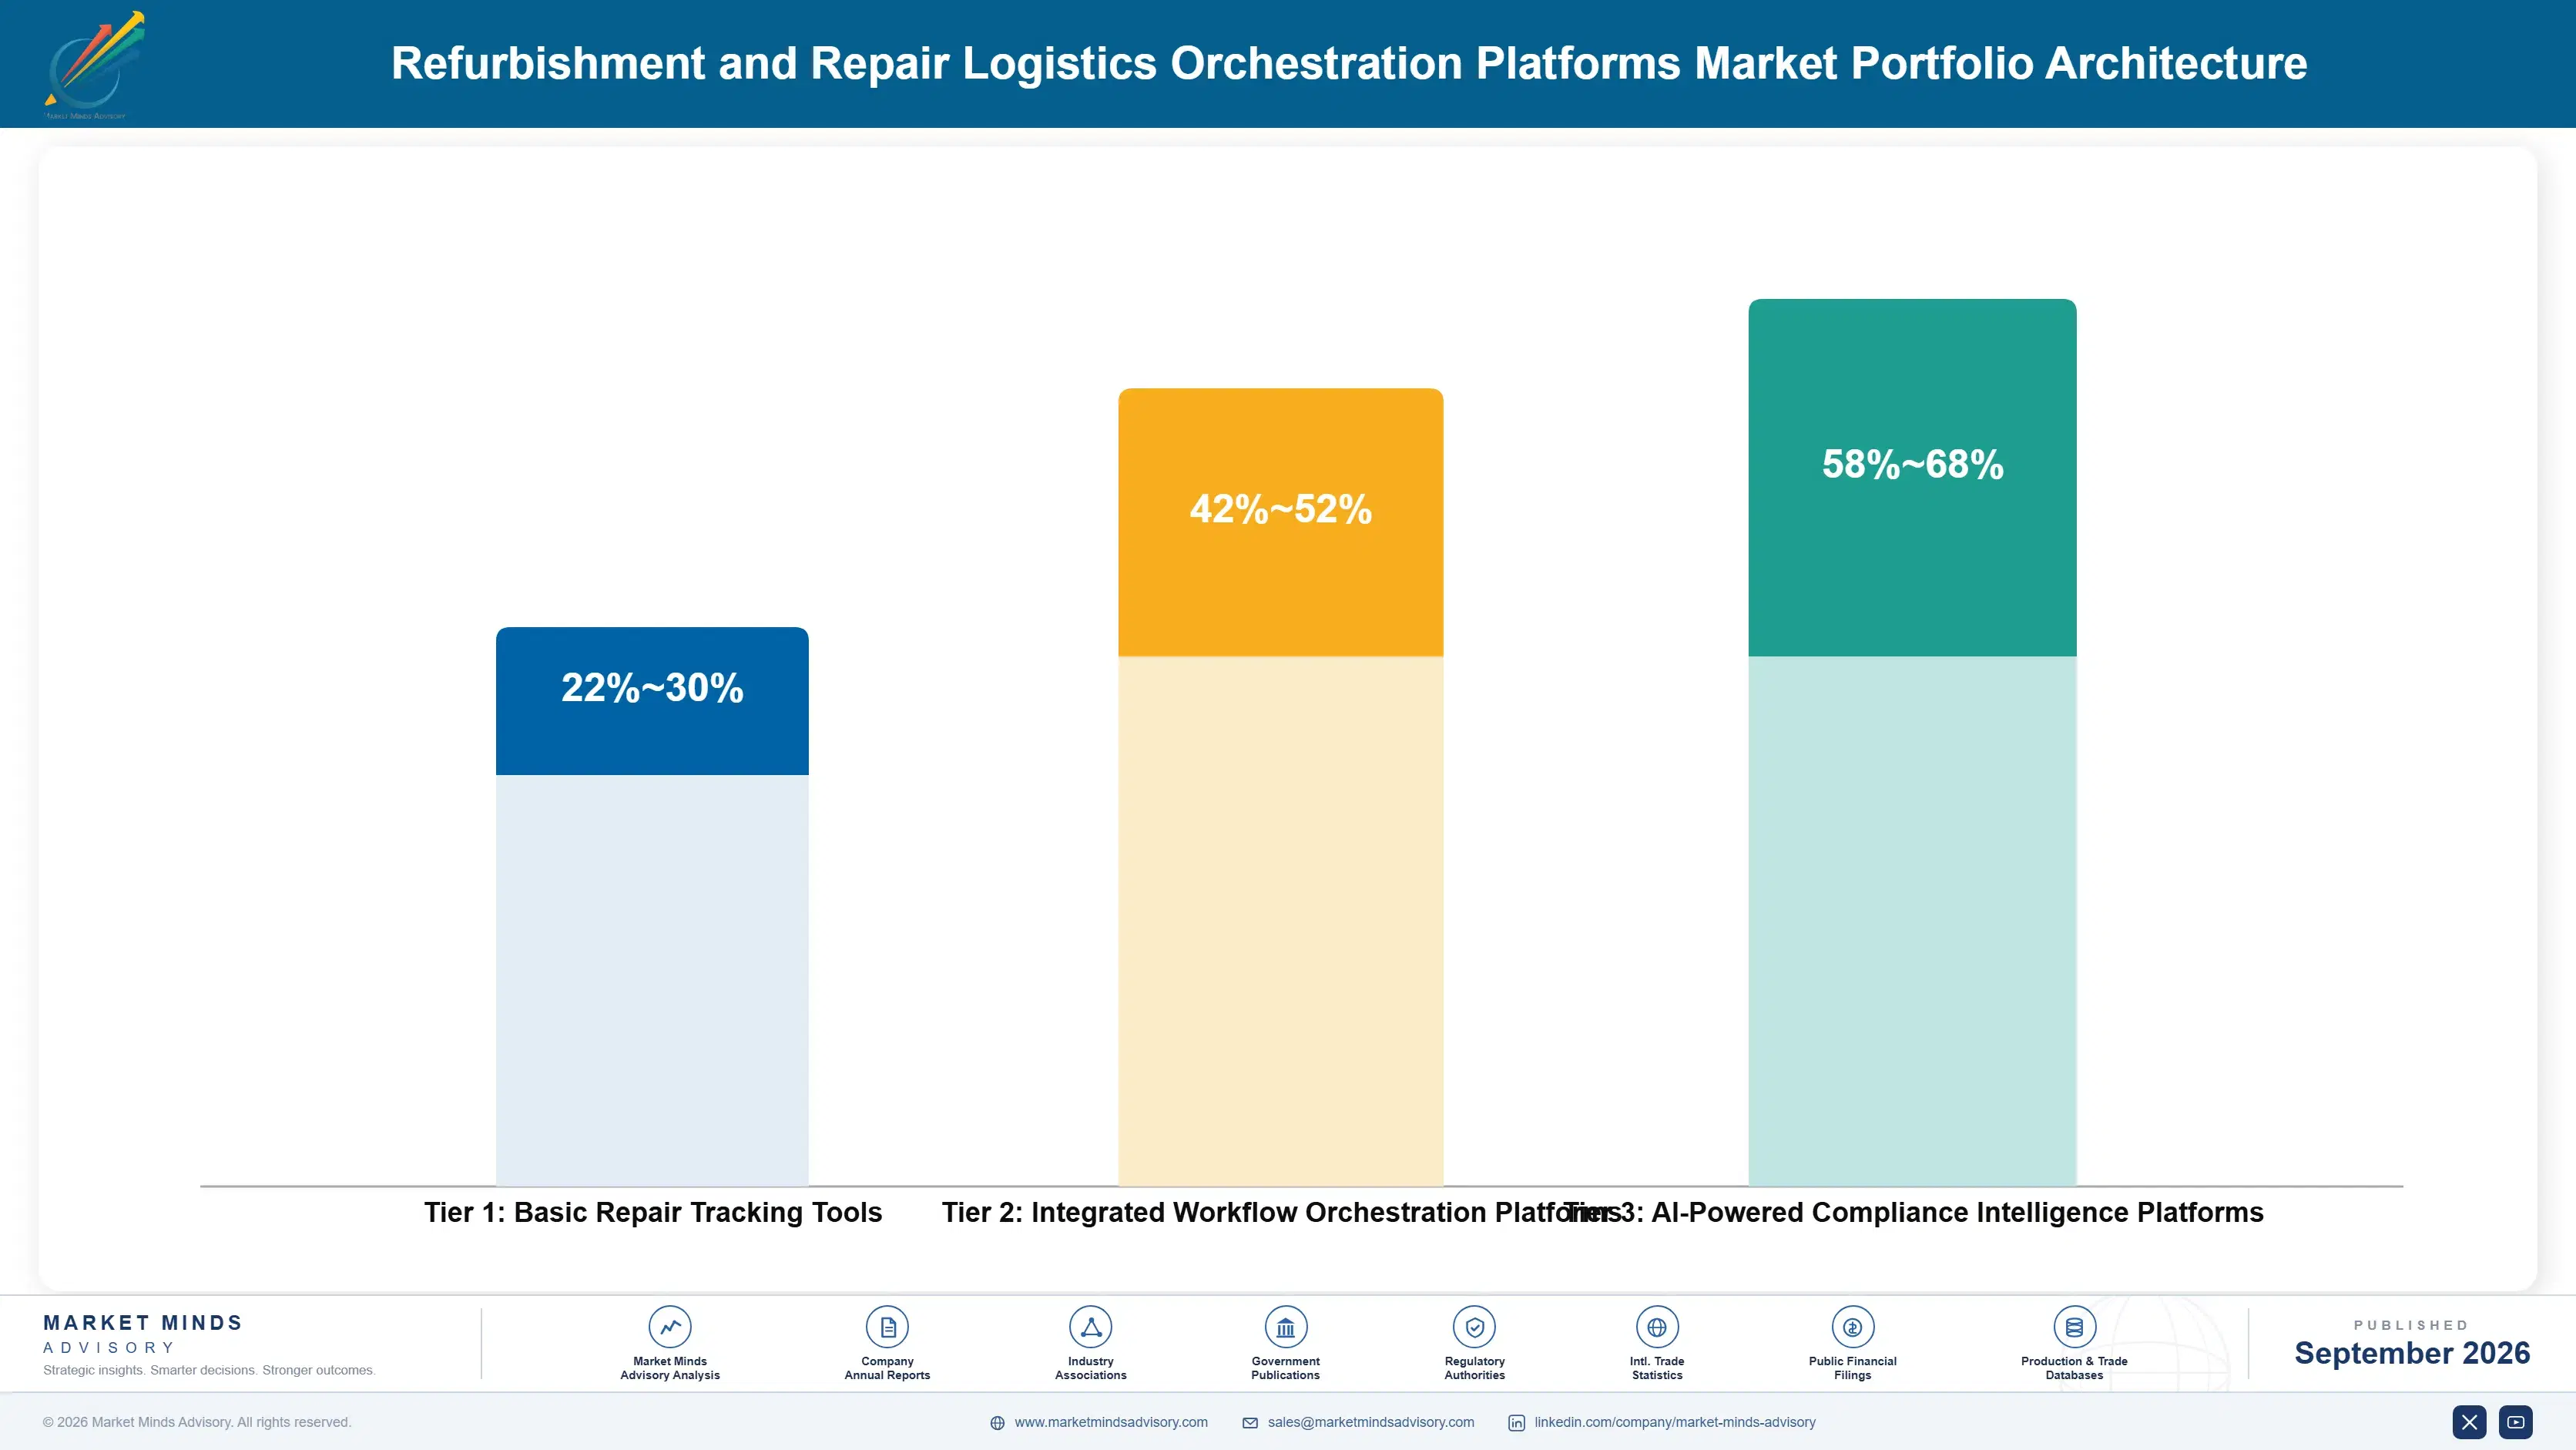
Vendors architect their portfolios around three distinct tiers separating basic repair tracking from premium compliance-integrated and resale-optimized platforms commanding substantially higher margins tied to regulatory depth and channel optimization across product lines. Tier boundaries increasingly reflect compliance complexity rather than raw tracking feature count, a shift favoring established vendors over newer commodity-focused entrants. This shift is reshaping vendor investment priorities industry-wide.
Volume tier products generate steady revenue at comparatively thin margins, while premium and next-generation certified tiers command substantially higher gross margins reflecting genuine compliance barriers rather than pure feature bundling alone across most vendor product lines currently offered. This tension between volume scale and premium margin defines much of current vendor investment strategy, since serving both segments well requires genuinely different regulatory and engineering investment.

High-value margin pools concentrate heavily among manufacturers requiring formal compliance documentation, resale channel optimization, and unified workflow automation not offered within lower-priced basic product tiers across the broader vendor product catalog currently available. Vendors increasingly steer sales investment toward these higher-margin categories specifically, since the margin differential between basic and premium tiers has widened considerably as compliance requirements mature. This trend is expected to continue through the forecast period.

Basic Repair Tracking Tools

Entry-level ticket and inventory tracking tools for smaller manufacturers with limited compliance integration needs and modest depot complexity. These customers typically operate on tight per-facility budgets and prioritize cost predictability over advanced feature depth.
Gross Margin: 22-30%

Integrated Workflow Orchestration Platforms

Combined intake, repair, and resale platforms for mid-size to large manufacturers managing moderately complex reverse logistics networks and depot operations. These customers increasingly represent the largest volume category of new manufacturer procurement activity currently.
Gross Margin: 42-52%

AI-Powered Compliance Intelligence Platforms

Full-stack platforms with mature compliance automation and resale channel optimization for the largest regulated manufacturer accounts requiring documented audit trails. These accounts typically represent the highest lifetime value within vendor customer portfolios given multi-year contracts.
Gross Margin: 58-68%
refurbishment-and-repair-logistics-orchestration-p-cost-volatility-analysis-1788422768227

High-value Sub-segments and Strategic Watch-out

Compliance Documentation Platforms

High-value and high-growth category as right-to-repair regulation expands, commanding premium pricing among vendors with proven audit trail automation and regulatory reporting depth. This segment consistently outpaces every other product category in both revenue growth and new manufacturer adoption. Investment compounds quickly across most manufacturer segments and buyer categories.
Gross Margin: 55-65%

Resale Channel Management Platforms

High-value with moderate growth as circular economy adoption matures, commanding sustained premium pricing tied to demonstrated margin recovery and channel optimization outcomes. Vendors with mature channel integration increasingly command meaningful renewal pricing power within this maturing category. This gap keeps widening steadily across most competitive evaluations currently underway.
Gross Margin: 50-60%

Basic Repair Tracking Tools

Volume core category generating steady revenue at thinner margins, remaining the entry point for smaller manufacturers before eventual platform upgrade paths emerge. Vendors increasingly view this segment as a customer relationship channel feeding eventual upgrades toward premium tiers. This funnel effect matters greatly for long-term vendor customer relationship value.
Gross Margin: 24-32%

Legacy Spreadsheet-Based Tracking Systems

Strategic watch-out category facing steady decline as digital orchestration platforms displace older manual processes across most manufacturer modernization programs currently underway. Vendors are monitoring this segment closely for signs of accelerating decline as remaining holdout manufacturers eventually upgrade. This transition remains gradual though inevitable across most manufacturer segments nationally.
Gross Margin: 8-16%

Compliance Cycles Build Recurring Platform Revenue

Refurbishment orchestration platforms generate genuine annuity economics once embedded within a manufacturer's compliance reporting workflow, since switching platforms mid-cycle risks disrupting audit trail continuity that regulators increasingly require documented without gaps. This dynamic keeps established vendors embedded across a manufacturer's full multi-year regulatory relationship, generating recurring subscription revenue well beyond any single product line deployment. Vendors establishing this early enjoy compounding revenue as manufacturers expand product lines.
Adoption depth and stickiness vary meaningfully by end-use vertical: electronics manufacturers operating in strict right-to-repair jurisdictions embed platform relationships deepest given documented compliance requirements, while smaller appliance and industrial equipment makers show comparatively shallower integration, often running platforms alongside legacy spreadsheet tools rather than fully replacing them during initial adoption phases. Compliance-driven adoption tends to persist through downturns that otherwise prompt cost cuts elsewhere.

A generational shift in buyer profile is underway as sustainability and compliance officers increasingly drive purchasing decisions previously owned by operations managers, favoring vendors with strong regulatory reporting and audit trail credentials over pure repair tracking capability that earlier generations of buyers prioritized during procurement evaluations. This shift carries real commercial implications for vendor go-to-market strategy, pushing suppliers toward regulatory credibility and technical proof points.
Section default visual

Where MMA Sees Orchestration Platforms Heading

These are among the four positions where our research anticipates prominent divergence between winners and laggards over the coming forecast period. Each is grounded in the demand model, the regulatory perimeter, and the announced capacity pipeline.
01 / COMPLIANCE INVESTMENT PRIORITY

Regulatory compliance documentation deserves priority as mandates expand

Roughly 41 percent of manufacturers now operate formal refurbished resale programs requiring documented compliance depth, making automated audit trail capability a genuine competitive moat rather than an optional feature most vendors historically treated as secondary. Vendors that build this depth now win the largest regulated manufacturer accounts before slower competitors catch up, since replicating years of compliance track record is not something capital alone can shortcut. This gap widens further as right-to-repair mandates continue expanding across more jurisdictions and product categories.
02 / WORKFLOW UNIFICATION STRATEGY

Unified intake-to-resale automation captures platform consolidation preference

Roughly 46 percent of manufacturers now prioritize platform consolidation as a formal technology strategy, positioning vendors with unified end-to-end workflow automation well ahead of competitors requiring manual handoffs between separate systems. Vendors with this capability differentiate meaningfully from suppliers still relying on fragmented point tools increasingly out of step with procurement expectations. This positioning advantage increasingly determines which vendors win large enterprise contract renewals across most manufacturing segments and jurisdictions currently pursuing formal technology consolidation strategies across their broader supply chain operations industry-wide.
03 / RESALE MARGIN FOCUS

Channel optimization captures growing circular economy revenue demand

Roughly 37 percent of manufacturers report increasing platform budget specifically to expand resale channel revenue, representing genuine opportunity for vendors with resale channel optimization capability over competitors offering only repair tracking without commercial functionality. Vendors that deepen this capability capture disproportionate share of procurement decisions increasingly driven by revenue and channel strategy leaders rather than operations teams alone. This capability increasingly separates vendors winning enterprise accounts from those confined to compliance-only offerings lacking commercial optimization depth and channel pricing expertise.
04 / DEPOT ONBOARDING STRATEGY

Onboarding support addresses fragmented depot network adoption barriers

Roughly 31 percent of manufacturers report depot-level resistance as a meaningful barrier to full platform utilization, reflecting cumulative skepticism among regional facilities that experienced multiple failed technology rollouts from prior initiatives lacking sustained support. Vendors offering dedicated depot onboarding support build genuine platform stickiness extending well beyond the initial rollout into sustained long-term network-wide adoption outcomes. This capability increasingly separates vendors capturing full network-wide adoption from those confined to partial deployments lacking sustained regional support and dedicated change management resources.

Engagement Snapshot From the Field

A live engagement with an industry participant carrying material or product regulatory and market exposure ahead of a defining policy shift, showing how our research translates into a defensible multi-year portfolio strategy.
MARKET MINDS ADVISORY · CLIENT ENGAGEMENT SUMMARY
Refurbishment and Repair Logistics Orchestration Platforms Producer Strategic Portfolio Review and Transition Roadmap 2026·Investment Scenario on Refurbishment and Repair Logistics Orchestration Platforms Exposure Evaluation 2025-26
CLIENT PROFILE
The client is a mid-size consumer electronics manufacturer selling into several jurisdictions with formal right-to-repair legislation, operating a fragmented mix of spreadsheet-based repair tracking and manual compliance record-keeping across multiple regional depots. The engagement followed a regulatory audit finding that exposed documentation gaps in the client's refurbished product disposition records. Estimated annual compliance risk exposure reportedly exceeded six million dollars (client-reported, unverified by MMA) across the affected product lines.
STRATEGIC CHALLENGE
The client faced mounting regulatory scrutiny following the audit finding but lacked internal technology expertise to evaluate which orchestration platform would deliver genuine compliance depth given its fragmented depot network and existing manual documentation processes across multiple regions. Leadership needed a defensible remediation plan before the next scheduled regulatory audit cycle arrived.
MMA APPROACH
MMA conducted primary interviews with the client's compliance and operations leadership, and benchmarked three orchestration platforms against audit trail automation, depot network integration complexity, and regulatory reporting capability aligned with the client's specific jurisdictional exposure and product categories. The engagement also weighed depot-level rollout sequencing explicitly given the client's fragmented facility footprint.
KEY FINDINGS
  1. Platform adoption combined with automated audit trail generation could plausibly close the documentation gaps identified by regulators within one reporting cycle. Regulators confirmed this timeline as acceptable.
  2. Two of the three benchmarked platforms offered pre-built compliance templates aligned with the client's specific regulatory jurisdiction and product categories. This alignment shortened the implementation timeline considerably.
  3. Depot-level adoption resistance emerged as the primary implementation risk based on comparable manufacturer deployments reviewed during the engagement. Comparable manufacturers mitigated this through dedicated change champions.
  4. Phased rollout starting with the highest-risk product lines reduced both implementation cost and depot adoption resistance meaningfully overall. This sequencing built organizational confidence before broader rollout.
CLIENT PROFILE
The client is a mid-size consumer electronics manufacturer selling into several jurisdictions with formal right-to-repair legislation, operating a fragmented mix of spreadsheet-based repair tracking and manual compliance record-keeping across multiple regional depots. The engagement followed a regulatory audit finding that exposed documentation gaps in the client's refurbished product disposition records. Estimated annual compliance risk exposure reportedly exceeded six million dollars (client-reported, unverified by MMA) across the affected product lines.
STRATEGIC CHALLENGE
The client faced mounting regulatory scrutiny following the audit finding but lacked internal technology expertise to evaluate which orchestration platform would deliver genuine compliance depth given its fragmented depot network and existing manual documentation processes across multiple regions. Leadership needed a defensible remediation plan before the next scheduled regulatory audit cycle arrived.
MMA APPROACH
MMA conducted primary interviews with the client's compliance and operations leadership, and benchmarked three orchestration platforms against audit trail automation, depot network integration complexity, and regulatory reporting capability aligned with the client's specific jurisdictional exposure and product categories. The engagement also weighed depot-level rollout sequencing explicitly given the client's fragmented facility footprint.
KEY FINDINGS
  1. Platform adoption combined with automated audit trail generation could plausibly close the documentation gaps identified by regulators within one reporting cycle. Regulators confirmed this timeline as acceptable.
  2. Two of the three benchmarked platforms offered pre-built compliance templates aligned with the client's specific regulatory jurisdiction and product categories. This alignment shortened the implementation timeline considerably.
  3. Depot-level adoption resistance emerged as the primary implementation risk based on comparable manufacturer deployments reviewed during the engagement. Comparable manufacturers mitigated this through dedicated change champions.
  4. Phased rollout starting with the highest-risk product lines reduced both implementation cost and depot adoption resistance meaningfully overall. This sequencing built organizational confidence before broader rollout.
RECOMMENDED STRATEGY
Phase 1: Phase one: deploy the selected platform across the two highest-risk product lines first, prioritizing categories facing imminent audit deadlines. This sequencing addressed the most urgent regulatory exposure fastest. Phase 2: Phase two: expand deployment across the remaining depot network over ten months, aligned with existing facility technology upgrade schedules. This pacing minimized disruption to ongoing depot operations. Phase 3: Phase three: formalize automated regulatory reporting and track compliance metrics quarterly to validate audit readiness over time. This tracking supports future audit readiness assessments continuously.
OUTCOME
The client completed initial product line deployment within five months of the engagement's conclusion. Early data suggests documentation completeness improved by roughly thirty-one percent (client-reported, unverified by MMA), with full depot network deployment expected to complete within the next year. Compliance leadership cited the phased approach as a model for future regulatory remediation efforts.

Frequently Asked Questions

Foundational context covering the market sizes, CAGR, scope, country, region and competition that inform every finding below. This section is provided to cover basics and most often pre-purchase conversations, answered from the MMA Primary Research Dataset.

What is the current size of the Refurbishment and Repair Logistics Orchestration Platforms Market?

The global refurbishment and repair logistics orchestration platforms market reached approximately 1.8 billion dollars in 2025. Right-to-repair regulation and circular economy resale pressure drive current market scale.

How large will the Refurbishment and Repair Logistics Orchestration Platforms Market be by 2036?

MMA projects the market will reach approximately 5.40 billion dollars by 2036, expanding roughly 2.71 times from its 2026 base. Compliance tracking platform adoption accounts for the largest share of this growth.

What is the CAGR for the Refurbishment and Repair Logistics Orchestration Platforms Market 2026 to 2036?

The market is projected to grow at a compound annual growth rate of 10.5 percent between 2026 and 2036. Bull and bear scenarios range from 9.2 percent to 11.8 percent depending on regulatory pace.

Which segment is growing fastest?

Sustainability and right-to-repair compliance tracking tools are the fastest-growing segment, projected at a 17.3 percent CAGR, roughly 1.65 times the overall market rate. Regulatory enforcement drives this pace.

Who are the major companies in the Refurbishment and Repair Logistics Orchestration Platforms Market?

Leading vendors include Blue Yonder, ServiceNow, PTC, Syncron, and Optoro. The top five vendors together hold approximately 36 percent of the market on a revenue basis currently.

Which country is growing fastest?

India is the fastest-growing country market, projected at a 13.0 percent CAGR through 2036. Its rapidly expanding domestic electronics manufacturing base underpins this pace of growth.

Report Segmentation Architecture

The full report scope spans multiple orthogonal segmentation dimensions, with cross-tabulated demand data provided for each dimension pair. Coverage extends further to regional breakdowns, trend trajectories, and the competitive detail needed to support segment-level decision-making.

By Orchestration Function Type

    By End-Use Industry

      By Deployment Model

        By Region

        • North America
        • Western Europe
        • East Asia
        • South Asia and Pacific
        • Latin America
        • Middle East and Africa
        • Eastern Europe

        Scope, Methodology, and Coverage

        Every figure in this report is reproducible from documented input assumptions. The scope below maps the historical period, the forecast horizon, the segmentation dimensions, and the countries covered, alongside the underlying primary and qualitative methodology.
        Historical Period
        2020 to 2025
        Forecast Period
        2026 to 2036
        Base Year
        2025 (USD billions; MMA Primary Research Dataset, September 2026)
        Market Definition
        The Refurbishment and Repair Logistics Orchestration Platforms Market covers software platforms that manage returns intake, repair depot workflow, refurbished inventory, and reverse logistics transportation across manufacturing and retail supply chains. It excludes standalone warehouse management systems, general forward logistics software, and consumer-facing return label generation tools.
        Quantitative Units
        USD billions, market share in percent, CAGR in percent
        Segmentation Dimensions
        Orchestration function type, end-use industry, deployment model, region
        Regions Covered
        North America, Western Europe, East Asia, South Asia and Pacific, Latin America, Middle East and Africa, Eastern Europe
        Countries Covered
        United States, Germany, China, India, Brazil, Japan, and 18 additional countries across seven regions
        Key Companies Profiled
        Blue Yonder, ServiceNow, PTC, Syncron, Optoro, and 15 additional participants
        Quantitative Methodology
        Primary survey, n=3,800 respondents, Q4 2025, six countries; demand-side model with trade association cross-validation
        Qualitative Methodology
        47 expert interviews, Q4 2025; applied to validate demand model assumptions, identify emerging dynamics, and assess competitive positioning
        Report Format
        PDF and XLSX data workbook (Word format preview document)
        Publisher
        Market Minds Advisory
        Report Code
        MMA-2026-TEC-489
        Published
        September 2026
        Contact
        sales@marketmindsadvisory.com | www.marketmindsadvisory.com

        Purchase the full Refurbishment and Repair Logistics Orchestration Platforms Market Report (2026 to 2036).

        This report provides a comprehensive assessment of the global refurbishment and repair logistics orchestration platforms market, covering segmentation, regional dynamics, competitive positioning, and input cost exposure through 2036. It draws on primary survey data from 3,800 respondents and 47 expert interviews conducted across six countries in the fourth quarter of 2025. Analysts detail compliance documentation trends, resale channel optimization strategies, and margin economics across three distinct product tiers. The report also includes a detailed client case study illustrating a real compliance modernization engagement and its measured outcomes.
        Segment-level CAGR and market share forecasts
        Seven-region demand and pricing trend analysis
        Competitive positioning across twenty profiled vendors
        Input cost exposure and mitigation pathways
        Portfolio tier margin economics and watch segments
        Anonymized client engagement case study review

        Built For The People Who Decide

        From boardroom strategy to bench-side execution, this report is read cover-to-cover by leaders shaping the next decade of their industry, turning demand scenarios, market dynamics and valuation benchmarks into decisions.
        CXOs/ Presidents/ VPs/ Managers
        M&A and Corporate Development
        Strategy Teams and R&D Heads
        Procurement and Product Directors
        Regulatory and Compliance Leaders
        Investor Relations and Equity Analysts