Market Minds Advisory
Refurbished Smartphone Market

Refurbished Smartphone Market: Refurbished Smartphone Market: Battery Health Disclosure, Parts Pairing and Where The Supply Actually Comes From

A refurbished phone is only as good as its battery, and the single number that decides that is disclosed on a minority of the devices actually sold in this market at all.

Lead Analyst

Published

September 2026

Make Smarter Decisions with Customized Research Insights

Request a free sample report and evaluate market opportunities, growth trends, and competitive dynamics relevant to your business needs.

2025 MARKET VALUE$42.0BMarket Size 2025
2036 FORECAST VALUE$110.7BBase Case , 2026 to 2036
CAGR 2026 TO 20369.2 %Bull 10.5% / Bear 7.9%
INCREMENTAL OPPORTUNITY$64.8BNet 10- year value creation
EXPANSION MULTIPLE2.41x2036 value over 2026 base
Strategic Levers
M&A Pipeline
Regional Outlook
Country Rankings
Competitive Intelligence
Segmental Deep-dive
Call-Us : 91 93563 13602

Executive Snapshot and Market Trajectory.

Everything about a refurbished phone comes down to one number that most sellers do not print. Battery health determines whether a device lasts three years or three months, and the grading systems here describe cosmetic condition instead. Around 31% of listings state a measured figure and the rest do not.
Certified Grade A devices with warranty grow at 13.8%, half again the market rate of 9.2%, because a warranty is the only thing that makes a used phone a considered purchase rather than a gamble. Carrier trade-in devices follow at 11.5%. Ungraded marketplace listings grow slowest at 3.7%, still carrying a large share of unit volume. Supply rather than demand is what limits everybody here.
Parts pairing is quietly reshaping who can refurbish anything. Manufacturers increasingly bind components to a device serial, which means a replaced screen or battery triggers warnings or loses function unless the repairer has authorised access. Concentration is very low at 29% held by the top five, and Brazil grows fastest at 14.6%. Right to repair legislation is pushing against that in several jurisdictions, with outcomes that differ enough that operating models are diverging by region.
Market Definition
This market covers previously owned smartphones professionally inspected, repaired and resold, spanning certified Grade A devices with warranty, Grade B and C graded devices, carrier trade-in devices, manufacturer certified pre-owned devices, ungraded marketplace listings, and parts harvesting and component recovery. Sizing is at resale transaction value. New smartphones, feature phones, tablets, peer-to-peer private sales without inspection, and repair services on customer-owned devices are excluded.
Base Year Value
$42.0B in 2025 (MMA Primary Research Dataset, September 2026)
Forecast Period
2026 to 2036, eleven discrete annual values
CAGR
9.2% base case. Bull 10.5%. Bear 7.9%.
Fastest Growth Segment
Certified Grade A Devices With Warranty: 13.8% CAGR
Fastest Growth Country
Brazil: 14.6% CAGR
Fastest Growth Region
South Asia and Pacific: 11.5% CAGR
Largest Region
East Asia: 26% of 2025 global value
Market Leaders
Back Market, Amazon Renewed, Assurant, Recommerce Group, Cashify. Source: MMA Primary Research Dataset, July 2026.
Primary Survey
n=3,800 procurement and R&D decision-makers, Q4 2025, six countries
Methodology
Demand-side build-up, cross-validated against public data, 47 expert interviews

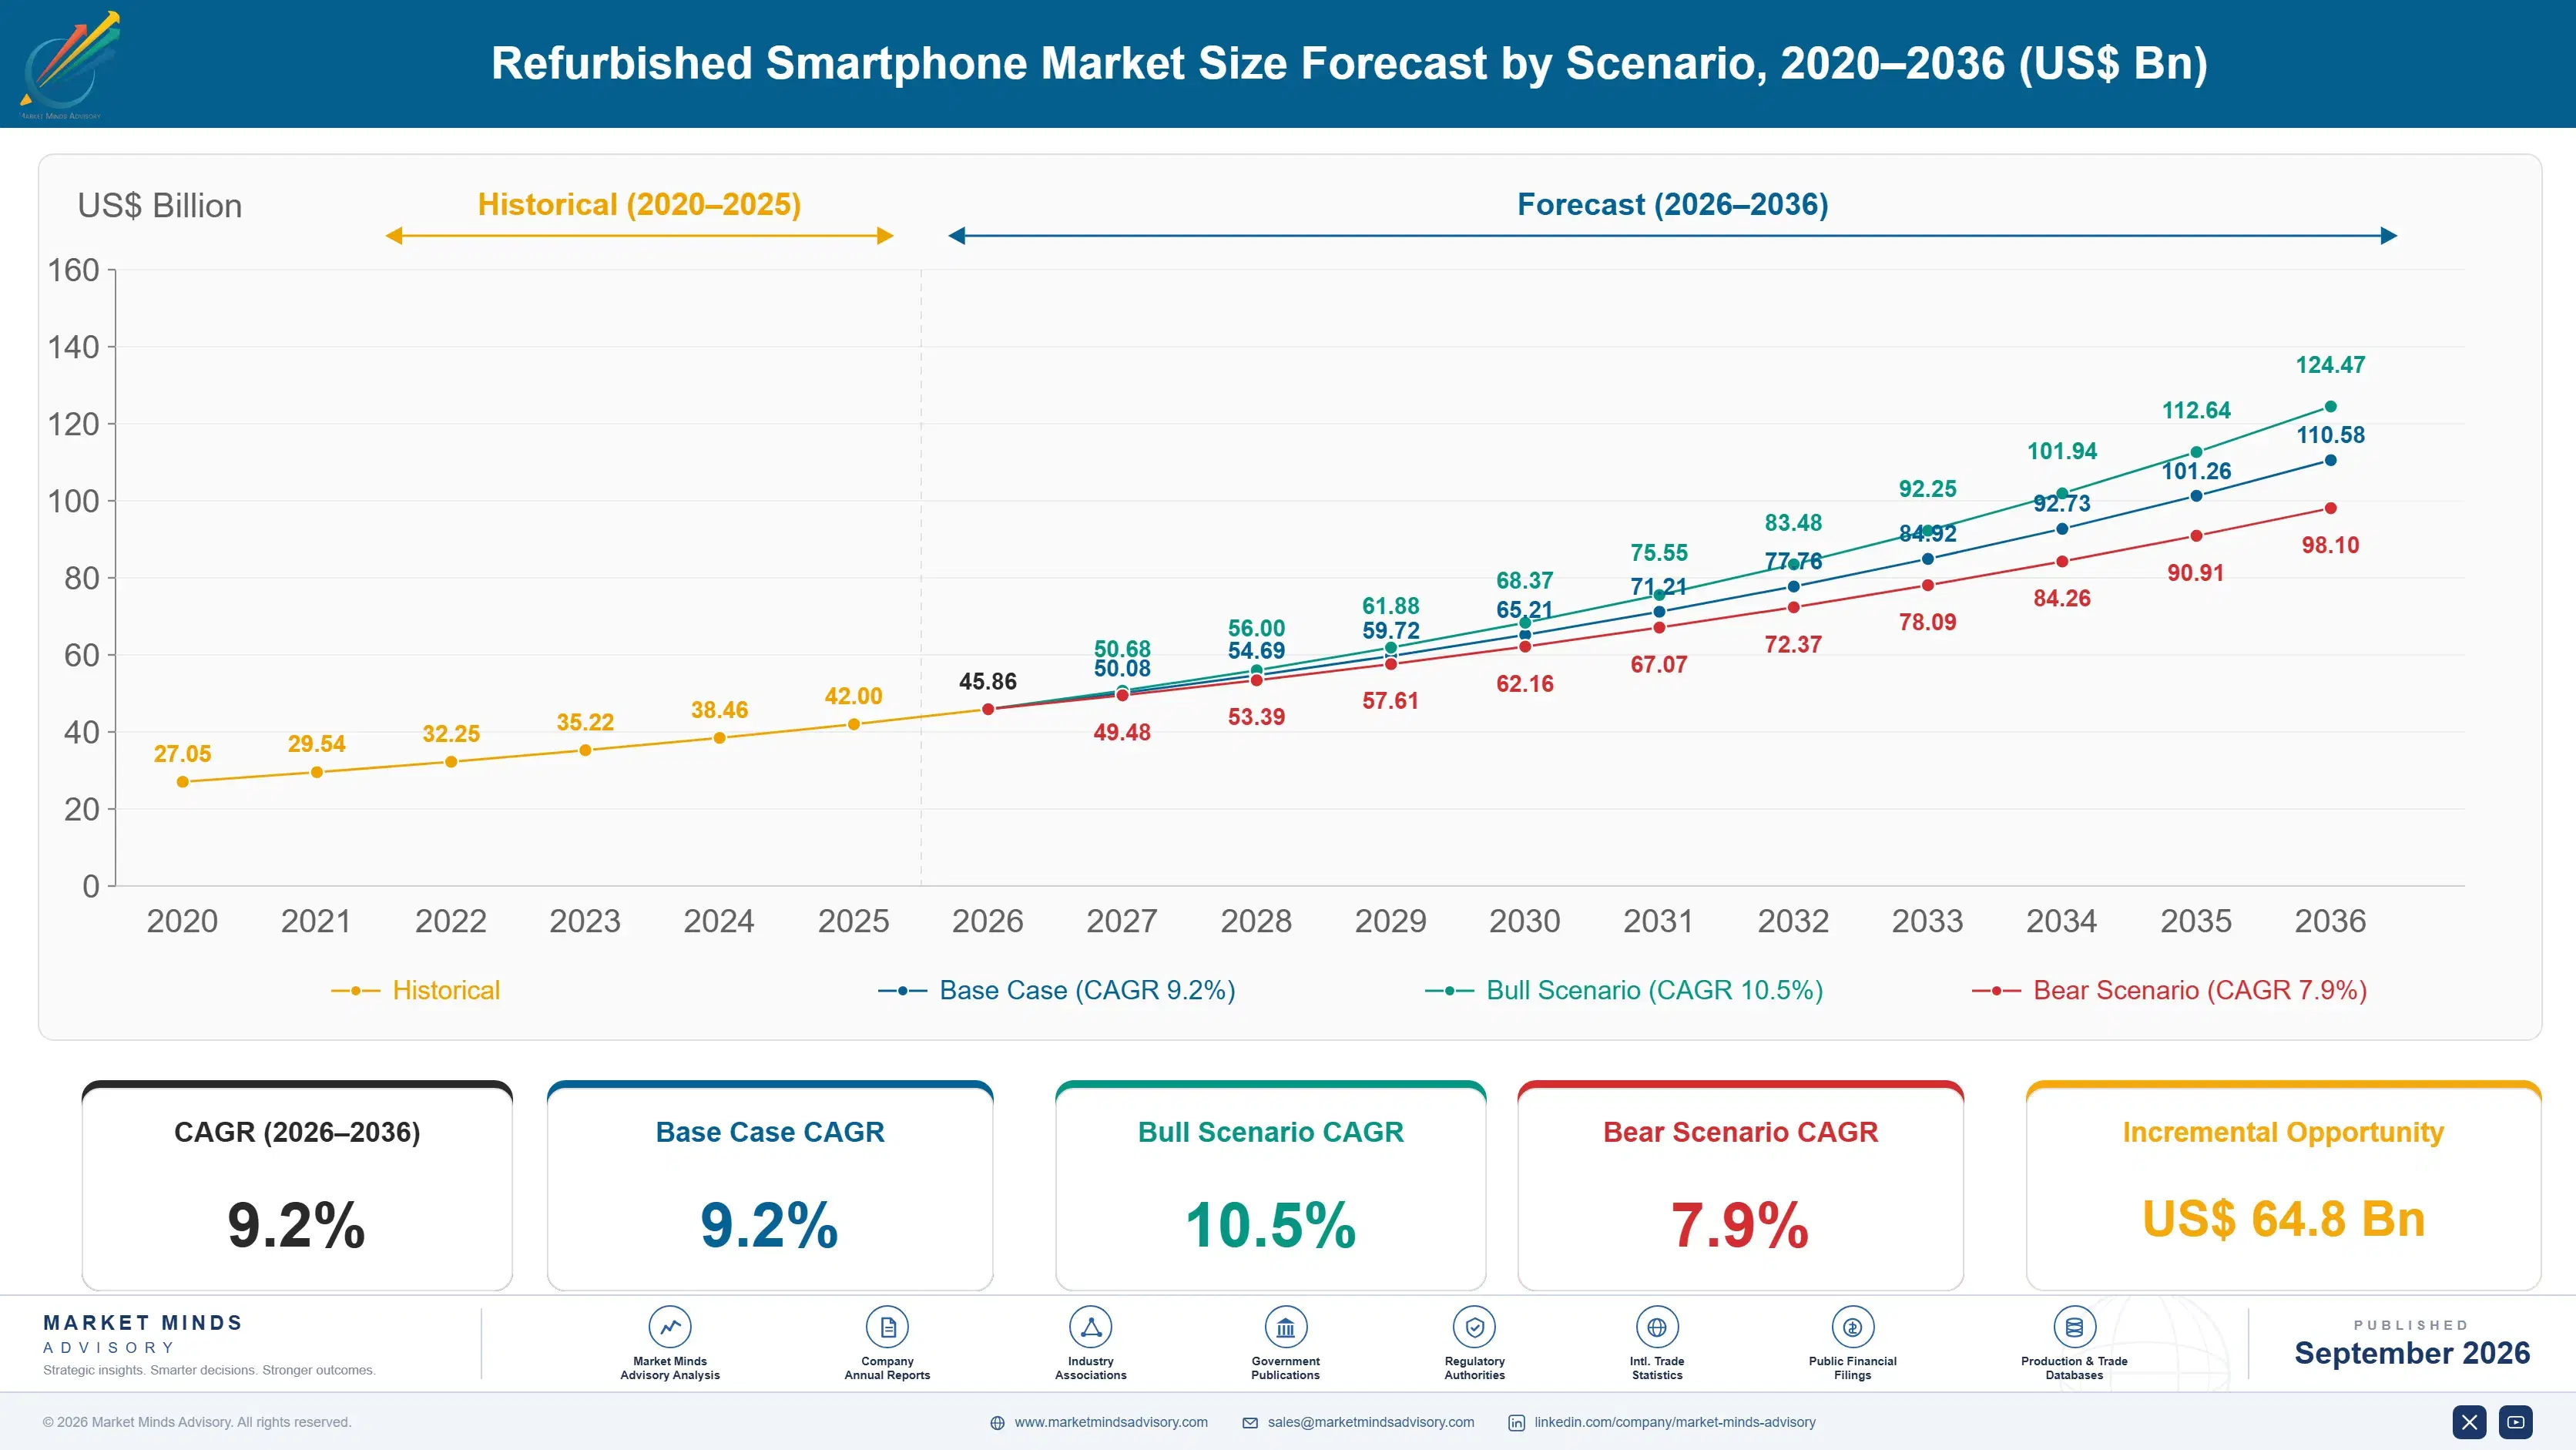
Refurbished Smartphone Market Forecast Scenarios

refurbished-smartphone-market-size-forecast-scenario-1790024505967
Growth of 7.9% between 2020 and 2025 was driven by new device prices rising faster than incomes across most markets. Flagship pricing crossed thresholds that made a two-year-old device at half the price genuinely attractive rather than merely cheaper, and upgrade cycles lengthened at the same time. Supply tightened as a result, because households keeping phones longer produce fewer trade-ins, which constrained the market more than demand did.
Three mechanisms carry the base case. Certified warranty devices grow at 13.8% as buyers convert from marketplace gambling to considered purchase. Brazilian demand expands at 14.6% on import duty that makes new devices unaffordable and refurbished ones the mainstream option. Carrier trade-in programmes are widening as operators discover that a structured recovery channel is worth more than the subsidy it costs them. All three are visible in intake data already.
The bull case is a battery disclosure standard. If health percentage were mandatory at listing, the certified tiers would separate from ungraded supply on evidence rather than on price, and the category's central trust problem would largely resolve. The bear case is parts pairing tightening further. Manufacturers restricting component replacement to authorised channels would remove independent refurbishers from the market entirely.

The Number Nobody Prints

Grading systems across this market describe how a phone looks and largely ignore how long it will work. Grade A, B and C refer to scratches, dents and screen marks, while battery health, the one variable that determines whether a device is usable in two years, appears on around 31% of listings. A phone with an immaculate casing and a battery at 78% capacity is a poor purchase described as an excellent one. Nothing in a standard grading system captures that difference.
TOP FIVE CONCENTRATION29%Combined resale transaction value share held by the largest platforms
BATTERY HEALTH DISCLOSURE31%Share of listings stating a measured battery health figure
AVERAGE RESALE PRICEUSD 286Weighted transaction value across every device grade covered
RETURN RATE14%Proportion of refurbished devices returned within the warranty window
DEVICE AGE AT RESALE31 monthsMedian age of a device entering the refurbishment channel
SUPPLY CONSTRAINED SHARE62%Portion of refurbishers reporting supply rather than demand limits
Supply rather than demand is what limits this market, and around 62% of refurbishers say so directly. Households keep phones longer than they used to, which reduces the flow of trade-ins, and the devices that do arrive are older, at a median of 31 months. Carrier programmes and structured buy-back are the only mechanisms that reliably increase supply, and operators have been slow to treat them as revenue.
Parts pairing changes who can participate at all. A component bound to a device serial number produces warnings or lost function when replaced by anybody outside an authorised channel. That turns refurbishment from an engineering activity into a licensing one.
"This industry grades phones on scratches and sells them on price, while the thing that decides whether a customer is happy in eighteen months goes unstated. Publishing battery health would cost nothing and would reorganise the entire competitive order."
Director, Connected Devices and Circular Technology Practice · MMA Technology and Connected Devices Practice · September 2026

Market Trends

Warranty Converts A Gamble Into A Purchase

Certified Grade A devices with warranty grow at 13.8% against 9.2% for the market, because the guarantee rather than the inspection is what changes the buying decision. A used phone without recourse is a risk a buyer prices accordingly; the same device with twelve months of cover competes directly against a new one on rational grounds. Return rates near 14% are what makes warranty provision expensive, and the participants who price it correctly are those measuring battery health properly before sale. Cosmetic grade tells a refurbisher almost nothing about whether a device will come back.
Market Impact: Brazil grows at 14.6% annually
Parts Pairing Restricts Who Can Refurbish

Manufacturers increasingly bind screens, batteries and cameras to a specific device serial, so a replacement part triggers persistent warnings or loses functionality unless installed through an authorised channel with access to pairing tools. That converts refurbishment from an engineering activity into a licensing one, and independent operators without authorisation are progressively excluded from higher-value repairs. Right to repair legislation is pushing against it in several jurisdictions, with outcomes that differ considerably between markets. Manufacturers running their own certified programmes hold pairing authority, parts access and trade-in supply at once, which no independent operator can assemble from any starting position.
Market Impact: Some 62% report supply limits

Market Opportunities and Growth Drivers

Import Duty Makes Refurbished Mainstream In Brazil

Brazil grows fastest of any country covered at 14.6%, because import duty and tax on new smartphones push flagship prices to multiples of what they cost elsewhere, which makes a refurbished device the mainstream option rather than a budget compromise. Domestic refurbishment operations have scaled accordingly and now handle volumes that would be unusual anywhere in Europe. The same dynamic operates across Argentina and parts of Africa, though Brazilian market structure is considerably more organised. A two-year-old flagship at half price competes against a new mid-range device rather than against a budget handset.
Market Impact: Only 31% disclose battery health

Carrier Trade-In Programmes Widen Supply Access

Around 62% of refurbishers report supply rather than demand as their binding constraint, and carrier trade-in is the only mechanism that reliably increases it at scale. Operators have historically treated recovered handsets as a cost of subsidy rather than as inventory with independent value, and several have now rebuilt those programmes as revenue lines. That changes both the volume and the quality of devices reaching refurbishment, since carrier-recovered stock arrives with known provenance and service history. Carrier stock arrives with a documented service history and frequently a battery health figure attached, which cuts inspection cost and warranty reserve together.
Market Impact: Median device age reaches 31 months

Market Restraints and Challenges

Grading Describes Appearance Rather Than Longevity

Grade A, B and C classifications describe cosmetic condition while battery health, which determines whether a device remains usable in two years, appears on roughly 31% of listings. The root cause is that cosmetic grading is easy to photograph and battery health is a number that can only disappoint, so sellers omit it and buyers have never been taught to ask. Commercially it suppresses trust across the whole category. Participants disclosing health measurements prominently report materially lower returns. Buyers self-select away from devices that would have disappointed them, which is exactly the outcome a seller wants.
Market Impact: Certified grows 4.6 points faster

Device Supply Falls As Upgrade Cycles Lengthen

Households now keep phones considerably longer than they did five years ago, which reduces the flow of trade-ins into refurbishment and raises the median age of devices that do arrive to around 31 months. The root cause is that new device improvements have slowed enough that upgrading has become discretionary rather than necessary. Commercially it makes supply the binding constraint for about 62% of refurbishers. Mitigation runs to carrier partnerships, structured buy-back and enterprise fleet recovery. Enterprise fleets refresh on fixed cycles and produce consistent batches, which is the opposite of consumer unpredictability.
Market Impact: Affects 100% of paired components
3 additional market trends, 4 additional growth drivers, and 2 additional restraints and challenges are covered in the full report. Contact sales@marketmindsadvisory.com to access the complete intelligence.

Segment CAGR and Growth Architecture

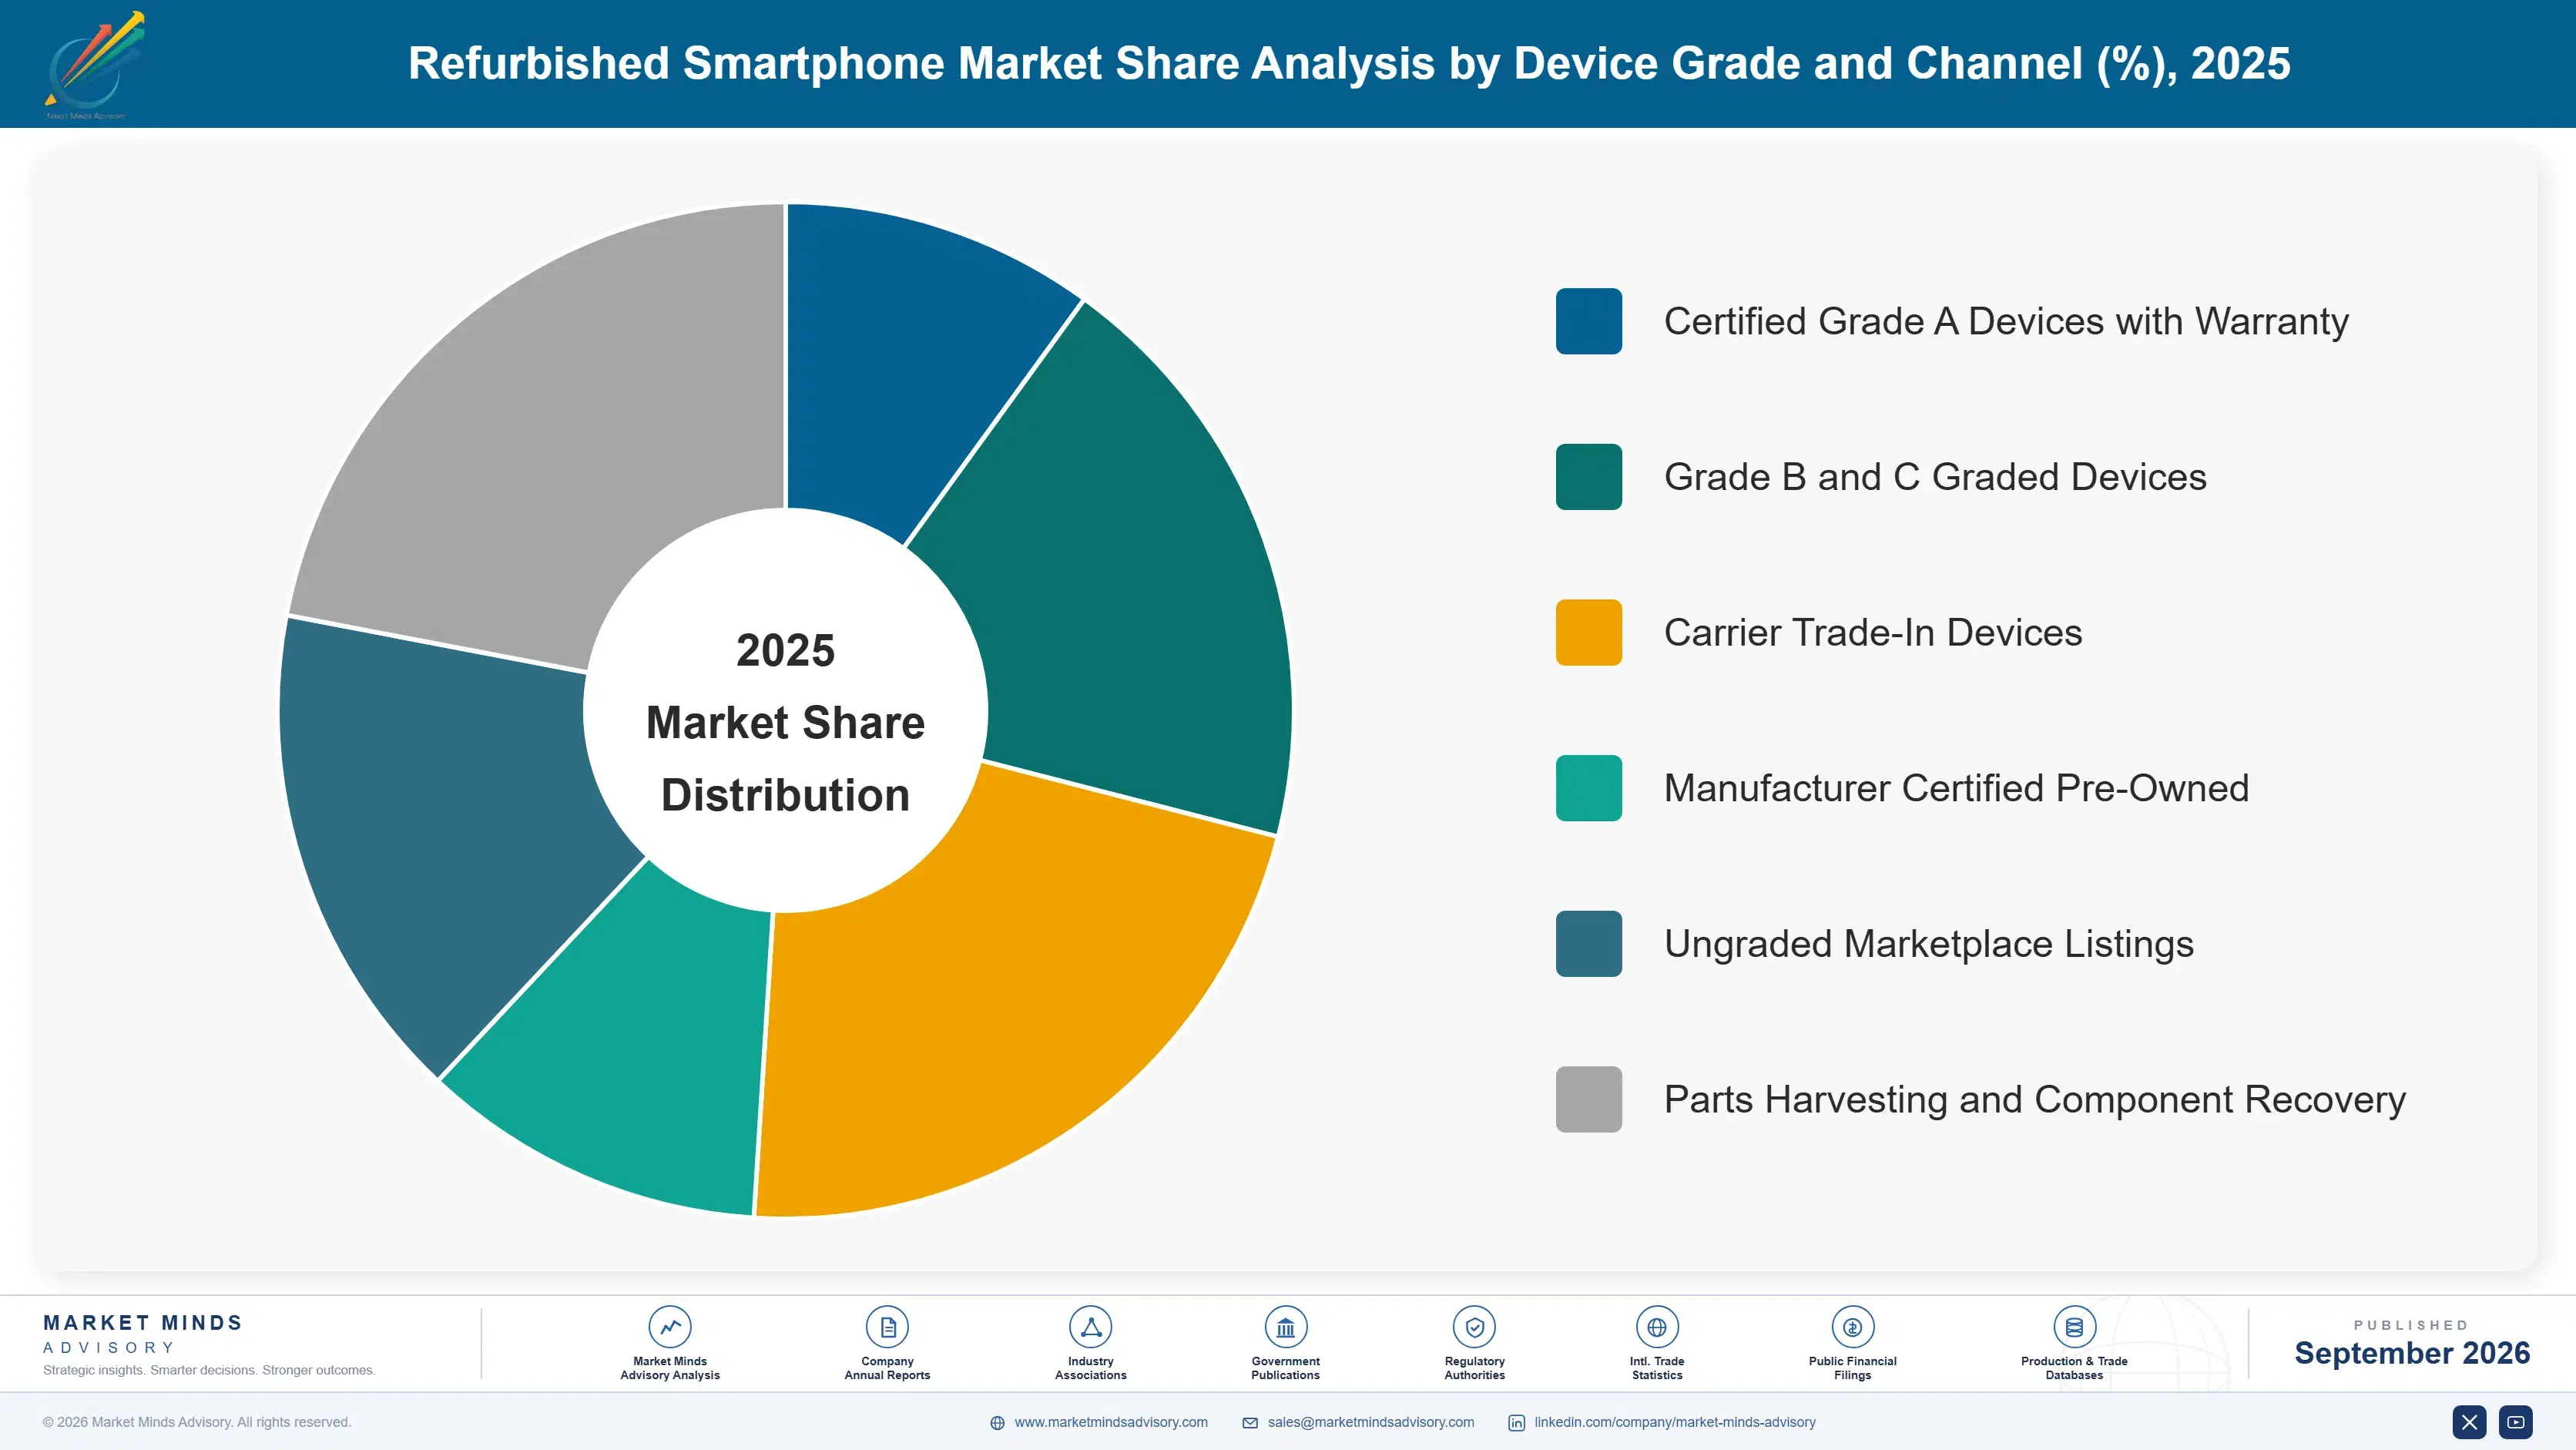
Segmentation follows device grade and channel, the dimension on which warranty provision, price realisation, return rate and supply source all divide together. Six categories are assessed at resale transaction value. New smartphones, feature phones, tablets, uninspected private sales, and repair services on customer-owned devices sit outside the defined scope here. Supply channel separates their economics more than grade does.
refurbished-smartphone-market-market-share-analysis-1790024506545

Certified Grade A Devices With Warranty

Certified Grade A devices with warranty grow at 13.8%, half again the market rate of 9.2%, and the warranty rather than the grade is what carries the growth. A used phone sold without recourse is a gamble that buyers price accordingly, while the same device with twelve months of cover competes against a new handset on rational terms. Return rates near 14% make that cover genuinely expensive, which means the participants who can price it are those measuring battery health accurately before listing. Cosmetic grading tells them very little about whether a device will come back. Pricing that cover correctly requires measuring battery health accurately before any device is listed.
CAGR 13.8%

Carrier Trade-In Devices

Carrier trade-in devices grow at 11.5% and matter more for what they solve than for what they earn. Around 62% of refurbishers name supply as their binding constraint, and carrier programmes are the only reliable mechanism for increasing it at scale. Devices arriving through this route carry known provenance, service history and frequently a documented battery health figure, which reduces inspection cost and return risk together. Operators historically treated recovered handsets as a cost of subsidy rather than as inventory, and the ones rebuilding those programmes as revenue lines are changing the supply picture materially. Whoever contracts those relationships first takes supply access that competitors bidding on open marketplaces cannot match at any price.
CAGR 11.5%
Full segment breakdown across 6 segments available in the complete report.

Regional Architecture and Country Demand Map

Shares record where refurbished devices are sold rather than where they originally shipped. Latin America sits well above its standard band on import duty economics, and Eastern Europe below on an informal trade that sits outside measured transaction value. Both deviations carry a stated reason in the paragraph concerned.

East Asia

At 26% this sits inside the standard band and Chinese demand accounts for most of it, supported by a domestic refurbishment industry operating at a scale found nowhere else. Shenzhen handles component recovery and device reconditioning in volumes that supply both domestic resale and export. Japanese demand is unusual in its insistence on cosmetic condition, which pushes grading standards higher and prices with them. Korean carrier programmes are well developed. Growth of 10.4% reflects domestic demand and export refurbishment expanding at similar rates. Aihuishou and ZhuanZhuan have built organised buy-back at a scale that gives them supply access no Western operator approaches, in a market where the trade was previously entirely informal and unstructured.
Share: 26% | CAGR: 10.4% (2026 to 2036)

North America

The 24% position sits inside the standard band and carrier trade-in is more developed here than anywhere, which gives refurbishers supply access that European operators struggle to match. Assurant and comparable processors handle carrier volumes at industrial scale. Parts pairing restrictions are also most advanced here, and right to repair legislation at state level is pushing back with results that vary considerably between jurisdictions. Growth of 8.3% reflects strong supply against demand constrained by relatively affordable new device financing. Manufacturer certified pre-owned programmes are also most developed here, and they hold parts access, pairing authority and trade-in supply simultaneously in a way that independent operators cannot replicate at all. Supply access there is unmatched.
Share: 24% | CAGR: 8.3% (2026 to 2036)
Regional intelligence for 5 additional markets available in the complete report: Western Europe, South Asia and Pacific, Latin America, Middle East and Africa, Eastern Europe. Contact sales@marketmindsadvisory.com.
refurbished-smartphone-market-country-cagr-analysis-1790024507088

Four Moves Worth Making Now

These four address a market that grades phones on appearance, is constrained by supply rather than demand, and is being quietly reorganised by component pairing decisions made by the original manufacturers. Each has been executed by at least one participant with measured results. Two of the four cost a policy decision rather than any capital at all.

Publish Measured Battery Health On Every Listing

Battery health determines whether a device remains usable in two years and appears on roughly 31% of listings, while cosmetic grading that determines almost nothing appears on all of them. Measuring and publishing the figure costs a diagnostic step already performed during inspection. Participants who disclose it report return rates falling to around 7% against a category average near 14%, because buyers self-select away from devices that would have disappointed them. Cosmetic grading describes what a photograph already shows and predicts almost nothing about longevity. The diagnostic already exists in the inspection workflow.
Market Impact: Return rates fall to roughly 7% from 14%

Build Carrier Supply Partnerships Before Competitors

Around 62% of refurbishers name supply as their binding constraint, and carrier trade-in is the only channel that reliably increases it at scale rather than incrementally. Operators have treated recovered handsets as a subsidy cost rather than as inventory, which leaves the relationships available to whoever asks properly. Participants who secured structured carrier agreements report device intake rising roughly 3.2 times, with provenance and service history attached that reduces inspection cost substantially. Operators are beginning to rebuild those programmes as revenue lines rather than subsidy costs, which means the window for favourable terms is narrowing rather than widening.
Market Impact: Contracted device intake rises roughly 3.2 times higher

Secure Authorised Parts Access Ahead Of Tightening

Component pairing binds screens, batteries and cameras to a device serial, and a replacement installed outside an authorised channel triggers warnings or loses function entirely. Obtaining authorisation costs programme fees and audit compliance rather than engineering capability. Participants holding authorisation report repair yield rising roughly 28% on devices that would otherwise have been downgraded or parted out, which directly improves the economics of every unit acquired. The direction of travel is toward tighter pairing rather than looser, and right to repair outcomes differ so much between jurisdictions that waiting for legislation is not a strategy. Authorisation is available now.
Market Impact: Full-grade repair yield rises by roughly 28% overall

Enter Enterprise Fleet Recovery For Volume Supply

Corporate device fleets refresh on fixed cycles and produce devices of known age, known configuration and consistent condition in single large batches, which is the opposite of consumer trade-in unpredictability. Most refurbishers pursue consumers and ignore the channel. Participants building enterprise recovery report acquisition cost per device falling roughly 19% against consumer buy-back, at inspection cost lower again because batch consistency removes most of the variability. Batch consistency also removes most of the inspection variability that makes consumer trade-in expensive to process. Contracts run on refresh cycles rather than on sentiment, which makes the supply genuinely forecastable.
Market Impact: Acquisition cost per device falls roughly 19% overall

Who Controls the Margin Pool

Concentration is very low at 29% held by the top five, measured consistently on resale transaction value rather than unit volume, which would overweight low-grade devices moving in large numbers through informal and marketplace channels. The leader to challenger gap rests on supply access and warranty capability rather than on refurbishment engineering, which is widely available and not especially difficult.
Competition runs on three dimensions currently. Supply access decides scale, since around 62% of participants are constrained by device availability rather than by customers. Warranty provision decides price realisation, because cover converts a gamble into a considered purchase. Parts authorisation decides which repairs are economically possible at all, and that is increasingly a licensing question rather than a technical one.

Pressure is building from two directions and positions will shift on both. Manufacturers running their own certified pre-owned programmes hold parts access, pairing authority and supply through their own trade-in channels simultaneously, which is a durable advantage no independent can assemble. Meanwhile right to repair legislation is pushing against pairing restrictions with outcomes that differ so much between jurisdictions that operating models are diverging by region.
refurbished-smartphone-market-company-positioning-matrix-1790024507615

Competitive Moat and Risk Dimensions

BACK MARKET

Moat: Marketplace Scale And Standards

Aggregating refurbisher supply behind a single consumer-facing brand with enforced quality standards gives buyers a reason to trust a category they otherwise approach warily, and that trust position took years of seller policing to build rather than any amount of marketing spending. Trust is the scarce asset here.
BACK MARKET

Risk: No Direct Supply Ownership

Operating as a marketplace means device supply belongs to the refurbishers listing on it, which leaves the platform exposed when manufacturers or carriers route stock through their own certified programmes instead. Quality enforcement also depends on sellers who have their own commercial incentives. Those incentives do not always align.
ASSURANT

Moat: Carrier Processing Contract Position

Handling trade-in processing directly for carriers provides device supply at industrial scale with provenance attached, which is precisely the constraint limiting most of the market, and those contracts are long, operationally embedded and difficult for a competitor to displace. Supply access is the binding constraint for most competitors.
ASSURANT

Risk: Carrier Channel Concentration Risk

Revenue depends on a small number of operator relationships that are renegotiated periodically and could be brought in house if carriers decide recovered handsets are worth managing themselves. The same insight driving programme expansion also makes the processing role look increasingly attractive to keep. That risk grows with the opportunity.

Players Tracked

Prominent Players

Back Market
Amazon Renewed
Assurant
Recommerce Group
Cashify

Other Key Players

Swappa
Gazelle
musicMagpie
Refurbed
Reebelo
Mobile Klinik
Ingram Micro Lifecycle
Foxway
Certideal
Rebuy
Yaantra
Aihuishou
ZhuanZhuan
Envirofone
Phonecheck

Recent Developments

FEBRUARY 2025

Back Market mandates battery health disclosure across sellers

The marketplace required all listed refurbishers to publish measured battery health figures rather than cosmetic grades alone, enforcing the standard through seller policy. This was an internal platform policy change with no acquisition, partnership or regulatory requirement behind the decision. Sellers failing to comply were removed from the listing platform.
Signal: Disclosure is imposed by a platform because nobody volunteered it. The trust problem was never technically hard.
SEPTEMBER 2024

Assurant expands carrier trade-in processing across Europe

The company extended trade-in processing agreements with European mobile operators, adding device recovery volume to its existing North American position. These were commercial processing agreements with no equity component, joint venture structure or acquisition involved. Existing North American processing contracts continued unchanged. Device volumes transfer under negotiated rates.
Signal: Carrier supply access is being contracted while European operators still undervalue it. Terms narrow from here.
MAY 2025

Recommerce Group acquires enterprise device recovery specialist

The company completed the acquisition of a business handling corporate fleet device recovery, adding batch supply with known configuration and consistent condition. This was a completed acquisition rather than a merger or joint venture, with contracts transferring intact. Corporate customer relationships transferred with the acquired operation.
Signal: Enterprise fleets are bought because consumer supply cannot be scaled. Predictable batch supply beats unpredictable consumer volume.

What Each Device Costs

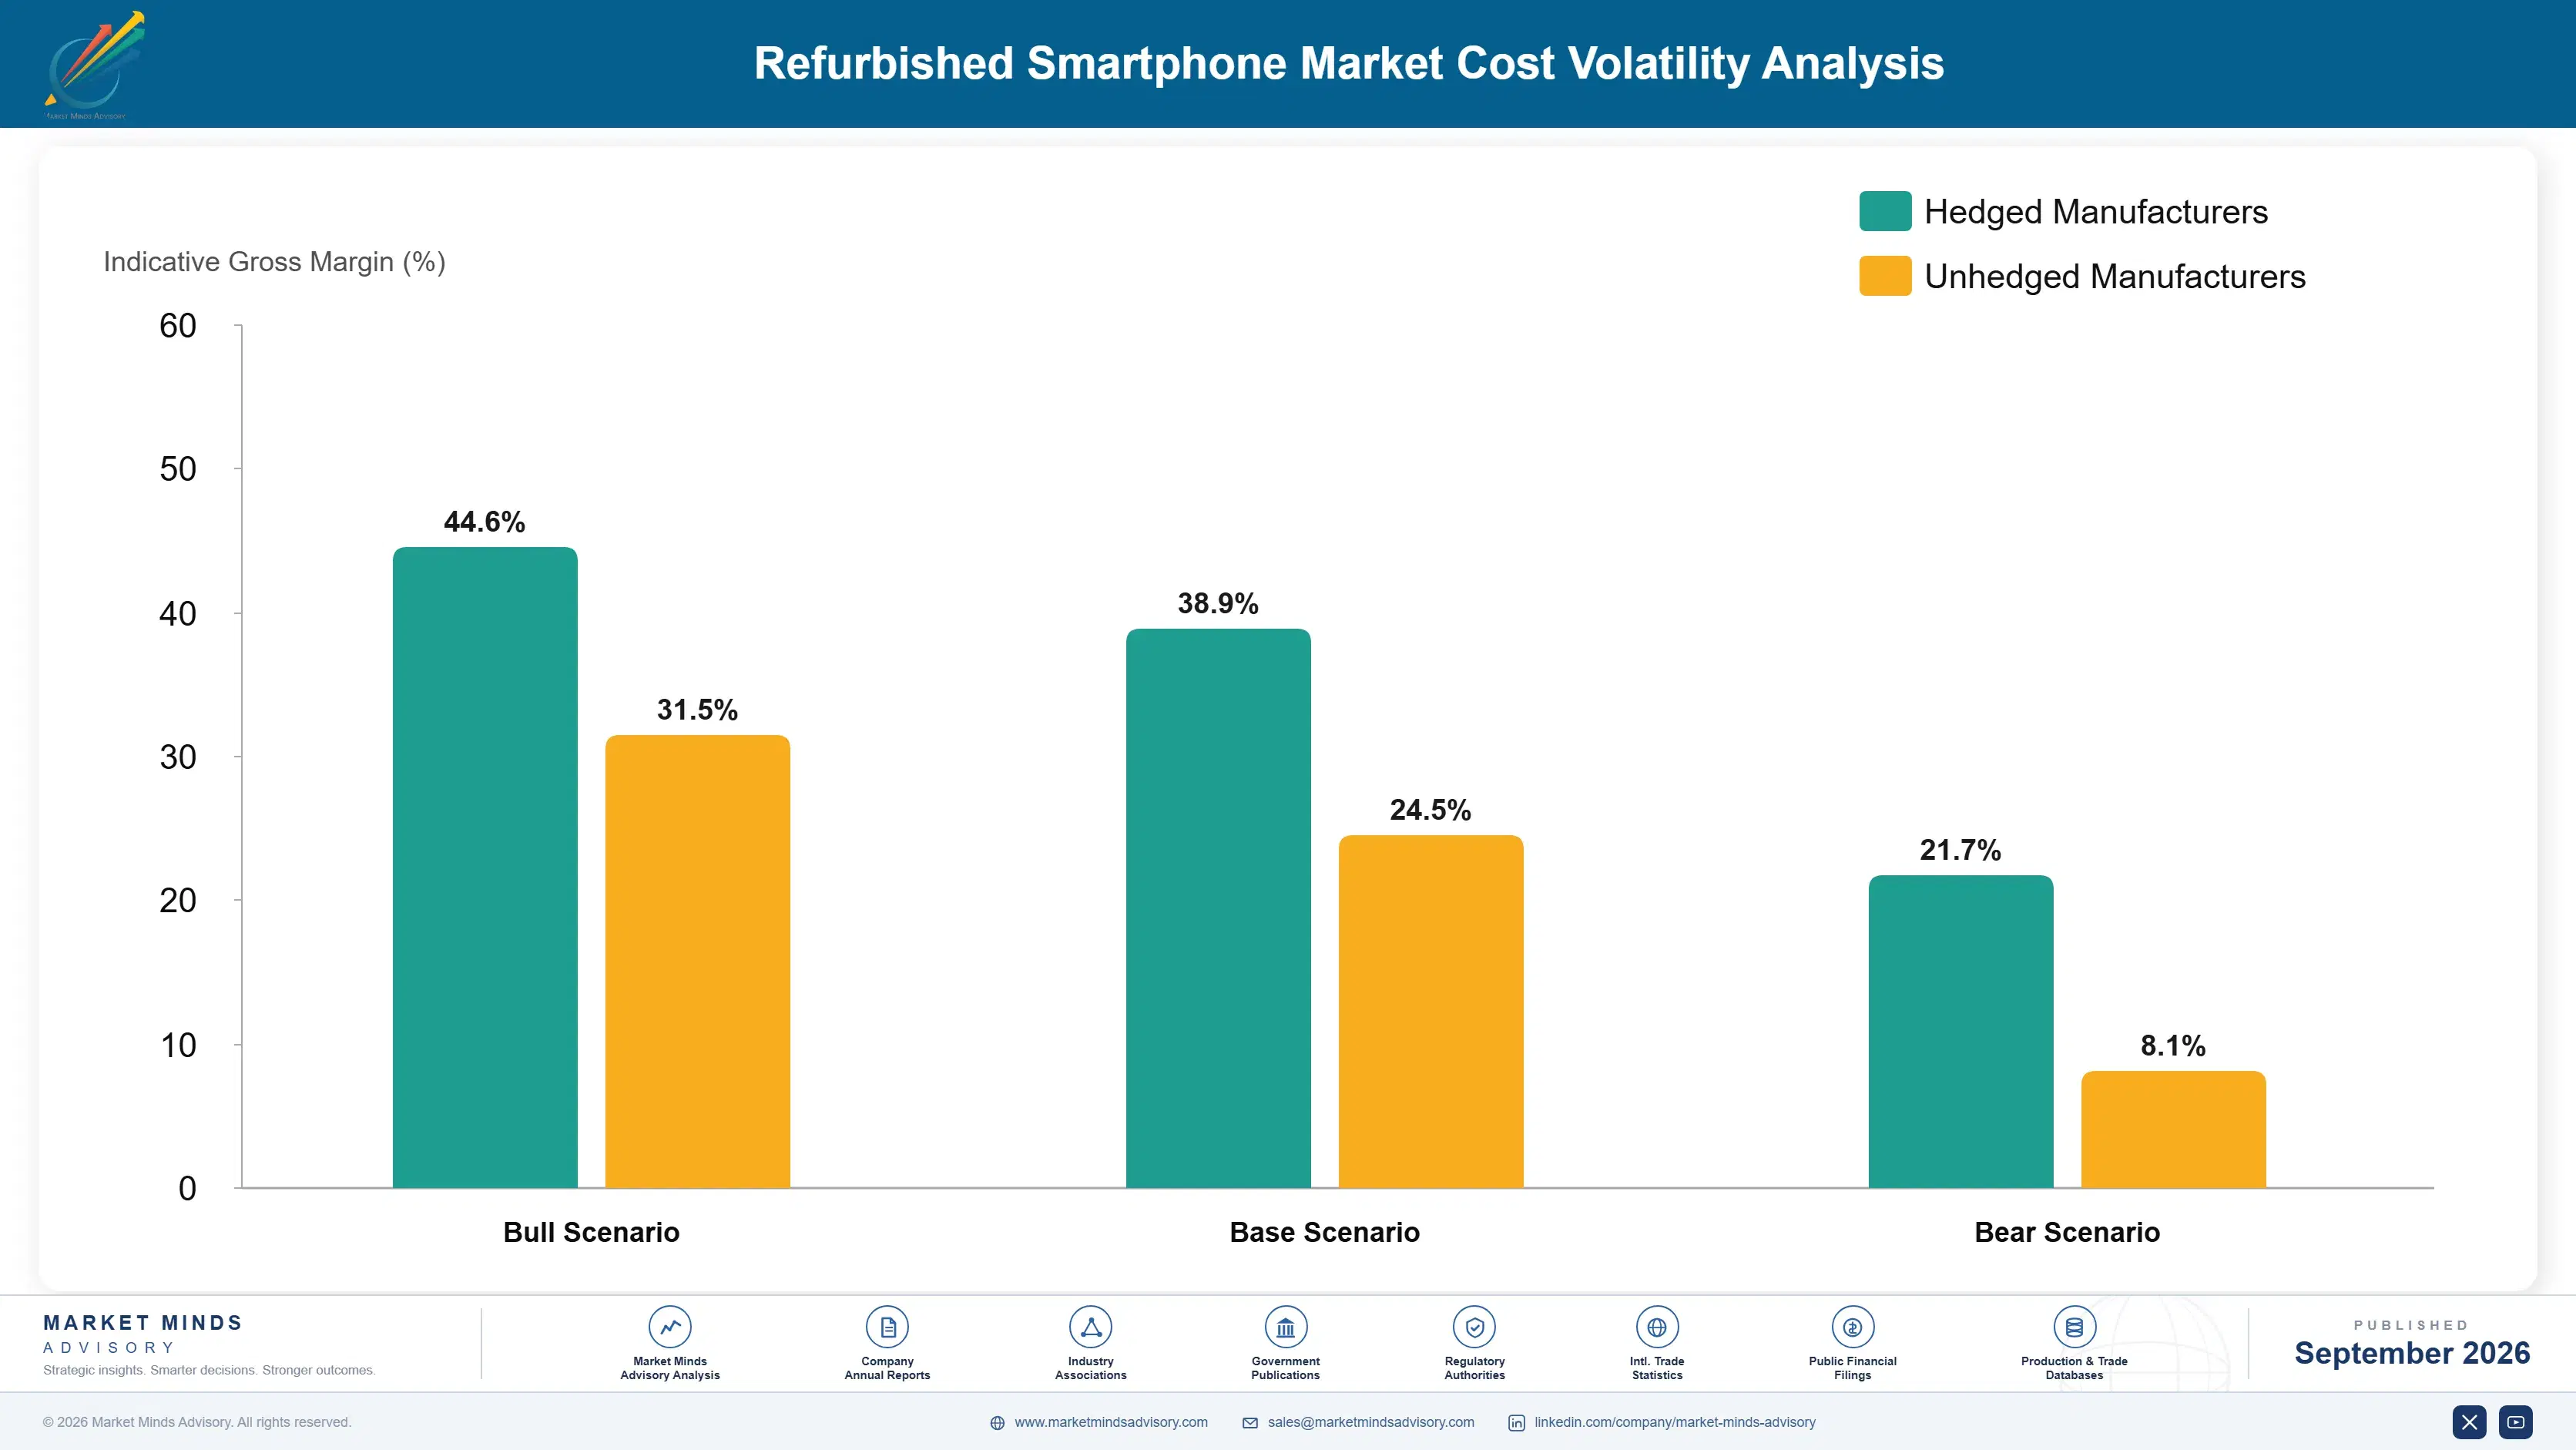
Device acquisition dominates everything else. Buying the handset runs roughly 61% of total cost per unit, which is unusually high and reflects a supply-constrained market bidding for stock. Replacement parts take about 13%, inspection, testing and data erasure around 9%, and warranty reserve a further 8% on certified tiers. Logistics and payment processing absorb the remainder across most operating models.
Replacement display and battery prices rose through 2021 and 2022 on semiconductor and component supply constraints, a movement visible in US Census Bureau trade data for electronic component imports across the period. Refurbishers holding fixed resale pricing absorbed the increase against margins that acquisition cost had already compressed. Several smaller independent operators exited rather than carry the working capital that device inventory requires. Acquisition and component cost moved together.

Exposure divides by supply channel rather than by company size. Participants buying on consumer marketplaces bid against each other for scarce devices and carry the highest acquisition cost of anybody. Carrier-contracted processors receive supply at negotiated rates with provenance attached, which lowers both acquisition and inspection cost simultaneously. Operators without parts authorisation carry a further disadvantage, since paired components force downgrades that authorised competitors avoid entirely.
refurbished-smartphone-market-cost-volatility-analysis-1790024507810

Contract supply channels rather than bidding on marketplaces

Acquisition is roughly three fifths of unit cost and open marketplace bidding puts every refurbisher in competition for the same scarce devices. Carrier and enterprise contracts secure volume at negotiated rates with provenance attached. The obstacle is that those relationships take time to build and favour participants with processing scale already in place. Scale begets access here.

Obtain parts authorisation before pairing tightens further

Paired components force downgrades or part-outs on devices that authorised competitors repair and sell at full grade. Authorisation costs programme fees and audit compliance rather than technical capability. The constraint is that manufacturer programmes impose conditions some independents find commercially difficult to accept alongside their existing operations. The direction of travel is toward tighter restriction, which makes waiting expensive.

Price warranty reserve against measured battery health

Warranty reserve sits near a twelfth of unit cost on certified tiers and return rates run around 14% across the category, driven substantially by battery degradation rather than cosmetic complaint. Reserving against measured health rather than a blended average prices the risk correctly. It requires diagnostic discipline that many operators currently skip. Most skip the measurement entirely.

Portfolio Architecture for Margin Defence

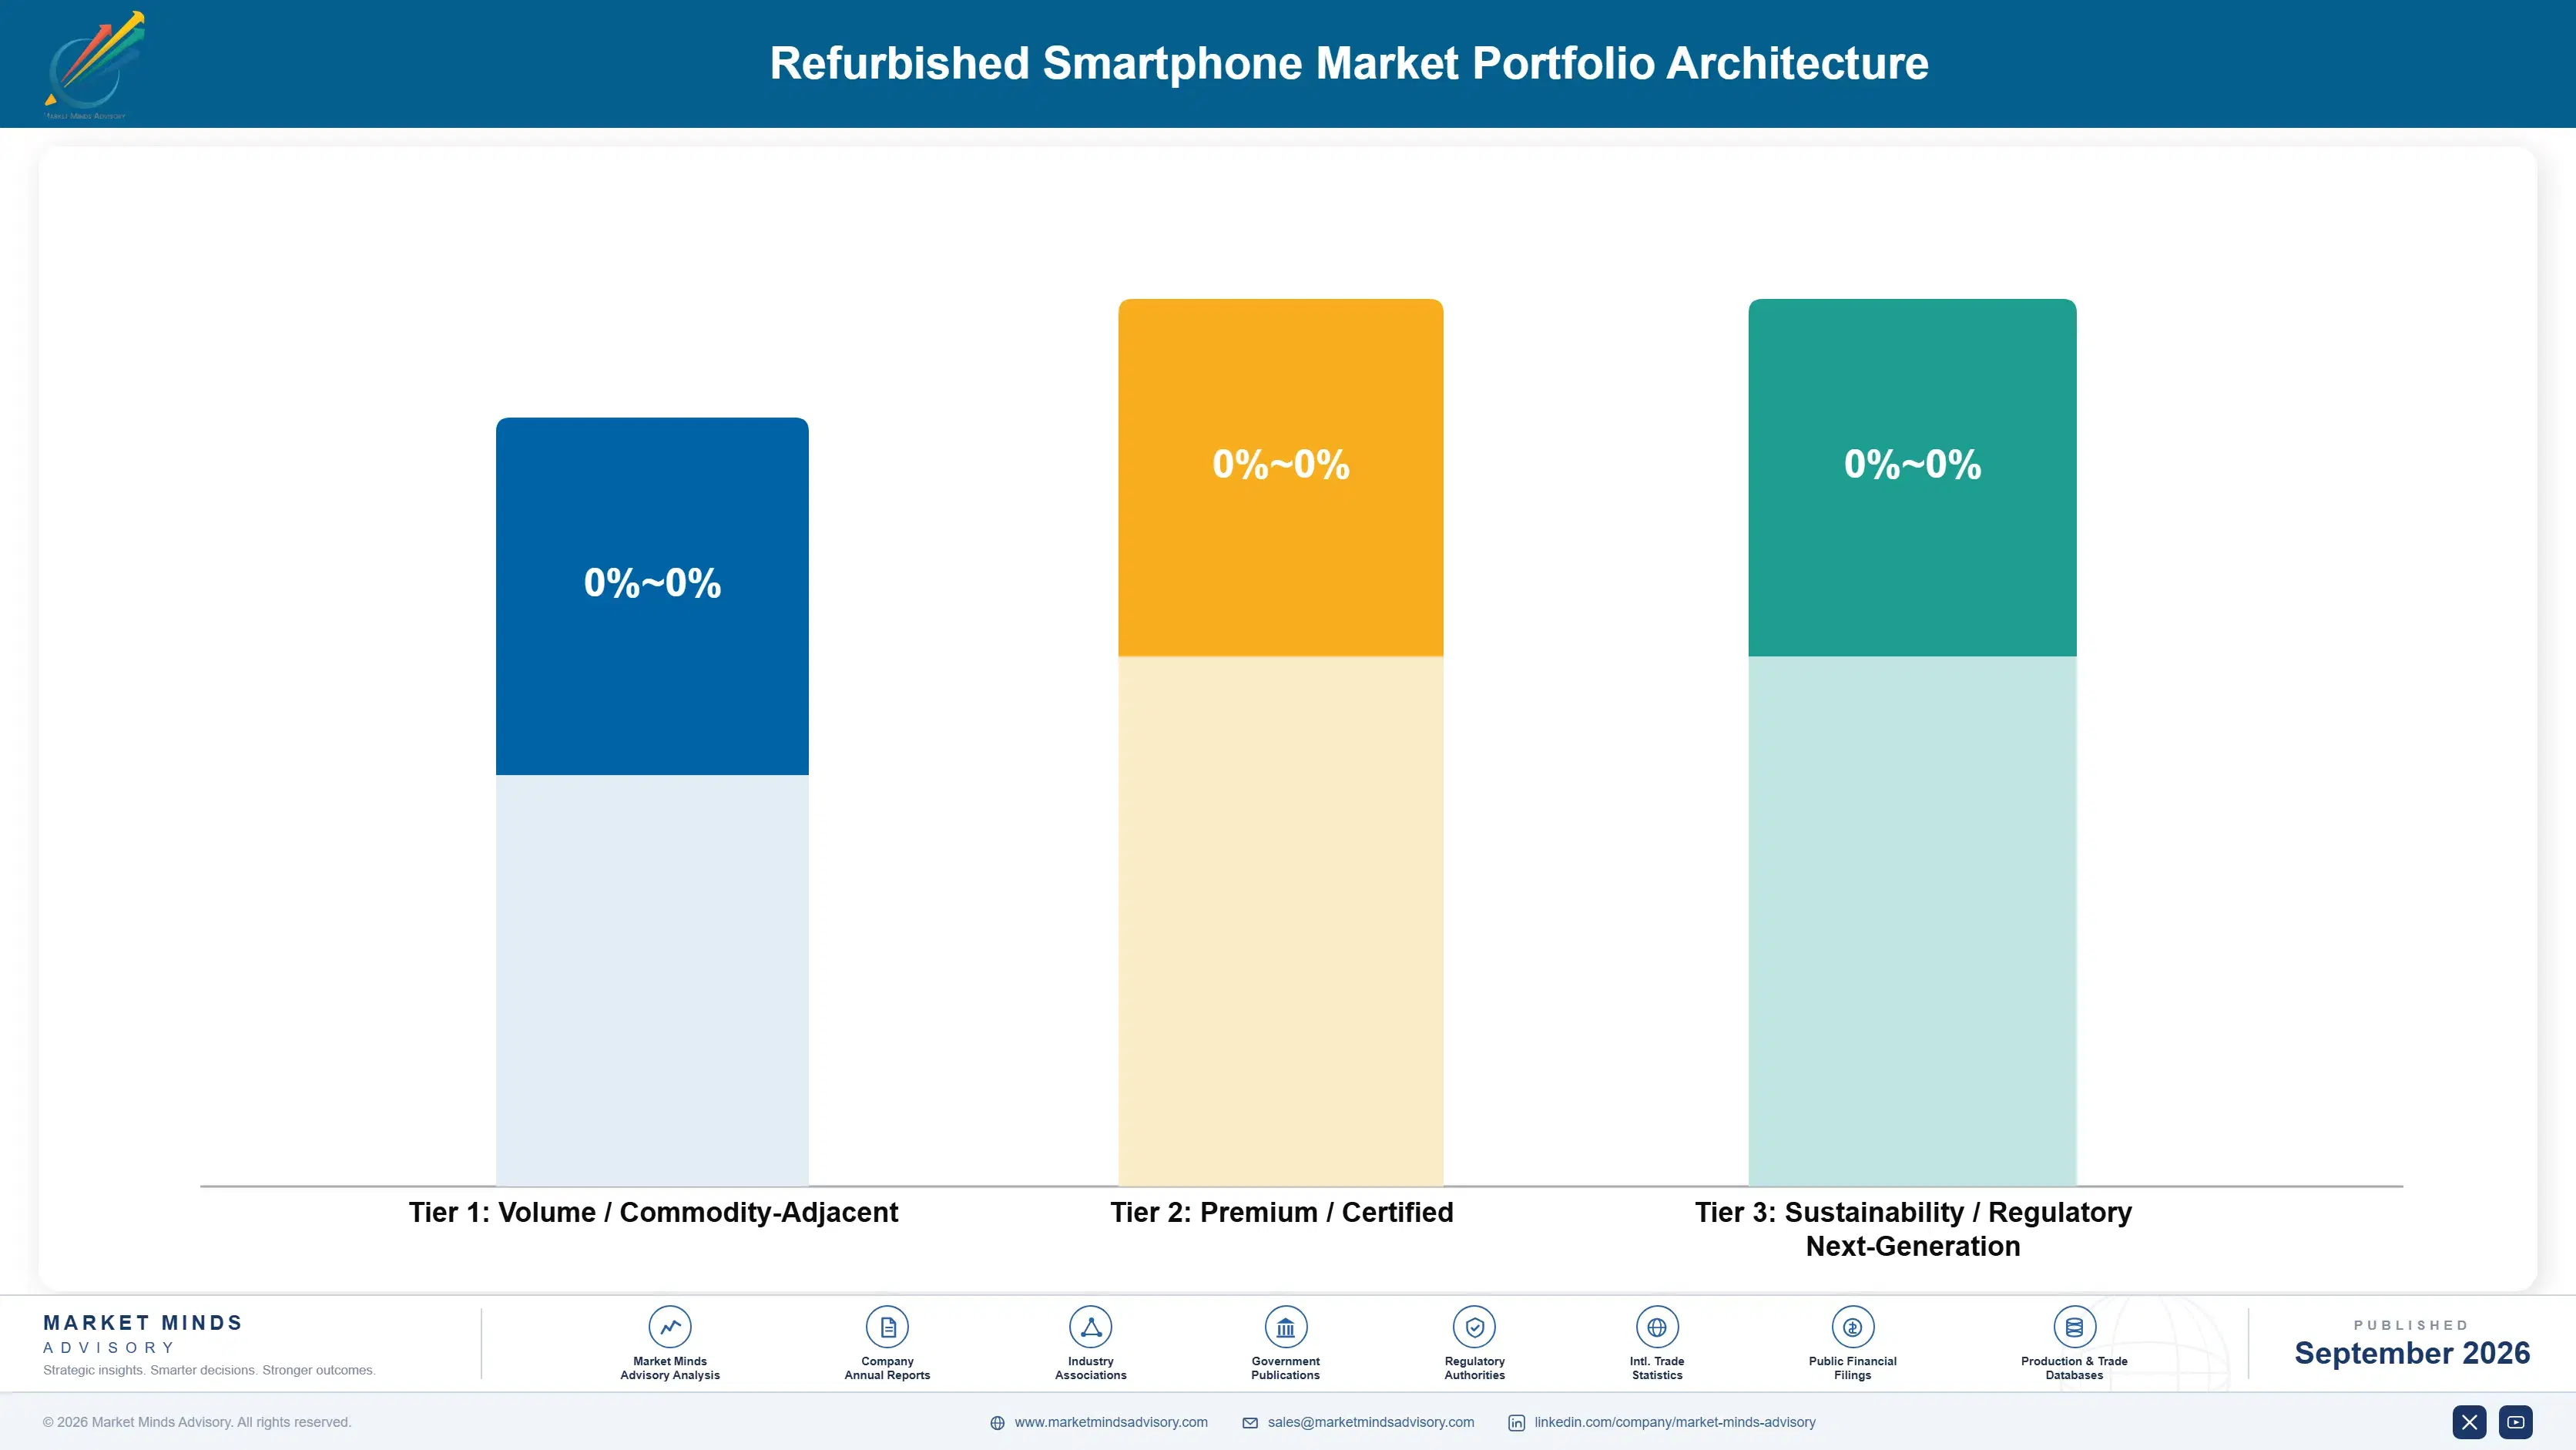
Margin architecture divides by whether a warranty is attached, which acquisition cost alone would not predict. Ungraded marketplace listings and low-grade devices run at gross margins in the high single digits to high teens, sold without recourse into buyers who price the risk themselves and who provide no repeat relationship of any kind afterwards. Nothing about that transaction produces a customer who returns.
Grade B and C devices and carrier trade-in stock hold gross margins in the high teens to high twenties. The spread reflects how differently contracted and marketplace-acquired devices carry acquisition cost. Carrier stock in particular earns its position by arriving with provenance and service history, which lowers inspection cost and reduces the warranty reserve a prudent operator has to hold against it.

The highest-value pool is certified Grade A devices with warranty and manufacturer certified pre-owned, at margins in the low thirties to low forties. Those buyers are purchasing certainty and pay for it accordingly. Ungraded listings carry substantial unit volume and generate the category's trust problem. They build nothing that anybody can defend. Volume and trust move in opposite directions in this category, and the industry has spent a decade choosing the first.

Volume / Commodity-Adjacent

Ungraded marketplace listings and low-grade devices sold without recourse, where buyers price their own risk. The ten point range reflects how differently acquisition channels affect landed device cost. Undisclosed battery condition generates most category complaints.
Gross Margin: 8 to 18%

Premium / Certified

Grade B and C devices and carrier trade-in stock. Carrier supply earns its position by arriving with provenance and service history, which lowers inspection cost and the warranty reserve required.
Gross Margin: 18 to 29%

Sustainability / Regulatory / Next-Generation

Certified Grade A devices with warranty and manufacturer certified pre-owned. These buyers are purchasing certainty rather than a discount, and they pay for it accordingly at every price point. Pricing the warranty requires measuring health properly first.
Gross Margin: 31 to 42%
refurbished-smartphone-market-portfolio-architecture-1790024508306

High-value Sub-segments and Strategic Watch-out

Certified Grade A With Warranty

High value and fastest growth at 13.8%, where cover rather than cosmetic grade carries the decision. Pricing that warranty correctly requires measuring battery health, which most of the category still does not do. Manufacturer certified programmes compete here with advantages independent operators cannot assemble anywhere.
Gross Margin: 32 to 41%

Carrier Trade-In Devices

High value and strong growth at 11.5%, solving the supply constraint that limits about 62% of refurbishers. Provenance and service history arrive with the device, reducing inspection cost and warranty reserve together. Operators are repricing these relationships as they understand what the stock is worth.
Gross Margin: 22 to 30%

Grade B And C Devices

Volume core serving price-led buyers who accept cosmetic imperfection for a working phone. Margin depends almost entirely on acquisition channel, since the refurbishment work itself differs very little between grades. Marketplace bidding for scarce devices is what compresses margin at this level. Acquisition channel decides everything.
Gross Margin: 17 to 26%

Ungraded Marketplace Listings

Strategic watch-out. Growing slowest at 3.7% and generating most of the category's trust problem through undisclosed battery condition. The fourteen point range reflects how widely acquisition cost varies here. Platform disclosure mandates are beginning to close that gap from above. Undisclosed battery condition drives most complaints.
Gross Margin: 6 to 20%

How Buyers Actually Return

Repeat purchase here runs on a cycle measured in years and turns almost entirely on whether the first device disappointed. A buyer whose refurbished phone worked for three years returns to the same seller and frequently brings the old device as a trade-in, which closes the supply loop the category is short of. A buyer whose battery failed in eight months never buys refurbished again from anybody.
Stickiness varies sharply by warranty and by disclosure. Customers who bought a certified device with cover and never needed to claim are the most loyal group, because the guarantee removed the risk and the outcome confirmed the decision. Marketplace buyers who took a gamble and won feel lucky rather than loyal. Enterprise and carrier channel relationships are different again, running on contracts rather than on sentiment.

Buyer profiles have shifted from price-led to value-led over five years. The early refurbished customer was buying the cheapest working phone available; the current one is frequently choosing a two-year-old flagship over a new mid-range device at similar money, which is a different decision entirely. That buyer researches battery health and warranty terms, and rewards the sellers who publish both.
refurbished-smartphone-market-end-use-penetration-index-1790024508798

Where Trust Decides Value

These are among the four positions where our research anticipates prominent divergence between winners and laggards over the coming forecast period. Each is grounded in the demand model, the regulatory perimeter, and the announced capacity pipeline.
01 / BATTERY HEALTH DISCLOSURE

Publish the number that decides everything

Battery health determines whether a device remains usable in two years and appears on roughly 31% of listings, while cosmetic grading that determines almost nothing about longevity appears on every single one of them. Measuring and publishing the figure costs a diagnostic step already performed during inspection anyway. Participants who disclose report return rates falling to around 7% against a category average near 14%, because buyers self-select away from devices that would disappoint, and cosmetic grading predicts almost nothing about device longevity.
02 / CARRIER SUPPLY CONTRACTING

Buy the constraint, not the customers

Around 62% of refurbishers name device supply rather than demand as their binding constraint, and carrier trade-in remains the only channel that increases it at genuine scale. Operators have long treated recovered handsets as a subsidy cost rather than as inventory, which leaves those relationships available to whoever asks properly. Participants securing structured carrier agreements report device intake rising roughly 3.2 times with provenance attached that cuts inspection cost, and the window for favourable terms is narrowing rather than widening.
03 / PARTS AUTHORISATION ACCESS

Get authorised before the door closes

Component pairing binds screens, batteries and cameras to a device serial number, and a replacement part installed outside an authorised channel triggers persistent warnings or loses function entirely. Obtaining that authorisation costs programme fees and audit compliance rather than any engineering capability at all. Participants holding authorisation report repair yield rising roughly 28% on devices that would otherwise have been downgraded or parted out for their components instead, and the direction of travel is toward tighter pairing rather than looser.
04 / ENTERPRISE FLEET RECOVERY

Corporate refresh cycles are predictable supply

Corporate device fleets refresh on fixed cycles and produce handsets of known age, known configuration and consistent condition arriving in single large batches rather than arriving unpredictably over time. Most refurbishers chase consumer trade-in supply and ignore the enterprise channel entirely. Participants building enterprise recovery report acquisition cost per device falling roughly 19% against consumer buy-back, with inspection cost lower again because batch consistency removes most of the variability, and contracts run on refresh cycles rather than on consumer sentiment.

Engagement Snapshot From the Field

A live engagement with an industry participant carrying material or product regulatory and market exposure ahead of a defining policy shift, showing how our research translates into a defensible multi-year portfolio strategy.
MARKET MINDS ADVISORY · CLIENT ENGAGEMENT SUMMARY
Refurbished Smartphone Producer Strategic Portfolio Review and Transition Roadmap 2026·Investment Scenario on Refurbished Smartphone Exposure Evaluation 2025-26
CLIENT PROFILE
A European smartphone refurbishment operator with resale transaction value near USD 96 million (client-reported, unverified by MMA), acquiring approximately 78% of devices through consumer buy-back and open marketplaces. Battery health was measured internally but not published. No carrier agreements existed and the business held no manufacturer parts authorisation. Enterprise recovery had never been attempted anywhere.
STRATEGIC CHALLENGE
Return rates had risen for three consecutive quarters while management attributed the increase to more demanding customer expectations. A warranty term reduction had been approved to contain the cost. Nobody had correlated returns against measured battery health, or examined why acquisition cost kept rising against flat resale prices. Neither question had been examined at all.
MMA APPROACH
MMA correlated returned devices against their measured battery health at the point of sale rather than against cosmetic grade. Acquisition cost was compared across consumer, marketplace and contracted channels on a like-for-like basis. Downgrade decisions were traced to parts pairing, and enterprise recovery economics were modelled against existing consumer supply.
KEY FINDINGS
  1. Returned devices averaged 79% battery health at sale against 91% for retained devices, and the relationship was stronger than any cosmetic grade correlation in the data.
  2. Marketplace acquisition cost had risen 23% over two years against flat resale pricing, because every refurbisher was bidding for the same shrinking supply of devices.
  3. Parts pairing forced downgrade or part-out on 31% of devices requiring a display or battery replacement, all of which authorised competitors could repair to full grade.
  4. Modelled enterprise fleet recovery delivered devices at 21% below consumer buy-back cost with inspection time roughly a third lower through batch consistency.
CLIENT PROFILE
A European smartphone refurbishment operator with resale transaction value near USD 96 million (client-reported, unverified by MMA), acquiring approximately 78% of devices through consumer buy-back and open marketplaces. Battery health was measured internally but not published. No carrier agreements existed and the business held no manufacturer parts authorisation. Enterprise recovery had never been attempted anywhere.
STRATEGIC CHALLENGE
Return rates had risen for three consecutive quarters while management attributed the increase to more demanding customer expectations. A warranty term reduction had been approved to contain the cost. Nobody had correlated returns against measured battery health, or examined why acquisition cost kept rising against flat resale prices. Neither question had been examined at all.
MMA APPROACH
MMA correlated returned devices against their measured battery health at the point of sale rather than against cosmetic grade. Acquisition cost was compared across consumer, marketplace and contracted channels on a like-for-like basis. Downgrade decisions were traced to parts pairing, and enterprise recovery economics were modelled against existing consumer supply.
KEY FINDINGS
  1. Returned devices averaged 79% battery health at sale against 91% for retained devices, and the relationship was stronger than any cosmetic grade correlation in the data.
  2. Marketplace acquisition cost had risen 23% over two years against flat resale pricing, because every refurbisher was bidding for the same shrinking supply of devices.
  3. Parts pairing forced downgrade or part-out on 31% of devices requiring a display or battery replacement, all of which authorised competitors could repair to full grade.
  4. Modelled enterprise fleet recovery delivered devices at 21% below consumer buy-back cost with inspection time roughly a third lower through batch consistency.
RECOMMENDED STRATEGY
Phase 1: Phase one: cancel the warranty reduction, publish measured battery health on every listing and reserve against it. The diagnostic already existed internally. Phase 2: Phase two: apply for manufacturer parts authorisation and open carrier trade-in discussions across two markets. Both markets had operators undervaluing recovered stock. Phase 3: Phase three: build enterprise fleet recovery capability targeting corporate refresh cycles directly. Batch consistency also lowers inspection cost quite substantially.
OUTCOME
Return rates fell by roughly half within three quarters of publishing battery health, without any change to warranty terms (client-reported, unverified by MMA). Parts authorisation lifted full-grade yield materially, and the first carrier agreement delivered contracted supply at costs well below the marketplace bidding it replaced.

Frequently Asked Questions

Foundational context covering the market sizes, CAGR, scope, country, region and competition that inform every finding below. This section is provided to cover basics and most often pre-purchase conversations, answered from the MMA Primary Research Dataset.

What is the current size of the Refurbished Smartphone Market?

The market was valued at USD 42.0 billion in 2025, rising to USD 45.9 billion in 2026. Sizing is at resale transaction value across six device categories.

How large will the Refurbished Smartphone Market be by 2036?

MMA forecasts USD 110.7 billion by 2036, an increase of USD 64.8 billion over the 2026 base. That represents expansion of 2.41 times across the forecast period.

What is the CAGR for the Refurbished Smartphone Market 2026 to 2036?

The base case CAGR is 9.2%, with a bull case of 10.5% and a bear case of 7.9%. Historical growth between 2020 and 2025 ran at 7.9%.

Which segment is growing fastest?

Certified Grade A devices with warranty grow at 13.8%, half again the market rate, because cover converts a gamble into a purchase. Carrier trade-in devices follow at 11.5%.

Who are the major companies in the Refurbished Smartphone Market?

Back Market, Amazon Renewed, Assurant, Recommerce Group and Cashify lead on resale transaction value, holding a combined 29%. Supply access rather than refurbishment capability separates them.

Which country is growing fastest?

Brazil grows fastest at 14.6%, because import duty and tax push new smartphone prices to multiples of other markets, making refurbished the mainstream option. Domestic refurbishment capacity there is unusually organised.

Report Segmentation Architecture

The full report scope spans multiple orthogonal segmentation dimensions, with cross-tabulated demand data provided for each dimension pair. Coverage extends further to regional breakdowns, trend trajectories, and the competitive detail needed to support segment-level decision-making.

By Device Grade and Channel

  • Certified Grade A Devices with Warranty
  • Grade B and C Graded Devices
  • Carrier Trade-In Devices
  • Manufacturer Certified Pre-Owned
  • Ungraded Marketplace Listings
  • Parts Harvesting and Component Recovery

By End-Use Buyer

  • Price-Led Consumer Replacement
  • Value-Led Flagship Substitution
  • First Smartphone Purchase
  • Corporate and Enterprise Fleets
  • Education and Institutional Supply
  • Secondary and Backup Devices

By Commercial Dimension

  • Refurbished Marketplace Platforms
  • Carrier and Operator Channels
  • Manufacturer Direct Programmes
  • Independent Retail and Repair Shops
  • General E-Commerce Marketplaces
  • Enterprise Recovery Contracts

By Region

  • East Asia
  • North America
  • Western Europe
  • South Asia and Pacific
  • Latin America
  • Middle East and Africa
  • Eastern Europe

Scope, Methodology, and Coverage

Every figure in this report is reproducible from documented input assumptions. The scope below maps the historical period, the forecast horizon, the segmentation dimensions, and the countries covered, alongside the underlying primary and qualitative methodology.
Historical Period
2020 to 2025
Forecast Period
2026 to 2036
Base Year
2025 (USD billions; MMA Primary Research Dataset, September 2026)
Market Definition
This market covers previously owned smartphones professionally inspected, repaired and resold, spanning certified Grade A devices with warranty, Grade B and C graded devices, carrier trade-in devices, manufacturer certified pre-owned devices, ungraded marketplace listings, and parts harvesting and component recovery. Sizing is at resale transaction value across marketplace, carrier, manufacturer direct, independent retail, general e-commerce and enterprise recovery channels. New smartphones, feature phones, tablets, uninspected private sales, and repair services on customer-owned devices are excluded throughout.
Quantitative Units
USD billions at resale transaction value; volume in millions of devices resold; condition in measured battery health percentage.
Segmentation Dimensions
Device grade and channel, end-use buyer, commercial dimension, and geographic region.
Regions Covered
East Asia, North America, Western Europe, South Asia and Pacific, Latin America, Middle East and Africa, Eastern Europe
Countries Covered
China, United States, India, France, Brazil, Nigeria
Key Companies Profiled
Back Market, Amazon Renewed, Assurant, Recommerce Group, Cashify, Swappa, Gazelle, musicMagpie, Refurbed, Reebelo, Mobile Klinik, Ingram Micro Lifecycle, Foxway, Certideal, Rebuy, Yaantra, Aihuishou, ZhuanZhuan, Envirofone, Phonecheck
Quantitative Methodology
Primary survey, n=3,800 respondents, Q4 2025, six countries; demand-side model with trade association cross-validation
Qualitative Methodology
47 expert interviews, Q4 2025; applied to validate demand model assumptions, identify emerging dynamics, and assess competitive positioning
Report Format
PDF and XLSX data workbook (Word format preview document)
Publisher
Market Minds Advisory
Report Code
MMA-2026-TEC-808
Published
September 2026
Contact
sales@marketmindsadvisory.com | www.marketmindsadvisory.com

Purchase the full Refurbished Smartphone Market Report (2026 to 2036).

The full report sizes the refurbished smartphone market across six device grade and channel categories, six end-use buyer groups and six commercial dimensions for all seven global regions through 2036. It correlates returned devices against measured battery health at point of sale rather than against cosmetic grade, establishing what actually predicts a return. Acquisition cost is compared across consumer, marketplace, carrier and enterprise channels on a like-for-like basis. Downgrade decisions are traced to component pairing restrictions by manufacturer. Competitive assessment covers 20 participants on a consistent resale transaction value basis.
Returns correlated against measured battery health at sale
Acquisition cost compared across all four supply channels
Downgrade decisions traced to component pairing restrictions
Enterprise fleet economics modelled against consumer buy-back
Six device categories sized through 2036
Twenty participants assessed on resale transaction value

Built For The People Who Decide

From boardroom strategy to bench-side execution, this report is read cover-to-cover by leaders shaping the next decade of their industry, turning demand scenarios, market dynamics and valuation benchmarks into decisions.
CXOs/ Presidents/ VPs/ Managers
M&A and Corporate Development
Strategy Teams and R&D Heads
Procurement and Product Directors
Regulatory and Compliance Leaders
Investor Relations and Equity Analysts