Market Minds Advisory
Global Refinery Process Chemicals Market

Global Refinery Process Chemicals Market: What Makes the Cheap Crude Worth Buying

Refiners buy difficult crude for the discount and then spend roughly nine cents of treatment chemistry for every dollar of that discount, which is the best trade available anywhere on the site.

Lead Analyst

Bilal Shaikh

Published

September 2026

Make Smarter Decisions with Customized Research Insights

Request a free sample report and evaluate market opportunities, growth trends, and competitive dynamics relevant to your business needs.

2025 MARKET VALUE$6.4BMarket Size 2025
2036 FORECAST VALUE$10.7BBase Case , 2026 to 2036
CAGR 2026 TO 20364.8 %Bull 6.0% / Bear 3.6%
INCREMENTAL OPPORTUNITY$4.0BNet 10- year value creation
EXPANSION MULTIPLE1.60x2036 value over 2026 base
Strategic Levers
M&A Pipeline
Regional Outlook
Country Rankings
Competitive Intelligence
Segmental Deep-dive
Call-Us : 91 93563 13602

Executive Snapshot and Market Trajectory

Opportunity crude is cheap because it is difficult. Heavy, high acid and high salt slates carry discounts near six dollars a barrel, and treatment chemistry costs roughly 9% of that discount. The chemicals are what make the cheap barrel economic at all. Nothing else converts spend to margin like that.
That argument only works if somebody measures it, which is why this became a service business decades ago rather than a chemical one. Around 38% of contract value is delivered as monitoring, field engineering and performance guarantees rather than as product in a tote. The top five hold 58%, and the barrier is service infrastructure rather than formulation capability. Chemistry alone is reproducible and a network of resident engineers is not.
Fouling is where the growth is. Exchanger and furnace fouling sits behind roughly 27% of unscheduled outages, and renewable co-processing introduces polymerisation and gum formation that conventional antifoulant packages were never designed around at all. Antifoulants grow at 7.2%, half again the market rate of 4.8%, with India expanding fastest anywhere at 8.0% on new complexes and heavier slates together. Fouling is now the growth story.
Market Definition
Chemicals dosed into refinery process streams to control corrosion, fouling, separation and contamination, covering corrosion inhibitors and neutralisers, antifoulants and dispersants, desalter aids and demulsifiers, hydrogen sulphide and oxygen scavengers, antifoams, and fuel additives and flow improvers. Measured at supplier selling value including attached field service. Excludes catalysts and adsorbents, filtration equipment and consumables, water treatment plant chemistry outside the fence, and upstream production chemicals.
Base Year Value
$6.4B in 2025 (MMA Primary Research Dataset, August 2026)
Forecast Period
2026 to 2036, eleven discrete annual values
CAGR
4.8% base case. Bull 6.0%. Bear 3.6%.
Fastest Growth Segment
Antifoulants and Dispersants: 7.2% CAGR
Fastest Growth Country
India: 8.0% CAGR
Fastest Growth Region
South Asia and Pacific: 6.8% CAGR
Largest Region
East Asia: 28% of 2025 global value
Market Leaders
Ecolab, ChampionX, Baker Hughes, Clariant, Dorf Ketal. Source: MMA Primary Research Dataset, July 2026.
Primary Survey
n=3,800 procurement and R&D decision-makers, Q4 2025, six countries
Methodology
Demand-side build-up, cross-validated against public data, 47 expert interviews

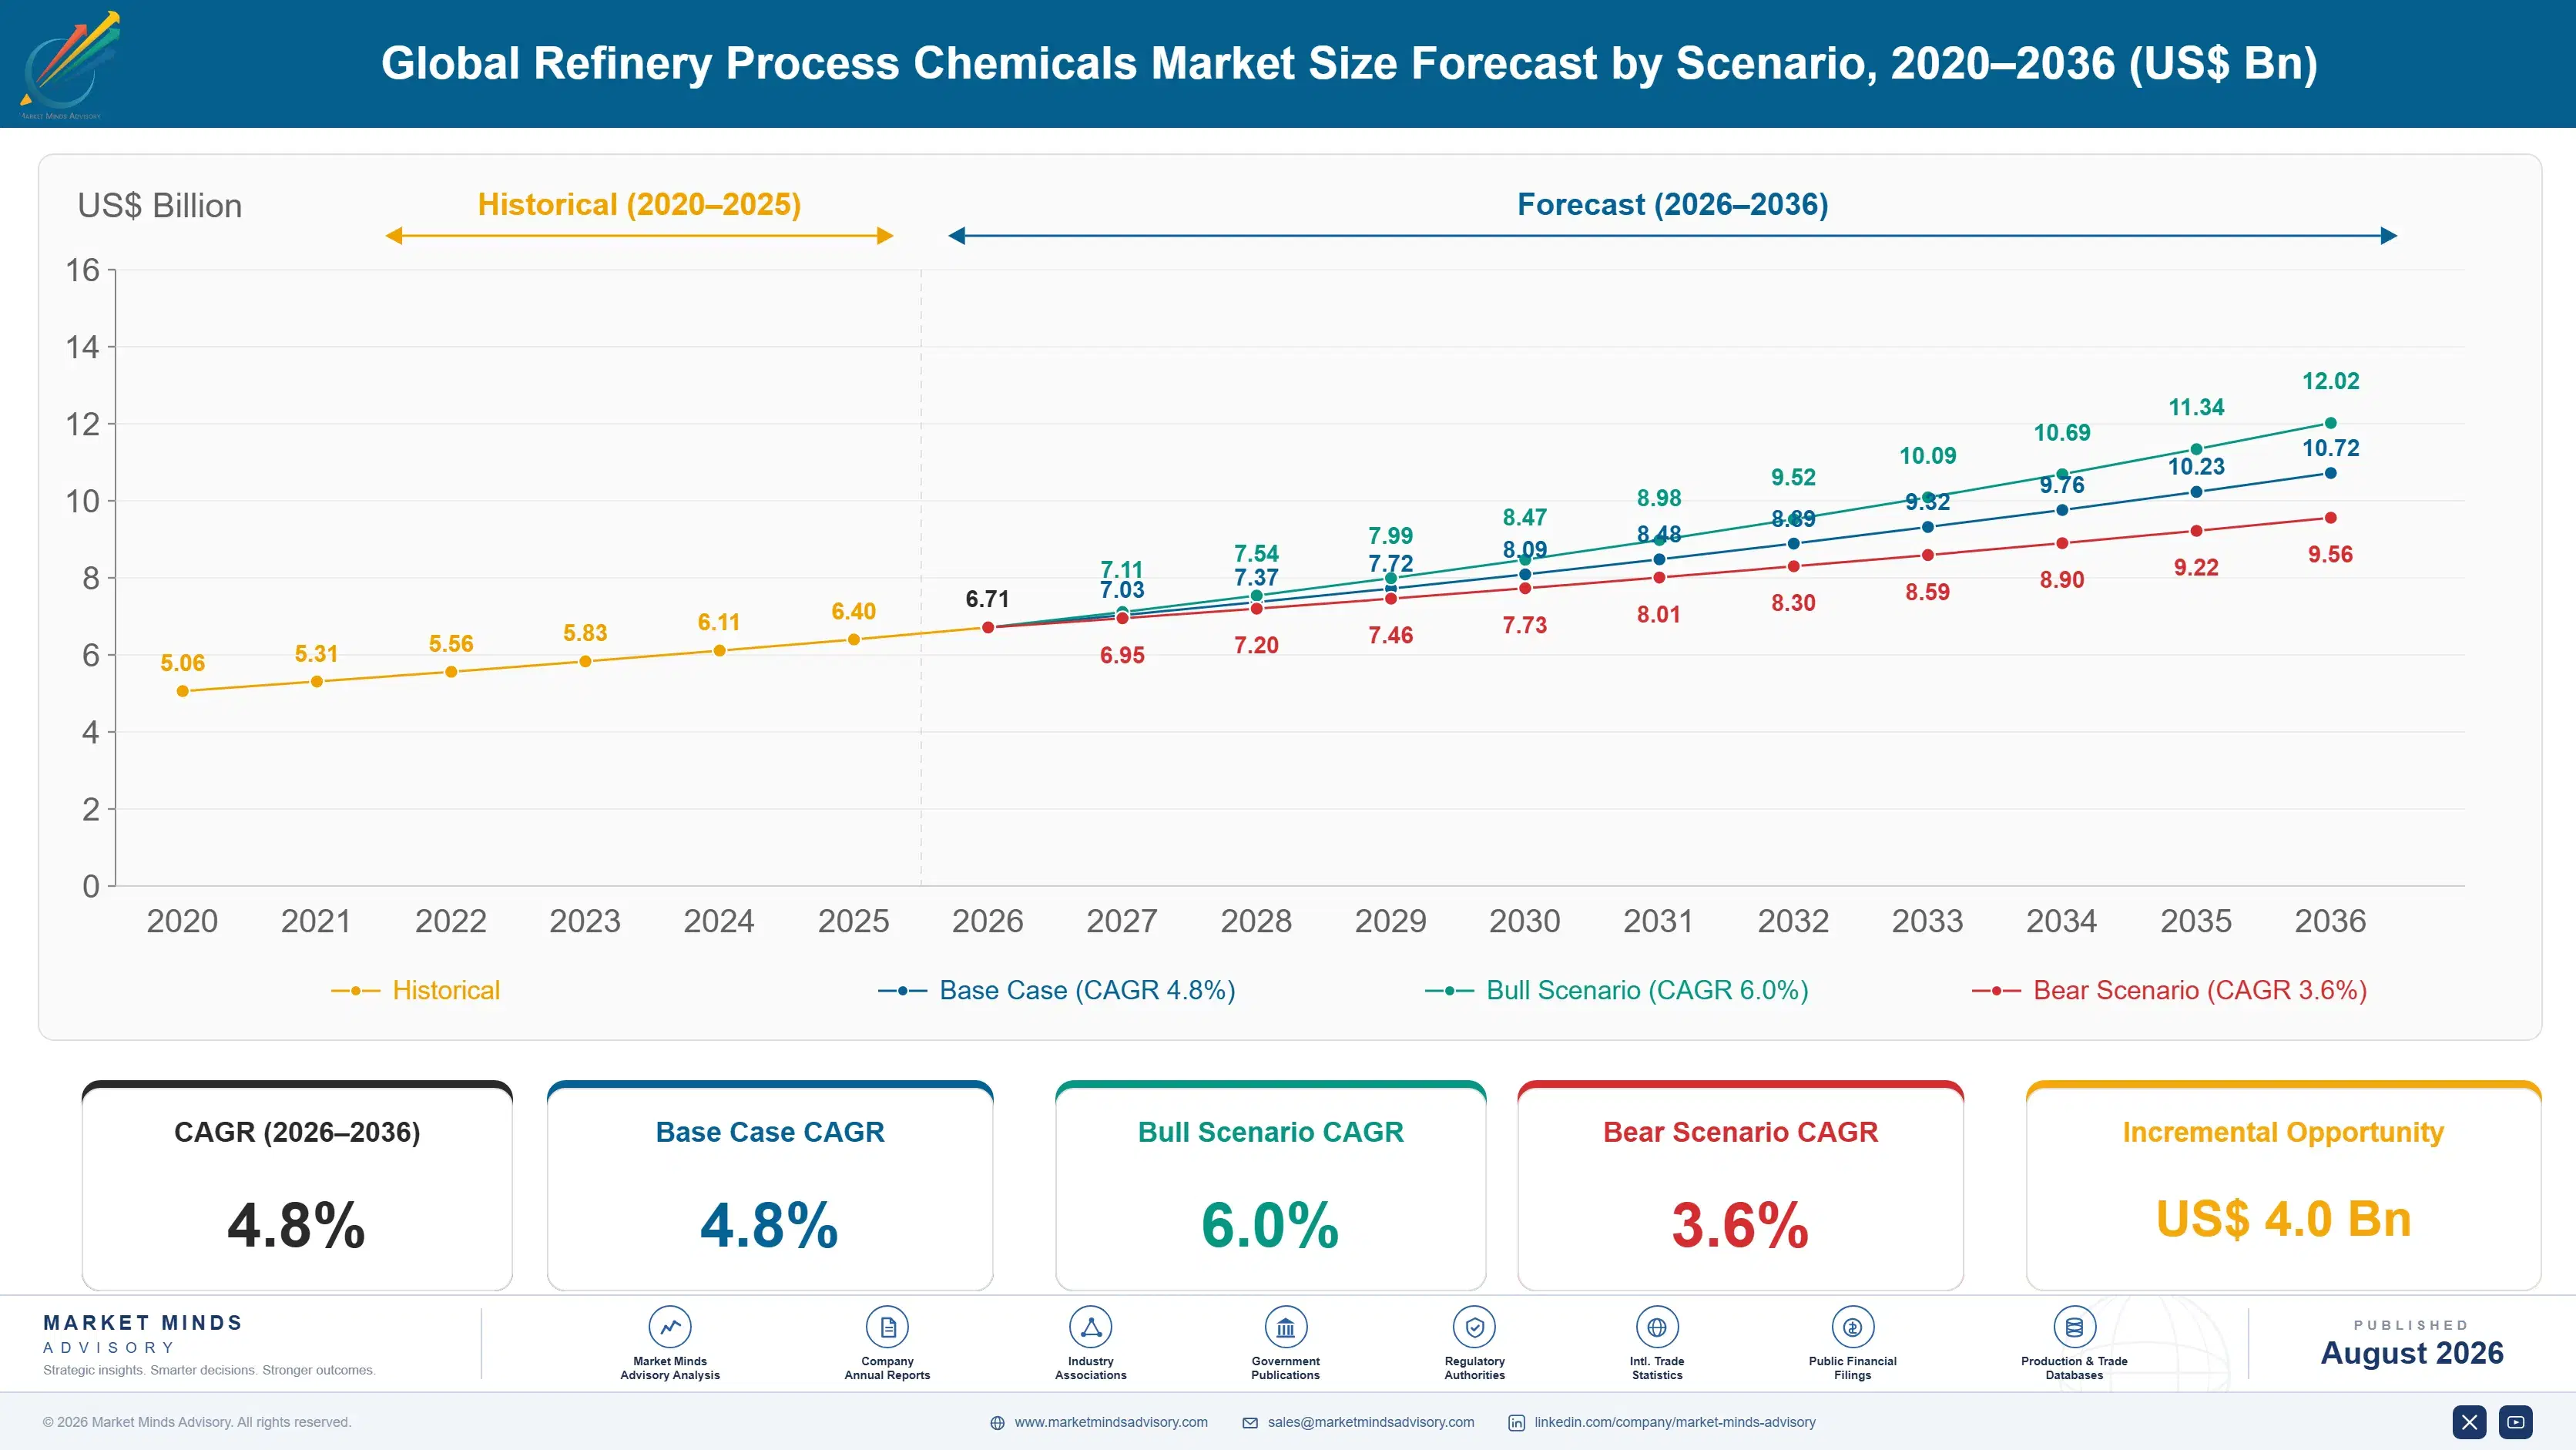
Global Refinery Process Chemicals Market Forecast Scenarios

refinery-process-chemicals-market-trends-size-forecast-scenario-1787594844757
Growth ran near 4.0% between 2020 and 2025, suppressed early as refinery run rates collapsed and treatment volumes fell with throughput. Recovery brought a shift in slate rather than a simple return, with refiners chasing opportunity crude discounts aggressively to rebuild margin. That raised chemical intensity per barrel even where throughput did not fully recover. Renewable co-processing began generating fouling behaviour that existing antifoulant packages handled poorly.
Base case 4.8% rests on three mechanisms. Opportunity crude processing continues because the discount is real and the treatment cost is roughly 9% of it, which is an arithmetic no refiner ignores for long. Renewable and recycled feedstock co-processing introduces polymerisation and organic acid corrosion that conventional packages were not built for. And Asian refining capacity keeps expanding, with India growing at 8.0% across new complexes and heavier slate processing at existing sites.
The bull case at 6.0% assumes crude quality continues deteriorating globally while co-processing volumes scale, both of which raise chemical intensity per barrel processed. The bear case at 3.6% is accelerated mature market refinery closure combined with light sweet crude oversupply narrowing opportunity discounts, which would remove the economic reason to treat aggressively in the first place.

Nine Cents on the Discount Dollar

The economics of this category sit entirely in somebody else's margin calculation. A refiner buys heavy, high acid or high salt crude because it trades at a discount near six dollars a barrel, and then spends roughly 9% of that discount on treatment chemistry to make the barrel processable without wrecking the unit. Nothing else on the site converts spending into margin at that ratio, and every refinery manager knows it.
TOP FIVE CONCENTRATION58%Service infrastructure narrows the field far more than chemistry
OPPORTUNITY CRUDE DISCOUNT6.20 per bblDiscount captured by running difficult crude slates instead
TREATMENT COST RATIO9%Chemical spend against the crude discount it enables
FIELD SERVICE VALUE SHARE38%Contract value delivered as monitoring rather than product
CORROSION MONITORING COVERAGE62%Refinery circuits now under continuous corrosion rate monitoring
FOULING SHUTDOWN ATTRIBUTION27%Unscheduled outages attributed to exchanger and furnace fouling
The argument only survives if somebody measures the result, which is why process chemicals became a service business long before most industrial chemicals did. Corrosion coupons, fouling rate monitoring, desalter performance tracking and continuous dosing control account for around 38% of contract value, delivered by field engineers who effectively live on the site. Around 62% of circuits now run under continuous corrosion monitoring.
Fouling is where the problem is growing rather than stable. Exchanger and furnace fouling sits behind roughly 27% of unscheduled outages, and renewable co-processing has made it worse in an unfamiliar way. Used cooking oil, tallow and pyrolysis oil polymerise and form gums under conditions conventional crude does not, so antifoulant packages built for asphaltene and coke precursors handle them poorly and require genuinely different chemistry.
"The chemical is almost never the thing being bought. A refiner is buying somebody to stand in front of the reliability meeting and say the crude unit will make it to turnaround, and the drums arriving every week are what that promise happens to be delivered in."
Director, Process Chemicals and Refining Technology Practice · MMA Chemicals and Materials Practice · August 2026

Market Trends

Renewable co-processing creating unfamiliar fouling and corrosion chemistry

Used cooking oil, tallow and plastic pyrolysis oil polymerise and form gums under conditions that conventional crude simply does not, while contributing organic acids and chlorides that attack circuits designed around sulphidic corrosion. Antifoulant packages built for asphaltene and coke precursors handle that behaviour poorly and need genuinely different chemistry rather than a higher dose. Antifoulants grow at 7.2% against a market rate of 4.8% on this alone, and most refiners discover the problem during operation rather than in design review. Arriving with a higher dose of the existing package fails visibly and quickly.
Market Impact: Costs 9% of crude discount
Continuous monitoring replacing periodic inspection across corrosion circuits

Around 62% of refinery circuits now run under continuous corrosion rate monitoring rather than periodic coupon retrieval, which changes what a chemicals supplier is actually selling. Real-time corrosion rates make treatment performance visible daily instead of quarterly, which suits a supplier whose product genuinely works and exposes one whose does not. It also supports performance-based contracting, where payment links to measured corrosion rate rather than to litres delivered, and roughly 38% of contract value now sits in service rather than product. That transparency quietly exposes any supplier relying on relationship inertia rather than results.
Market Impact: Indian demand growing at 8.0%

Market Opportunities and Growth Drivers

Opportunity crude economics justifying aggressive treatment programmes

Difficult crude slates trade at discounts near six dollars a barrel and cost roughly 9% of that discount to treat, which is the most favourable spending ratio available anywhere on a refinery site. Refiners rebuilding margin after the demand collapse pursued those barrels hard, raising chemical intensity per barrel even where throughput had not fully recovered. The argument is straightforward enough that it reaches commercial and economics functions rather than only maintenance, which is a considerably better audience. Slate selection sits with people who never normally see a chemical contract.
Market Impact: Service carries 38% of value

Asian refining capacity expansion shifting treatment demand eastward

Refining capacity closed across Europe and Japan while expanding in China, India and the Gulf, relocating treatment demand rather than reducing it. India grows fastest anywhere at 8.0% across new complexes and heavier slate processing at existing sites. New facilities specify treatment programmes during commissioning, which favours suppliers with regional field service presence rather than product capability alone. Building that presence ahead of capacity is expensive and is what separates the participants who capture the growth from those who watch it. Distributor coverage cannot substitute, since monitoring is not deliverable remotely at any price.
Market Impact: Strands 38% service cost base

Market Restraints and Challenges

Field service infrastructure making regional entry expensive and slow

Around 38% of contract value is monitoring and field engineering, which means serving a refinery requires engineers stationed near it rather than a distribution arrangement. The root cause is that treatment performance must be measured continuously to be worth anything, and remote supply cannot do that. Commercially it keeps the top five at 58% and makes regional entry a multi-year investment before revenue arrives. Partnerships with regional service providers are the mitigation participants use, at the cost of relationship control. Clustering coverage across nearby sites is how the cost gets spread.
Market Impact: Antifoulants growing at 7.2%

Mature market refinery closures removing treated capacity permanently

European and Japanese refinery closures remove treatment demand permanently rather than deferring it, and they strand the field service infrastructure built around those sites. The root cause is overcapacity in mature markets against expanding Asian and Gulf capacity. Commercially it forces suppliers to redeploy engineers or carry them against shrinking revenue. Participants are moving toward petrochemical, renewable fuel and biorefinery facilities, which need comparable chemistry and service on a demand trajectory heading the other way. Redeployment preserves capability that would otherwise be written off entirely rather than merely relocated. Refining regions are geographically concentrated, which helps.
Market Impact: Covers 62% of monitored circuits
4 additional market trends, 3 additional growth drivers, and 2 additional restraints and challenges are covered in the full report. Contact sales@marketmindsadvisory.com to access the complete intelligence.

Segment CAGR and Growth Architecture

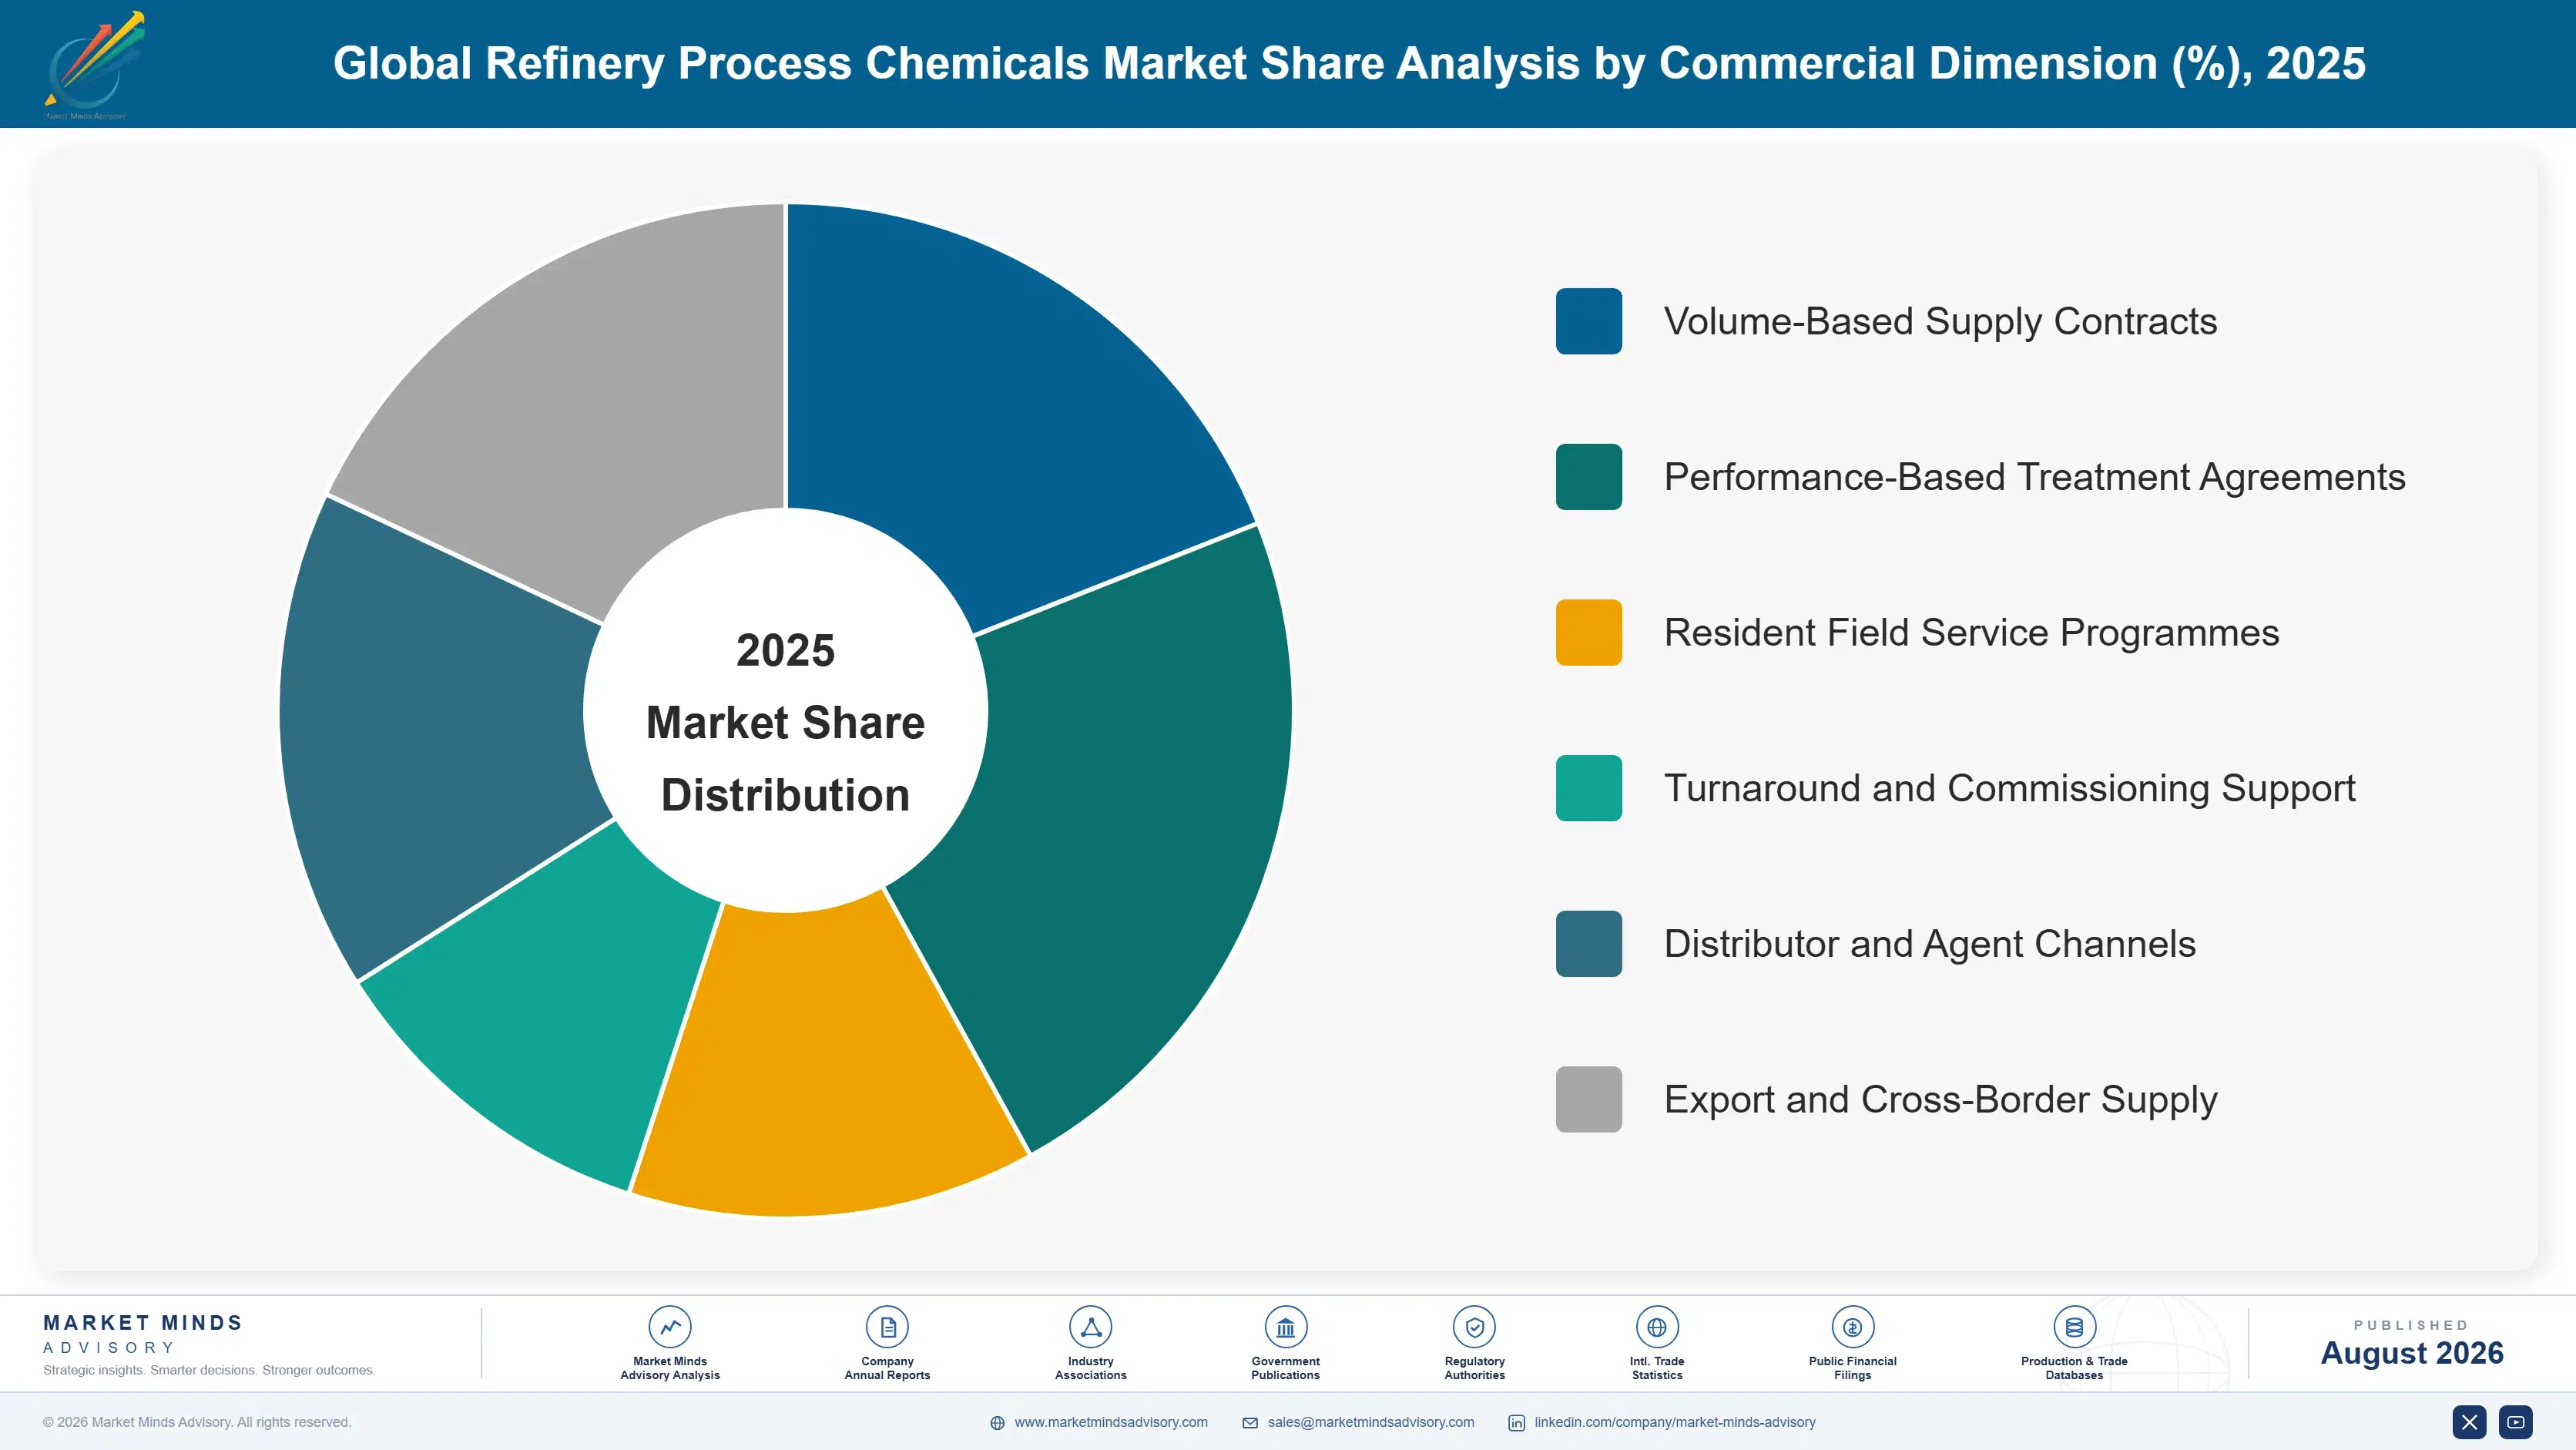
Six segments split by chemical treatment function, because each addresses a distinct failure mechanism, dosing point and measurement method even where one supplier provides all six to the same site. Formulation family and delivery form variants sit inside each function rather than beside them. End-use process unit and channel are handled in the framework instead.
refinery-process-chemicals-market-trends-market-share-analysis-1787594845320

Antifoulants and Dispersants

Growing at 7.2%, half again the market rate of 4.8%, antifoulants address exchanger and furnace fouling that sits behind roughly 27% of unscheduled outages, which gives them a value case tied to a specific and expensive failure. Renewable co-processing has changed the chemistry involved, since used cooking oil, tallow and pyrolysis oil polymerise and form gums under conditions conventional crude does not. Packages built for asphaltene and coke precursors handle that poorly and require genuinely different chemistry rather than more of the same. Fouling rate monitoring makes performance visible, which favours suppliers whose product works and exposes those relying on the relationship. Most refiners meet the problem in operation rather than in design review.
CAGR 7.2%

Desalter Aids and Demulsifiers

At 6.0% desalter chemistry is what makes high salt opportunity crude processable, removing chlorides that would otherwise generate hydrochloric acid in the overhead and attack the whole circuit. Discounts near six dollars a barrel are the reason refiners buy those slates, and desalter performance decides whether the discount survives contact with the unit. Emulsion behaviour varies sharply between crudes, so programmes are tailored per slate rather than standardised, which makes supplier application knowledge worth more than product specification. Renewable feedstocks bring water and surfactant-like species that degrade separation and have forced reformulation across the segment. Programmes are tailored per slate rather than standardised, which makes the supplier's application knowledge considerably more valuable than any product specification sheet.
CAGR 6.0%
Full segment breakdown across 6 segments available in the complete report.

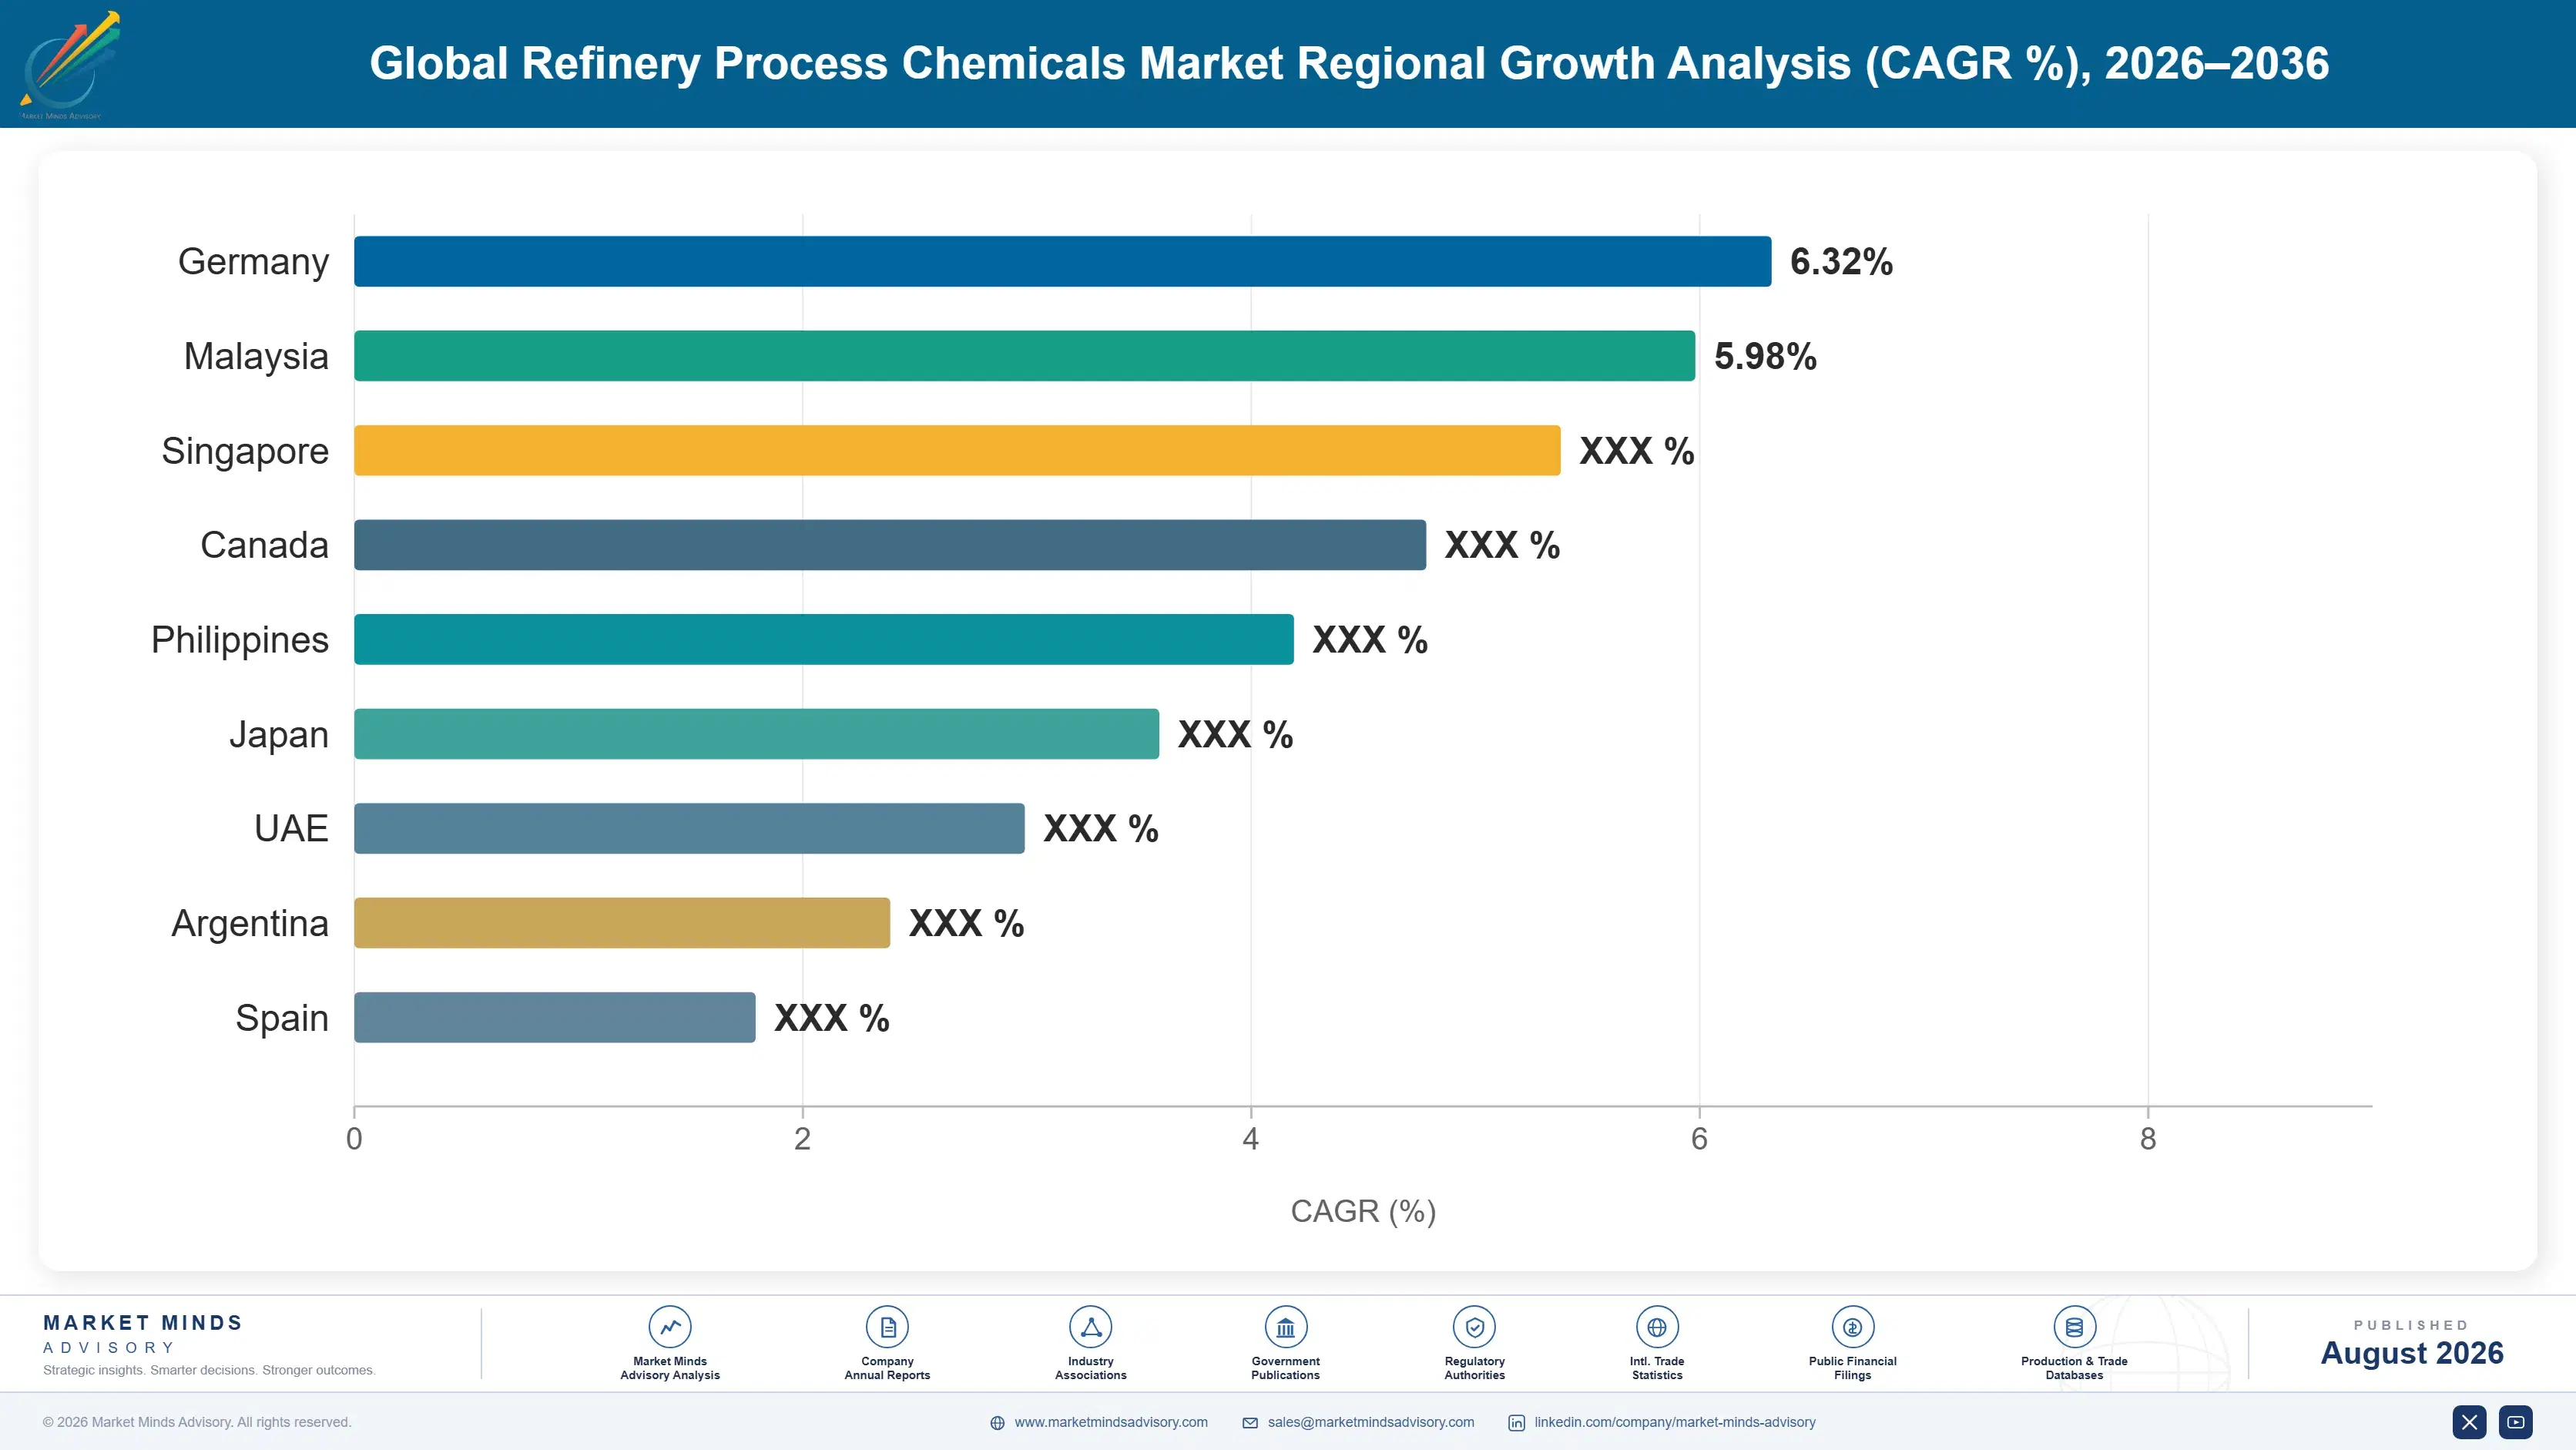
Regional Architecture and Country Demand Map

East Asia holds 28% of value on Chinese refining capacity that is now the largest anywhere in the world. North America follows at 24% on complex refineries running heavy sour slates, with the Middle East at 11% on integrated Gulf complexes of unmatched individual scale.

North America

Gulf Coast refineries are among the most complex anywhere and run heavy sour slates deliberately, which makes chemical intensity per barrel higher here than in most regions. Opportunity crude economics are pursued aggressively and understood well at commercial level rather than only in maintenance. Renewable diesel conversion has been more extensive than anywhere else, generating fouling and corrosion behaviour that existing programmes handled poorly at several converted sites. Field service presence is dense and long established, which makes displacing an incumbent supplier difficult. Growth of 3.8% reflects slate intensity rather than any capacity addition. Performance-based contracting is more established here than anywhere else. Displacing a long established incumbent supplier here is genuinely difficult.
Share: 24% | CAGR: 3.8% (2026 to 2036)

Western Europe

Share sits at 16% against a band of 18 to 26% because refinery closures have removed treated capacity permanently across the region and the remaining base skews toward lighter, less chemically demanding slates. Renewable fuel conversion has absorbed part of the lost demand, bringing organic acid corrosion and polymerisation fouling that conventional packages address poorly. Northern European sites lead on co-processing sophistication and on performance-based contracting. Suppliers are redeploying field engineers toward petrochemical and biorefinery facilities. Growth at 3.2% runs well below the base case as closures offset intensity gains. Performance-based contracting and co-processing sophistication both lead here, which partly offsets the shrinking installed base in value terms. Engineers are being redeployed rather than released.
Share: 16% | CAGR: 3.2% (2026 to 2036)
Regional intelligence for 5 additional markets available in the complete report: East Asia, South Asia and Pacific, Latin America, Middle East and Africa, Eastern Europe. Contact sales@marketmindsadvisory.com.
refinery-process-chemicals-market-trends-country-cagr-analysis-1787594845857

Four Moves on Somebody Else's Margin

The strongest argument in this business belongs to the customer's crude economics rather than to the chemistry in the tote. Treatment costs roughly 9% of a discount worth around six dollars a barrel, and a supplier who builds that calculation reaches the people deciding slate selection rather than the ones approving a chemical purchase order.

Build the slate economics case, not the chemical case

Difficult crude trades at discounts near six dollars a barrel and costs around 9% of that discount to treat, which is the best conversion of spending into margin anywhere on a refinery site. Presenting that calculation against a specific slate reaches crude economics and commercial functions rather than maintenance procurement. Those functions decide what the site buys and processes, which is a far larger decision than a chemical contract. Very few suppliers frame the discussion at that level at all. It is also an argument the customer can verify independently, which is rare.
Market Impact: Costs 9% of a six dollar per barrel discount

Contract on measured performance rather than volume supplied

Around 62% of circuits run under continuous corrosion monitoring, which makes treatment performance visible daily rather than quarterly. That suits a supplier whose chemistry genuinely works and exposes one relying on relationship inertia. Performance-based contracts linking payment to measured corrosion and fouling rates convert a commodity supply arrangement into something a competitor cannot underbid on price alone, and roughly 38% of contract value already sits in service rather than product. Retention and realised margin both run above volume arrangements on chemistry that is frequently identical. Contract form rather than product performance is doing much of the work there.
Market Impact: Uses the existing 62% monitoring coverage already installed

Develop co-processing chemistry before customers need it

Renewable feedstocks polymerise and form gums under conditions conventional crude does not, and packages built for asphaltene and coke precursors handle that badly. Most refiners discover the problem during operation rather than design review, which makes the supplier who already has an answer extremely welcome and extremely well positioned. Antifoulants grow at 7.2% largely on this, and the chemistry is different enough that arriving with a higher dose of the existing product fails visibly. Positions won during a fouling crisis tend to last well beyond it. Development ahead of demand is the only way to be holding an answer.
Market Impact: Serves 7.2% growth across the whole antifoulant range

Place field engineers ahead of Asian capacity commissioning

Monitoring cannot be delivered remotely, so serving a refinery requires engineers stationed near it and that presence takes years to build. India grows fastest at 8.0% and new complexes specify treatment programmes during commissioning rather than afterwards. A supplier without regional presence at that moment cannot participate whatever its chemistry does. The investment is expensive and precedes revenue, which is exactly why it separates participants capturing Asian growth from those watching it happen. Two recent Indian awards excluded bidders lacking local presence regardless of price. Building presence ahead of revenue is what separates the participants capturing this growth.
Market Impact: Reaches 8.0% annual growth in Indian treatment demand

Who Controls the Margin Pool

Participation is measured on annual refinery process chemicals revenue including attached field service, and the top five hold 58%. Concentration reflects service infrastructure rather than formulation capability, since chemistry alone is reproducible while a network of resident engineers is not. Ecolab and ChampionX lead on installed service presence and performance contracting depth. The gap to challengers is field engineering coverage rather than product performance. Chemistry alone is reproducible; a resident network is not.
Competition runs on three fronts. Service density decides which sites a supplier can serve at all, because monitoring is not deliverable remotely. Measured performance decides contract renewal, since continuous corrosion data makes results visible daily. Co-processing chemistry decides new positions, as refiners encountering unfamiliar fouling look for somebody who already has an answer rather than a development programme. Refiners meeting unfamiliar fouling want an answer rather than a development programme.

The industry consolidated substantially over the last decade. Ecolab acquired Nalco in 2011, and SLB completed its acquisition of ChampionX in 2025 after an extended regulatory review. Expect service network investment and co-processing development rather than further large transactions. Rankings shift as Asian capacity commissions and as regional suppliers build the field presence that has protected incumbents.
refinery-process-chemicals-market-trends-company-positioning-matrix-1787594846380

Competitive Moat and Risk Dimensions

ECOLAB

Moat: Resident field engineering density

A dense network of engineers stationed at or near refinery sites delivers the monitoring that makes treatment performance measurable, and that presence takes years and considerable expense to reproduce. A competitor with equivalent chemistry still cannot deliver the daily corrosion and fouling data that performance contracting depends on, which keeps the relationship far stickier than product quality alone would.
ECOLAB

Risk: Mature market closure exposure

Field service infrastructure is built around specific sites, and European and Japanese refinery closures strand engineers and depots that cannot simply be relocated to Asian capacity. Carrying that cost against shrinking revenue, or writing it off, is a problem that a lighter product-only competitor does not face at all in the same markets.
CHAMPIONX

Moat: Integrated production and refining reach

Capability spanning upstream production chemistry and refinery treatment lets the company follow a barrel from wellhead to crude unit, which matters when slate variability is the source of the treatment problem in the first place. Understanding what arrives before it arrives is a genuine advantage in desalter and corrosion programme design.
CHAMPIONX

Risk: Post-acquisition integration disruption

The SLB acquisition completed in 2025 brings organisational change to a business whose value rests on stable, long-standing relationships between individual field engineers and individual refinery reliability teams. Those relationships are precisely what disrupts most easily during integration, and competitors are actively recruiting into that uncertainty.

Players Tracked

Prominent Players

Ecolab
ChampionX
Baker Hughes
Clariant
Dorf Ketal

Other Key Players

BASF
Innospec
Solenis
Kemira
Halliburton Multi-Chem
Veolia Water Technologies
Chevron Oronite
Infineum
Afton Chemical
Lubrizol
Croda
Arkema
Q2 Technologies
Impact Chemical Technologies
Thermax

Recent Developments

MARCH 2026

Refiner links treatment payment to measured corrosion rate across crude unit

A refining operator restructured its corrosion treatment contract to link supplier payment to measured corrosion rates from continuous monitoring rather than to chemical volumes delivered. The arrangement covers the crude unit overhead and atmospheric tower circuits across a full turnaround cycle. Chemical volumes are no longer the basis of payment.
Signal: Continuous monitoring now makes performance contracting practical, which clearly favours chemistry that demonstrably works every day
SEPTEMBER 2025

Co-processing site reformulates antifoulant package after gum fouling

A refinery co-processing used cooking oil reformulated its antifoulant programme after gum and polymer fouling appeared in preheat exchangers at rates conventional packages had not controlled. Increased dosing of the original product had failed to arrest the fouling rate at all. A different chemistry family was required entirely.
Signal: Renewable feed fouling requires genuinely different chemistry rather than more of the same conventional antifoulant package
JUNE 2025

SLB completes acquisition of ChampionX after extended regulatory review

SLB completed its acquisition of ChampionX following an extended regulatory review across multiple jurisdictions. The combination brings production chemistry and refinery treatment capability under common ownership alongside broader oilfield services, concentrating service networks further across both segments. Regulatory review ran across several jurisdictions. Both businesses serve overlapping customer sites.
Signal: Consolidation keeps concentrating service networks rather than chemistry, which is exactly where the real barrier sits

Actives, Solvents and Engineers

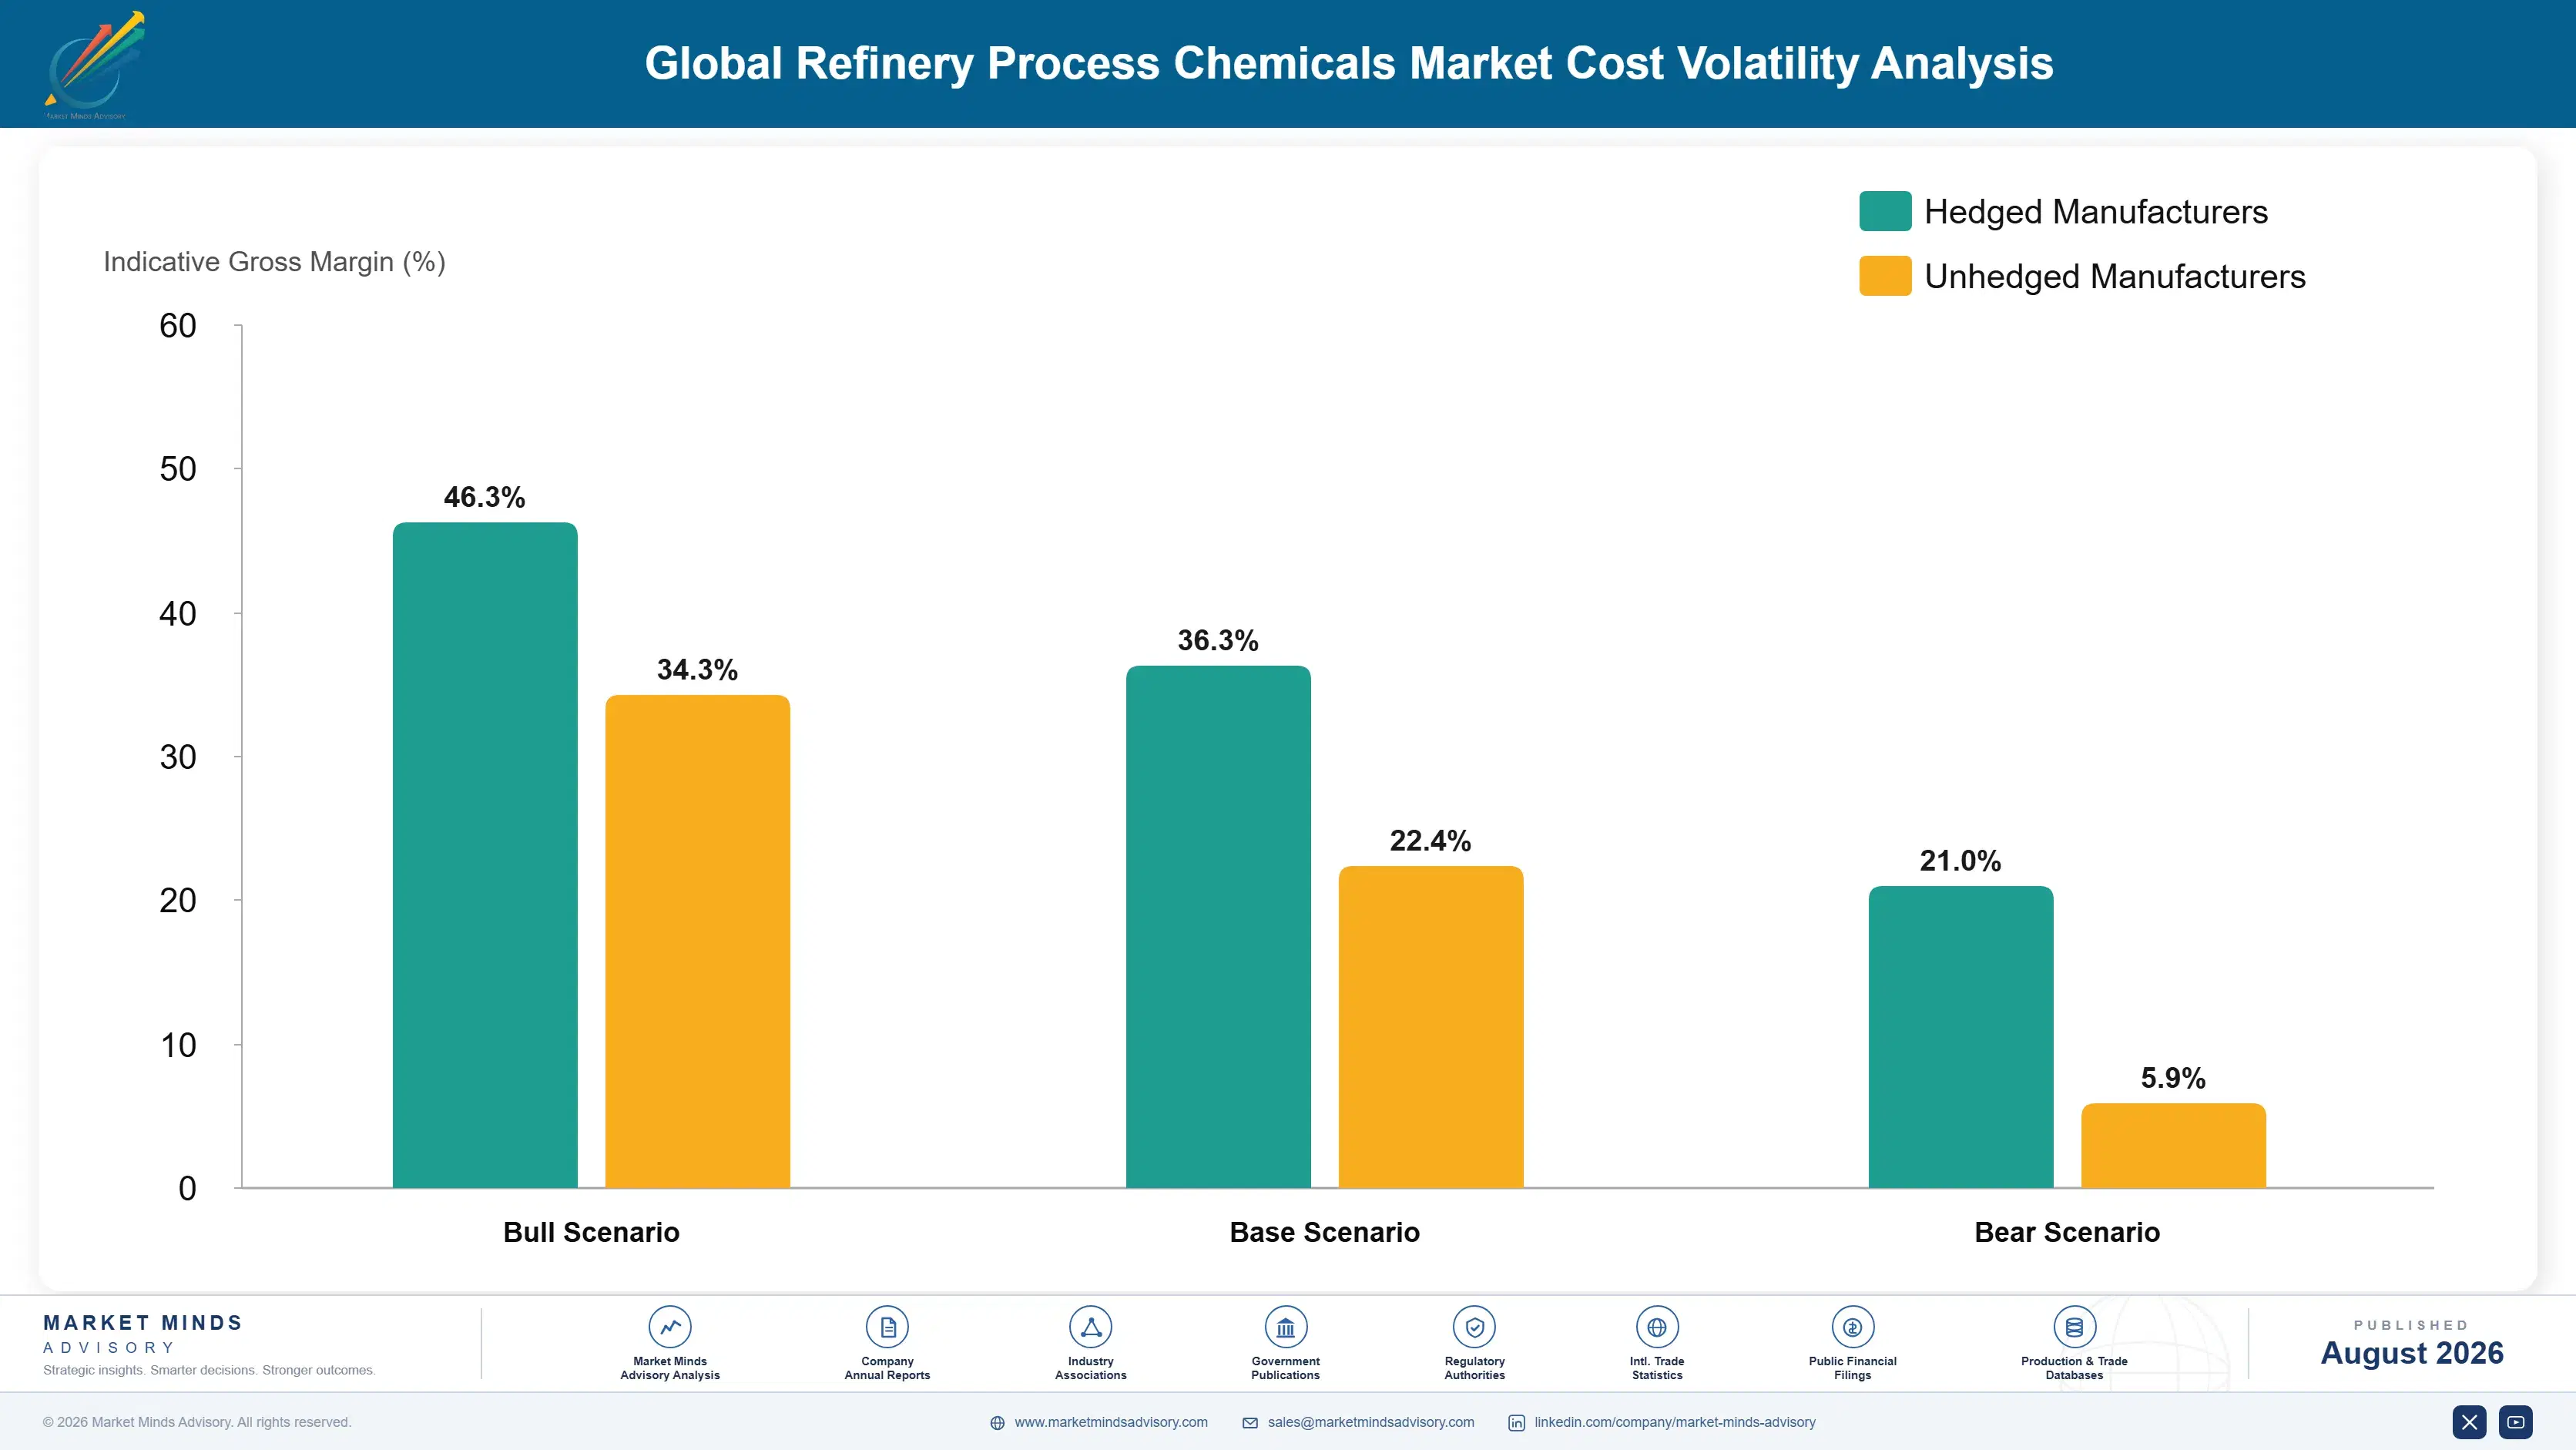
Chemical actives account for roughly 41% of delivered cost, spanning amines, imidazolines, polymeric dispersants and surfactants drawn from petrochemical derivative supply. Solvents and carriers carry about 14%, moving with the same feedstock cycles. Field engineering salaries and site presence take around 27%, which is unusually high for a chemicals business and is precisely what the customer is paying for. Blending, logistics and monitoring equipment absorb the balance.
Amine and surfactant intermediate pricing rose sharply through 2021 and 2022 on ethylene oxide and propylene derivative costs, per EIA petrochemical price reporting for the period, compressing margin on multi-year treatment contracts that reprice slowly. Engineering salary inflation ran alongside it across the same period, which hit the service cost base independently. The two exposures compounded rather than offsetting, which was unusual and painful for suppliers on fixed terms.

Exposure divides on contract structure and on service intensity. A supplier on volume-based contracts carries active cost exposure with limited repricing, while performance-based arrangements generally index more readily because the customer is buying an outcome. Field engineering cost is the harder problem, since it is largely fixed against site presence commitments and cannot be cut without conceding the capability that justifies the model.
refinery-process-chemicals-market-trends-cost-volatility-analysis-1787594846575

Index treatment contracts to published petrochemical derivative references

Chemical actives are roughly 41% of delivered cost and derive from ethylene oxide and propylene chains that move independently of refining margin. Indexing multi-year contracts to published references passes movement through with a defined lag. Performance-based arrangements accept indexation more readily than volume contracts, since the customer is already buying an outcome rather than a litre price.

Share field engineering across clustered refinery sites

Field presence is around 27% of cost and largely fixed against site commitments, which makes single-site coverage expensive to justify. Clustering coverage across nearby refineries and petrochemical facilities spreads that cost without conceding response time. Refining regions are geographically concentrated in most markets, which makes this more achievable than it first appears to be.

Redeploy service capability toward petrochemical and biorefinery sites

Mature market refinery closures strand engineers and depots built around specific locations, and carrying that cost against shrinking revenue is unsustainable for long. Petrochemical, renewable fuel and biorefinery facilities need comparable chemistry and service on a demand trajectory heading the other way entirely. Redeployment preserves capability and relationships that would otherwise simply be written off entirely.

Portfolio Architecture for Margin Defence

Margin here follows measurability more than chemistry, which is unusual for an industrial chemicals business. Commodity treatment products supplied on volume contracts earn margins in the high teens to low twenties, because the customer buys litres against a specification and regional suppliers can match the formulation without matching anything else. Regional suppliers compete effectively at this level without needing any field capability.
Application-specific programmes tailored to a slate and monitored on site do considerably better in the high twenties to high thirties, because emulsion and fouling behaviour varies enough between crudes that supplier application knowledge is worth more than product specification. The range reflects field engineering depth and how closely programmes track slate changes. Emulsion and fouling behaviour varies enough between crudes to make that knowledge genuinely scarce.

Performance-contracted programmes hold the strongest position, reaching into the mid forties, because payment links to measured corrosion and fouling rates rather than to volume delivered. Those margins reflect monitoring infrastructure and the willingness to carry outcome risk, neither of which a product-only competitor can offer at any price it chooses. Carrying outcome risk is what a product-only competitor declines to do.

Commodity Treatment Chemicals

Standard scavengers, antifoams and general treatment products supplied on volume contracts. The seven point range reflects active cost position and blending scale rather than product difference, since formulations are widely reproducible.
Gross Margin: 17-24%

Slate-Specific Monitored Programmes

Desalter, corrosion and antifoulant programmes tailored to a specific crude slate with on-site monitoring. The eleven point range reflects field engineering depth and how closely programmes track changing slate composition through the year.
Gross Margin: 27-38%

Performance-Contracted Treatment

Programmes where payment links to measured corrosion and fouling rates rather than volume supplied. The twelve point range reflects monitoring infrastructure and willingness to carry genuine outcome risk on the result.
Gross Margin: 34-46%
refinery-process-chemicals-market-trends-portfolio-architecture-1787594847073

High-value Sub-segments and Strategic Watch-out

Performance-Contracted Programmes

High value and growing, since continuous monitoring across roughly 62% of circuits now makes outcome-based payment practical. It also creates a position that a product-only competitor cannot underbid, because the offer is not comparable at all. Retention runs well above volume contracts. Outcome risk is the differentiator.
Gross Margin: 36-46%

Renewable Co-Processing Chemistry

High value and growing at 7.2%, since polymerisation and gum fouling behave unlike anything conventional packages were built to control. Refiners discovering it mid-operation welcome a supplier who already has a working answer. Packages built for asphaltene and coke precursors handle it poorly at any dose.
Gross Margin: 31-42%

Commodity Scavengers and Antifoams

The volume core, bought on litre price against a specification any competent formulator can reproduce. Regional suppliers compete effectively here because no field engineering capability is required to participate at all. Litre price settles the comparison every time. Any competent formulator can reproduce the product.
Gross Margin: 17-24%

Mature Market Service Infrastructure

The strategic watch-out. Refinery closures strand engineers and depots built around specific sites, and the sixteen point range reflects how far suppliers have redeployed toward petrochemical and biorefinery facilities instead. Engineers and depots cannot simply be relocated to Asian capacity as it commissions. Redeployment is the only real answer.
Gross Margin: 12-28%

Dosed Daily, Reviewed Annually

Treatment chemicals are consumed continuously while the unit runs, which ties volume to throughput rather than to any purchasing cycle and makes demand about as predictable as anything in industrial supply. A programme established on a unit runs until the slate changes or the contract is retendered. Chemical intensity per barrel rises with slate difficulty, so a refiner chasing opportunity crude increases consumption without processing a single extra barrel.
Stickiness depends almost entirely on service depth. A supplier with resident engineers holding daily corrosion and fouling data is embedded in the site's reliability process, and displacing them means replacing a monitoring capability rather than switching a product. Performance-contracted programmes are stickier still. Commodity scavengers and antifoams bought on litre price switch at retender without any difficulty at all.

The specifying function sits higher than most chemical purchases reach. Reliability and process engineering hold the technical decision, as they always have. Crude economics and commercial functions have entered because treatment cost is roughly 9% of an opportunity crude discount, which makes chemistry part of the slate selection decision rather than a consequence of it. Chemistry has become part of the slate decision rather than a consequence of it.
refinery-process-chemicals-market-trends-end-use-penetration-index-1787594847562

Where We Would Focus Effort

These are among the four positions where our research anticipates prominent divergence between winners and laggards over the coming forecast period. Each is grounded in the demand model, the regulatory perimeter, and the announced capacity pipeline.
01 / SLATE ECONOMICS FRAMING

Sell the crude discount, not the chemistry

Difficult crude slates trade at discounts near six dollars a barrel and cost roughly 9% of that discount to treat, which is the best conversion of spend into margin available anywhere on a refinery site. Presenting that calculation against a specific slate reaches crude economics and commercial functions rather than the maintenance procurement desk that normally handles chemical purchasing. Those functions decide what the site buys and processes, which is a considerably larger decision than any chemical contract ever is.
02 / OUTCOME BASED CONTRACTING

Get paid for the corrosion rate, not the litre

Around 62% of refinery circuits now run under continuous corrosion monitoring, which makes treatment performance visible daily rather than at quarterly coupon retrieval as it once was. That transparency suits a supplier whose chemistry genuinely works and quietly exposes one that has been relying on relationship inertia for a good many years. Performance-based contracts convert a commodity supply arrangement into an offer a product-only competitor cannot underbid, because what is being sold is no longer comparable on a price per litre basis.
03 / CO-PROCESSING CHEMISTRY READINESS

Have the answer before the customer has the problem

Renewable and recycled feedstocks polymerise and form gums under conditions conventional crude does not, and packages built for asphaltene and coke precursors control that behaviour poorly whatever the dose. Most refiners discover this during operation rather than in design review, which makes a supplier arriving with a working answer both welcome and unusually well positioned for the years afterwards. Antifoulants grow at 7.2% largely on this problem, and turning up with more of the existing product fails visibly and rather quickly.
04 / ASIAN PRESENCE TIMING

Engineers on the ground before commissioning day

Monitoring cannot be delivered remotely at any price, so serving a refinery requires engineers stationed near it and that presence takes years and real money to establish properly. India grows fastest anywhere at 8.0% and new complexes specify treatment programmes during commissioning rather than at some point afterwards. A supplier without regional presence at that moment cannot participate whatever its chemistry happens to do, which is exactly how most Asian growth is currently being allocated across the whole of the region.

Engagement Snapshot From the Field

A live engagement with an industry participant carrying material or product regulatory and market exposure ahead of a defining policy shift, showing how our research translates into a defensible multi-year portfolio strategy.
MARKET MINDS ADVISORY · CLIENT ENGAGEMENT SUMMARY
Global Refinery Process Chemicals Producer Strategic Portfolio Review and Transition Roadmap 2026·Investment Scenario on Global Refinery Process Chemicals Exposure Evaluation 2025-26
CLIENT PROFILE
An international process chemicals supplier serving refineries across North America and Europe with corrosion, fouling and desalter programmes, at annual revenue near 420 million dollars (client-reported, unverified by MMA). Field engineering presence was dense in both regions, contracts were priced on volume supplied, and Asian coverage was handled through distributors without any resident engineers anywhere in the region.
STRATEGIC CHALLENGE
European closures had removed three treated sites in two years while Asian capacity the company could not serve kept commissioning. Management were weighing whether to build Asian field presence ahead of revenue, or to defend mature market share more aggressively, and had no framework for comparing an investment against a defence.
MMA APPROACH
MMA sized treated capacity movements by region against announced closures and commissionings, benchmarked performance-based against volume-based contract retention and margin, costed resident engineering presence in three Asian markets, and assessed redeployment options for stranded European service capability. Interviews with 47 experts covered refinery reliability practice, treatment contracting structures and process chemistry development.
KEY FINDINGS
  1. Treated capacity in the client's European territories was projected to fall by roughly a fifth within seven years on announced closures alone, before any further decisions were taken.
  2. Performance-contracted accounts across the industry showed retention and realised margin materially above volume-contracted equivalents, on chemistry that was in several cases identical.
  3. Two recent Indian awards had excluded bidders lacking resident field engineering, meaning distributor coverage could not win work regardless of price or chemistry offered.
  4. Stranded European service capability could be redeployed to petrochemical and renewable fuel sites within the same regions, preserving most of the capability rather than writing it off.
CLIENT PROFILE
An international process chemicals supplier serving refineries across North America and Europe with corrosion, fouling and desalter programmes, at annual revenue near 420 million dollars (client-reported, unverified by MMA). Field engineering presence was dense in both regions, contracts were priced on volume supplied, and Asian coverage was handled through distributors without any resident engineers anywhere in the region.
STRATEGIC CHALLENGE
European closures had removed three treated sites in two years while Asian capacity the company could not serve kept commissioning. Management were weighing whether to build Asian field presence ahead of revenue, or to defend mature market share more aggressively, and had no framework for comparing an investment against a defence.
MMA APPROACH
MMA sized treated capacity movements by region against announced closures and commissionings, benchmarked performance-based against volume-based contract retention and margin, costed resident engineering presence in three Asian markets, and assessed redeployment options for stranded European service capability. Interviews with 47 experts covered refinery reliability practice, treatment contracting structures and process chemistry development.
KEY FINDINGS
  1. Treated capacity in the client's European territories was projected to fall by roughly a fifth within seven years on announced closures alone, before any further decisions were taken.
  2. Performance-contracted accounts across the industry showed retention and realised margin materially above volume-contracted equivalents, on chemistry that was in several cases identical.
  3. Two recent Indian awards had excluded bidders lacking resident field engineering, meaning distributor coverage could not win work regardless of price or chemistry offered.
  4. Stranded European service capability could be redeployed to petrochemical and renewable fuel sites within the same regions, preserving most of the capability rather than writing it off.
RECOMMENDED STRATEGY
Phase 1: Phase one: convert defensible mature market accounts to performance-based contracts, where retention and margin both run materially above volume arrangements. Phase 2: Phase two: place resident field engineering in two Asian markets ahead of commissioning, accepting the investment precedes revenue by several years. Phase 3: Phase three: redeploy stranded European service capability toward petrochemical and renewable fuel facilities rather than carrying or writing it off.
OUTCOME
The supplier converted eleven accounts to performance contracting during 2026 and reported improved retention alongside higher realised margin (client-reported, unverified by MMA). Resident engineering was established in two Asian markets, and European redeployment preserved most of the capability released by closures. Volume-based pricing was withdrawn from new proposals entirely.

Frequently Asked Questions

Foundational context covering the market sizes, CAGR, scope, country, region and competition that inform every finding below. This section is provided to cover basics and most often pre-purchase conversations, answered from the MMA Primary Research Dataset.

What is the current size of the Global Refinery Process Chemicals Market?

MMA sizes it at USD 6.4 billion in 2025, rising to USD 6.71 billion in 2026. The figure covers chemicals dosed into refinery process streams, including attached field service, at supplier selling value.

How large will the Global Refinery Process Chemicals Market be by 2036?

USD 10.72 billion by 2036, an incremental USD 4.01 billion over the 2026 base and an expansion multiple of 1.60 times. Antifoulants account for a disproportionate share.

What is the CAGR for the Global Refinery Process Chemicals Market 2026 to 2036?

4.8% in the base case, with a bull case at 6.0% and a bear case at 3.6%. The spread turns on crude quality trends and on mature market refinery closures.

Which segment is growing fastest?

Antifoulants and dispersants at 7.2%, half again the market rate of 4.8%. Renewable co-processing creates polymerisation and gum fouling that conventional antifoulant packages control very poorly.

Who are the major companies in the Global Refinery Process Chemicals Market?

Ecolab, ChampionX, Baker Hughes, Clariant and Dorf Ketal lead on revenue including attached field service. Fifteen further participants are profiled in the full report on that basis.

Which country is growing fastest?

India at 8.0%, combining new refining complexes with heavier and more varied crude slates at existing sites, which raises chemical intensity per barrel processed considerably.

Report Segmentation Architecture

The full report scope spans multiple orthogonal segmentation dimensions, with cross-tabulated demand data provided for each dimension pair. Coverage extends further to regional breakdowns, trend trajectories, and the competitive detail needed to support segment-level decision-making.

By Chemical Treatment Function

  • Corrosion Inhibitors and Neutralisers
  • Antifoulants and Dispersants
  • Desalter Aids and Demulsifiers
  • Hydrogen Sulphide and Oxygen Scavengers
  • Antifoams and Defoamers
  • Fuel Additives and Flow Improvers

By End-Use Industry

  • Crude Distillation and Desalting
  • Hydrotreating and Hydrocracking
  • Fluid Catalytic Cracking Units
  • Gas Treating and Sulphur Recovery
  • Renewable and Co-Processing Units
  • Petrochemical and Olefins Production

By Commercial Dimension

  • Volume-Based Supply Contracts
  • Performance-Based Treatment Agreements
  • Resident Field Service Programmes
  • Turnaround and Commissioning Support
  • Distributor and Agent Channels
  • Export and Cross-Border Supply

By Region

  • North America
  • Western Europe
  • East Asia
  • South Asia and Pacific
  • Latin America
  • Middle East and Africa
  • Eastern Europe

Scope, Methodology, and Coverage

Every figure in this report is reproducible from documented input assumptions. The scope below maps the historical period, the forecast horizon, the segmentation dimensions, and the countries covered, alongside the underlying primary and qualitative methodology.
Historical Period
2020 to 2025
Forecast Period
2026 to 2036
Base Year
2025 (USD billions; MMA Primary Research Dataset, August 2026)
Market Definition
Chemicals dosed into refinery process streams to control corrosion, fouling, separation and contamination, covering corrosion inhibitors and neutralisers, antifoulants and dispersants, desalter aids and demulsifiers, hydrogen sulphide and oxygen scavengers, antifoams and defoamers, and fuel additives and flow improvers. Measured at supplier selling value including attached field service and monitoring. Catalysts and adsorbents, filtration equipment and consumables, water treatment plant chemistry outside the refinery fence, and upstream production chemicals are excluded from scope.
Quantitative Units
USD billions (current prices); thousand tonnes active chemical; USD per barrel processed by treatment function
Segmentation Dimensions
Chemical treatment function; end-use process unit; commercial dimension; region
Regions Covered
North America, Western Europe, East Asia, South Asia and Pacific, Latin America, Middle East and Africa, Eastern Europe
Countries Covered
China, Japan, South Korea, Singapore, India, Indonesia, Malaysia, Thailand, United States, Canada, Mexico, Germany, Netherlands, Italy, Spain, Poland, Saudi Arabia, United Arab Emirates, Nigeria, Brazil
Key Companies Profiled
Ecolab, ChampionX, Baker Hughes, Clariant, Dorf Ketal, BASF, Innospec, Solenis, Kemira, Halliburton Multi-Chem, Veolia Water Technologies, Chevron Oronite, Infineum, Afton Chemical, Lubrizol, Croda, Arkema, Q2 Technologies, Impact Chemical Technologies, Thermax
Quantitative Methodology
Primary survey, n=3,800 respondents, Q4 2025, six countries; demand-side model with trade association cross-validation
Qualitative Methodology
47 expert interviews, Q4 2025; applied to validate demand model assumptions, identify emerging dynamics, and assess competitive positioning
Report Format
PDF and XLSX data workbook (Word format preview document)
Publisher
Market Minds Advisory
Report Code
MMA-2026-CHM-134
Published
August 2026
Contact
sales@marketmindsadvisory.com | www.marketmindsadvisory.com

Purchase the full Global Refinery Process Chemicals Market Report (2026 to 2036).

The full report prices treatment against the crude discount it enables rather than against the chemistry it supplies, which is the argument that reaches slate selection rather than procurement. It sizes all six treatment functions independently through 2036, quantifies chemical intensity per barrel across crude qualities and co-processing ratios, and models performance-based against volume-based contracting on retention and realised margin. Regional chapters cover all seven regions with treated capacity movements tracked against announced closures and commissionings. Competitive profiling covers 20 participants on a single revenue basis including service.
Six treatment functions sized independently through 2036
Chemical intensity quantified per barrel across crude qualities
Performance contracting benchmarked against volume supply arrangements
Co-processing fouling chemistry assessed against conventional packages
Twenty participants profiled on one consistent revenue basis
Treated capacity tracked against closures and commissionings

Built For The People Who Decide

From boardroom strategy to bench-side execution, this report is read cover-to-cover by leaders shaping the next decade of their industry, turning demand scenarios, market dynamics and valuation benchmarks into decisions.
CXOs/ Presidents/ VPs/ Managers
M&A and Corporate Development
Strategy Teams and R&D Heads
Procurement and Product Directors
Regulatory and Compliance Leaders
Investor Relations and Equity Analysts