

Market Minds Advisory
Global Refinery and Petrochemical Filtration Market

Global Refinery and Petrochemical Filtration Market: Refinery and Petrochemical Filtration: Bought as a Part Number, Paid for in Downtime

A single unplanned outage day costs a refinery more than its entire annual filtration spend, and the elements preventing it are still bought against a part number by maintenance procurement.

Lead Analyst

Bilal Shaikh

Published

September 2026

Make Smarter Decisions with Customized Research Insights

Request a free sample report and evaluate market opportunities, growth trends, and competitive dynamics relevant to your business needs.

2025 MARKET VALUE$4.3BMarket Size 2025
2036 FORECAST VALUE$7.6BBase Case , 2026 to 2036
CAGR 2026 TO 20365.4 %Bull 6.6% / Bear 4.2%
INCREMENTAL OPPORTUNITY$3.1BNet 10- year value creation
EXPANSION MULTIPLE1.69x2036 value over 2026 base
Strategic Levers
M&A Pipeline
Regional Outlook
Country Rankings
Competitive Intelligence
Segmental Deep-dive
Call-Us : 91 93563 13602

Executive Snapshot and Market Trajectory.

One unplanned outage day costs a refinery roughly 180 times its annual filtration spend. That ratio is the whole commercial argument, and almost nobody in this industry makes it, because elements are bought by maintenance procurement against a catalogue part number. Performance differences never reach the person placing that order.
Feedstock is what changed. Refiners running heavier crude slates and co-processing used cooking oil, tallow and plastic pyrolysis oil face contaminant loads roughly 12 times conventional feed on phosphorus and metals. Existing filtration was never designed for that, which is why automatic self-cleaning systems grow at 8.1%, half again the market rate of 5.4%, and why co-processing is a filtration problem before it is a catalyst problem. Most refiners find this out after commissioning.
East Asia holds 30% of value on Chinese refining and ethylene capacity, with the Middle East at 10% on Gulf complexes built at a scale nothing else in the industry matches. India grows fastest anywhere at 8.6%. Generic elements now supply around 31% of replacement volume, which is quietly eroding the aftermarket annuity that housing installations were always meant to protect.
Market Definition
Filtration and separation equipment and consumables used in crude refining and petrochemical production, covering liquid filter elements, gas filtration and mist elimination, coalescers and liquid-liquid separators, filter housings and pressure vessels, automatic self-cleaning systems, and sand, bag and depth filtration units. Measured at supplier selling value. Excludes catalysts and adsorbents, membrane separation for gas processing, water treatment plant outside the fence, and upstream production filtration.
Base Year Value
$4.3B in 2025 (MMA Primary Research Dataset, August 2026)
Forecast Period
2026 to 2036, eleven discrete annual values
CAGR
5.4% base case. Bull 6.6%. Bear 4.2%.
Fastest Growth Segment
Automatic Self-Cleaning Filtration Systems: 8.1% CAGR
Fastest Growth Country
India: 8.6% CAGR
Fastest Growth Region
South Asia and Pacific: 7.4% CAGR
Largest Region
East Asia: 30% of 2025 global value
Market Leaders
Pall Corporation, Parker Hannifin, Donaldson, Eaton, Alfa Laval. Source: MMA Primary Research Dataset, July 2026.
Primary Survey
n=3,800 procurement and R&D decision-makers, Q4 2025, six countries
Methodology
Demand-side build-up, cross-validated against public data, 47 expert interviews

Global Refinery and Petrochemical Filtration Market Forecast Scenarios

refinery-and-petrochemical-filtration-size-forecast-scenario-1787594823895
Growth ran near 4.4% between 2020 and 2025, suppressed early by deferred turnarounds during the demand collapse and then recovering as postponed maintenance came due all at once. Refining capacity closed in Europe while expanding sharply in Asia and the Middle East, which moved demand geographically rather than reducing it. Renewable feedstock co-processing began generating filtration problems that nobody had specified equipment for, mostly discovered after the fact.
Base case 5.4% rests on three mechanisms. Renewable and recycled feedstock co-processing carries contaminant loads around 12 times conventional feed, which forces filtration upgrades ahead of catalyst protection rather than alongside it. Asian and Middle Eastern refining capacity keeps expanding, with India growing at 8.6% on new complexes and existing unit upgrades. And deferred turnaround backlogs continue unwinding across an older refining base that postponed maintenance through the demand collapse.
The bull case at 6.6% assumes renewable co-processing volumes scale to announced targets, which would make contaminant removal a permanent capital line rather than a retrofit. The bear case at 4.2% is accelerated European and Japanese refinery closure combined with generic element share rising above the current 31%, hollowing out the aftermarket annuity that supports supplier margins today.

The Ratio Nobody Puts in the Quote

Filtration is a rounding error on a refinery's cost base and sits directly upstream of the things that are not. A plugged exchanger, a fouled catalyst bed or a foaming amine contactor takes units offline, and one unplanned outage day costs roughly 180 times what the site spends on filtration in a year. The elements preventing that outcome are ordered by maintenance procurement against a part number.
TOP FIVE CONCENTRATION34%Element qualification narrows the field more than manufacturing does
OUTAGE COST RATIO180xOne unplanned outage day against annual filtration spend
ELEMENT REPLACEMENT INTERVAL5 monthsService life before differential pressure forces a change
RENEWABLE CONTAMINANT LOAD12xPhosphorus and metals against conventional crude oil feed
GENERIC ELEMENT SHARE31%Replacement elements supplied by other than original makers
AMINE UPSET ATTRIBUTION44%Gas treating upsets traced to inadequate contaminant removal
Feedstock quality is where the technical challenge moved. Heavier and more variable crude slates were the first pressure. Co-processing renewable and recycled feeds, whether used cooking oil, tallow or plastic pyrolysis oil, added contaminants that conventional refinery filtration was never specified to handle, with phosphorus and metals running around 12 times conventional levels. Most refiners discovered this after commissioning rather than during design.
The commercial model rests on an annuity that is quietly leaking. Housings are capital, elements are consumable and replaced when differential pressure demands it, roughly every five months in service. That should give the original supplier a durable revenue stream, except generic element makers now supply around 31% of replacement volume by qualifying into installed housings, and they compete on price against a part number procurement already treats as interchangeable.
"Ask a refinery manager what a day of unplanned downtime costs and they answer instantly. Ask what they spend on filtration in a year and they have to look it up. Those two facts sitting in the same building explain almost everything about how this market is priced."
Director, Process Industries and Separation Technology Practice · MMA Energy and Petrochemicals Practice · August 2026

Market Trends

Renewable feedstock co-processing forcing filtration ahead of catalyst protection

Used cooking oil, tallow and plastic pyrolysis oil carry phosphorus, metals, chlorides and silicon at levels around 12 times conventional crude feed, and hydrotreating catalyst is intolerant of all four. Refiners co-processing these streams discover that the constraint is contaminant removal rather than reactor capacity, usually after commissioning rather than during design. That has pushed guard filtration and automatic self-cleaning systems into capital scope, with those systems growing at 8.1% against a market rate of 5.4%. The capital case rests on avoided element spend and avoided change-out labour in services where manual replacement is no longer practical at all.
Market Impact: Indian demand growing at 8.6%

Generic elements eroding the installed housing aftermarket annuity

Housings are sold as capital and elements as consumables replaced roughly every five months, a structure that should hand the original supplier a durable revenue stream for the life of the installation. Generic element makers now supply around 31% of replacement volume by qualifying dimensionally compatible products into installed housings. Procurement treats the element as a part number and compares price directly, which is exactly the comparison the original supplier loses. Performance differences exist and rarely reach the person placing the order. Suppliers are responding with monitoring and service agreements that move the discussion away from unit price entirely.
Market Impact: Behind 44% of treating upsets

Market Opportunities and Growth Drivers

Asian refining capacity expansion shifting demand geography decisively

Refining and ethylene capacity closed across Europe and Japan while expanding sharply in China, India and the Gulf, which relocated filtration demand rather than reducing it. India grows fastest anywhere at 8.6% across new complexes and upgrades to existing units running heavier feed. New builds specify filtration during design, which is a considerably better position for a supplier than retrofitting into an operating unit. Local element manufacture follows the capacity within a few years and competes hard on price. Specification at design stage is worth considerably more than a retrofit won later.
Market Impact: Generics take 31% of volume

Amine system upsets driving contaminant removal specification upgrades

Around 44% of gas treating upsets trace back to inadequate contaminant removal, with hydrocarbon carryover and degradation products causing the foaming that takes amine contactors out of service. The consequences reach well beyond the treating unit, since sulphur recovery and downstream processing both depend on it. Refiners who have lived through an amine foaming event specify filtration far more carefully afterwards, which makes an operating incident the most reliable sales event in this entire category. Reaching a site before that incident occurs is therefore the whole commercial challenge. That makes an operating incident the most reliable sales event here.
Market Impact: Removes 180 times value sites

Market Restraints and Challenges

Procurement treating engineered elements as interchangeable part numbers

Filtration elements are ordered through maintenance procurement against catalogue numbers, which invites direct price comparison with dimensionally compatible generics now holding around 31% of replacement volume. The root cause is that performance differences appear as avoided incidents rather than as measurable output, so they never enter a purchase order comparison. Commercially it compresses aftermarket margin that housing installation was meant to secure. Suppliers are responding with performance monitoring and service agreements that move the discussion away from unit price. Reliability engineering rather than maintenance stores is the function that responds.
Market Impact: Contaminants at 12 times conventional

Refinery closures removing installed base in mature markets permanently

European and Japanese refinery closures remove installed housings and their element demand permanently rather than deferring it, and the pace has accelerated as fuel demand plateaus in those markets. The root cause is structural overcapacity in mature markets against growing Asian and Gulf capacity. Commercially it strands supplier service infrastructure built around sites that no longer exist. Participants are redeploying toward petrochemical and renewable fuel facilities, which use comparable equipment on a different demand trajectory. Petrochemical and renewable fuel facilities use comparable equipment on a demand trajectory heading the other way, which is where redeployment is happening.
Market Impact: Generics hold 31% of replacements
4 additional market trends, 3 additional growth drivers, and 2 additional restraints and challenges are covered in the full report. Contact sales@marketmindsadvisory.com to access the complete intelligence.

Segment CAGR and Growth Architecture

Six segments split by filtration product type, because each carries a different separation mechanism, service life and replacement economics even where all six sit inside the same processing unit. Media grade and material variants sit inside each product type rather than beside them. End-use process unit and channel are handled in the framework instead.
refinery-and-petrochemical-filtration-market-share-analysis-1787594824491

Automatic Self-Cleaning Filtration Systems

Growing at 8.1%, half again the market rate of 5.4%, self-cleaning systems backwash or scrape on differential pressure rather than requiring an element change, which suits high solids loading that would consume conventional cartridges in weeks. Renewable and recycled feedstock co-processing generates exactly that loading, with contaminants running around 12 times conventional levels, which is why these systems have moved from niche to capital scope in several refiners' renewable projects. The capital cost is substantial against a cartridge housing, and the case rests on avoided element spend and avoided change-out labour in services where manual replacement becomes impractical. Design-stage engagement rather than retrofit decides who supplies them. Retrofitting an operating unit costs the customer more and pays the supplier less.
CAGR 8.1%

Coalescers and Liquid-Liquid Separators

At 6.4% coalescers remove entrained water and hydrocarbon carryover, which puts them directly upstream of the amine foaming behind roughly 44% of gas treating upsets. That gives them a value case grounded in a specific and well-understood failure mode rather than in general cleanliness, and refiners who have experienced an amine upset specify them carefully afterwards. Renewable feedstocks carry more water and more surfactant-like species than conventional crude, which degrades coalescer performance and has forced media reformulation. The application is technically demanding enough that generic substitution has made less progress here than elsewhere. Refiners who have lived through a foaming event specify these carefully afterwards, which makes the incident itself the most reliable sales event anywhere in the category.
CAGR 6.4%
Full segment breakdown across 6 segments available in the complete report.

Regional Architecture and Country Demand Map

East Asia holds 30% of value on Chinese refining and ethylene capacity, which is now the largest in the world by a clear margin. North America follows at 22% on a large installed base, with the Middle East at 10% on Gulf complexes of unmatched individual scale.

North America

A large and ageing installed base drives replacement demand more than capacity growth does, with Gulf Coast refining and petrochemical complexes accounting for most of it. Renewable diesel conversion has been more aggressive here than anywhere, and several converted facilities encountered contaminant loading that existing filtration was never specified to handle. Turnaround scheduling concentrates element demand into predictable windows, which suits suppliers able to hold inventory against them. Generic element competition is well established and procurement is price-focused. Growth at 4.2% reflects replacement and conversion rather than new capacity anywhere. Reliability engineering rather than procurement holds the specification decisions. Turnaround windows concentrate element demand into predictable periods that suit suppliers holding inventory against them.
Share: 22% | CAGR: 4.2% (2026 to 2036)

Western Europe

Refinery closures have removed installed base permanently across the region as fuel demand plateaus and overcapacity persists against Asian and Gulf competition. What remains skews toward petrochemical production and specialty refining, both of which use comparable equipment on a steadier trajectory. Renewable fuel conversion projects have absorbed some of the lost refining demand, with contaminant removal proving a larger design problem than most operators anticipated. Northern European sites lead on co-processing sophistication. Growth of 3.6% runs well below the base case as closures offset upgrade spending across the region. Redeployment toward petrochemical and renewable facilities is where suppliers are recovering the lost refining volume. Northern European sites lead on co-processing sophistication.
Share: 18% | CAGR: 3.6% (2026 to 2036)
Regional intelligence for 5 additional markets available in the complete report: East Asia, South Asia and Pacific, Latin America, Middle East and Africa, Eastern Europe. Contact sales@marketmindsadvisory.com.
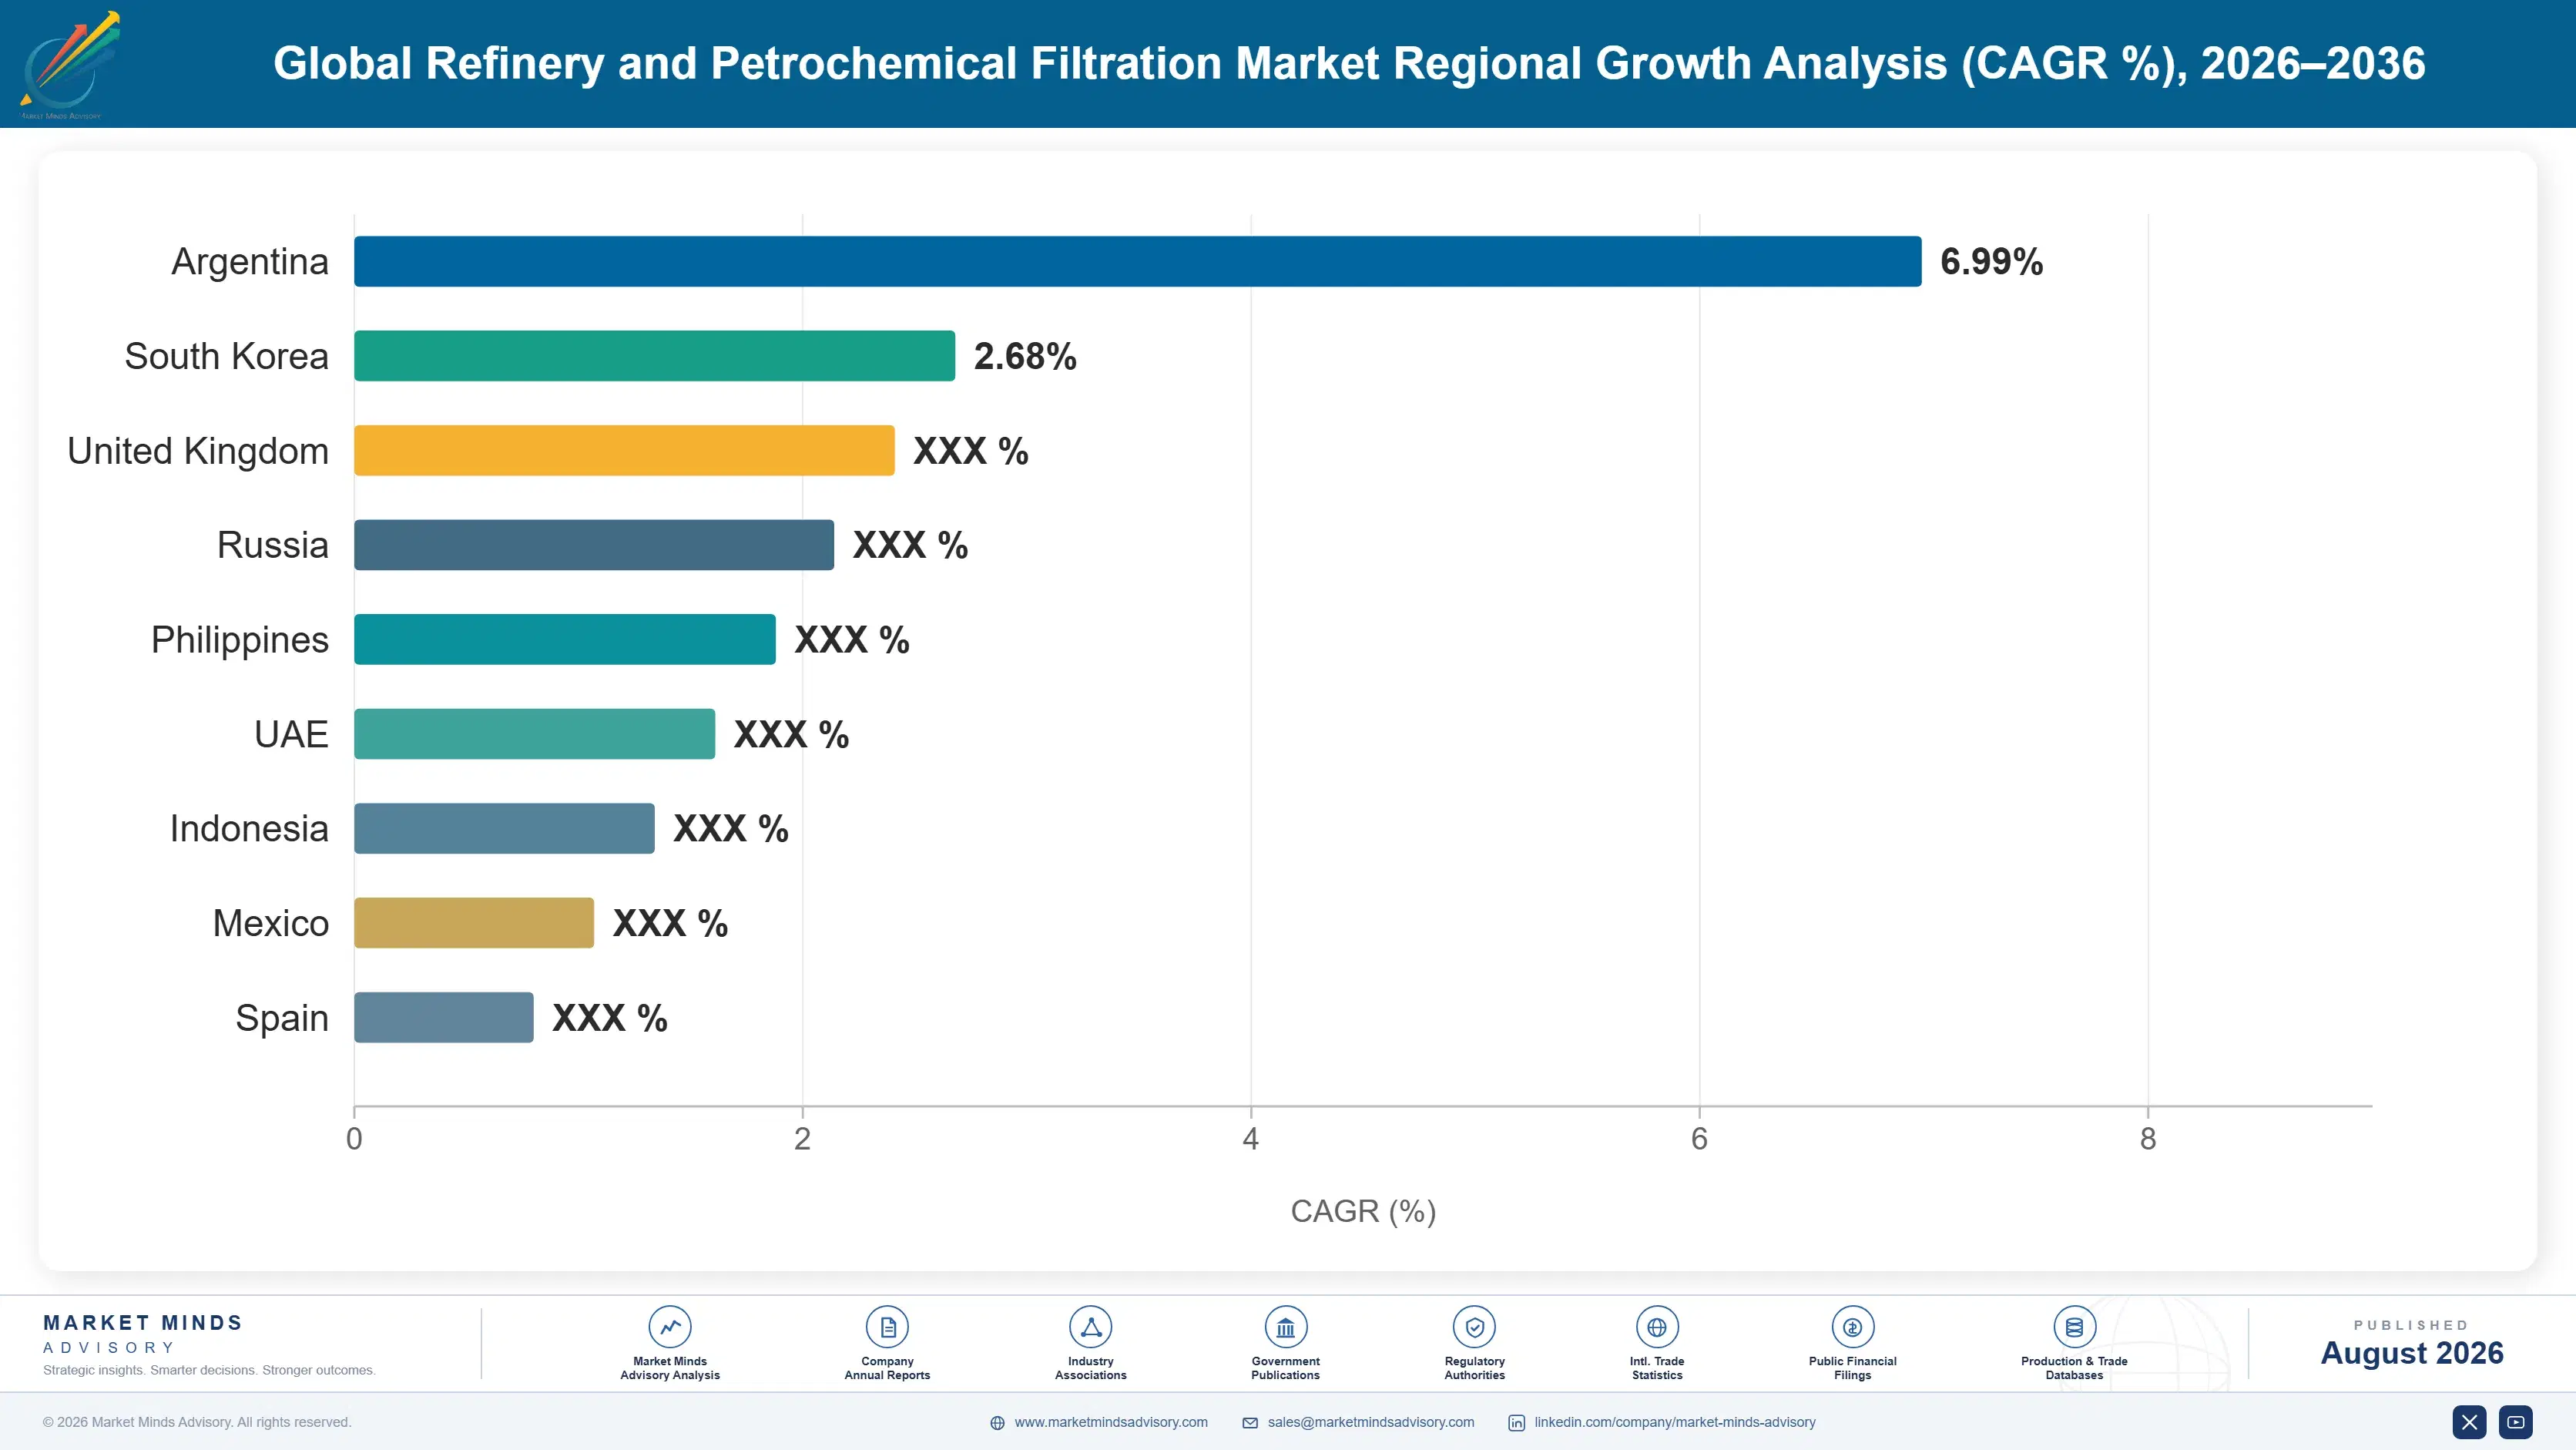
refinery-and-petrochemical-filtration-country-cagr-analysis-1787594825022

Four Moves Against a Part Number

Every commercial problem in this category comes back to the same place: an engineered product ordered through a system designed for interchangeable spare parts. The value sits in outages that did not happen, which never appears on a purchase order anywhere, and the supplier who cannot make that visible ends up competing on price forever.

Quantify the outage exposure the element actually protects

One unplanned outage day costs roughly 180 times a site's annual filtration spend, and that ratio never appears in a procurement comparison because avoided incidents are invisible to it. Building the calculation for a specific unit, using the site's own throughput and margin, moves the conversation to operations and reliability engineering where the budget and the concern both sit. Very few suppliers do this work, which leaves the strongest available argument unused across most of the installed base. Reliability engineering understands the number immediately, and procurement never sees it. Almost nobody builds it.
Market Impact: Protects against a 180 times outage cost exposure

Reach renewable co-processing projects during design

Renewable and recycled feedstocks carry phosphorus, metals, chlorides and silicon around 12 times conventional levels, and most refiners discover the consequences after commissioning rather than during design. A supplier engaged at the engineering contractor stage specifies the solution instead of fixing the problem, and self-cleaning systems growing at 8.1% enter capital scope rather than maintenance budget. Retrofitting an operating unit is slower, more expensive for the customer and far less profitable for the supplier. Engineering contractor relationships rather than operator relationships decide who gets there first, and most commercial organisations have not built them.
Market Impact: Addresses 12 times the conventional feed contaminant loading

Sell monitored performance rather than replacement elements

Generic elements hold around 31% of replacement volume because a part number invites direct price comparison and performance differences never reach the buyer. Differential pressure monitoring, service intervals and documented performance convert the purchase into an availability outcome that a dimensionally compatible copy cannot match. It also moves the decision away from maintenance procurement toward reliability engineering, where a five month replacement interval is a variable worth managing rather than a recurring line item. Accounts under monitored agreements show no generic displacement at all, on products dimensionally identical to those being displaced elsewhere.
Market Impact: Defends against a 31% generic element volume share

Build the amine upset case around a known failure mode

Roughly 44% of gas treating upsets trace to inadequate contaminant removal, and hydrocarbon carryover causing amine foaming is a failure every refinery engineer recognises immediately. That specificity is worth more than any general cleanliness argument, because the consequence is concrete and the mechanism is understood. Refiners who have experienced an upset specify carefully afterwards, which makes the incident the most reliable sales event in this category and a strong reason to reach sites before one occurs. The consequence reaches sulphur recovery and downstream processing as well as the treating unit.
Market Impact: Targets 44% of all gas treating unit upsets

Who Controls the Margin Pool

Participation is measured on annual filtration equipment and consumables revenue into refining and petrochemical end uses, and the top five hold 34%. Concentration reflects element qualification and service infrastructure rather than manufacturing difficulty, since filter media conversion is not itself a barrier. Pall Corporation leads on installed housing base and technical depth across process units. The gap to challengers is application engineering and site presence rather than product capability. Media conversion is not itself a meaningful barrier.
Competition runs on three fronts. Installed housing base decides who holds the aftermarket, though generics now take around 31% of it. Application engineering decides new project specification, particularly on renewable co-processing where the problem is unfamiliar to most operators. Service presence decides turnaround work, since a supplier without people at the site during a shutdown window cannot participate in it at all. Most operators find co-processing unfamiliar territory.

Pressure ahead comes from generic element competition and from mature market refinery closures removing installed base permanently. Chinese and Indian element manufacture is advancing behind regional capacity growth. Expect service model investment and renewable project positioning rather than acquisitions. Rankings shift as co-processing specifications settle and as suppliers either defend the aftermarket or concede it.
refinery-and-petrochemical-filtration-company-positioning-matrix-1787594825548

Competitive Moat and Risk Dimensions

PALL CORPORATION

Moat: Installed housing base depth

A very large installed base of housings across refining and petrochemical units generates element demand for the life of each installation, and the accumulated application knowledge across process services is difficult for a competitor to assemble from nothing. Site engineering relationships built over decades also secure turnaround participation that a supplier without people present cannot obtain.
PALL CORPORATION

Risk: Generic element share erosion

Around 31% of replacement volume now goes to generic makers producing dimensionally compatible elements at lower cost, and procurement compares them against a part number rather than a performance specification. Defending that annuity means either matching prices that undermine the service model or persuading a buyer who has already decided the products are equivalent.
PARKER HANNIFIN

Moat: Breadth across filtration technologies

Capability spanning liquid, gas, coalescing and self-cleaning technologies lets the company address a whole process unit rather than a single service, which matters on renewable co-processing projects where the contaminant problem crosses several separation steps at once. That breadth also supports a single commercial relationship across a site's varied requirements.
PARKER HANNIFIN

Risk: Project engagement timing dependence

The strongest positions come from specification during design at the engineering contractor stage, which requires early visibility of projects that are frequently confidential until well advanced. Arriving after commissioning means retrofitting a problem rather than specifying a solution, at lower margin and against an operator already frustrated by unplanned expenditure.

Players Tracked

Prominent Players

Pall Corporation
Parker Hannifin
Donaldson
Eaton
Alfa Laval

Other Key Players

3M
Pentair
Mott Corporation
Filtration Group
Porvair
Hydac
MANN+HUMMEL
Sulzer
Koch Separation Solutions
Amazon Filters
Lenzing Technik
Begg Cousland
Jonell Systems
Graver Technologies
Nippon Seisen

Recent Developments

APRIL 2026

Renewable diesel facility retrofits guard filtration after commissioning problems

A converted renewable diesel facility retrofitted guard filtration and automatic self-cleaning systems after commissioning revealed contaminant loading that the original design had not anticipated. Catalyst replacement costs during the affected period exceeded the retrofit capital by a considerable margin. Design assumptions had been drawn from conventional crude experience.
Signal: Co-processing is a contaminant removal problem well before it becomes a catalyst or reactor capacity problem
NOVEMBER 2025

Refiner adopts monitored filtration service agreement across multiple units

A refining operator replaced element purchasing with a monitored service agreement covering differential pressure tracking, scheduled replacement and documented availability across several process units. Procurement handling moved from maintenance stores to reliability engineering as part of the arrangement. Element pricing ceased to be compared against generic alternatives.
Signal: Moving the purchase out of maintenance stores is what actually defends engineered elements against generic substitution
FEBRUARY 2026

Generic element supplier qualifies into major refinery housing population

A generic element manufacturer qualified dimensionally compatible replacements into a large refinery's installed housing population, displacing original supplier volume on price. Performance verification was limited to differential pressure and dimensional compliance rather than full separation efficiency testing. Separation efficiency was not tested at any stage of qualification.
Signal: Qualification on dimensions and pressure drop alone is how a part number comparison usually gets settled

Media, Stainless and Field Hours

Filter media accounts for roughly 33% of element cost, spanning pleated polymer, glass fibre and sintered metal grades from a specialised supplier base. Stainless steel and alloy hardware carries about 27%, rising sharply on housings and self-cleaning systems where pressure vessel content dominates. Assembly and testing take around 16%, with field service hours and logistics absorbing the balance across a business that must reach operating sites.
Stainless steel and nickel alloy pricing moved sharply through 2021 and 2022 on nickel supply disruption, per EIA and national statistical office commodity reporting for the period, which hit housing and self-cleaning system cost far harder than element cost. Suppliers holding fixed-price project commitments absorbed most of it. Polymer media moved on a separate cycle, so element and hardware exposures diverged rather than compounding on the same product line.

Exposure divides on product mix and on service intensity. A supplier weighted toward capital hardware carries alloy exposure across more than a quarter of cost with limited ability to reprice inside a project commitment, while an element-weighted business faces media cost that moves more gently. Field service capability is the hidden cost line, and it is exactly what generic competitors decline to fund.
refinery-and-petrochemical-filtration-cost-volatility-analysis-1787594825748

Index project hardware commitments to published alloy references

Stainless and alloy content is around 27% of cost and rises sharply on housings and self-cleaning systems committed at fixed price during project engineering. Indexing to published nickel and stainless references passes movement through with a defined lag. Engineering contractors resist indexation more than operators do, which makes it a negotiating priority at the contractor stage rather than afterwards.

Balance capital hardware against consumable element revenue

Alloy hardware and polymer media move on entirely unrelated cycles, so a supplier holding both carries a natural offset that a single-product business does not. Element revenue also repeats roughly every five months while hardware is episodic. The combination smooths both input exposure and revenue timing, which matters in an industry where project awards arrive unevenly.

Fund field service as a competitive asset rather than overhead

Field service hours are the cost line generic competitors decline to carry, and they are also what secures turnaround participation and reliability engineering relationships. Treating that presence as overhead to be minimised concedes the only ground where a part number comparison can be avoided. Suppliers cutting service presence have consistently lost aftermarket share afterwards.

Portfolio Architecture for Margin Defence

Margin here tracks how far the product sits from a catalogue comparison. Standard liquid and gas elements supplied against part numbers earn margins in the high teens to low twenties, because dimensionally compatible generics hold around 31% of that volume and procurement compares them directly on price without reference to separation performance. Media cost and manufacturing scale decide position at this level, and neither is durable.
Coalescers, specialty media and engineered separation products do considerably better in the high twenties to high thirties, because the application is technically demanding enough that substitution has made less progress and the failure mode being prevented is specific and well understood by the engineer specifying it. Substitution has made far less progress in these products as a direct result.

Automatic systems supplied with monitoring and service agreements hold the strongest position, reaching into the low forties, because the customer is buying documented availability rather than a component. Those margins reflect service infrastructure and the reliability engineering relationship rather than anything about the hardware itself. Service infrastructure is expensive to maintain and is exactly what generic competitors decline to fund, which is precisely why it works as a defence.

Standard Liquid and Gas Elements

Cartridge and bag elements supplied against catalogue part numbers into installed housings. The seven point range reflects media cost and manufacturing scale rather than product difference, since generics compete directly on dimensions.
Gross Margin: 17-24%

Coalescers and Engineered Separation Products

Coalescing, mist elimination and specialty media products preventing specific and well-understood failure modes. The eleven point range reflects application engineering depth and how directly the failure being prevented is recognised.
Gross Margin: 27-38%

Monitored Systems and Service Agreements

Automatic self-cleaning systems supplied with differential pressure monitoring and documented availability commitments. The eleven point range reflects service infrastructure depth and whether reliability engineering rather than procurement holds the relationship.
Gross Margin: 33-44%
refinery-and-petrochemical-filtration-portfolio-architecture-1787594826256

High-value Sub-segments and Strategic Watch-out

Monitored Filtration Service Agreements

High value and growing, since documented availability is something no dimensionally compatible copy can offer at any price. It also moves the purchase out of maintenance stores toward reliability engineering, which is where the argument can actually be won. Competitors holding these accounts lose no volume.
Gross Margin: 35-44%

Renewable Co-Processing Guard Systems

High value and the fastest growth at 8.1%, driven by contaminant loads around 12 times conventional feed that existing filtration was never specified for. Design-stage engagement rather than retrofit is what determines who captures it. Contractor relationships rather than operator ones decide who specifies it.
Gross Margin: 31-42%

Standard Replacement Elements

The volume core, where generics already hold around 31% and procurement compares part numbers on price alone. Performance differences exist and almost never reach the person placing the order, which settles the comparison. Housing installation was meant to protect this revenue and increasingly does not.
Gross Margin: 17-24%

Mature Market Installed Base

The strategic watch-out. European and Japanese refinery closures remove housings and their element demand permanently, and the twelve point range reflects how far suppliers have redeployed toward petrochemical and renewable facilities. Closures remove housings permanently rather than deferring demand to a later cycle. Redeployment is the only available answer.
Gross Margin: 14-26%

The Annuity and Its Leak

Every installed housing generates element demand for the life of the unit, replaced roughly every five months when differential pressure demands it, which is as close to an annuity as process equipment gets. Demand tracks operating hours rather than capital cycles, so it continues through periods when no site is buying anything else. Turnaround windows concentrate the volume into predictable periods that a supplier holding inventory can serve and others cannot.
Stickiness depends entirely on how the purchase is framed. An element ordered against a part number by maintenance stores is genuinely contestable, and generics take around 31% of that volume by being dimensionally compatible and cheaper. A monitored service agreement held by reliability engineering is close to immovable, because the customer is buying documented availability that a copied component cannot supply.

The buying function has been split rather than shifting cleanly. Maintenance procurement holds most replacement volume and always has, comparing catalogue numbers on price. Reliability engineering and process engineering hold the specification decisions, and they are the functions that understand what an unplanned outage costs. Suppliers who reach only the first function compete on price permanently, whatever their product does.
refinery-and-petrochemical-filtration-end-use-penetration-index-1787594826746

Where We Would Focus Effort

These are among the four positions where our research anticipates prominent divergence between winners and laggards over the coming forecast period. Each is grounded in the demand model, the regulatory perimeter, and the announced capacity pipeline.
01 / OUTAGE EXPOSURE QUANTIFICATION

Make the invisible number appear on paper

One unplanned outage day costs roughly 180 times a site's entire annual filtration spend, and that ratio never surfaces in procurement because avoided incidents do not appear on any purchase order comparison. Building the calculation for a specific process unit, using the site's own throughput and margin figures, moves the discussion toward reliability engineering where both the budget and the genuine concern actually sit. Very few suppliers have done this work, which leaves the strongest argument in the category almost entirely unused.
02 / DESIGN STAGE ENGAGEMENT

Specify the solution rather than retrofit the problem

Renewable and recycled feedstocks carry phosphorus, metals, chlorides and silicon at around 12 times conventional levels, and most refiners discover the consequences after commissioning rather than during the project design phase. A supplier engaged at the engineering contractor stage writes the specification instead of repairing the outcome, and self-cleaning systems growing at 8.1% enter capital scope rather than a constrained maintenance budget. Retrofitting an operating unit is slower for the customer and considerably less profitable for whoever ends up doing it.
03 / SERVICE MODEL CONVERSION

Sell availability, not a dimensionally compatible object

Generic elements hold around 31% of replacement volume precisely because a catalogue part number invites direct price comparison and performance differences never reach the buyer actually placing the order at the time. Differential pressure monitoring, scheduled intervals and documented availability convert the purchase into an outcome that a copied component cannot reproduce whatever its dimensions happen to be. It also relocates the decision from maintenance stores toward reliability engineering, which is the only ground where this particular argument can ever be won.
04 / FAILURE MODE SPECIFICITY

Amine foaming beats any cleanliness argument

Roughly 44% of gas treating upsets trace back to inadequate contaminant removal, and hydrocarbon carryover causing amine foaming is a failure mode every refinery engineer recognises without needing any of it explained to them. That specificity is worth considerably more than a general argument about cleanliness, because the consequence is concrete and the underlying mechanism is already well understood. Refiners specify carefully after an upset, which makes reaching a site before one occurs the whole commercial challenge in this category.

Engagement Snapshot From the Field

A live engagement with an industry participant carrying material or product regulatory and market exposure ahead of a defining policy shift, showing how our research translates into a defensible multi-year portfolio strategy.
MARKET MINDS ADVISORY · CLIENT ENGAGEMENT SUMMARY
Global Refinery and Petrochemical Filtration Producer Strategic Portfolio Review and Transition Roadmap 2026·Investment Scenario on Global Refinery and Petrochemical Filtration Exposure Evaluation 2025-26
CLIENT PROFILE
An international filtration supplier serving refining and petrochemical customers with housings, elements and limited field service, at annual revenue near 310 million dollars (client-reported, unverified by MMA). Roughly seventy percent of revenue came from replacement elements sold against catalogue part numbers through customer maintenance procurement functions across three regions, with no monitored service agreements anywhere in the portfolio.
STRATEGIC CHALLENGE
Element volume had been lost to generic suppliers at four large accounts across two years, with the losses decided on price against dimensionally compatible products. Management were considering matching generic pricing on standard elements, and wanted to understand whether that would defend the volume or simply transfer the margin without changing the outcome.
MMA APPROACH
MMA quantified outage exposure against filtration spend at the affected accounts, benchmarked monitored service agreements against element supply on retention and realised margin, assessed which customer functions held specification versus purchasing authority, and sized renewable co-processing project opportunities in the client's territories. Interviews with 47 experts covered refinery reliability, filtration specification and process engineering.
KEY FINDINGS
  1. Outage exposure at the four accounts exceeded their combined annual filtration spend by more than two orders of magnitude, and none of the four had ever been shown that calculation by any supplier.
  2. At every account lost, the decision had been made by maintenance procurement without reliability engineering involvement, and in three cases the process engineers were unaware it had happened at all.
  3. Accounts held under monitored service agreements at competitors showed no generic displacement whatsoever, on products that were dimensionally identical to those being displaced elsewhere.
  4. Renewable co-processing projects in the client's territories were being specified by engineering contractors the commercial organisation had no relationship with at any level.
CLIENT PROFILE
An international filtration supplier serving refining and petrochemical customers with housings, elements and limited field service, at annual revenue near 310 million dollars (client-reported, unverified by MMA). Roughly seventy percent of revenue came from replacement elements sold against catalogue part numbers through customer maintenance procurement functions across three regions, with no monitored service agreements anywhere in the portfolio.
STRATEGIC CHALLENGE
Element volume had been lost to generic suppliers at four large accounts across two years, with the losses decided on price against dimensionally compatible products. Management were considering matching generic pricing on standard elements, and wanted to understand whether that would defend the volume or simply transfer the margin without changing the outcome.
MMA APPROACH
MMA quantified outage exposure against filtration spend at the affected accounts, benchmarked monitored service agreements against element supply on retention and realised margin, assessed which customer functions held specification versus purchasing authority, and sized renewable co-processing project opportunities in the client's territories. Interviews with 47 experts covered refinery reliability, filtration specification and process engineering.
KEY FINDINGS
  1. Outage exposure at the four accounts exceeded their combined annual filtration spend by more than two orders of magnitude, and none of the four had ever been shown that calculation by any supplier.
  2. At every account lost, the decision had been made by maintenance procurement without reliability engineering involvement, and in three cases the process engineers were unaware it had happened at all.
  3. Accounts held under monitored service agreements at competitors showed no generic displacement whatsoever, on products that were dimensionally identical to those being displaced elsewhere.
  4. Renewable co-processing projects in the client's territories were being specified by engineering contractors the commercial organisation had no relationship with at any level.
RECOMMENDED STRATEGY
Phase 1: Phase one: build outage exposure calculations for the largest accounts and present them to reliability engineering rather than to maintenance procurement functions. Phase 2: Phase two: convert defensible accounts to monitored service agreements, where dimensional compatibility ceases to be the basis of comparison at all. Phase 3: Phase three: build engineering contractor relationships ahead of renewable co-processing awards, rather than arriving after commissioning problems have already emerged.
OUTCOME
The supplier converted three accounts to monitored agreements during 2026 and reported no further generic displacement at those sites (client-reported, unverified by MMA). Price matching on standard elements was abandoned, and two renewable project specifications were secured through contractor engagement. Field service headcount was increased rather than reduced.

Frequently Asked Questions

Foundational context covering the market sizes, CAGR, scope, country, region and competition that inform every finding below. This section is provided to cover basics and most often pre-purchase conversations, answered from the MMA Primary Research Dataset.

What is the current size of the Global Refinery and Petrochemical Filtration Market?

MMA sizes it at USD 4.26 billion in 2025, rising to USD 4.49 billion in 2026. The figure covers filtration equipment and consumables in refining and petrochemical production at supplier selling value.

How large will the Global Refinery and Petrochemical Filtration Market be by 2036?

USD 7.60 billion by 2036, an incremental USD 3.11 billion over the 2026 base and an expansion multiple of 1.69 times. Automatic systems account for a disproportionate share.

What is the CAGR for the Global Refinery and Petrochemical Filtration Market 2026 to 2036?

5.4% in the base case, with a bull case at 6.6% and a bear case at 4.2%. The spread turns on renewable co-processing volumes and on generic element share.

Which segment is growing fastest?

Automatic self-cleaning filtration systems at 8.1%, half again the market rate of 5.4%. Renewable feedstock solids loading makes conventional cartridge replacement impractical in those services.

Who are the major companies in the Global Refinery and Petrochemical Filtration Market?

Pall Corporation, Parker Hannifin, Donaldson, Eaton and Alfa Laval lead on filtration revenue into these end uses. Fifteen further participants are profiled in the full report.

Which country is growing fastest?

India at 8.6%, combining new refining complexes with upgrades to existing units now processing heavier and considerably more variable crude slates than their original design.

Report Segmentation Architecture

The full report scope spans multiple orthogonal segmentation dimensions, with cross-tabulated demand data provided for each dimension pair. Coverage extends further to regional breakdowns, trend trajectories, and the competitive detail needed to support segment-level decision-making.

By Filtration Product Type

  • Liquid Filter Elements and Cartridges
  • Gas Filtration and Mist Elimination
  • Coalescers and Liquid-Liquid Separators
  • Filter Housings and Pressure Vessels
  • Automatic Self-Cleaning Systems
  • Sand, Bag and Depth Filtration Units

By End-Use Industry

  • Crude Distillation and Conversion Units
  • Hydrotreating and Hydrocracking
  • Gas Treating and Sulphur Recovery
  • Petrochemical and Olefins Production
  • Renewable and Recycled Feedstock Processing
  • Utilities and Water Systems

By Commercial Dimension

  • Original Equipment Project Supply
  • Replacement Element Aftermarket
  • Monitored Service Agreements
  • Turnaround and Shutdown Supply
  • Distributor and Stockist Channels
  • Engineering Contractor Specification

By Region

  • North America
  • Western Europe
  • East Asia
  • South Asia and Pacific
  • Latin America
  • Middle East and Africa
  • Eastern Europe

Scope, Methodology, and Coverage

Every figure in this report is reproducible from documented input assumptions. The scope below maps the historical period, the forecast horizon, the segmentation dimensions, and the countries covered, alongside the underlying primary and qualitative methodology.
Historical Period
2020 to 2025
Forecast Period
2026 to 2036
Base Year
2025 (USD billions; MMA Primary Research Dataset, August 2026)
Market Definition
Filtration and separation equipment and consumables used in crude refining and petrochemical production, covering liquid filter elements and cartridges, gas filtration and mist elimination, coalescers and liquid-liquid separators, filter housings and pressure vessels, automatic self-cleaning systems, and sand, bag and depth filtration units. Measured at supplier selling value across capital and aftermarket supply. Catalysts and adsorbents, membrane separation for gas processing, water treatment plant outside the refinery fence, and upstream production filtration are excluded from scope.
Quantitative Units
USD billions (current prices); million filter elements; USD per element by product type
Segmentation Dimensions
Filtration product type; end-use process unit; commercial dimension; region
Regions Covered
North America, Western Europe, East Asia, South Asia and Pacific, Latin America, Middle East and Africa, Eastern Europe
Countries Covered
China, Japan, South Korea, Singapore, India, Indonesia, Malaysia, Vietnam, United States, Canada, Mexico, Germany, Netherlands, Italy, Spain, Poland, Saudi Arabia, United Arab Emirates, Nigeria, Brazil
Key Companies Profiled
Pall Corporation, Parker Hannifin, Donaldson, Eaton, Alfa Laval, 3M, Pentair, Mott Corporation, Filtration Group, Porvair, Hydac, MANN+HUMMEL, Sulzer, Koch Separation Solutions, Amazon Filters, Lenzing Technik, Begg Cousland, Jonell Systems, Graver Technologies, Nippon Seisen
Quantitative Methodology
Primary survey, n=3,800 respondents, Q4 2025, six countries; demand-side model with trade association cross-validation
Qualitative Methodology
47 expert interviews, Q4 2025; applied to validate demand model assumptions, identify emerging dynamics, and assess competitive positioning
Report Format
PDF and XLSX data workbook (Word format preview document)
Publisher
Market Minds Advisory
Report Code
MMA-2026-ENE-132
Published
August 2026
Contact
sales@marketmindsadvisory.com | www.marketmindsadvisory.com

Purchase the full Global Refinery and Petrochemical Filtration Market Report (2026 to 2036).

The full report prices filtration against the outages it prevents rather than against the elements it supplies, which is the comparison this industry has consistently avoided putting in front of a customer. It sizes all six product types independently through 2036, quantifies contaminant loading from renewable and recycled feedstocks against conventional crude, and models generic element penetration by product category and buying function. Regional chapters cover all seven regions with refining and petrochemical capacity movements tracked separately because they diverge. Competitive profiling covers 20 participants on a single revenue basis.
Six filtration product types sized independently through 2036
Outage exposure quantified against annual filtration spend
Renewable feedstock contaminant loading benchmarked against conventional crude
Generic element penetration modelled by category and buyer
Twenty participants profiled on one consistent revenue basis
Refining and petrochemical capacity movements tracked separately throughout

Built For The People Who Decide

From boardroom strategy to bench-side execution, this report is read cover-to-cover by leaders shaping the next decade of their industry, turning demand scenarios, market dynamics and valuation benchmarks into decisions.
CXOs/ Presidents/ VPs/ Managers
M&A and Corporate Development
Strategy Teams and R&D Heads
Procurement and Product Directors
Regulatory and Compliance Leaders
Investor Relations and Equity Analysts