Market Minds Advisory
Refined Cane Sugar Market

Refined Cane Sugar Market: Refined Cane Sugar Market. Raw Sugar Sourcing, Refinery Margins, and Liquid and Specialty Formats Reshape Cane-Based Sweetener Trade.

Refined cane sugar is a spread business where raw sugar sourcing, port refinery utilisation, and freight decide margin, while liquid sugar, brown sugar, and certified grades give refiners a route away from commodity white crystals.

Lead Analyst

Published

September 2026

Make Smarter Decisions with Customized Research Insights

Request a free sample report and evaluate market opportunities, growth trends, and competitive dynamics relevant to your business needs.

2025 MARKET VALUE$71.0BMarket Size 2025
2036 FORECAST VALUE$104.8BBase Case , 2026 to 2036
CAGR 2026 TO 20363.6 %Bull 4.9% / Bear 2.3%
INCREMENTAL OPPORTUNITY$31.2BNet 10- year value creation
EXPANSION MULTIPLE1.42x2036 value over 2026 base
Strategic Levers
M&A Pipeline
Regional Outlook
Country Rankings
Competitive Intelligence
Segmental Deep-dive
Call-Us : 91 93563 13602

Executive Snapshot and Market Trajectory.

A refinery does not grow cane. It buys raw sugar, cleans it, and sells the difference, so its fortune depends on the spread between raw and white prices. That thin, volatile spread explains why refiners chase scale, long contracts, and every specialty grade they can sell.
Liquid cane sugar and syrups grow fastest, driven by beverage bottlers, bakeries, and foodservice buyers that want dissolved sweetener delivered by tanker, while white refined crystals anchor volume through household and industrial use. Latin America holds the largest share because Brazilian and Central American cane mills sell refined and white sugar at scale, and South Asia and Pacific follows through Indian, Thai, and Pakistani refining. Indonesia leads country growth. Port refineries supply import-reliant markets.
Competition mixes Brazilian cane groups, Asian integrated refiners, Gulf re-export refineries, and specialist brand owners. Advantage comes from raw sugar access, refinery efficiency, and port logistics rather than brand strength. Regulation shapes returns, since import tariffs, quotas, sugar levies, and ethanol mandates decide which refineries run full. Buyers reward reliable delivery, consistent colour, and contract pricing that dampens volatility. Supply stays tight. Certification adds cost but earns premiums.
Market Definition
Refined cane sugar is sucrose produced from sugarcane and purified through refining, including white refined, brown and specialty, powdered and icing, liquid sugar and syrups, and organic and fair-trade grades, sold to food and beverage makers, foodservice, retailers, and households. The scope excludes beet sugar, raw and unrefined cane sugar sold for further refining, molasses, high-fructose corn syrup, and non-sucrose sweeteners.
Base Year Value
$71.0B in 2025 (MMA Primary Research Dataset, September 2026)
Forecast Period
2026 to 2036, eleven discrete annual values
CAGR
3.6% base case. Bull 4.9%. Bear 2.3%.
Fastest Growth Segment
Liquid Cane Sugar and Syrups: 7.8% CAGR
Fastest Growth Country
Indonesia: 6.2% CAGR
Fastest Growth Region
South Asia and Pacific: 5.6% CAGR
Largest Region
Latin America: 30% of 2025 global value
Market Leaders
Raizen, Wilmar International, Tereos, Sao Martinho, ASR Group. Source: MMA Analysis, company annual reports.
Primary Survey
n=3,800 procurement and R&D decision-makers, Q4 2025, six countries
Methodology
Demand-side build-up, cross-validated against public data, 47 expert interviews

Refined Cane Sugar Market Forecast Scenarios

refined-cane-sugar-market-size-forecast-scenario-1789769980745
From 2020 to 2025, refined cane sugar value grew as processed food demand expanded in Asia and Africa and Gulf and Asian refineries added capacity, while price spikes in 2022 and 2023 lifted revenue ahead of volumes. Growth averaged 3.1% a year, with liquid and organic formats outpacing white crystals, though sugar levies, freight shocks, and weak raw sugar crops narrowed refinery spreads in several major producing and importing markets.
The base case assumes 3.6% annual growth through 2036, built on three named mechanisms: rising beverage and packaged food consumption in South Asia, Southeast Asia, and Africa as incomes grow and urban diets shift, steady growth of liquid sugar and specialty grades that carry higher margins for refiners, and investment in port refineries in importing regions that replace direct imports of white sugar with local processing of raw cane sugar.
The bull case, at 4.9%, needs stable raw sugar supply and wider adoption of liquid sugar in bottling. The bear case, at 2.3%, reflects wider sugar taxes, sweetener substitution, and a refinery glut after Gulf and Asian capacity additions. Either scenario leaves the demand base intact, though pricing and refinery spreads would differ noticeably across regions.

Raw Sugar Access and Refinery Spread Decide Cane Refiners

Refined cane sugar starts as raw sugar, brown crystals that mills produce near the cane fields. Refiners dissolve the raw crystals, remove colour and impurities with carbonation, phosphatation, or carbon filtration, then crystallise and dry the white product. Some refineries also make liquid sugar, brown sugar, and powdered grades. The result is a highly standardised sucrose, so price, delivery, and consistency decide most purchases.
MARKET CONCENTRATION29% CR5Leading five refiners hold a moderate combined share
REFINING SPREAD$110 per tonneWhite premium over raw sugar sets refinery gross margin
RAW SUGAR COGS SHARE84%Raw sugar purchases dominate refinery operating costs annually
TOP REFINER COUNTRY SHARE21%Brazil is the largest single national source globally
REFINERY UTILISATION74%Typical operating rate across large port refineries worldwide
LIQUID SUGAR SHARE9%Portion of refined output sold as tanker delivered syrup
Buyers use refined cane sugar in several ways. Beverage bottlers and confectionery makers take the largest volumes, bakeries and dairy processors follow, foodservice and household retail buy in bags and sachets, and industrial users apply it in pharmaceuticals and fermentation. Specifications cover colour in ICUMSA units, ash, grain size, and microbial counts, and buyers require food safety audits and certificates of origin on every consignment.
The industry splits between mill-integrated producers and stand-alone port refiners. Brazilian groups such as Raizen and Sao Martinho refine at the mill, Wilmar and Asian producers operate integrated plantations and coastal refineries, ASR Group refines in North America and Europe, and Gulf refineries such as Al Khaleej Sugar re-export white sugar across three continents. Raw supply, freight, and trade policy shape investment.
"A cane refinery is a toll processor with a commodity problem. The ones that make money own their raw sugar access, run near capacity, and sell enough liquid and specialty product that a bad spread year does not sink them."
Practice Lead, Agricultural Commodities and Sweeteners Practice · MMA Sweeteners and Agricultural Commodities Practice · September 2026

Market Trends

Liquid Sugar Delivered by Tanker Replaces Bagged Crystals in Bottling

Beverage bottlers and large bakeries are moving from bagged crystals to liquid sugar delivered by tanker, which removes dissolving equipment, cuts labour, and reduces dust and handling loss. Refiners build liquid plants next to customers and sell at a premium of 8% to 15% per dry tonne equivalent, and multi-year contracts anchor the investment. Coca-Cola and PepsiCo bottlers in Latin America, Southeast Asia, and Africa use liquid sugar in most plants, according to bottler annual reports. Liquid sugar needs storage tanks, heated pipelines, and microbial control, so only refiners with technical capability and local presence can compete.
Market Impact: emerging markets consume under 25 kg
Port Refineries Replace White Sugar Imports With Local Processing

Import-reliant markets in the Middle East, Africa, and Southeast Asia are adding port refineries that buy raw cane sugar and sell white sugar locally, which shifts trade from white to raw and captures the refining spread domestically. Al Khaleej Sugar operates a refinery near 1.5 million tonnes a year in Dubai, and Dangote and other groups have expanded in Nigeria. New refineries typically cost $150 million to $400 million and need three to four years to build. Governments support them through import duties on white sugar, so raw sugar flows to coastal plants in growing numbers.
Market Impact: co-products add 15-25% to mill income

Market Opportunities and Growth Drivers

Beverage and Packaged Food Demand in Emerging Markets Lifts Volumes

Refined sugar demand rises with income, urbanisation, and packaged food consumption, and Asia and Africa add the largest volumes each year. Indonesia, Vietnam, Nigeria, and Egypt import raw or white sugar to serve growing beverage, biscuit, and confectionery industries, according to United States Department of Agriculture supply reports. Beverage makers sign annual contracts, and per-capita consumption in most emerging markets remains below 25 kilograms a year, far under levels in Brazil and Australia. Population growth of over 100 million people a year across the two regions adds baseline demand, and refinery investment follows where import dependence is highest.
Market Impact: spreads fall toward $80 per tonne

Ethanol and Power Revenue Support Cane Refiners Through Price Cycles

Cane mills earn revenue from ethanol and bagasse power, and integrated refiners use that income to accept lower sugar spreads than stand-alone plants. Brazil blends 30% ethanol into gasoline and India targets 20%, which supports cane demand and lets mills invest in refining capacity. These co-products add 15% to 25% to mill income, according to company annual reports, and lenders favour integrated groups with diversified cash flow. Raizen, Sao Martinho, and Indian mills expand refining at existing sites to sell white and liquid sugar directly, reducing dependence on raw sugar exports and lifting margins on each tonne of cane processed.
Market Impact: per-capita use falls 1-2% annually

Market Restraints and Challenges

Thin Refining Spreads and Overcapacity Squeeze Stand-Alone Port Refinery Margins

Stand-alone refiners earn only the gap between white and raw sugar prices, and that spread narrows when capacity expands faster than demand. The root cause is heavy investment in Gulf and Asian refineries, which pushed utilisation below 75% and cut white premiums toward $80 per tonne in weak years, according to International Sugar Organization data. Refiners in Europe and North America have closed plants under this pressure. Mitigation includes liquid and specialty formats, long-term raw contracts, and tolling agreements with mills, though these steps rarely restore margin in oversupplied regions, and idle plants still carry fixed costs.
Market Impact: liquid sugar sells at 8-15% premiums

Sugar Levies and Health Campaigns Reduce Mature Market Use

More than 50 countries apply sugar-sweetened beverage levies, and health campaigns target added sugar in food, according to World Health Organization policy tracking. The root cause is rising concern over obesity and diabetes, which pushes governments to tax or label sugar. Beverage makers reformulate with sweeteners, and per-capita sugar use falls 1% to 2% a year in the United Kingdom, Mexico, and parts of Europe. Mitigation includes premium and organic grades, industrial applications, and expansion into faster-growing markets, though these steps rarely offset lost volume in mature regions, and lower demand leaves refiners with idle capacity.
Market Impact: Dubai refinery near 1.5 million tonnes
3 additional market trends, 4 additional growth drivers, and 2 additional restraints and challenges are covered in the full report. Contact sales@marketmindsadvisory.com to access the complete intelligence.

Segment CAGR and Growth Architecture

Refined cane sugar is segmented by product form, because processing, logistics, price, and buyer group differ more sharply between white crystals, liquid sugar, brown and specialty sugars, powdered grades, and organic sugar than they do by end use. Liquid cane sugar attracts the most investment as bottlers and bakers convert delivery convenience into multi-year supply agreements with refiners.
refined-cane-sugar-market-market-share-analysis-1789769981097

Liquid Cane Sugar and Syrups

Liquid cane sugar and syrups are the fastest-growing segment, made by dissolving refined crystals or refining directly to liquid at 67 degrees Brix and delivered by tanker to bottlers, bakeries, and dairy plants. Buyers choose them because they remove dissolving equipment, reduce labour, and improve dosing accuracy. Prices run 8% to 15% above dry sugar equivalents, and refiners build plants beside customers. Storage tanks, heated pipelines, and microbial control require investment, so suppliers with technical capability and local presence win contracts. Buyers sign multi-year agreements, and switching means retrofitting tanks and validating new supply. Pilot supply runs typically last two seasons before bottlers commit to long-term contracts and formal specification sheets.
CAGR 7.8%

Organic and Fair-Trade Refined Cane Sugar

Organic and fair-trade refined cane sugar is the second-fastest segment, produced from certified cane and refined in segregated lines, then sold to food brands, natural retailers, and premium beverage makers. Prices run 20% to 40% above conventional refined sugar, and organic cane yields are 15% to 25% lower, so supply is tight. Mills in Brazil, Paraguay, India, and Egypt supply raw organic sugar, and refiners in Europe and North America add segregation and audits. Certification favours scale, and buyers sign contracts of one to three years, while retailers use certified sugar as a marketing signal on premium products. Retail brands run several trials before shifting core recipes to certified sugar each year.
CAGR 6.4%
Full segment breakdown across 6 segments available in the complete report.

Regional Architecture and Country Demand Map

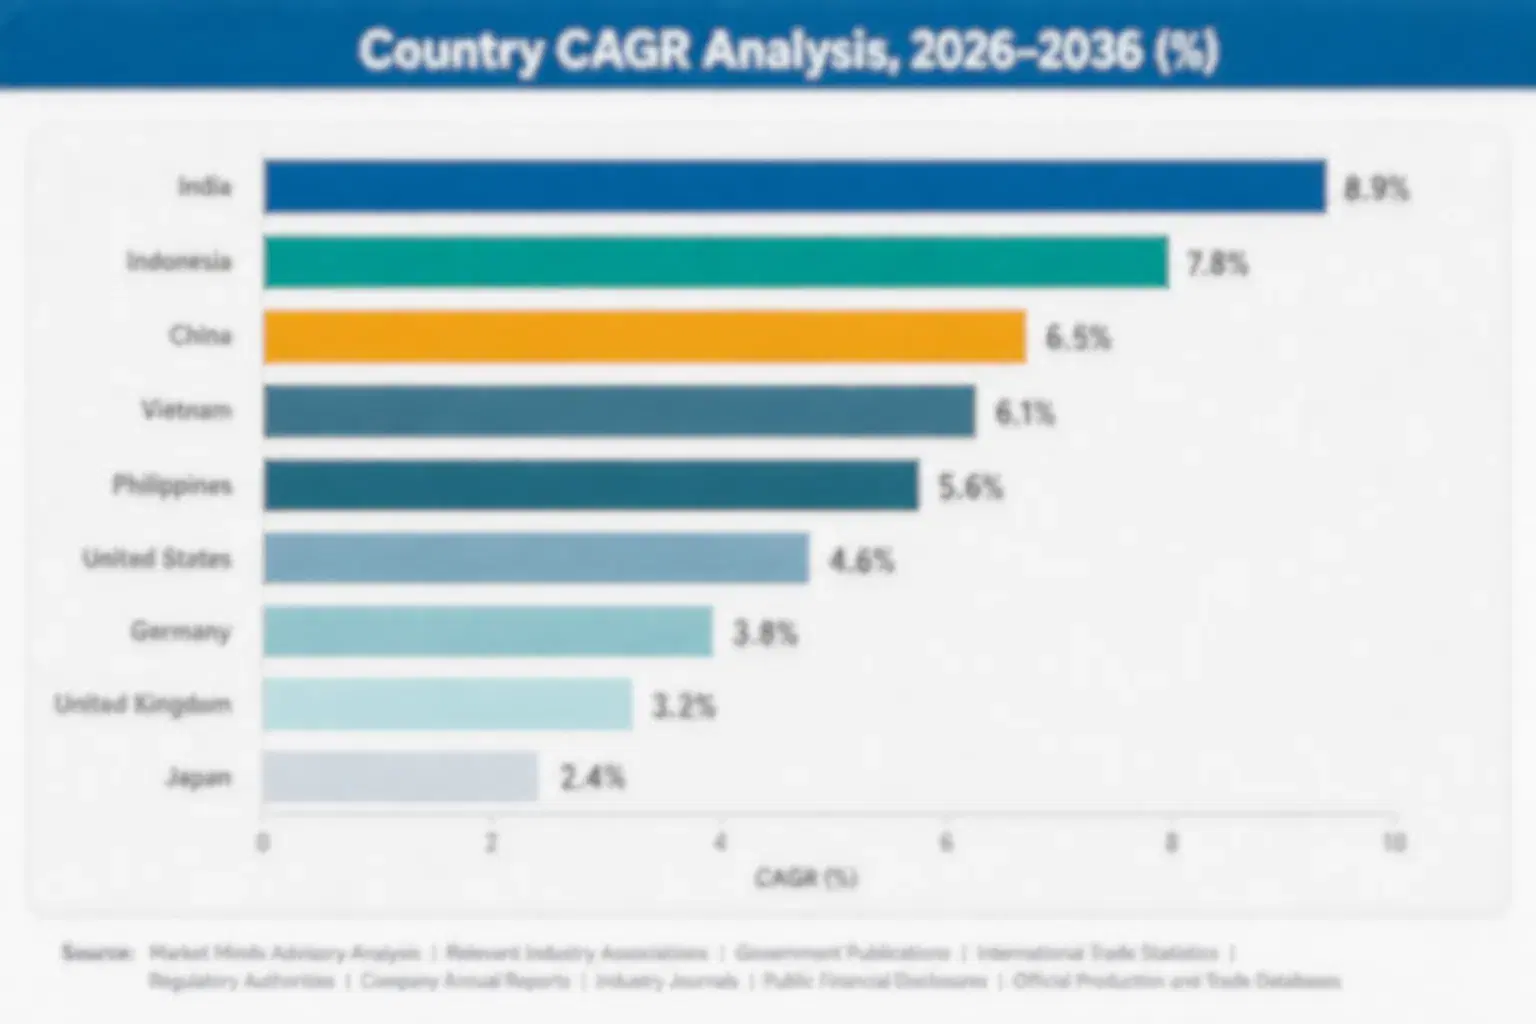
Refined cane sugar value follows cane geography, refinery capacity, and import dependence. Latin America leads through Brazilian and Central American mills, South Asia and Pacific follows through Indian, Thai, and Pakistani refining, and Indonesia is the fastest-growing country as import-led refining capacity and beverage demand expand.

North America

North America holds 11% share, below its usual band, because refined cane is a mature, quota-managed category where beet sugar, corn sweeteners, and modest per-capita growth cap cane refiners' value. ASR Group runs Domino and Redpath refineries in Baltimore, Yonkers, and Toronto, processing imported raw cane under tariff-rate quotas, while Louisiana and Florida mills supply domestic cane. Sugar levies, health campaigns, and sweetener substitution restrain returns, though liquid sugar for bottlers and organic grades keep growth near the global rate. Mexican export quotas add trade complexity, and foodservice contracts provide steady volume for coastal refineries. Canadian refiners also import raw cane for western markets, and Caribbean suppliers add specialty brown sugar volumes.
Share: 11% | CAGR: 3.4% (2026 to 2036)

Western Europe

Western Europe holds 6% share, below its usual band, because the region is beet-dominated and cane refining survives only in a few port refineries that process raw cane from tariff-preferred origins. Tate and Lyle Sugars, now part of ASR Group, refines in London, while Portuguese, Spanish, and Italian plants handle smaller volumes. Refinery closures, energy costs, and falling per-capita use hold growth below the global rate, though brown sugar, specialty grades, and organic supply add value. Dutch and Belgian traders move raw cane through Rotterdam and Antwerp, and British bakers remain loyal to golden and demerara products that rely on cane. Irish and French bakers also buy cane sugar for premium products yearly.
Share: 6% | CAGR: 2.1% (2026 to 2036)
Regional intelligence for 5 additional markets available in the complete report: East Asia, South Asia and Pacific, Latin America, Middle East and Africa, Eastern Europe. Contact sales@marketmindsadvisory.com.
refined-cane-sugar-market-country-cagr-analysis-1789769981417

Four Margin Routes for Cane Refiners

Margin in refined cane sugar comes from moving beyond commodity white crystals toward liquid sugar, certified grades, and long-term contracts that buyers cannot easily replace. Refiners that secure raw sugar access, keep plants close to full capacity, and invest in downstream formats earn more per tonne than sellers competing on the white premium alone.

Building Liquid Sugar Plants Beside Bottlers Under Long Contracts

Liquid sugar sells at 8% to 15% above dry sugar equivalents, so refiners that build tanker delivery plants beside bottlers and bakeries capture more value from each tonne of raw sugar. A liquid plant costs $8 million to $25 million and is recovered within four seasons under multi-year contracts covering 20,000 to 80,000 tonnes a year. Bottlers value dosing accuracy and lower labour, and switching means retrofitting tanks and pipelines. Refiners also gain stable volume that lifts utilisation by 5 to 10 points, which reduces fixed cost per tonne across the refinery and improves resilience during weak spread years.
Market Impact: liquid sugar plants lift utilisation 5 to 10 points

Securing Multi-Year Raw Sugar Supply From Mills and Traders

Raw sugar is 84% of cost of goods, so refiners that sign multi-year contracts with Brazilian, Indian, and Thai mills and traders secure supply and reduce spot price exposure. Contracts link price to published futures with fixed premiums, and they cost 1% to 3% above spot in normal years but avoid squeezes that cost 8 to 12 margin points. Refiners also hedge white premium separately, and lenders reward secure supply with lower borrowing costs. Suppliers value refinery offtake as a reliable outlet, and both sides gain from shared logistics planning at ports and terminals.
Market Impact: raw contracts protect 8 to 12 margin points

Certifying Organic and Fair-Trade Lines to Capture Premium Buyers

Organic and fair-trade refined sugar sells at 20% to 40% above conventional refined sugar, so refiners that segregate lines and secure certified raw sugar capture more value per tonne. Certification adds 4% to 8% to cost through audits, separate lines, and lower organic yields of 15% to 25%. Food brands sign multi-year contracts covering 3,000 to 15,000 tonnes, and once a refiner is approved, switching means new audits and trials. Retail customers also value traceability data, and certification supports access to premium buyers in Europe and North America that pay for verified supply.
Market Impact: certified sugar earns 20% to 40% price premiums

Selling Brown, Powdered, and Specialty Grades Through Branded Retail Packs

Brown, powdered, and specialty cane sugars sell in branded retail packs at gross margins of 20% to 30%, well above bulk white sugar at 8% to 14%. Refiners that invest in packing lines and brand marketing gain shelf space with grocery chains, and retail contracts run one to two years. Packaging and marketing cost 8% to 12% of sales, but branded products lower dependence on spread swings. Private label supply adds volume at thinner margins, and refiners that balance both channels keep plants running while protecting premium positioning in higher-margin retail segments.
Market Impact: branded packs earn 20% to 30% gross margins

Who Controls the Margin Pool

The refined cane sugar industry is fragmented by country and moderately consolidated among global groups, with the top five refiners holding about 29% of global revenue, the basis used throughout this section. Raizen, Wilmar International, Tereos, Sao Martinho, and ASR Group lead through raw sugar access, refining capacity, and trading reach, while many regional refiners and mills serve national markets and export customers.
Competition centers on three dimensions: raw sugar supply security through mill contracts and owned cane, refinery efficiency measured by utilisation and cost per tonne, and market access across ports, quotas, and long-term contracts. Leaders integrate ethanol, power, and refining, while stand-alone refiners depend on spread and local demand. Liquid and certified grades add another layer of differentiation. Logistics decide which exporters win.

Emerging pressure comes from Gulf and Asian refineries gaining share, from ethanol mandates pulling cane away from sugar, and from sugar taxes reducing beverage volumes. Rankings shift where refiners secure low-cost raw sugar, win liquid contracts, or lose to cheaper origins. Acquisitions of regional refineries and long-term supply agreements will reorder positions faster than organic growth, especially as buyers look for supply that reduces dependence on a single harvest.
refined-cane-sugar-market-company-positioning-matrix-1789769981720

Competitive Moat and Risk Dimensions

RAIZEN

Moat: Brazilian Cane Integration and Scale

Raizen is one of the largest Brazilian sugar and ethanol producers, operating integrated cane mills, refining, distribution, and energy assets. Its scale allows low-cost cane crushing and flexibility to shift output between sugar and ethanol, and its export terminals and trading relationships supply global buyers. Bagasse power and fuel distribution add income streams that cushion sugar price swings.
RAIZEN

Risk: Weather and Fuel Price Exposure

Raizen faces frost, drought, and cane yield risk, and its earnings depend on ethanol parity and fuel policy in Brazil. High debt levels and currency swings raise financing costs, and sugar price drops can reduce returns when ethanol cannot compensate, limiting flexibility during downturns and weakening its bargaining position.
WILMAR INTERNATIONAL

Moat: Asian Refining and Trading Network

Wilmar International operates integrated plantations, mills, and coastal refineries across Indonesia, India, Australia, and Africa, with a global trading arm that sources raw sugar from multiple origins. Its port refineries serve beverage and food customers with white, brown, and liquid sugar, and its scale in procurement, freight, and financing lowers cost.
WILMAR INTERNATIONAL

Risk: Thin Refinery Spread Exposure

Wilmar's stand-alone refineries earn the raw to white spread, which narrows when Gulf and Asian capacity expands. Import duties and policy shifts in Indonesia and India can change volumes suddenly, and regulatory scrutiny of its global operations adds compliance costs and reputational risk for its sugar business.

Players Tracked

Prominent Players

Raizen
Wilmar International
Tereos
Sao Martinho
ASR Group

Other Key Players

Al Khaleej Sugar
Dangote Sugar
Illovo Sugar Africa
Mitr Phol Sugar
Balrampur Chini Mills
Shree Renuka Sugars
Alvean
Sucden
Louis Dreyfus Company
Guangxi Guitang
Kenana Sugar Company
Tongaat Hulett
Copersucar
Pantaleon
Ingenio Providencia

Recent Developments

MARCH 2026

Wilmar Expands Liquid Sugar Capacity at Indonesian Port Refineries

Wilmar International completed an organic expansion of liquid sugar capacity at its Indonesian port refineries, adding tanker loading and storage to serve beverage bottlers. The project is internal capital spending. It raises output of liquid formats, improves plant utilisation, and gives bottlers a local supplier as beverage volumes grow.
Signal: Shows Asian refiners investing in liquid sugar capacity to serve beverage bottlers and lift refinery utilisation.
NOVEMBER 2025

Raizen Signs Multi-Year White Sugar Contracts With Latin American Bottlers

Raizen signed multi-year white and liquid sugar contracts with beverage bottlers in Latin America, covering volumes, quality specifications, and indexed price formulas. They give its mills steadier demand, reduce exposure to spot price swings, and support investment in tanker delivery and storage close to customer plants.
Signal: Confirms refiners are now locking in Latin American bottlers through indexed multi-year contracts to reduce price volatility.
FEBRUARY 2026

ASR Group Adds Organic Refining Line at North American Refinery

ASR Group added an organic sugar refining line at a North American refinery, with segregated processing and certification for premium food brands. The investment is organic capacity growth. It extends its premium portfolio, tests demand for certified cane sugar, and gives food makers a traceable domestic source alongside imported supply.
Signal: Shows refiners adding certified capacity in North America to meet premium sugar demand from food brands.

What Drives Refined Cane Sugar Costs

Raw sugar accounts for roughly 84% of cost of goods, sourced mainly from Brazil, Thailand, India, and Australia. Energy for melting, filtration, and drying, labour, chemicals, packaging, and freight add most of the remainder, so raw sugar price, the white premium near $110 per tonne, and refinery utilisation together determine margin for refiners supplying beverage, confectionery, and household buyers. Currency swings matter too.
Raw sugar prices spiked in 2022 and 2023, according to United States Department of Agriculture supply reports and the International Sugar Organization, as poor Indian and Thai crops, Brazilian weather, and higher energy and freight costs tightened supply. Refiners that sold forward absorbed losses, others added surcharges, and beverage makers reformulated with sweeteners. Margins narrowed noticeably as customers negotiated harder on renewals and shortened contract terms for later quarters.

Exposure varies by player type and geography. Integrated producers with owned cane, ethanol, and power absorb shocks better than stand-alone refiners buying raw sugar on spot. Brazilian mills face weather and fuel policy risk, Gulf and Asian refiners face import duty and freight risk, and liquid and organic lines pass costs through more easily than commodity white sugar sold in bulk.
refined-cane-sugar-market-cost-volatility-analysis-1789769982072

Contracting Raw Sugar Supply From Several Origins Over Multiple Seasons

Refiners sign multi-year supply agreements with mills and traders in Brazil, Thailand, India, and Australia, mixing fixed and index-linked prices to spread risk across origins. Diversifying supply reduces exposure to a single drought or frost, and quality clauses secure polarisation and colour limits. Contracted supply also lets refiners plan melting schedules and cut spot purchases.

Hedging Raw Sugar and White Premium on Futures Markets

Refiners hedge raw sugar and the white premium separately on futures markets, locking in a spread for forward sales to beverage and confectionery customers. Hedging reduces margin swings by 3 to 6 points, though it needs capital, risk management skills, and reliable counterparties. Refiners offset basis risk through diversified contracts and storage. Discipline matters.

Passing Costs Through Index-Linked Pricing With Major Customers

Large bottlers and confectionery makers agree to formulas linking price to published sugar benchmarks plus a fixed refining margin, so cost swings are shared rather than absorbed by refiners. Quarterly resets keep buyers informed and reduce disputes. Premium organic and liquid lines use annual pricing, since customers value stable supply over the year. Terms remain annual.

Portfolio Architecture for Margin Defence

Margins run from thin returns on bulk white sugar sold on the refining spread to strong profits on liquid, organic, and branded specialty lines sold with technical support and certification, with gross margin roughly doubling between the volume tier and the top tier. Downstream formats, certification, and contract structures add pricing power over the same raw sugar, and buyers pay more for reliability because a stalled delivery can halt a bottling line.
Volume and premium pull in different directions. Bulk white sugar sells in large lots to price-driven traders and industrial buyers at thin margins and faces pressure from new refineries and sweetener substitution. Liquid, organic, and specialty grades sell in smaller lots at much higher margins but need tanks, segregation, audits, and technical support, so refiners must choose how much capital to commit to premium positioning and how fast.

High-value pools concentrate in liquid sugar for bottlers, organic and fair-trade sugar for food brands, and branded specialty cane sugars for retail. These segments benefit from recurring orders, documented quality, and limited competition from small refineries. Refiners combining raw sugar supply, refining capacity, and downstream formats hold advantages that are difficult to replicate quickly.

Volume / Commodity-Adjacent Tier

White refined cane sugar sold in bulk to traders and industrial buyers on spot or benchmark prices, with thin margins, raw sugar cost exposure, and competition from new refineries worldwide, where buyers switch when spreads move.
Gross Margin: 7%-14%

Premium / Certified Tier

Refined sugar sold under indexed multi-year contracts with food safety audits and quality specifications, supplied to beverage and confectionery makers that require verified quality, reliable delivery, documented origin, and stable supply across the year.
Gross Margin: 13%-21%

Sustainability / Regulatory / Next-Generation Tier

Liquid, organic, fair-trade, and branded specialty cane sugars with segregated processing and traceability, positioned for bottlers, premium food brands, and retail across major markets, supported by tanker logistics, technical trials, and long-term supply agreements.
Gross Margin: 19%-30%
refined-cane-sugar-market-portfolio-architecture-1789769982382

High-value Sub-segments and Strategic Watch-out

Liquid Cane Sugar and Syrups

Liquid cane sugar combines the fastest growth with strong pricing, as bottlers and bakeries pay premiums for tanker delivery and dosing accuracy. Storage tanks, heated pipelines, and microbial control limit competition, and refiners with local plants and multi-year contracts win large accounts. Repeat volume follows.
Gross Margin: 19%-30%

Organic and Fair-Trade Refined Cane Sugar

Organic and fair-trade sugar offers high value with solid growth, since food brands and natural retailers pay steady premiums for certified, traceable supply. Limited organic raw sugar and audit costs constrain volume, though single-origin stories help, and premium retail is widening the buyer base for refiners with segregated lines.
Gross Margin: 18%-28%

White Refined Cane Sugar

White refined sugar forms the volume core, sold to beverage makers, bakeries, and households who want a consistent sweetener at low cost. Margins are moderate and exposed to spread swings, but steady demand supports scale, and integrated producers with raw sugar, refining, and logistics hold cost and delivery advantages.
Gross Margin: 7%-16%

Powdered and Icing Sugar

Powdered and icing sugar is a strategic watch-out, used in bakery and confectionery coatings but limited by small volumes, dust handling needs, and competition from beet and other sweetener products. Changing consumer tastes could restrict volume, so refiners should track baking demand and margins carefully as formats evolve.
Gross Margin: 10%-22%

Why Bottlers Stay With Refiners

Refined cane sugar demand behaves like an annuity once a bottler, confectioner, or retailer approves a refinery. Colour, grain size, and microbiological quality are tied to a specific plant, and liquid customers install tanks and pipelines matched to one supplier, so switching means new trials, audits, and capital cost. Refiners that serve the same account for years earn steady volume, and annual contracts renew at benchmark-linked prices rather than open tenders.
Stickiness varies by vertical. Beverage bottlers with liquid sugar systems are the deepest, since tanks, pipelines, and dosing equipment lock in supply and approvals are lengthy. Confectioners and bakeries are next, because technical support and delivery schedules raise switching cost. Foodservice distributors and household retail are shallower, moving between suppliers when price or availability changes, and traders rotate refiners frequently when spreads shift.

Buyer profiles are shifting. Older buyers focused on price, bagged deliveries, and long-standing traders, while younger procurement teams look for liquid supply, certified cane, and digital ordering. Sustainability reporting requirements push multinational brands to ask for cane origin and labour records, so refiners that answer with clear documentation and technical help keep loyalty across generations and win larger shares of contracts.
refined-cane-sugar-market-end-use-penetration-index-1789769982726

MMA Verdict on Cane Refining Strategy

These are among the four positions where our research anticipates prominent divergence between winners and laggards over the coming forecast period. Each is grounded in the demand model, the regulatory perimeter, and the announced capacity pipeline.
01 / LIQUID SUGAR CAPACITY

Build Liquid Sugar Plants Beside Bottlers Before Rivals Lock Contracts

Liquid cane sugar grows at 7.8% a year, about 2.17 times the market rate, and sells at 8% to 15% above dry sugar. A liquid plant costs $8 million to $25 million and pays back within four seasons. MMA recommends building two plants beside anchor bottlers within 24 months under contracts of 20,000 tonnes or more, because bottlers that install tanks for one supplier rarely add a second, and early entrants gain data and reference customers that late entrants struggle to match.
02 / RAW SUGAR SOURCING SECURITY

Contract Raw Sugar Across Origins Before Spreads Squeeze Again

Raw sugar is 84% of cost of goods, and supply squeezes cost 8 to 12 margin points. Multi-year contracts cost 1% to 3% above spot but protect utilisation and quality. MMA recommends contracting at least 60% of annual raw sugar needs across Brazil, Thailand, and India and hedging the white premium separately within two years, because refiners that keep plants full earn more than those buying on spot, and lenders reward secure supply with lower borrowing costs, which improves returns on later projects.
03 / CERTIFIED PREMIUM PORTFOLIO

Certify Organic Lines Before Food Brands Lock Long Contracts

Organic and fair-trade refined sugar sells at 20% to 40% above conventional grades, and certification adds 4% to 8% to cost. Food brands sign contracts of 3,000 to 15,000 tonnes. MMA advises certifying one segregated line and signing multi-year contracts with two food brands within 24 months, because buyers that qualify one organic supplier rarely add a second, and early entrants gain audit history and reference customers that late entrants struggle to match, while retailers also reward traceable supply, and buyers value quick answers.
04 / EMERGING MARKET REFINING STRATEGY

Add Port Refining Capacity in Import-Reliant Markets Before Duties Change

Import-reliant markets in Africa and Southeast Asia add the largest volumes, and local refining avoids white sugar duties of 10% to 30%. New refineries cost $150 million to $400 million. MMA advises building or acquiring capacity in two growth markets within three years, since local producers win subsidised tenders and beverage contracts, and refiners that wait risk paying premiums for scarce plants, while early entrants secure raw sugar logistics and distribution reach that are hard to replicate, so timing matters more than price.

Engagement Snapshot From the Field

A live engagement with an industry participant carrying material or product regulatory and market exposure ahead of a defining policy shift, showing how our research translates into a defensible multi-year portfolio strategy.
MARKET MINDS ADVISORY · CLIENT ENGAGEMENT SUMMARY
Refined Cane Sugar Producer Strategic Portfolio Review and Transition Roadmap 2026·Investment Scenario on Refined Cane Sugar Exposure Evaluation 2025-26
CLIENT PROFILE
The client is a mid-sized Southeast Asian port sugar refiner with one refinery of 800,000 tonnes annual capacity, generating roughly $520 million in annual revenue (client-reported, unverified by MMA), selling white refined sugar to beverage makers, distributors, and retailers. Gross margin sat near 7% (client-reported, unverified by MMA), and a new competing refinery had cut utilisation to 68% the previous year.
STRATEGIC CHALLENGE
Raw sugar purchases were mostly spot, the white premium had narrowed, two bottlers asked for liquid sugar the client could not supply, and larger competitors were adding tanker plants and long-term contracts. Leadership needed a plan that secured raw supply, justified liquid investment, and lifted utilisation without overextending capital. The board wanted a decision within nine months, before the next annual contract cycle.
MMA APPROACH
MMA benchmarked nine regional and global refiners on cost, product mix, and channel access, interviewed bottlers, distributors, and lenders about contract preferences, and modeled the economics of raw sugar contracts, a liquid sugar plant, organic supply, and indexed pricing under bull, base, and bear spread scenarios. Analysts also reviewed the client's plant records and customer mix.
KEY FINDINGS
  1. Multi-year raw sugar contracts covering 60% of needs would cut spot exposure and protect roughly three margin points, according to procurement records and lender interviews.
  2. A liquid sugar plant costing about $14 million (client-reported, unverified by MMA) would serve two bottlers and lift utilisation by seven points within two seasons.
  3. Indexed contracts with two beverage makers would cover 35% of output and cut margin volatility by four points, based on buyer discussions and pricing tests.
  4. Organic and brown sugar lines could add 8% of volume at margins 10 points above white sugar, though they needed segregation and certification in the first year.
CLIENT PROFILE
The client is a mid-sized Southeast Asian port sugar refiner with one refinery of 800,000 tonnes annual capacity, generating roughly $520 million in annual revenue (client-reported, unverified by MMA), selling white refined sugar to beverage makers, distributors, and retailers. Gross margin sat near 7% (client-reported, unverified by MMA), and a new competing refinery had cut utilisation to 68% the previous year.
STRATEGIC CHALLENGE
Raw sugar purchases were mostly spot, the white premium had narrowed, two bottlers asked for liquid sugar the client could not supply, and larger competitors were adding tanker plants and long-term contracts. Leadership needed a plan that secured raw supply, justified liquid investment, and lifted utilisation without overextending capital. The board wanted a decision within nine months, before the next annual contract cycle.
MMA APPROACH
MMA benchmarked nine regional and global refiners on cost, product mix, and channel access, interviewed bottlers, distributors, and lenders about contract preferences, and modeled the economics of raw sugar contracts, a liquid sugar plant, organic supply, and indexed pricing under bull, base, and bear spread scenarios. Analysts also reviewed the client's plant records and customer mix.
KEY FINDINGS
  1. Multi-year raw sugar contracts covering 60% of needs would cut spot exposure and protect roughly three margin points, according to procurement records and lender interviews.
  2. A liquid sugar plant costing about $14 million (client-reported, unverified by MMA) would serve two bottlers and lift utilisation by seven points within two seasons.
  3. Indexed contracts with two beverage makers would cover 35% of output and cut margin volatility by four points, based on buyer discussions and pricing tests.
  4. Organic and brown sugar lines could add 8% of volume at margins 10 points above white sugar, though they needed segregation and certification in the first year.
RECOMMENDED STRATEGY
Phase 1: Phase 1 (Months 1-6): Sign multi-year raw sugar contracts, start hedging the white premium, and begin liquid sugar plant design. Phase 2: Phase 2 (Months 7-18): Build the liquid plant, sign indexed contracts with two bottlers this year, and start organic certification work. Phase 3: Phase 3 (Months 19-30): Launch organic and brown lines, scale premium volume, and review pricing formulas each quarter with major customers.
OUTCOME
Within 30 months, liquid, organic, and contract volume reached about 35% of sales, utilisation rose from 68% to 82%, and gross margin rose from 7% to about 12% (client-reported, unverified by MMA). Two bottlers signed three-year agreements, spot raw purchases fell sharply, and the board approved a second liquid plant for the following year.

Frequently Asked Questions

Foundational context covering the market sizes, CAGR, scope, country, region and competition that inform every finding below. This section is provided to cover basics and most often pre-purchase conversations, answered from the MMA Primary Research Dataset.

What is the current size of the Refined Cane Sugar Market?

The global refined cane sugar market was valued at $71.0 billion in 2025. This covers white, brown, powdered, liquid, and organic cane sugars sold to food, beverage, foodservice, and household buyers.

How large will the Refined Cane Sugar Market be by 2036?

MMA projects the market will reach approximately $104.8 billion by 2036. This represents cumulative growth of roughly $31.2 billion over the full ten-year forecast window.

What is the CAGR for the Refined Cane Sugar Market 2026 to 2036?

The market is forecast to grow at a 3.6% compound annual rate between 2026 and 2036. The bull case reaches 4.9% while the bear case falls to 2.3%.

Which segment is growing fastest?

Liquid Cane Sugar and Syrups is the fastest-growing segment at 7.8% CAGR, roughly 2.17 times the overall market rate. Organic and Fair-Trade Refined Cane Sugar follows as the second-fastest segment at 6.4% CAGR each year.

Who are the major companies in the Refined Cane Sugar Market?

Leading companies include Raizen, Wilmar International, Tereos, Sao Martinho, and ASR Group. These five refiners together hold an estimated 29% of total global market revenue, based on MMA analysis of company disclosures.

Which country is growing fastest?

Indonesia is the fastest-growing major market, expanding at approximately 6.2% CAGR each year. Import-led refining capacity and rising beverage demand are driving this above-market growth across the country.

Report Segmentation Architecture

The full report scope spans multiple orthogonal segmentation dimensions, with cross-tabulated demand data provided for each dimension pair. Coverage extends further to regional breakdowns, trend trajectories, and the competitive detail needed to support segment-level decision-making.

By Primary Market Dimension

  • Liquid Cane Sugar and Syrups
  • Organic and Fair-Trade Refined Cane Sugar
  • White Refined Cane Sugar
  • Brown and Specialty Cane Sugar
  • Powdered and Icing Sugar
  • Bulk Industrial Refined Cane Sugar

By End-Use Industry

  • Beverage Manufacturing
  • Confectionery and Bakery
  • Dairy and Processed Food
  • Foodservice
  • Household Retail Consumption

By Commercial Dimension

  • Indexed Bulk Supply Contracts
  • Tanker Delivered Liquid Contracts
  • Branded and Private Label Retail Packs
  • Institutional and Public Tenders

By Region

  • North America
  • Western Europe
  • East Asia
  • South Asia and Pacific
  • Latin America
  • Middle East and Africa
  • Eastern Europe

Scope, Methodology, and Coverage

Every figure in this report is reproducible from documented input assumptions. The scope below maps the historical period, the forecast horizon, the segmentation dimensions, and the countries covered, alongside the underlying primary and qualitative methodology.
Historical Period
2020 to 2025
Forecast Period
2026 to 2036
Base Year
2025 (USD billions; MMA Primary Research Dataset, September 2026)
Market Definition
Refined cane sugar is sucrose produced from sugarcane and purified through refining, including white refined, brown and specialty, powdered and icing, liquid sugar and syrups, and organic and fair-trade grades, sold to food and beverage makers, foodservice, retailers, and households. The scope excludes beet sugar, raw and unrefined cane sugar sold for further refining, molasses, high-fructose corn syrup, and non-sucrose sweeteners.
Quantitative Units
USD billions (current prices); million tonnes for volume references
Segmentation Dimensions
By Product Form; By End-Use Industry; By Commercial Dimension; By Region
Regions Covered
North America, Western Europe, East Asia, South Asia and Pacific, Latin America, Middle East and Africa, Eastern Europe
Countries Covered
USA, Canada, Mexico, Brazil, Colombia, Guatemala, UK, Portugal, Spain, Turkey, Ukraine, Russia, UAE, Egypt, South Africa, Nigeria, China, Japan, South Korea, India, Thailand, Pakistan, Indonesia, Australia, and additional markets relevant to this sector
Key Companies Profiled
Raizen, Wilmar International, Tereos, Sao Martinho, ASR Group, Al Khaleej Sugar, Dangote Sugar, Illovo Sugar Africa, Mitr Phol Sugar, Balrampur Chini Mills, Shree Renuka Sugars, Alvean, Sucden, Louis Dreyfus Company, Guangxi Guitang, Kenana Sugar Company, Tongaat Hulett, Copersucar, Pantaleon, Ingenio Providencia
Quantitative Methodology
Primary survey, n=3,800 respondents, Q4 2025, six countries; demand-side model with trade association cross-validation
Qualitative Methodology
47 expert interviews, Q4 2025; applied to validate demand model assumptions, identify emerging dynamics, and assess competitive positioning
Report Format
PDF and XLSX data workbook (Word format preview document)
Publisher
Market Minds Advisory
Report Code
MMA-2026-AGR-309
Published
September 2026
Contact
sales@marketmindsadvisory.com | www.marketmindsadvisory.com

Purchase the full Refined Cane Sugar Market Report (2026 to 2036).

The full report delivers a detailed assessment of global refined cane sugar demand, product mix, and competitive positioning through 2036. It includes segment forecasts by product form, country-level data for all seven world regions, and profiles of the twenty companies most relevant to cane refining. Analysts also receive input cost modeling and portfolio margin benchmarking built from MMA's primary research dataset. A scenario planning module lets subscribers stress-test bull and bear assumptions against raw sugar, refinery spread, and trade policy outcomes. Quarterly updates keep the whole dataset current throughout the subscription year.
Ten-year segment and regional demand forecasts
Raw sugar and white premium price tracking
Competitive benchmarking of top twenty refiners
Refinery utilisation and spread sensitivity modeling
Regional demand mechanism comparative analysis included
Quarterly primary survey data update access

Built For The People Who Decide

From boardroom strategy to bench-side execution, this report is read cover-to-cover by leaders shaping the next decade of their industry, turning demand scenarios, market dynamics and valuation benchmarks into decisions.
CXOs/ Presidents/ VPs/ Managers
M&A and Corporate Development
Strategy Teams and R&D Heads
Procurement and Product Directors
Regulatory and Compliance Leaders
Investor Relations and Equity Analysts