

Market Minds Advisory
Recycled Carbon Fiber Market

Recycled Carbon Fiber Market: The Fibre Survives, the Architecture Does Not

Pyrolysis returns fibre with most of its tensile strength intact and none of its continuity, which is why a recovered aerospace laminate comes back as reinforcement for something considerably less demanding.

Lead Analyst

Bilal Shaikh

Published

September 2026

Make Smarter Decisions with Customized Research Insights

Request a free sample report and evaluate market opportunities, growth trends, and competitive dynamics relevant to your business needs.

2025 MARKET VALUE$0.2BMarket Size 2025
2036 FORECAST VALUE$0.9BBase Case , 2026 to 2036
CAGR 2026 TO 203612.4 %Bull 13.6% / Bear 11.2%
INCREMENTAL OPPORTUNITY$0.6BNet 10- year value creation
EXPANSION MULTIPLE3.22x2036 value over 2026 base
Strategic Levers
M&A Pipeline
Regional Outlook
Country Rankings
Competitive Intelligence
Segmental Deep-dive
Call-Us : 91 93563 13602

Executive Snapshot and Market Trajectory

Two numbers describe this industry. Recovered fibre retains around 88% of its tensile strength after pyrolysis, and a laminate made from it retains roughly 42% of the original composite performance. The fibre survives; the continuous architecture does not. Everything commercial in this industry follows from that gap.
That gap decides everything commercially. Recycled fibre cannot return to the aerospace structure it came from and instead competes as a short-fibre reinforcement priced near 52% of virgin chopped fibre, against glass as much as against carbon. Aligned recycled tapes grow fastest at 18.6%, half again the market rate of 12.4%, because realigning discontinuous fibre is the only route that recovers some of the lost architecture. Alignment adds cost the recovered performance has to justify.
The feedstock story is also not the one usually told. Around 76% of recovered volume arrives as clean manufacturing offcut and expired prepreg rather than from end-of-life aircraft or wind blades, which turn up contaminated, mixed with glass and expensive to take apart. East Asia holds 30% of value on composite manufacturing waste generation, and China grows fastest anywhere at 16.2%. Recovery capacity is following that waste.
Market Definition
Carbon fibre recovered from composite waste through pyrolysis, solvolysis or mechanical routes and sold as a reinforcement, covering chopped and milled fibre, nonwoven mat and veil, pellets and compounds, aligned fibre tapes, and fibre papers and tissues. Measured at recycler selling value. Excludes virgin carbon fibre, glass and aramid fibre recycling, composite waste sent to energy recovery or landfill, and recovered matrix chemicals.
Base Year Value
$0.2B in 2025 (MMA Primary Research Dataset, August 2026)
Forecast Period
2026 to 2036, eleven discrete annual values
CAGR
12.4% base case. Bull 13.6%. Bear 11.2%.
Fastest Growth Segment
Aligned Recycled Fibre Tapes: 18.6% CAGR
Fastest Growth Country
China: 16.2% CAGR
Fastest Growth Region
South Asia and Pacific: 14.2% CAGR
Largest Region
East Asia: 30% of 2025 global value
Market Leaders
Gen 2 Carbon, Carbon Conversions, Vartega, Carbon Fiber Recycle Industry, Procotex. Source: MMA Primary Research Dataset, July 2026.
Primary Survey
n=3,800 procurement and R&D decision-makers, Q4 2025, six countries
Methodology
Demand-side build-up, cross-validated against public data, 47 expert interviews

Recycled Carbon Fiber Market Forecast Scenarios

recycled-carbon-fiber-market-size-forecast-scenario-1787594804491
Growth ran near 11.0% between 2020 and 2025 from a very small base, held back through the early years as aerospace production cuts reduced the prepreg offcut stream that supplies most feedstock. That dependency surprised several operators who had built capacity assuming end-of-life parts would arrive. European landfill restrictions tightened across the period and pulled volume toward recovery regardless of the economics.
Base case 12.4% rests on three mechanisms. Aerospace production recovery restores the clean manufacturing offcut stream that supplies roughly 76% of feedstock and underpins consistent product quality. Automotive thermoplastic compounding takes growing volume where short fibre reinforcement is genuinely appropriate rather than a compromise. And Chinese carbon fibre capacity expansion generates manufacturing waste at scale, driving 16.2% growth there and reshaping where recoverable material originates Where fibre is converted decides where recoverable material originates, and that geography is shifting fast.
The bull case at 13.6% assumes aligned tape technology reaching commercial scale and recovering enough composite performance to reach semi-structural applications that discontinuous fibre currently cannot serve. The bear case at 11.2% is sustained virgin carbon fibre oversupply pushing prices down far enough that recycled material loses its cost argument and survives only on regulatory and brand demand.

Ninety Percent Fibre, Forty Percent Composite

Pyrolysis burns off the resin and leaves the fibre, which comes through with around 88% of its tensile strength. That sounds like success until the fibre is put back into a laminate, where performance retention falls to roughly 42%, because the continuous tows and woven architecture that made the original composite work were destroyed along with the matrix. The fibre is fine. The structure it belonged to cannot be rebuilt.
TOP FIVE CONCENTRATION44%A young field with few operators at genuine scale
TENSILE STRENGTH RETENTION88%Fibre property recovered after pyrolysis against virgin material
COMPOSITE PROPERTY RETENTION42%Laminate performance retained once fibre continuity is lost
VIRGIN PRICE RATIO52%Recycled price against comparable virgin chopped fibre grades
MANUFACTURING WASTE FEEDSTOCK76%Recovered volume arriving as clean production offcut material
ENERGY SAVING VERSUS VIRGIN94%Reduction in energy required against making new fibre
So the commercial question is not how to recycle carbon fibre but what a short-fibre carbon reinforcement is actually worth. It sells near 52% of virgin chopped fibre and competes against glass fibre as much as against carbon, on stiffness per unit cost rather than on provenance. Aligned tape technology, which realigns discontinuous fibre into something approaching a unidirectional ply, is the only route attempting to recover the lost architecture.
Feedstock reality diverges sharply from the public narrative. Around 76% of recovered volume is clean manufacturing offcut and expired prepreg from composite converters, with known fibre type, known resin and no contamination. End-of-life aircraft and wind blades supply the photographs and a minority of the tonnage.
"Everybody funds this industry on a picture of a wind blade and then runs the plant on aerospace prepreg offcuts, which arrive clean and identified and are the only feedstock that supports a consistent product. The end-of-life story is real and it is a decade away from being the volume anyone claims it already is."
Director, Advanced Materials and Composite Recovery Practice · MMA Chemicals and Materials Practice · August 2026

Market Trends

Aligned tape technology attempting to recover lost fibre architecture

Recovered fibre keeps around 88% of its tensile strength while a laminate made from it retains roughly 42% of composite performance, and the entire gap sits in lost continuity and alignment. Aligned tape processes comb discontinuous fibre into near-unidirectional form, recovering a meaningful part of that difference and reaching applications chopped fibre cannot serve. The segment grows at 18.6%, half again the market rate of 12.4%, from a small base. Commercial scale remains the open question, since the alignment step adds cost that the recovered performance must justify. Feedstock consistency matters more here than in any other product form.
Market Impact: Priced at 52% of virgin

European landfill restrictions forcing composite waste toward recovery

Landfill bans on composite waste across several European countries removed the cheapest disposal route and pushed material toward recovery whether or not the economics justified it at the time. That created recycler feedstock supply at prices set by disposal avoidance rather than by material value, which is an unusually favourable position for a young industry. Wind blade decommissioning is the volume most often cited, though blades are predominantly glass with carbon confined to spar caps in larger designs. Blades are predominantly glass with carbon confined to spar caps in larger designs.
Market Impact: Chinese volume growing at 16.2%

Market Opportunities and Growth Drivers

Automotive thermoplastic compounding absorbing genuinely suitable volume

Short fibre reinforcement in injection-moulded thermoplastic components is an application where discontinuous carbon is appropriate rather than a compromise, since the moulding process would chop continuous fibre anyway. Recycled material at roughly 52% of virgin chopped price competes directly and wins on cost without any sustainability argument attached. Battery enclosure brackets, structural interior parts and under-bonnet components all take volume. Compounders qualifying recycled grades find property variation the main obstacle rather than any absolute performance shortfall. That variation points back at feedstock consistency rather than at any process shortcoming. Clean offcut streams are therefore worth well above mixed material.
Market Impact: Retains only 42% of performance

Chinese carbon fibre capacity generating manufacturing waste at scale

China grows fastest anywhere at 16.2% as domestic carbon fibre capacity expansion generates prepreg offcut and production waste in volumes that did not exist five years ago. Manufacturing waste supplies roughly 76% of global recycler feedstock, so where fibre is converted determines where recoverable material originates. Domestic recycling capacity is developing behind that waste stream rather than ahead of it. The material is clean, identified and consistent, which makes it far more valuable to a recycler than end-of-life composite. Where fibre is converted determines where recoverable material originates, which is reshaping the geography of this industry considerably.
Market Impact: Only 24% from end-of-life

Market Restraints and Challenges

Lost fibre continuity capping achievable composite performance permanently

Recovered fibre retains around 88% of tensile strength while a laminate built from it retains roughly 42% of composite performance, and the difference is architectural rather than chemical. The root cause is that pyrolysis and solvolysis both destroy the continuous tow and woven structure while recovering the filament, and no recovery route preserves it. Commercially this closes structural aerospace and primary load paths permanently. Aligned tape processing recovers part of the gap, and it adds cost that the recovered performance has to justify. Applications where the process would chop fibre anyway remain fully open.
Market Impact: Closes part of a 42% gap

End-of-life feedstock proving contaminated, mixed and costly to process

Wind blades and retired aircraft arrive painted, bonded, mixed with glass and full of metallic fittings, which makes them expensive to disassemble before any fibre can be recovered. The root cause is that these structures were designed for service life rather than for disassembly, decades before anyone considered recovery. Commercially this leaves around 76% of feedstock coming from clean manufacturing offcut instead. Design for disassembly is being written into newer blade and airframe programmes, which helps material arriving in the 2040s. Recoverable carbon per tonne of blade waste has consistently disappointed against business case assumptions.
Market Impact: Feedstock priced below 52% ratio
4 additional market trends, 3 additional growth drivers, and 2 additional restraints and challenges are covered in the full report. Contact sales@marketmindsadvisory.com to access the complete intelligence.

Segment CAGR and Growth Architecture

Six segments split by recovered product form, because form determines what mechanical performance survives, which conversion processes can use the material and what a buyer will pay for it. Recovery route and precursor fibre grade variants sit inside each form rather than beside them. End-use industry and channel are handled in the framework instead.
recycled-carbon-fiber-market-market-share-analysis-1787594805045

Aligned Recycled Fibre Tapes

Growing at 18.6%, half again the market rate of 12.4%, aligned tapes comb discontinuous recovered fibre into near-unidirectional form, recovering a meaningful part of the gap between 88% fibre strength retention and 42% composite performance retention. That reaches semi-structural applications no chopped grade can serve, which is where the value in this industry has always been assumed to sit. The alignment step adds processing cost that recovered performance must justify, and commercial scale remains the open question rather than technical feasibility. Feedstock consistency matters more here than in any other form, which favours recyclers working from clean manufacturing offcut. Buyers assumed this was where value sat, and they were broadly right.
CAGR 18.6%

Recycled Fibre Pellets and Compounds

At 15.4% pellets and compounds serve injection moulding, where the process would chop continuous fibre anyway and discontinuous material is genuinely appropriate rather than a compromise accepted for cost reasons. Recycled fibre at roughly 52% of virgin chopped price wins on economics alone, without needing any sustainability argument to support it. Automotive brackets, battery enclosure components and under-bonnet parts take most volume. Compounders report property variation as the main qualification obstacle rather than absolute performance, which points back at feedstock consistency and makes clean offcut streams worth more than mixed end-of-life material. Cost alone wins this comparison without any sustainability argument attached to it. Feedstock consistency is again what decides whether a qualification completes at all.
CAGR 15.4%
Full segment breakdown across 6 segments available in the complete report.

Regional Architecture and Country Demand Map

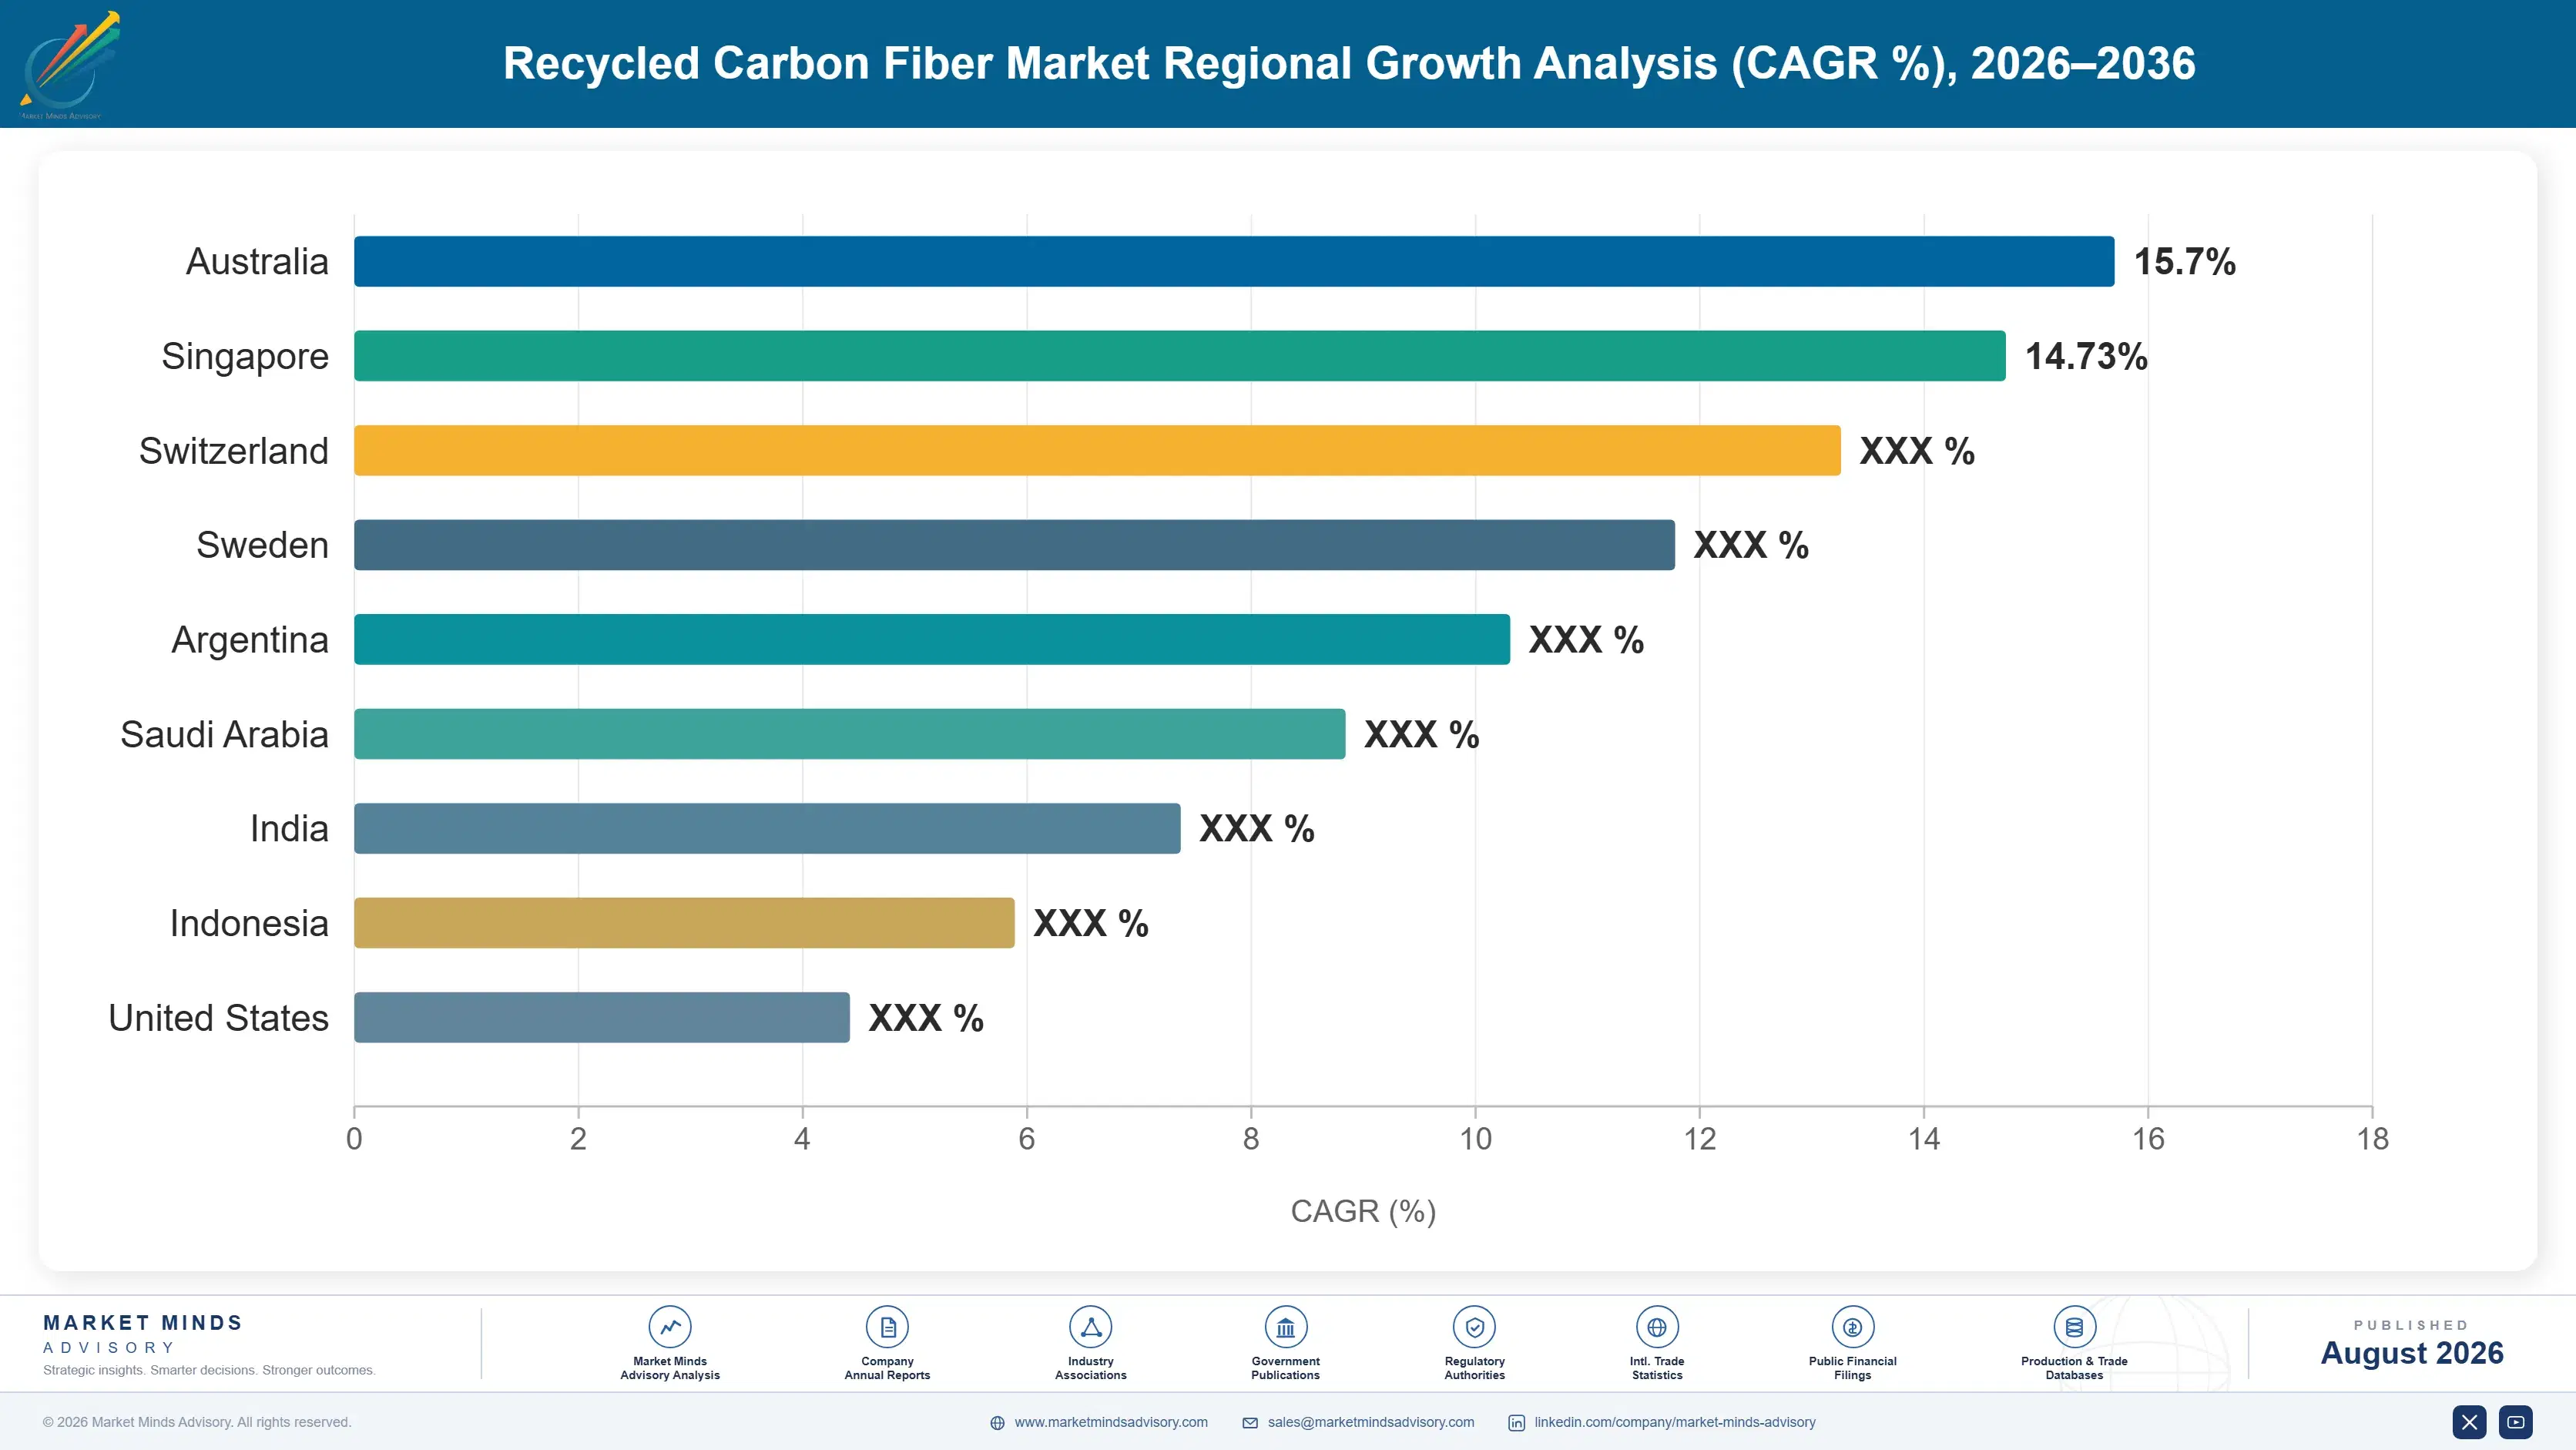
East Asia holds 30% of value on composite manufacturing waste generation, since Japanese and Chinese carbon fibre conversion produces most of the world's recoverable prepreg offcut material today. Western Europe follows at 26%, where landfill restrictions force recovery, with North America at 23% on aerospace conversion waste.

North America

Aerospace composite conversion generates the largest single feedstock stream in the region, with prepreg offcut and expired roll material arriving clean and identified from a concentrated group of converters. Automotive compounding takes most of the recovered output, where short fibre reinforcement suits injection moulding rather than compromising it. No federal landfill restriction on composite waste exists, so recovery here proceeds on economics and corporate commitment rather than on regulation. Retired aircraft storage in the southwest is frequently cited as future feedstock and remains costly to disassemble. Growth of 11.8% runs below the base case. Automotive compounding qualification is the practical route to volume here. Property variation rather than performance blocks most qualifications here.
Share: 23% | CAGR: 11.8% (2026 to 2036)

Western Europe

Landfill bans on composite waste across Germany, the Netherlands and Austria removed the cheapest disposal route and pushed material toward recovery ahead of what economics alone would have supported. That gave European recyclers feedstock priced by disposal avoidance rather than material value, which is unusually favourable. Wind blade decommissioning volumes are the most visible stream and are predominantly glass, with carbon confined to spar caps in larger designs. British and German operators hold the deepest process knowledge in the industry. Growth at 11.0% sits below the base case as the regulatory push matures. Feedstock priced by disposal avoidance is unusually favourable for a young industry. British and German process knowledge remains the deepest anywhere.
Share: 26% | CAGR: 11.0% (2026 to 2036)
Regional intelligence for 5 additional markets available in the complete report: East Asia, South Asia and Pacific, Latin America, Middle East and Africa, Eastern Europe. Contact sales@marketmindsadvisory.com.
recycled-carbon-fiber-market-country-cagr-analysis-1787594805571

Four Moves on a Downgraded Material

Selling recycled carbon fibre as carbon fibre invites a comparison it simply cannot win, since composite performance retention sits near 42% however good the recovered filament turns out to be. Every durable position in this industry comes from feedstock control, from applications where discontinuity does not matter, or from recovering some of the lost architecture.

Contract clean manufacturing offcut before competitors notice

Around 76% of feedstock is clean prepreg offcut and expired roll material with known fibre type and no contamination, and it is the only stream supporting consistent product quality. End-of-life material arrives painted, bonded and mixed, which is why it stays a minority despite the publicity. Converters currently pay to dispose of offcut, so contracting it costs little and secures the input that decides output consistency. Very few recyclers have locked those streams up properly. It is the cheapest defensible position available in this industry, and it decides output consistency before any process decision does.
Market Impact: Secures 76% of all the usable feedstock stream

Sell into applications where discontinuity costs nothing

Injection moulding chops continuous fibre during processing regardless, which makes recovered discontinuous material genuinely appropriate rather than a compromise in that application. At roughly 52% of virgin chopped price it wins on cost alone without any sustainability argument. Automotive brackets, battery enclosure parts and under-bonnet components all take volume on that basis. Chasing structural composite applications instead means competing where the 42% performance retention is exactly the disqualifying number. Compounders report property variation rather than absolute performance as the qualification obstacle, which again points back at feedstock. Cost alone carries the argument here.
Market Impact: Wins outright at 52% of the virgin price

Invest in alignment to reach semi-structural applications

The gap between 88% fibre strength retention and 42% composite performance retention is entirely architectural, and aligned tape processing recovers a meaningful part of it. That segment grows at 18.6% and reaches applications no chopped grade serves. Alignment adds processing cost the recovered performance must justify, so the decision is commercial rather than technical. Feedstock consistency matters more here than anywhere, which rewards recyclers who secured clean offcut streams first. Semi-structural automotive components are the first application to have qualified aligned material commercially, and volumes remain limited while cost is assessed.
Market Impact: Enters a segment now growing at 18.6% annually

Price on stiffness per unit cost against glass fibre

Buyers comparing recycled carbon against virgin carbon see a downgrade; buyers comparing it against glass fibre see a stiffness and weight advantage at a manageable premium. At roughly 52% of virgin chopped price the material sits in a band where that second comparison is genuinely winnable, and it opens applications a carbon-versus-carbon conversation never reaches. Almost every recycler frames the discussion the first way, which is the harder sale and the smaller market. Almost every recycler frames the discussion the first way, which is both the harder sale and the smaller available market.
Market Impact: Reframes against a 52% relative virgin price point

Who Controls the Margin Pool

Participation is measured on annual recovered fibre production capacity, and the top five hold 44%. Concentration reflects the youth of the industry rather than any barrier, since few operators have reached meaningful scale and many announced projects never commissioned. Gen 2 Carbon and Carbon Conversions lead on installed capacity and on feedstock relationships built over years. The gap to challengers is contracted feedstock access rather than process technology. Many announced projects never commissioned at all.
Competition runs on three fronts. Feedstock contracting decides output consistency, since clean manufacturing offcut behaves entirely differently from mixed end-of-life material. Product form decides realised value, with aligned tapes and compounds worth far more than milled fibre. Application development decides volume, because a compounder qualifying recycled grades needs support that a datasheet cannot provide. Feedstock quality decides all three in practice.

Pressure ahead comes from virgin carbon fibre oversupply periodically removing the cost argument, and from Chinese recovery capacity building behind the world's fastest growing waste stream. Expect feedstock contracting and alignment technology investment rather than acquisitions. Rankings shift as Chinese operators scale and as aligned tape processes prove or fail to prove out commercially. Product form is where realised value differs most.
recycled-carbon-fiber-market-company-positioning-matrix-1787594806093

Competitive Moat and Risk Dimensions

GEN 2 CARBON

Moat: Contracted aerospace offcut relationships

Long-standing supply arrangements with aerospace composite converters secure clean prepreg offcut with known fibre type and no contamination, which is the input that decides whether output quality is consistent enough to qualify. Competitors entering now must build those relationships against an incumbent already handling the converter's disposal problem for them.
GEN 2 CARBON

Risk: Aerospace production cycle exposure

Feedstock volume tracks aerospace composite conversion rates rather than any independent demand, which means a production downturn cuts input supply exactly when downstream demand may still be growing. Operators discovered this during the last aerospace contraction, when plants built on assumed end-of-life volumes found neither stream arriving as planned.
CARBON CONVERSIONS

Moat: Downstream product form breadth

Producing nonwoven mat, chopped fibre and formatted intermediates rather than loose recovered fibre captures value further along the chain and lets the company serve converters who cannot handle raw recovered material at all. Product form rather than recovery process is where realised value differs most in this industry.
CARBON CONVERSIONS

Risk: Virgin price cycle sensitivity

The commercial argument rests on selling near 52% of virgin chopped fibre pricing, which compresses whenever virgin capacity runs into oversupply and producers discount to fill lines. In those periods recycled material retains only regulatory and brand-driven demand, which is a considerably smaller pool than the cost-driven volume it normally serves.

Players Tracked

Prominent Players

Gen 2 Carbon
Carbon Conversions
Vartega
Carbon Fiber Recycle Industry
Procotex

Other Key Players

Shocker Composites
Fairmat
Alpha Recyclage Composites
Karborek RCF
Mitsubishi Chemical
Toray Industries
Teijin
SGL Carbon
Hexcel
Sigmatex
CarbonTT
Takayasu
Adherent Technologies
Jiangsu Hengshen
Zhongfu Shenying

Recent Developments

MARCH 2026

Aerospace converter contracts prepreg offcut to a single recycler

A large aerospace composite converter contracted its entire prepreg offcut and expired roll stream to one recycler on a multi-year basis, replacing disposal arrangements that had previously cost the converter money. Fibre type and resin system were documented across the whole contracted stream. Disposal arrangements were replaced entirely.
Signal: Clean documented offcut is the feedstock that supports consistent product, and it is being locked up now
OCTOBER 2025

Aligned tape producer qualifies recycled material into semi-structural component

A recycled fibre processor qualified aligned recycled tape into a semi-structural automotive component, recovering enough of the lost composite performance to meet a specification chopped material could not approach. Production volumes remain limited while process cost is assessed against the performance gained. Chopped material could not approach the specification.
Signal: Alignment is the only route recovering lost architecture, and commercial cost rather than feasibility decides it
JANUARY 2026

Wind blade decommissioning yields lower carbon content than projected

A European blade decommissioning programme recovered substantially less carbon fibre than pre-project estimates suggested, since blade construction is predominantly glass with carbon confined to spar caps in larger designs. Disassembly cost per tonne of recovered carbon exceeded planning assumptions considerably. Glass recovery dominated the recovered tonnage instead.
Signal: Blade waste is a glass problem with a carbon fraction, which is not how the opportunity was sized

Feedstock, Furnace Heat and Sorting

Feedstock acquisition and inbound logistics account for roughly 18% of production cost, unusually low because converters often pay to have offcut removed rather than charging for it. Pyrolysis furnace energy carries about 31%, which makes industrial energy price a direct input. Sorting, sizing and post-treatment take around 24%, with the balance in labour, emissions control and quality testing across a process that must document what it produced.
European industrial energy costs rose sharply through 2022 and remained elevated, per IEA reporting for the period, which hit pyrolysis operations harder than most recycling processes because furnace heat dominates their cost base. Several announced European projects were deferred on that basis alone. Virgin carbon fibre pricing moved separately on capacity additions, compressing the price band recycled material occupies at the same time from the other direction.

Exposure divides on feedstock quality and on energy position. A recycler running clean documented offcut spends far less on sorting and rejects less material than one processing mixed end-of-life composite, and that difference compounds through the whole process. Geographically, operations in low industrial energy cost markets hold a structural furnace advantage that no process improvement closes, which is shaping where new capacity is being announced.
recycled-carbon-fiber-market-cost-volatility-analysis-1787594806288

Contract documented feedstock to cut sorting and reject rates

Sorting and post-treatment run around 24% of cost, and mixed end-of-life material inflates both while raising reject rates on top. Clean documented offcut with known fibre type and resin removes most of that work before it starts. Converters currently pay to dispose of offcut, so contracting it costs very little and improves output consistency at the same time.

Site pyrolysis capacity in low industrial energy cost markets

Furnace energy is roughly 31% of production cost, which makes this among the more energy-intensive recycling processes anywhere. Recovered fibre ships economically over long distances, unlike bulkier recovered materials. Siting therefore dominates cost position in a way process efficiency rarely matches, and several European projects were deferred on energy cost alone during the last spike.

Move downstream into formatted product rather than loose fibre

Loose recovered fibre realises far less than nonwoven mat, compounds or aligned tape, and many converters cannot handle raw recovered material at all. Product form is where realised value differs most in this industry, considerably more than recovery route does. Moving downstream also dilutes energy exposure across a higher value output rather than concentrating it.

Portfolio Architecture for Margin Defence

Margin here separates by product form far more than by recovery process, which is not where most operators expected the value to sit. Milled and loose chopped fibre earns margins in the mid teens, because the material is close to interchangeable, converters compare it against virgin chopped pricing directly, and nothing about it is difficult to reproduce. Virgin discounting compresses the band whenever capacity runs long.
Nonwoven mats, veils and compounded pellets do considerably better in the mid twenties to mid thirties, because formatting the material into something a converter can actually run captures value the loose fibre never realises. The range reflects feedstock consistency above everything, since property variation rather than absolute performance is what blocks qualification. Converters unable to handle loose fibre have no alternative to a formatted product.

Aligned tapes and semi-structural intermediates hold the strongest position, reaching into the low forties, because they recover part of the architectural loss and reach applications chopped material cannot serve at any price. Those margins reflect alignment process capability and the clean feedstock it demands rather than any advantage in recovery itself. Clean feedstock is a precondition rather than an advantage here.

Milled and Loose Chopped Fibre

Recovered fibre sold loose or milled against virgin chopped pricing comparisons. The seven point range reflects feedstock cost and energy position rather than product difference, since the material is close to interchangeable.
Gross Margin: 13-20%

Nonwoven Mats and Compounded Pellets

Formatted intermediates that converters can run directly without handling loose recovered fibre themselves. The eleven point range reflects feedstock consistency, since property variation rather than performance is what blocks qualification at a compounder.
Gross Margin: 24-35%

Aligned Tapes and Semi-Structural Forms

Aligned recycled tape and intermediates recovering part of the lost architectural performance. The eleven point range reflects alignment process capability and the clean feedstock quality it requires to work at all.
Gross Margin: 31-42%
recycled-carbon-fiber-market-portfolio-architecture-1787594806786

High-value Sub-segments and Strategic Watch-out

Aligned Recycled Fibre Tapes

High value and the fastest growth at 18.6%, since alignment is the only route recovering part of the gap between 88% fibre strength and 42% composite performance. Commercial cost rather than technical feasibility is the open question. Feedstock consistency is a precondition. Clean offcut is effectively mandatory.
Gross Margin: 33-42%

Compounded Pellets for Injection Moulding

High value and growing at 15.4% into an application where the process chops continuous fibre anyway, making discontinuous material appropriate rather than a compromise. Cost alone wins here without any sustainability argument attached. Automotive brackets, battery enclosure parts and under-bonnet components all take volume on that basis.
Gross Margin: 26-35%

Milled and Loose Chopped Fibre

The volume core, compared directly against virgin chopped pricing where recycled sits near 52%. Nothing about the product is hard to reproduce, and virgin discounting compresses the band whenever capacity runs long. Interchangeability leaves no pricing power anywhere. Recycled sits near 52% of virgin pricing.
Gross Margin: 13-20%

End-of-Life Feedstock Dependence

The strategic watch-out. Blades and airframes arrive mixed, painted and bonded, and the eighteen point range reflects the gap between operators running clean offcut and those processing what decommissioning actually delivers. Design for disassembly helps material arriving in the 2040s rather than anything collected now.
Gross Margin: 6-24%

Qualification Beats Every Price

Demand repeats with every part a converter moulds, tying volume to their production schedule rather than to a purchasing decision made periodically. A recycled grade qualified into a component runs continuously for as long as that part is made, which turns a single qualification into years of consumption. What makes this industry unusual is that qualification hinges on consistency rather than on performance level, since a converter can design around a lower property provided it does not move.
Stickiness follows feedstock control almost exactly. A recycler running contracted documented offcut produces material with stable properties, and a converter who qualified that material will not lightly requalify against a supplier whose input stream is mixed. Formatted products deepen this further, since the converter's process is built around the format. Loose fibre sold on price switches at every order without any friction at all.

The buying function has been widening rather than shifting. Materials engineers decide qualification and always have, weighing property variation above absolute performance. Sustainability and procurement functions arrived more recently, drawn by recovered content reporting and by a material offering around 94% energy saving against virgin production, and they ask different questions in a different order.
recycled-carbon-fiber-market-end-use-penetration-index-1787594807273

Where We Would Focus Effort

These are among the four positions where our research anticipates prominent divergence between winners and laggards over the coming forecast period. Each is grounded in the demand model, the regulatory perimeter, and the announced capacity pipeline.
01 / FEEDSTOCK STREAM CONTROL

Lock the offcut, not the decommissioning story

Around 76% of usable feedstock is clean prepreg offcut and expired roll material with documented fibre type and no contamination, and it is the only stream that supports consistent output quality. End-of-life aircraft and blades arrive painted, bonded and mixed with glass, which is exactly why they remain a minority of tonnage despite dominating the publicity. Converters currently pay to dispose of offcut, so contracting it costs very little and secures the input that decides everything downstream of it in the process.
02 / APPLICATION FIT SELECTION

Sell where discontinuity was going to happen anyway

Injection moulding chops continuous fibre during processing regardless of what went into the hopper in the first place, which makes recovered discontinuous material genuinely appropriate rather than a compromise accepted purely on cost grounds by a buyer. At roughly 52% of virgin chopped pricing it wins that comparison outright without needing any sustainability argument alongside it at all. Chasing structural composite applications instead means competing precisely where 42% composite performance retention is the number that disqualifies the material outright, whatever its price.
03 / ALIGNMENT PROCESS INVESTMENT

Architecture is the whole missing value

Recovered fibre keeps around 88% of tensile strength while a laminate built from it retains roughly 42% of composite performance, and every point of that difference is lost continuity rather than damaged filament. Aligned tape processing recovers a meaningful part of it and grows at 18.6% into applications no chopped grade reaches at any price. The alignment step adds cost the recovered performance must justify, which makes this a commercial judgement rather than a technical question anybody seriously doubts any longer.
04 / COMPARISON SET FRAMING

Compete against glass, not against virgin carbon

A buyer comparing recycled carbon against virgin carbon sees a downgrade and prices it as one, which is how almost every conversation in this industry currently begins. A buyer comparing it against glass fibre sees a stiffness and weight advantage at a premium that is genuinely manageable at around 52% of virgin chopped pricing. That second framing opens applications the first never reaches, and remarkably few recyclers have thought to set the comparison up in that direction from the outset.

Engagement Snapshot From the Field

A live engagement with an industry participant carrying material or product regulatory and market exposure ahead of a defining policy shift, showing how our research translates into a defensible multi-year portfolio strategy.
MARKET MINDS ADVISORY · CLIENT ENGAGEMENT SUMMARY
Recycled Carbon Fiber Producer Strategic Portfolio Review and Transition Roadmap 2026·Investment Scenario on Recycled Carbon Fiber Exposure Evaluation 2025-26
CLIENT PROFILE
A European carbon fibre recycler operating one pyrolysis line with annual revenue near 14 million euros (client-reported, unverified by MMA). Capacity had been sized around anticipated wind blade decommissioning volumes, output was sold mainly as loose chopped fibre, and feedstock was bought on spot terms without any contracted supply arrangements in place with converters or decommissioning contractors.
STRATEGIC CHALLENGE
Blade decommissioning had delivered far less recoverable carbon than the original business case assumed, since blades are predominantly glass, and the plant was running well below capacity on expensive spot feedstock. Management needed to decide whether to pursue decommissioning contracts harder, switch feedstock strategy entirely, or move downstream into formatted product.
MMA APPROACH
MMA quantified recoverable carbon content across regional blade decommissioning against clean converter offcut availability, benchmarked realised prices by product form, costed downstream formatting capability, and assessed feedstock contracting terms available from composite converters currently paying for disposal. Interviews with 47 experts covered composite recycling operations, converter waste handling and compound qualification practice.
KEY FINDINGS
  1. Recoverable carbon per tonne of blade waste was a small fraction of the business case assumption, and disassembly cost per tonne of recovered carbon exceeded the material's realised value outright.
  2. Clean converter offcut was available within the client's collection radius at effectively no material cost, since converters were paying disposal contractors to remove it at the time.
  3. Realised prices for nonwoven mat and compounded pellets ran at roughly double loose chopped fibre, on the same recovered input and the same pyrolysis process.
  4. Property variation rather than absolute performance was blocking qualification at two compounders, and both attributed the variation directly to mixed spot feedstock rather than process control.
CLIENT PROFILE
A European carbon fibre recycler operating one pyrolysis line with annual revenue near 14 million euros (client-reported, unverified by MMA). Capacity had been sized around anticipated wind blade decommissioning volumes, output was sold mainly as loose chopped fibre, and feedstock was bought on spot terms without any contracted supply arrangements in place with converters or decommissioning contractors.
STRATEGIC CHALLENGE
Blade decommissioning had delivered far less recoverable carbon than the original business case assumed, since blades are predominantly glass, and the plant was running well below capacity on expensive spot feedstock. Management needed to decide whether to pursue decommissioning contracts harder, switch feedstock strategy entirely, or move downstream into formatted product.
MMA APPROACH
MMA quantified recoverable carbon content across regional blade decommissioning against clean converter offcut availability, benchmarked realised prices by product form, costed downstream formatting capability, and assessed feedstock contracting terms available from composite converters currently paying for disposal. Interviews with 47 experts covered composite recycling operations, converter waste handling and compound qualification practice.
KEY FINDINGS
  1. Recoverable carbon per tonne of blade waste was a small fraction of the business case assumption, and disassembly cost per tonne of recovered carbon exceeded the material's realised value outright.
  2. Clean converter offcut was available within the client's collection radius at effectively no material cost, since converters were paying disposal contractors to remove it at the time.
  3. Realised prices for nonwoven mat and compounded pellets ran at roughly double loose chopped fibre, on the same recovered input and the same pyrolysis process.
  4. Property variation rather than absolute performance was blocking qualification at two compounders, and both attributed the variation directly to mixed spot feedstock rather than process control.
RECOMMENDED STRATEGY
Phase 1: Phase one: contract clean converter offcut across the collection radius, since it costs almost nothing and directly resolves the property variation blocking qualification. Phase 2: Phase two: add nonwoven and compounding capability, where realised prices run at roughly double loose fibre on identical recovered input. Phase 3: Phase three: treat blade decommissioning as an opportunistic supplement rather than as the basis of any capacity or revenue planning.
OUTCOME
The recycler contracted offcut from four converters during 2026 and reported plant utilisation and property consistency both improving substantially (client-reported, unverified by MMA). Nonwoven capability was commissioned, both stalled compounder qualifications completed, and blade feedstock was reclassified as supplementary. Spot feedstock purchasing was discontinued entirely.

Frequently Asked Questions

Foundational context covering the market sizes, CAGR, scope, country, region and competition that inform every finding below. This section is provided to cover basics and most often pre-purchase conversations, answered from the MMA Primary Research Dataset.

What is the current size of the Recycled Carbon Fiber Market?

MMA sizes it at USD 0.24 billion in 2025, rising to USD 0.27 billion in 2026. The figure covers carbon fibre recovered from composite waste and sold as reinforcement, at recycler selling value.

How large will the Recycled Carbon Fiber Market be by 2036?

USD 0.87 billion by 2036, an incremental USD 0.60 billion over the 2026 base and an expansion multiple of 3.22 times. Aligned tapes account for a disproportionate share of that growth.

What is the CAGR for the Recycled Carbon Fiber Market 2026 to 2036?

12.4% in the base case, with a bull case at 13.6% and a bear case at 11.2%. The spread turns on alignment technology scaling and on virgin carbon fibre pricing.

Which segment is growing fastest?

Aligned recycled fibre tapes at 18.6%, half again the market rate of 12.4%. Alignment recovers part of the composite performance lost when fibre continuity is destroyed.

Who are the major companies in the Recycled Carbon Fiber Market?

Gen 2 Carbon, Carbon Conversions, Vartega, Carbon Fiber Recycle Industry and Procotex lead on recovered fibre capacity. Fifteen further participants are profiled in the full report on that basis.

Which country is growing fastest?

China at 16.2%, as domestic carbon fibre capacity expansion generates prepreg offcut and production waste at volumes that simply did not exist five years ago.

Report Segmentation Architecture

The full report scope spans multiple orthogonal segmentation dimensions, with cross-tabulated demand data provided for each dimension pair. Coverage extends further to regional breakdowns, trend trajectories, and the competitive detail needed to support segment-level decision-making.

By Recovered Product Form

  • Chopped Recycled Fibre
  • Milled Recycled Fibre
  • Nonwoven Mat and Veil
  • Recycled Fibre Pellets and Compounds
  • Aligned Recycled Fibre Tapes
  • Recycled Fibre Papers and Tissues

By End-Use Industry

  • Automotive Components
  • Sporting and Consumer Goods
  • Industrial and Electrical Applications
  • Construction and Infrastructure
  • Marine and Offshore
  • Aerospace Non-Structural Parts

By Commercial Dimension

  • Direct Supply to Compounders
  • Contracted Feedstock Partnerships
  • Distributor and Trading Channels
  • Closed-Loop Converter Agreements
  • Toll Recovery Services
  • Export and Cross-Border Supply

By Region

  • North America
  • Western Europe
  • East Asia
  • South Asia and Pacific
  • Latin America
  • Middle East and Africa
  • Eastern Europe

Scope, Methodology, and Coverage

Every figure in this report is reproducible from documented input assumptions. The scope below maps the historical period, the forecast horizon, the segmentation dimensions, and the countries covered, alongside the underlying primary and qualitative methodology.
Historical Period
2020 to 2025
Forecast Period
2026 to 2036
Base Year
2025 (USD billions; MMA Primary Research Dataset, August 2026)
Market Definition
Carbon fibre recovered from composite waste through pyrolysis, solvolysis or mechanical routes and sold as a reinforcement material, covering chopped and milled fibre, nonwoven mat and veil, pellets and compounds, aligned fibre tapes, and fibre papers and tissues. Measured at recycler selling value across all end-use industries. Virgin carbon fibre, glass and aramid fibre recycling, composite waste sent to energy recovery or landfill, and recovered matrix chemicals are excluded from scope.
Quantitative Units
USD billions (current prices); thousand tonnes recovered fibre; USD per kilogram by product form
Segmentation Dimensions
Recovered product form; end-use industry; commercial dimension; region
Regions Covered
North America, Western Europe, East Asia, South Asia and Pacific, Latin America, Middle East and Africa, Eastern Europe
Countries Covered
Japan, China, South Korea, Taiwan, India, Australia, United States, Canada, Mexico, Germany, United Kingdom, Netherlands, France, Italy, Spain, Austria, Poland, Romania, Brazil, United Arab Emirates
Key Companies Profiled
Gen 2 Carbon, Carbon Conversions, Vartega, Carbon Fiber Recycle Industry, Procotex, Shocker Composites, Fairmat, Alpha Recyclage Composites, Karborek RCF, Mitsubishi Chemical, Toray Industries, Teijin, SGL Carbon, Hexcel, Sigmatex, CarbonTT, Takayasu, Adherent Technologies, Jiangsu Hengshen, Zhongfu Shenying
Quantitative Methodology
Primary survey, n=3,800 respondents, Q4 2025, six countries; demand-side model with trade association cross-validation
Qualitative Methodology
47 expert interviews, Q4 2025; applied to validate demand model assumptions, identify emerging dynamics, and assess competitive positioning
Report Format
PDF and XLSX data workbook (Word format preview document)
Publisher
Market Minds Advisory
Report Code
MMA-2026-CHM-133
Published
August 2026
Contact
sales@marketmindsadvisory.com | www.marketmindsadvisory.com

Purchase the full Recycled Carbon Fiber Market Report (2026 to 2036).

The full report separates fibre property retention from composite property retention and prices the industry against the second figure, which is the distinction most business cases in this field have quietly avoided making. It sizes all six recovered product forms independently through 2036, quantifies feedstock availability by stream with clean offcut separated from end-of-life material, and models recycled pricing against virgin carbon and glass fibre alternatives across capacity cycles. Regional chapters cover all seven regions, following composite conversion waste generation rather than end-market demand. Competitive profiling covers 20 participants on a single capacity basis.
Six recovered product forms sized independently through 2036
Fibre retention separated from composite performance retention
Feedstock streams quantified with offcut separated from decommissioning
Pricing modelled against virgin carbon and glass alternatives
Twenty participants profiled on one consistent capacity basis
Recoverable carbon content assessed across blade decommissioning programmes

Built For The People Who Decide

From boardroom strategy to bench-side execution, this report is read cover-to-cover by leaders shaping the next decade of their industry, turning demand scenarios, market dynamics and valuation benchmarks into decisions.
CXOs/ Presidents/ VPs/ Managers
M&A and Corporate Development
Strategy Teams and R&D Heads
Procurement and Product Directors
Regulatory and Compliance Leaders
Investor Relations and Equity Analysts