Market Minds Advisory
Real-Time Temperature and Location Monitoring Platforms for Cold Chain Market

Real-Time Temperature and Location Monitoring Platforms for Cold Chain Market: Real-Time Cold Chain Monitoring Platforms: Intervention Economics, Device Recovery and Who Actually Reads the Alert

Continuous monitoring only pays when somebody acts on the alert, and fewer than a quarter of excursion warnings currently reach a person with both the authority and the playbook to intervene.

Lead Analyst

Published

September 2026

Make Smarter Decisions with Customized Research Insights

Request a free sample report and evaluate market opportunities, growth trends, and competitive dynamics relevant to your business needs.

2025 MARKET VALUE$2.6BMarket Size 2025
2036 FORECAST VALUE$8.7BBase Case , 2026 to 2036
CAGR 2026 TO 203611.6 %Bull 12.8% / Bear 10.4%
INCREMENTAL OPPORTUNITY$5.8BNet 10- year value creation
EXPANSION MULTIPLE3.00x2036 value over 2026 base
Strategic Levers
M&A Pipeline
Regional Outlook
Country Rankings
Competitive Intelligence
Segmental Deep-dive
Call-Us : 91 93563 13602

Executive Snapshot and Market Trajectory.

Real-time monitoring is sold on the promise of intervention and delivers it about 23% of the time. The rest of the alerts arrive at an inbox nobody watches overnight, or at somebody with no authority to divert a shipment. The device works; the process around it usually does not.
That gap explains the shape of the market. Pharmaceutical and biologic cargo accounts for 64% of value, because only there does a single shipment justify a monitored device and a staffed control tower behind it. Last-mile and direct-to-patient monitoring grows fastest at 17.4%, half again the market rate of 11.6%. Real-time coverage still reaches only 31% of monitored shipments, with the rest reviewed afterwards. Everywhere else the arithmetic simply does not work.
Concentration is moderate at roughly 39% across the top five on measured platform and device revenue, and the commercial problem is unglamorous. Returnable devices come back about 58% of the time, which destroys the economics that reusable programmes were sold on. Whoever solves recovery changes the cost structure more than any sensor improvement would. Whoever solves recovery changes the cost structure more than any sensor could.
Market Definition
This market covers platforms combining monitoring hardware, connectivity and software that report temperature and location of temperature-sensitive goods during transit or storage, spanning in-transit shipment monitoring, facility and storage monitoring, last-mile and direct-to-patient delivery, clinical trial supply, food and perishable retail, and reusable asset and container monitoring. Revenue is measured as device, connectivity and software subscription value. Passive chemical time-temperature indicators, insulated packaging and phase change materials, refrigeration equipment, transport management systems and general freight visibility platforms without temperature capability are excluded.
Base Year Value
$2.6B in 2025 (MMA Primary Research Dataset, September 2026)
Forecast Period
2026 to 2036, eleven discrete annual values
CAGR
11.6% base case. Bull 12.8%. Bear 10.4%.
Fastest Growth Segment
Last-Mile and Direct-to-Patient Monitoring: 17.4% CAGR
Fastest Growth Country
India: 16.4% CAGR
Fastest Growth Region
South Asia and Pacific: 13.8% CAGR
Largest Region
North America: 32% of 2025 global value
Market Leaders
Carrier, Emerson, Controlant, Tive and ORBCOMM lead on measured cold chain monitoring platform revenue. Source: MMA Primary Research Dataset, July 2026.
Primary Survey
n=3,800 procurement and R&D decision-makers, Q4 2025, six countries
Methodology
Demand-side build-up, cross-validated against public data, 47 expert interviews

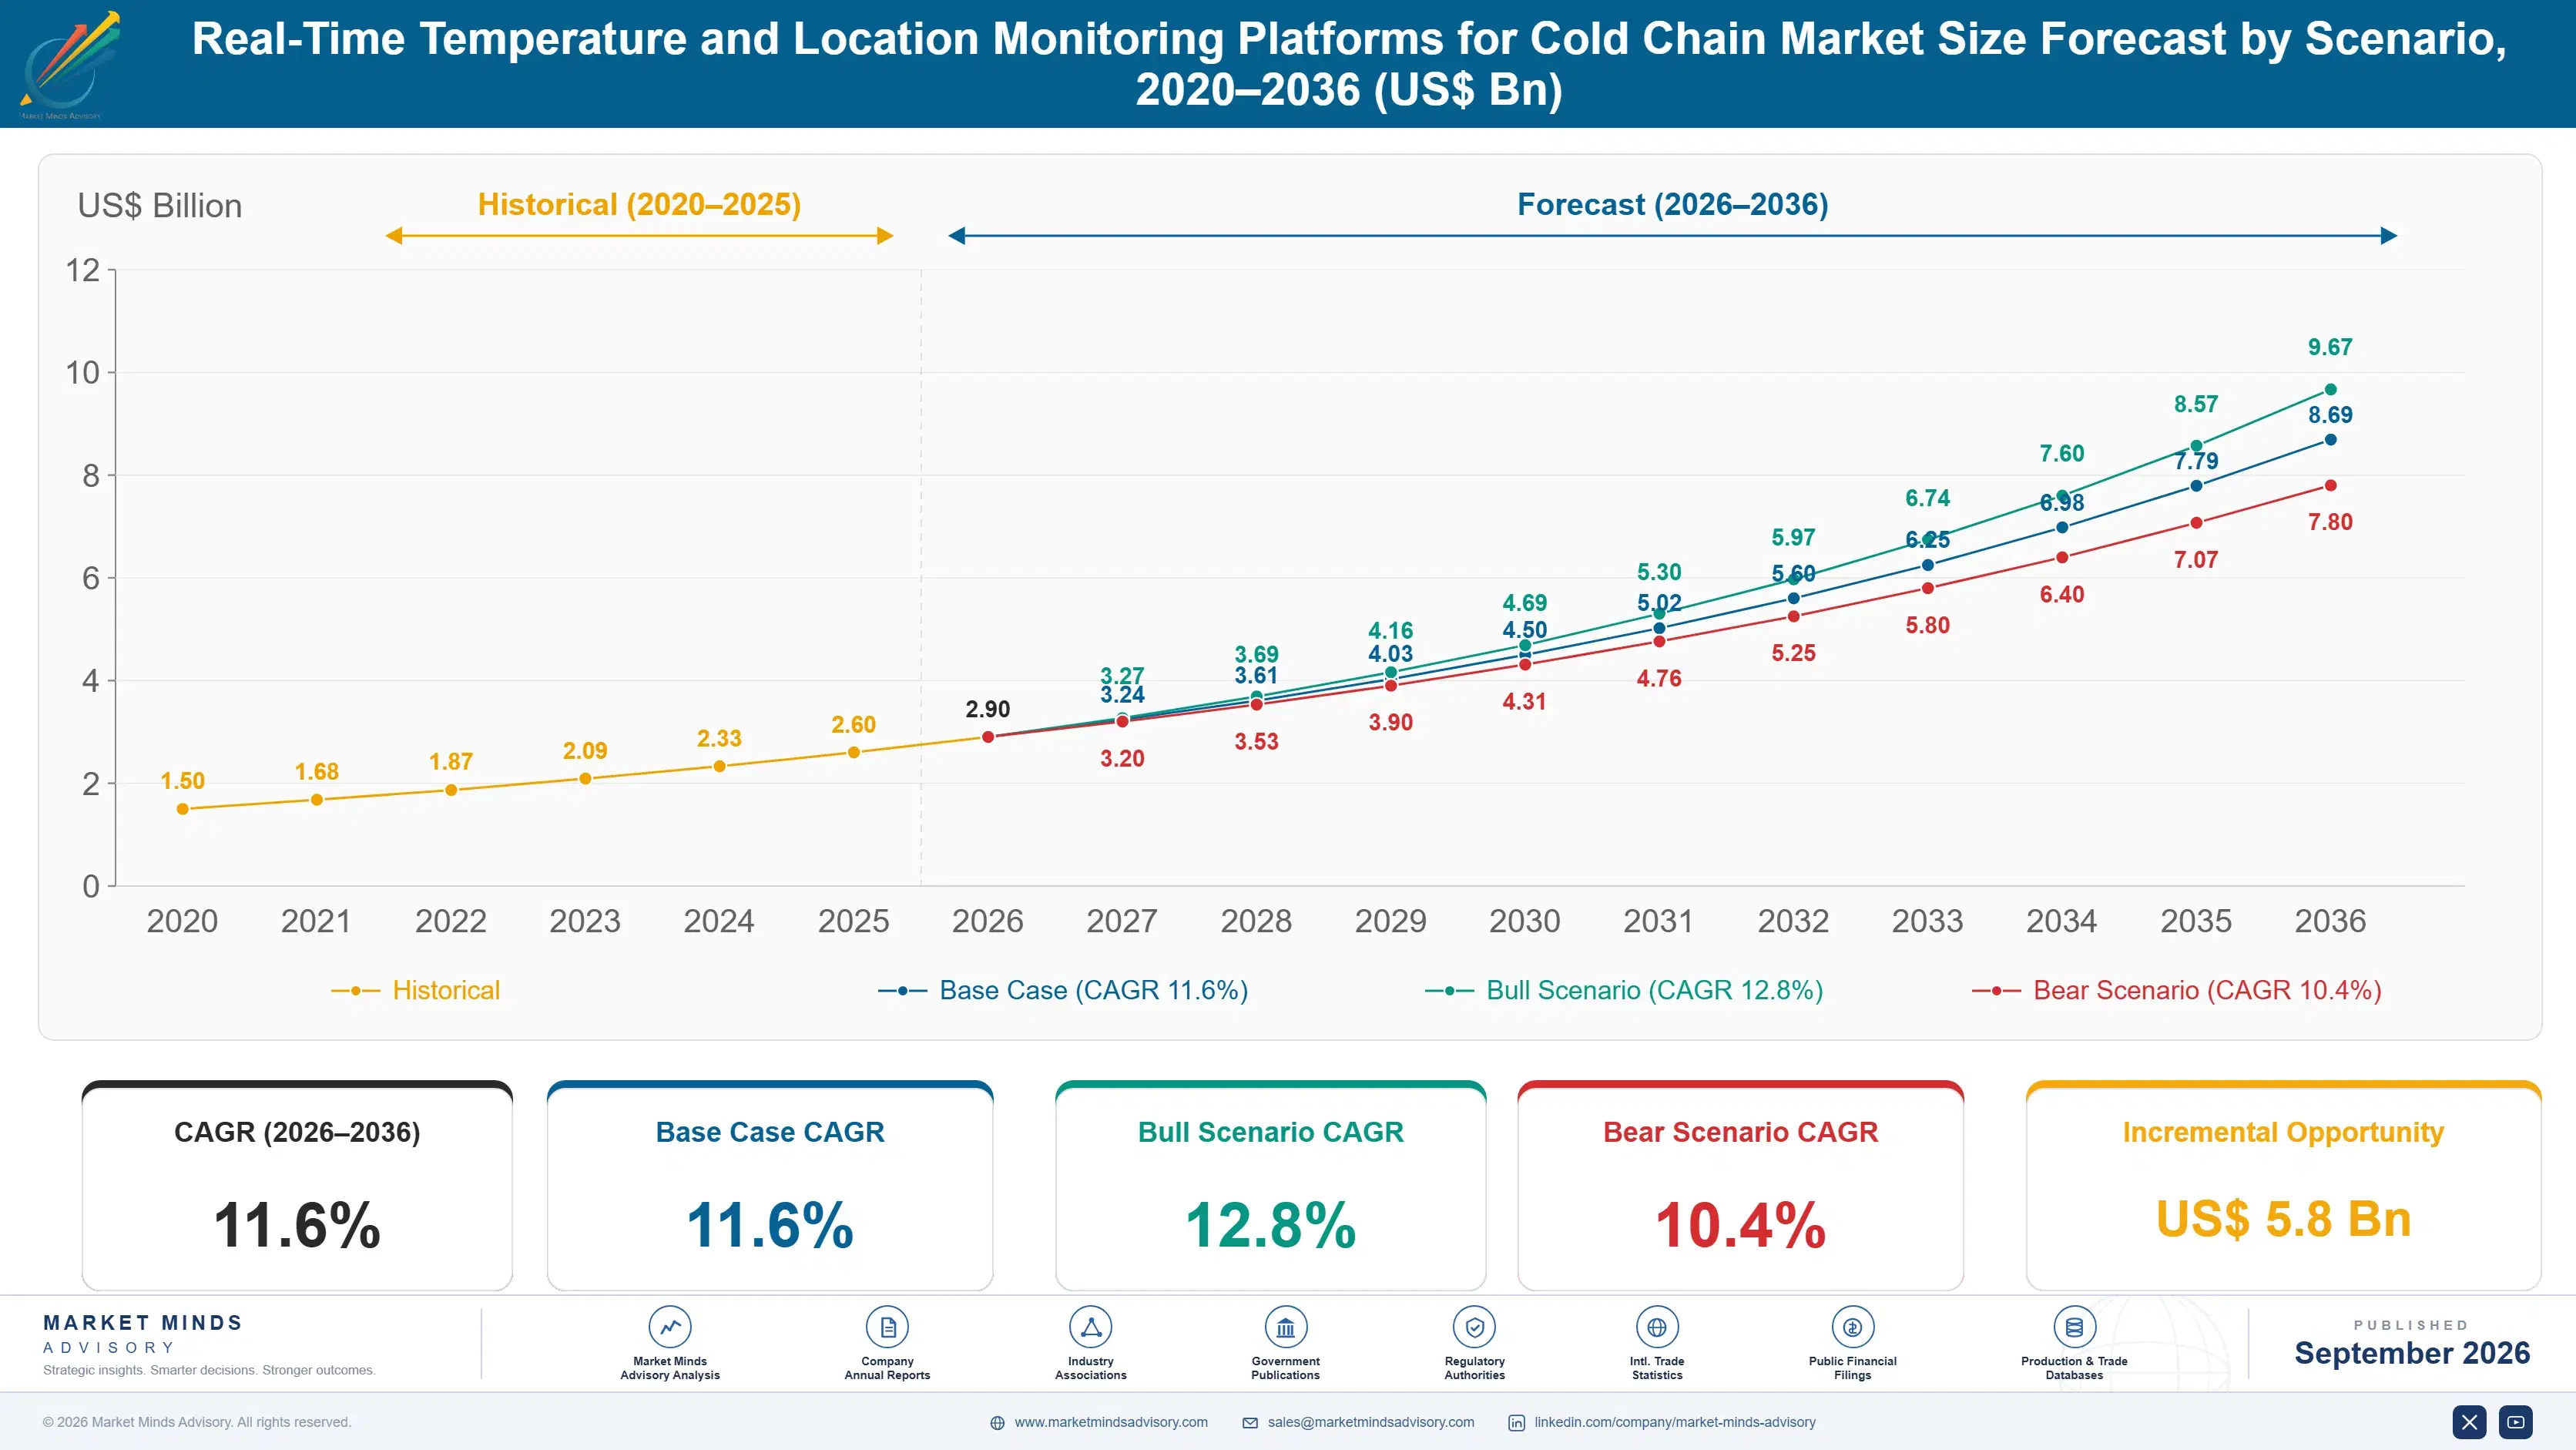
Real-Time Temperature and Location Monitoring Platforms for Cold Chain Market Forecast Scenarios

real-time-temperature-and-location-monitoring-plat-size-forecast-scenario-1788419658243
The 2020 to 2025 period grew at 10.6% and the vaccine programmes of 2021 distorted every year that followed. Emergency distribution created device demand at a scale the industry had never seen, taught a generation of logistics teams what continuous monitoring looked like, then withdrew. Growth through 2023 and 2024 came from pharmaceutical shippers converting pilot experience into standing programmes.
The base case at 11.6% rests on three mechanisms. Biologic and cell therapy shipments carry values where a single loss exceeds a year of monitoring cost, which makes the arithmetic trivial for pharmaceutical shippers everywhere. Distribution practice guidelines across major jurisdictions require documented temperature control through the chain, which converts monitoring from prudence into an audit obligation. Third, direct-to-patient and home delivery of temperature-sensitive medicines is expanding rapidly and cannot rely on facility monitoring at all.
The bull case at 12.8% assumes device costs fall far enough for food and perishable shippers to monitor at case level rather than at vehicle level. The bear case at 10.4% is that shippers conclude real-time adds little over passive logging when only 23% of alerts produce an intervention. That objection is the commonest in evaluations and it is not unreasonable.

Monitoring Is Only Worth What the Response Delivers

A passive logger tells you afterwards whether a shipment was compromised. A real-time device tells you while there is still time to do something, and that difference is the whole commercial argument for the dearer product. It only holds if somebody is watching, has authority to act and knows what to do. Roughly 23% of excursion alerts currently reach such a person, and the remainder produce a record rather than a rescue.
TOP FIVE CONCENTRATION39%Moderately concentrated with a long tail of device specialists
REAL-TIME DEVICE SHARE31%Shipments monitored continuously rather than simply reviewed afterwards
REUSABLE DEVICE RETURN RATE58%Proportion of returnable monitors recovered after a shipment
ALERT RESPONSE RATE23%Excursion warnings that reach someone able to act
PHARMA SHARE OF VALUE64%Portion of spending attributable to pharmaceutical and biologic cargo
AVERAGE DEVICE COSTUSD 54Typical unit price for a single-use cellular monitor
The economics work in pharmaceuticals and almost nowhere else. A single biologic or cell therapy shipment can be worth more than a shipper's entire annual monitoring budget, so a device costing around USD 54 needs no business case. Pharmaceutical and biologic cargo accordingly accounts for 64% of value. Food shippers face the opposite arithmetic, monitoring at vehicle or pallet level since per-case devices cost more than the produce.
The unglamorous problem is device recovery. Reusable monitors were meant to spread hardware cost across many shipments, and roughly 58% of them actually come back. The rest sit in consignee warehouses or bins, and the missing 42% ruins a case built on ten uses per device. Suppliers offer prepaid returns, deposits and incentives, none of which has fixed it.
"Everybody sells the sensor and nobody sells the answer to the two questions that decide whether this works: who reads the alert at two in the morning, and how does the device get back. Solve those and the technology is almost incidental."
Director, Supply Chain Visibility and Cold Chain Practice · MMA Technology Practice · September 2026

Market Trends

Monitored Control Towers Replace Alert Delivery as the Product

Suppliers spent a decade improving sensors and notification, and buyers eventually noticed that a message arriving at three in the morning changes nothing on its own. The response has been staffed monitoring services where the supplier watches shipments, escalates against an agreed playbook and arranges intervention, rather than simply raising an alert. Response rates rise from 23% to well above half where such a service operates. It converts a hardware transaction into a subscription with genuine service content, and it is the clearest way suppliers have found to escape device price comparison.
Market Impact: Pharma holds 64% of value
Single-Use Devices Displace Reusable Programmes in Pharmaceuticals

Reusable monitors promised low cost per shipment across many uses, and roughly 58% return rates undermined that arithmetic completely. Pharmaceutical shippers have increasingly moved to single-use cellular devices at around USD 54, accepting a higher per-shipment cost in exchange for removing recovery logistics, cleaning, recalibration and the administrative burden of chasing consignees. The switch also removes calibration disputes during audits. Food and lower-value shippers cannot absorb single-use economics and remain committed to reusable programmes, which keeps the recovery problem alive in exactly the segment least able to manage it. Recovery is an operations problem nobody has solved.
Market Impact: Applies across 3 major jurisdictions

Market Opportunities and Growth Drivers

Biologic Shipment Values Make the Business Case Trivial

Cell therapies, personalised medicines and high-value biologics travel in consignments where a single loss can exceed a shipper's entire annual monitoring spend, which removes any need to justify a device costing tens of dollars. Pharmaceutical and biologic cargo accounts for 64% of market value for exactly this reason. The arithmetic also supports staffed monitoring, redundant devices and intervention logistics that no other cargo type could fund. As the therapy pipeline shifts further toward biologics and away from small molecules, that share rises rather than dilutes. Nobody asks for a business case on these consignments.
Market Impact: Only 23% of alerts actioned

Distribution Practice Guidelines Require Documented Temperature Control

Good distribution practice expectations across major jurisdictions require documented evidence that medicines remained within specification throughout the chain, including during transport handovers where responsibility is least clear. Inspectors examine records rather than intentions, and gaps between custody transfers are a common finding. Air cargo certification schemes covering pharmaceutical handling impose comparable documentation requirements on carriers and ground handlers. That makes monitoring an audit obligation with a named owner rather than a risk management preference, which changes how reliably it gets funded. Audit findings rather than losses are what release the budget for it. Ownership is named explicitly.
Market Impact: Loses 42% of returnable devices

Market Restraints and Challenges

Alerts Reach Nobody Who Can Act on Them

Only about 23% of excursion alerts reach a person with the authority, information and playbook to intervene, which undermines the entire premise of paying more for real-time capability. The root cause is organisational rather than technical: shipments move outside working hours, responsibility sits with a carrier rather than the shipper, and no one has agreed in advance what an intervention actually looks like. Suppliers mitigate through staffed monitoring services, escalation contracts with carriers and pre-agreed response playbooks, all of which cost more than the device. The organisational work costs more than the technology.
Market Impact: Lifts response rates above 50%

Device Recovery Undermines Reusable Programme Economics

Returnable monitors are priced on the assumption of eight to ten uses and come back roughly 58% of the time, which makes real cost per shipment far higher than any proposal shows. The root cause is that the consignee bears the effort of returning a device and receives no benefit whatsoever from doing so. Commercially this has pushed pharmaceutical shippers toward single-use hardware. Mitigation attempts include prepaid packaging, deposit refunds, consignee incentive payments and reverse logistics partnerships, and none has moved recovery rates decisively. The consignee has no reason at all to help, which is the root of it.
Market Impact: Return rates stall near 58%
3 additional market trends, 4 additional growth drivers, and 2 additional restraints and challenges are covered in the full report. Contact sales@marketmindsadvisory.com to access the complete intelligence.

Segment CAGR and Growth Architecture

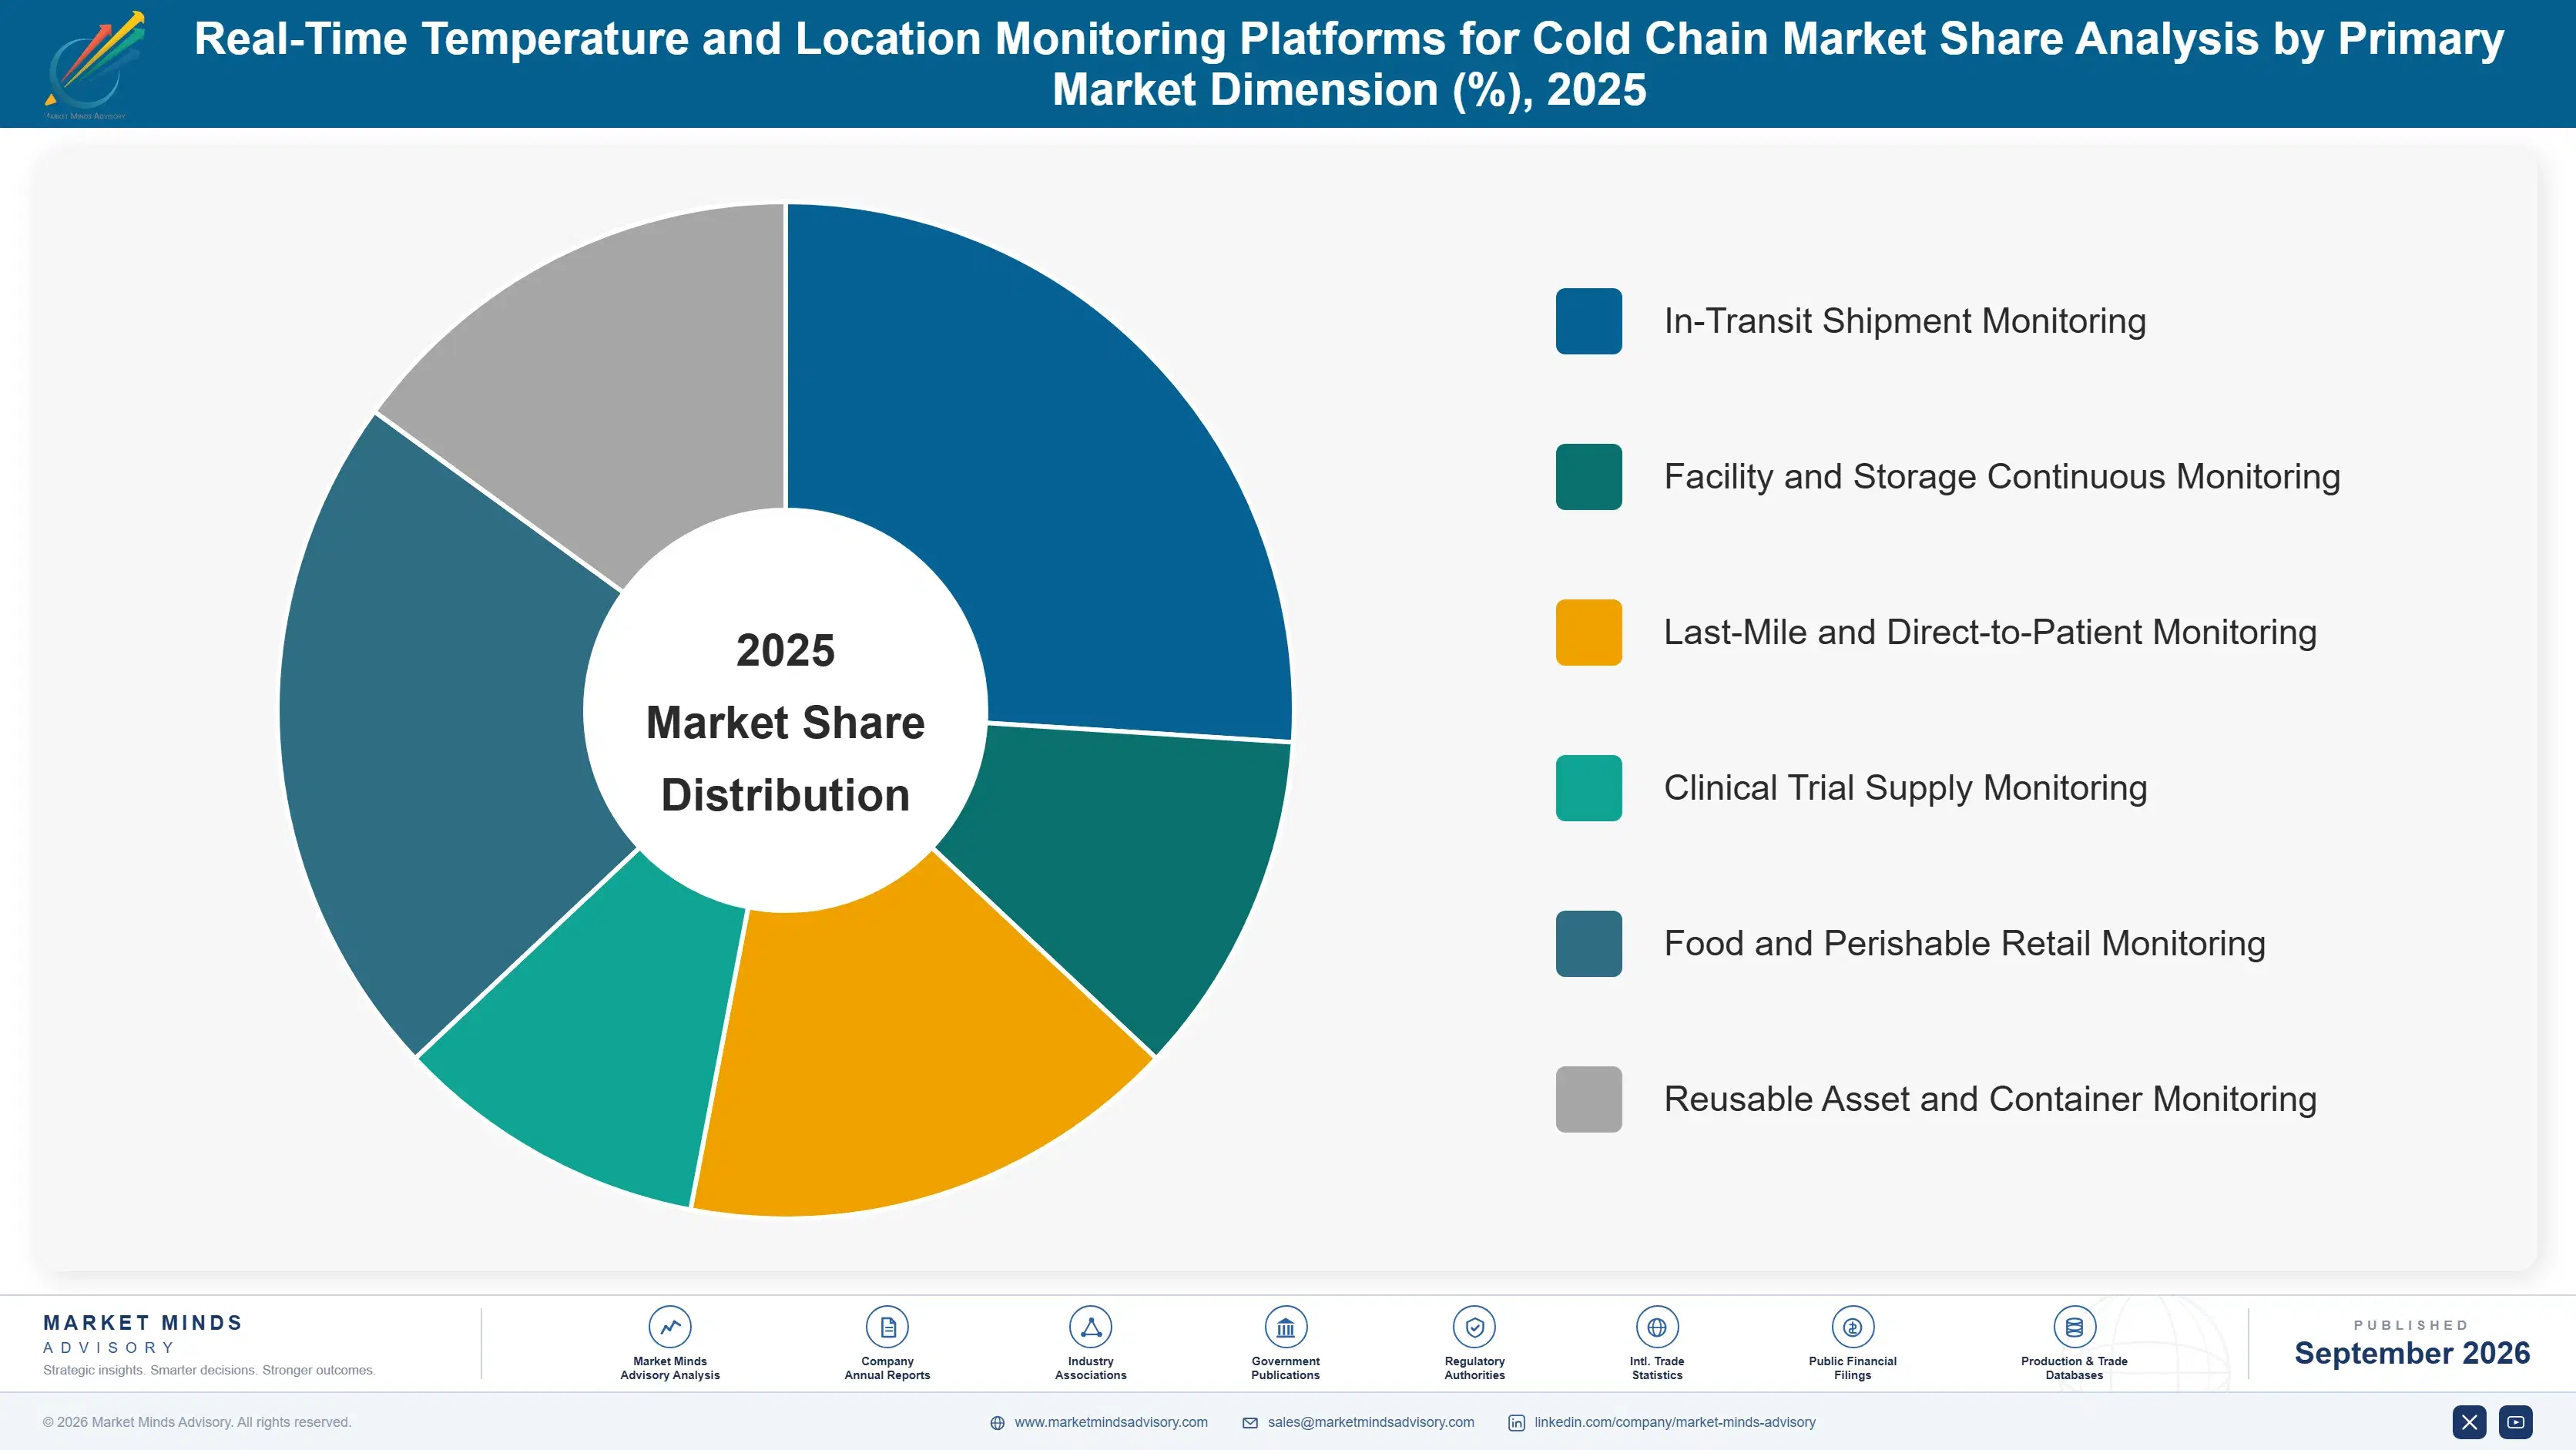
Segmentation follows where monitoring is deployed, because the deployment context determines cargo value, who owns the response and whether device economics work at all. High-value pharmaceutical contexts support staffed intervention and single-use hardware, while food and retail contexts cannot, and that divide governs nearly all the growth variance here. The economics differ entirely between them.
real-time-temperature-and-location-monitoring-plat-market-share-analysis-1788419658824

Last-Mile and Direct-to-Patient Monitoring

The final leg is the fastest growing part of this market at 17.4%, half again the market rate of 11.6%, and it is also where excursion risk concentrates. Home delivery of temperature-sensitive medicines, decentralised clinical trial supply and specialty pharmacy fulfilment all move product to addresses with no monitored storage, no trained receiver and no reliable handover record. Buyers here value courier integration and delivery confirmation far more than sensor precision, since the failure mode is a package left on a doorstep rather than a refrigeration fault. Device cost matters more than in freight applications because consignment values are lower, and recovery is effectively impossible, which pushes the segment firmly toward single-use hardware.
CAGR 17.4%

Clinical Trial Supply Monitoring

Trial supply monitoring grows at 15.6% on requirements that have little to do with product value and everything to do with data integrity. An investigational medicine that experienced an undocumented excursion may invalidate a participant's data, which is expensive in a way that replacing the vial is not. Sponsors therefore monitor comprehensively and retain records for years, and the documentation burden exceeds anything in commercial distribution. Decentralised trial designs shipping directly to participants have expanded the segment considerably and complicated it, since the receiving location is a home rather than a site with trained staff. Retention obligations run for years after a trial closes, which creates software and storage revenue long after the shipments themselves have stopped. Sponsors rarely negotiate.
CAGR 15.6%
Full segment breakdown across 6 segments available in the complete report.

Regional Architecture and Country Demand Map

Demand follows the value of what moves rather than the volume, which concentrates it wherever biologics are manufactured, distributed and dispensed. Food cold chain volumes are far larger and generate a fraction of the monitoring spend, because per-case economics do not work there. Value rather than tonnage sets the spending.

North America

North America leads at 32% for a reason that is genuinely about product mix rather than geography: the region ships and dispenses more high-value biologics, cell therapies and specialty medicines than anywhere else, and those are the consignments whose value justifies continuous monitoring outright. Specialty pharmacy and home infusion networks have expanded direct-to-patient delivery faster than any other market. Clinical trial sponsors headquartered here monitor globally from domestic operations, which places the spending in the region regardless of where shipments travel. Food cold chain here monitors at vehicle and facility level rather than per case, contributing volume without much value. Regional growth at 10.8% is modest because the base is mature and monitoring is already standard across high-value pharmaceutical distribution.
Share: 32% | CAGR: 10.8% (2026 to 2036)

Western Europe

European demand rests on distribution practice expectations that inspectors actively enforce, which makes documented temperature control an audit obligation rather than a commercial choice. German, Swiss and Irish pharmaceutical manufacturing concentrates high-value outbound shipping in a small number of corridors, and monitoring density there is the highest anywhere. Nordic and Dutch food retailers apply monitoring further down the chain than their peers elsewhere, partly on waste reduction grounds. Cross-border movement within the region creates handover points where custody and responsibility become unclear, and those gaps are the most common inspection finding across the market. Regional growth at 10.0% is the slowest of any large market, since compliance monitoring is already near-universal here.
Share: 25% | CAGR: 10.0% (2026 to 2036)
Regional intelligence for 5 additional markets available in the complete report: East Asia, South Asia and Pacific, Latin America, Middle East and Africa, Eastern Europe. Contact sales@marketmindsadvisory.com.
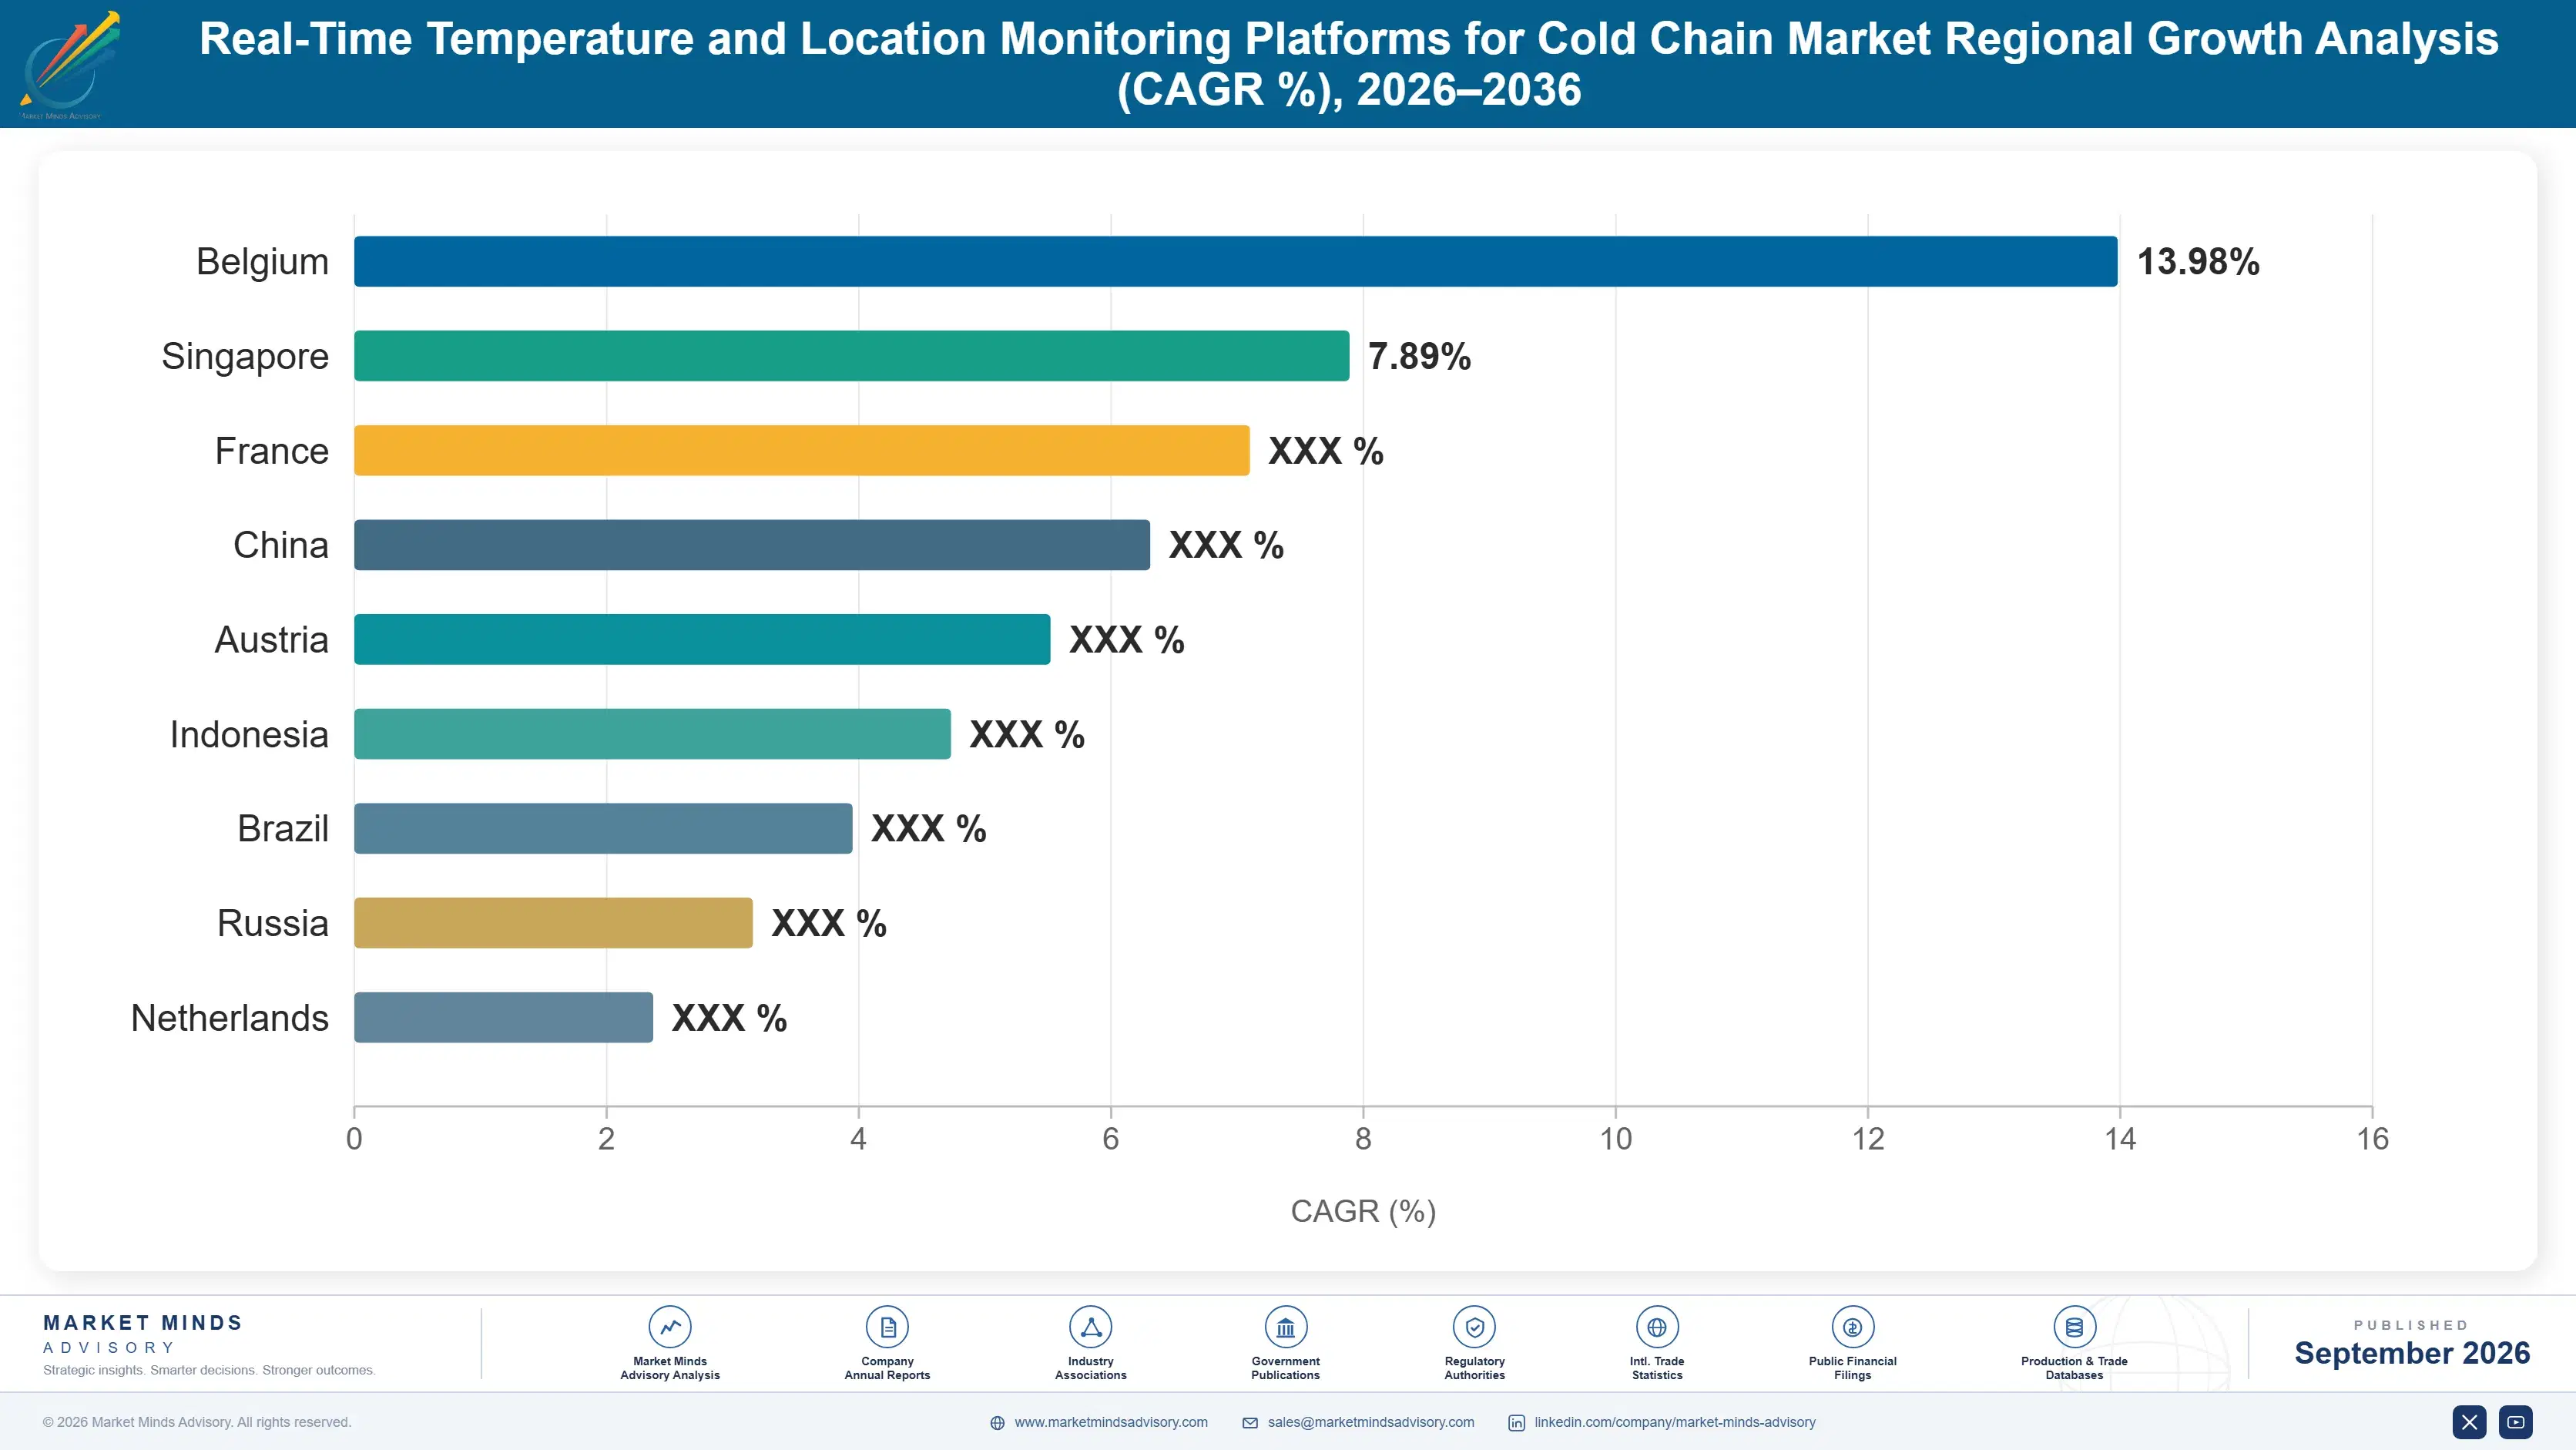
real-time-temperature-and-location-monitoring-plat-country-cagr-analysis-1788419659359

Where Cold Chain Monitoring Earns Margin

Devices are converging on commodity pricing and connectivity is a pass-through cost, so margin has to come from the response layer, the segments where cargo value removes price sensitivity, and from solving a recovery problem that every competitor has quietly given up on. Devices themselves have stopped being a business worth defending on their own.

Sell the Monitored Response Not the Alert

An alert that reaches nobody produces a record rather than a rescue, which is why only 23% of excursions currently result in any intervention. Suppliers operating staffed monitoring with agreed escalation playbooks lift that above half and charge roughly 5 times the device-only price for the same shipments. The service content is real and so is the cost, but it removes the supplier from hardware price comparison entirely. Buyers who have suffered a loss buy this without much negotiation, and buyers who have not remain difficult to convince. Losses convert buyers faster than any demonstration.
Market Impact: Charges roughly 5 times the device-only price level

Concentrate on Cargo Where Value Removes Price Sensitivity

Pharmaceutical and biologic cargo is 64% of market value because a single consignment can exceed an entire annual monitoring budget, which makes device cost an irrelevance rather than a negotiation. Food and general perishable shippers face the reverse arithmetic and will grind price on every unit. Suppliers concentrating engineering and sales effort on high-value cargo achieve gross margins roughly 22 percentage points above those chasing food volume. The temptation to pursue food volumes for scale has damaged more suppliers in this market than any competitive loss has. Scale pursued through food has cost more suppliers than competitors have.
Market Impact: Holds 22 further points of gross margin overall

Fix Device Recovery or Abandon Reusable Models

Returnable devices are priced on eight to ten uses and come back roughly 58% of the time, which means real cost per shipment is far above what any proposal shows. Suppliers that either solved recovery through consignee incentives and reverse logistics partnerships, or moved decisively to single-use hardware, are profitable. Those still running reusable programmes on optimistic recovery assumptions are quietly subsidising customers. This is an operations problem rather than a technology one, which is precisely why so few suppliers have properly addressed it. Reusable programmes on optimistic assumptions subsidise the customer quietly.
Market Impact: Recovers the missing 42% of all returnable hardware

Integrate With Couriers Before Selling Last Mile

Last-mile and direct-to-patient monitoring grows at 17.4% and fails without courier cooperation, because the failure mode is a package left at a door rather than a refrigeration fault. Suppliers holding delivery status integration with the couriers a customer actually uses win these accounts on capability that sensor specifications never address. Building those integrations is slow, unglamorous and specific to each market. It is also the clearest barrier available in the fastest growing segment of this market, and very few suppliers have completed the work. Sensor specifications never address the actual failure mode here.
Market Impact: Serves a segment now growing at 17.4% annually

Who Controls the Margin Pool

Concentration sits near 39% across the top five on measured platform and device revenue, with a long tail of device specialists competing on hardware price and a smaller group selling monitoring as a service. The gap between leaders and challengers is one of service infrastructure and carrier relationships rather than sensor capability, since temperature and location measurement is not difficult and hardware differences are narrow.
Competition runs on three dimensions. Response capability is first and increasingly decisive, because buyers have learned that an alert nobody actions is worth little. Second is integration depth with carriers, couriers and customer quality systems, which determines whether monitoring data reaches anywhere useful. Third is connectivity coverage across the routes a customer actually ships, where roaming arrangements and transmission restrictions in some markets create real differences.

Two pressures are reshaping positions. Device prices are falling toward commodity levels as cellular modules cheapen, which removes hardware margin and rewards suppliers who moved to service revenue early. Meanwhile logistics providers and air carriers are bundling monitoring into freight services, reaching the shipper before any specialist does. Rankings will move toward suppliers with staffed response operations and courier integration.
real-time-temperature-and-location-monitoring-plat-company-positioning-matrix-1788419659889

Competitive Moat and Risk Dimensions

CARRIER

Moat: Refrigeration and monitoring integration

Carrier reaches cold chain customers through refrigeration equipment already installed in their vehicles and facilities, which places monitoring alongside the assets it observes rather than as a separate purchase. Its Sensitech position carries decades of pharmaceutical qualification history and validation documentation that new entrants cannot replicate quickly. Global service infrastructure supports device logistics and calibration where specialists use distributors.
CARRIER

Risk: Hardware-led commercial model

The company's position was built on devices and calibration services rather than on staffed monitoring response, which is where buyer value is moving as alert action rates draw attention. Competitors selling monitoring as an operated service reach a different budget and escape device price comparison. Adapting means building continuous operations capability an equipment business has no reason to hold.
CONTROLANT

Moat: Operated monitoring service model

Controlant sells monitoring as an operated service with staffed oversight rather than as hardware with notifications, which addresses the response gap directly and prices on outcomes rather than devices. Large pharmaceutical distribution programmes gave it operating experience at scale that few competitors hold. Managed reverse logistics gives its reusable model recovery performance well above industry norms.
CONTROLANT

Risk: Reusable device recovery dependence

The economics depend on devices returning reliably, and industry recovery averages near 58% show how fragile that assumption becomes outside tightly managed programmes. Competitors moving to single-use hardware avoid the problem entirely at higher per-shipment cost. Concentration in large pharmaceutical accounts also means the loss of any single programme would be difficult to replace at comparable scale or margin.

Players Tracked

Prominent Players

Carrier
Emerson
Controlant
Tive
ORBCOMM

Other Key Players

SpotSee
Berlinger
ELPRO-BUCHS
DeltaTrak
Roambee
Copeland
Zebra Technologies
Testo
Monnit
Logmore
Blulog
Varcode
Hanhaa
Frigga
Sensire

Recent Developments

JUNE 2025

Air cargo pharmaceutical certification requirements extended to more handling stages

Updated certification criteria for pharmaceutical air cargo handling extended documentation expectations across additional ground handling and transfer stages, addressing custody gaps that inspections had repeatedly identified. Carriers were given a transition period rather than immediate compliance obligations under the revised scheme. Documentation expectations were tightened rather than relaxed.
Signal: Handover points remain where excursions happen and where monitoring evidence is weakest, which is now being addressed directly.
FEBRUARY 2025

Pharmaceutical shippers accelerate migration from reusable to single-use monitors

Several large pharmaceutical distributors shifted standing programmes toward single-use cellular devices, citing recovery rates, calibration administration and audit simplicity rather than any device performance concern. The transitions were procurement decisions rather than acquisitions or supply arrangements between the parties involved. Per-shipment cost rose in every case examined.
Signal: Recovery economics rather than technology is what is reshaping device choice across the most valuable part of this market.
SEPTEMBER 2025

Logistics providers bundle temperature monitoring into freight service offerings

Established freight forwarders and integrators added temperature and location monitoring to pharmaceutical service products at bundled pricing, using devices licensed from specialist suppliers rather than developed internally. The offerings target shippers who had not previously monitored consignments at all. Pricing was set well below specialist programme levels.
Signal: Bundling reaches the shipper before any specialist does, which compresses pricing while expanding total monitored volume.

What a Monitored Shipment Costs

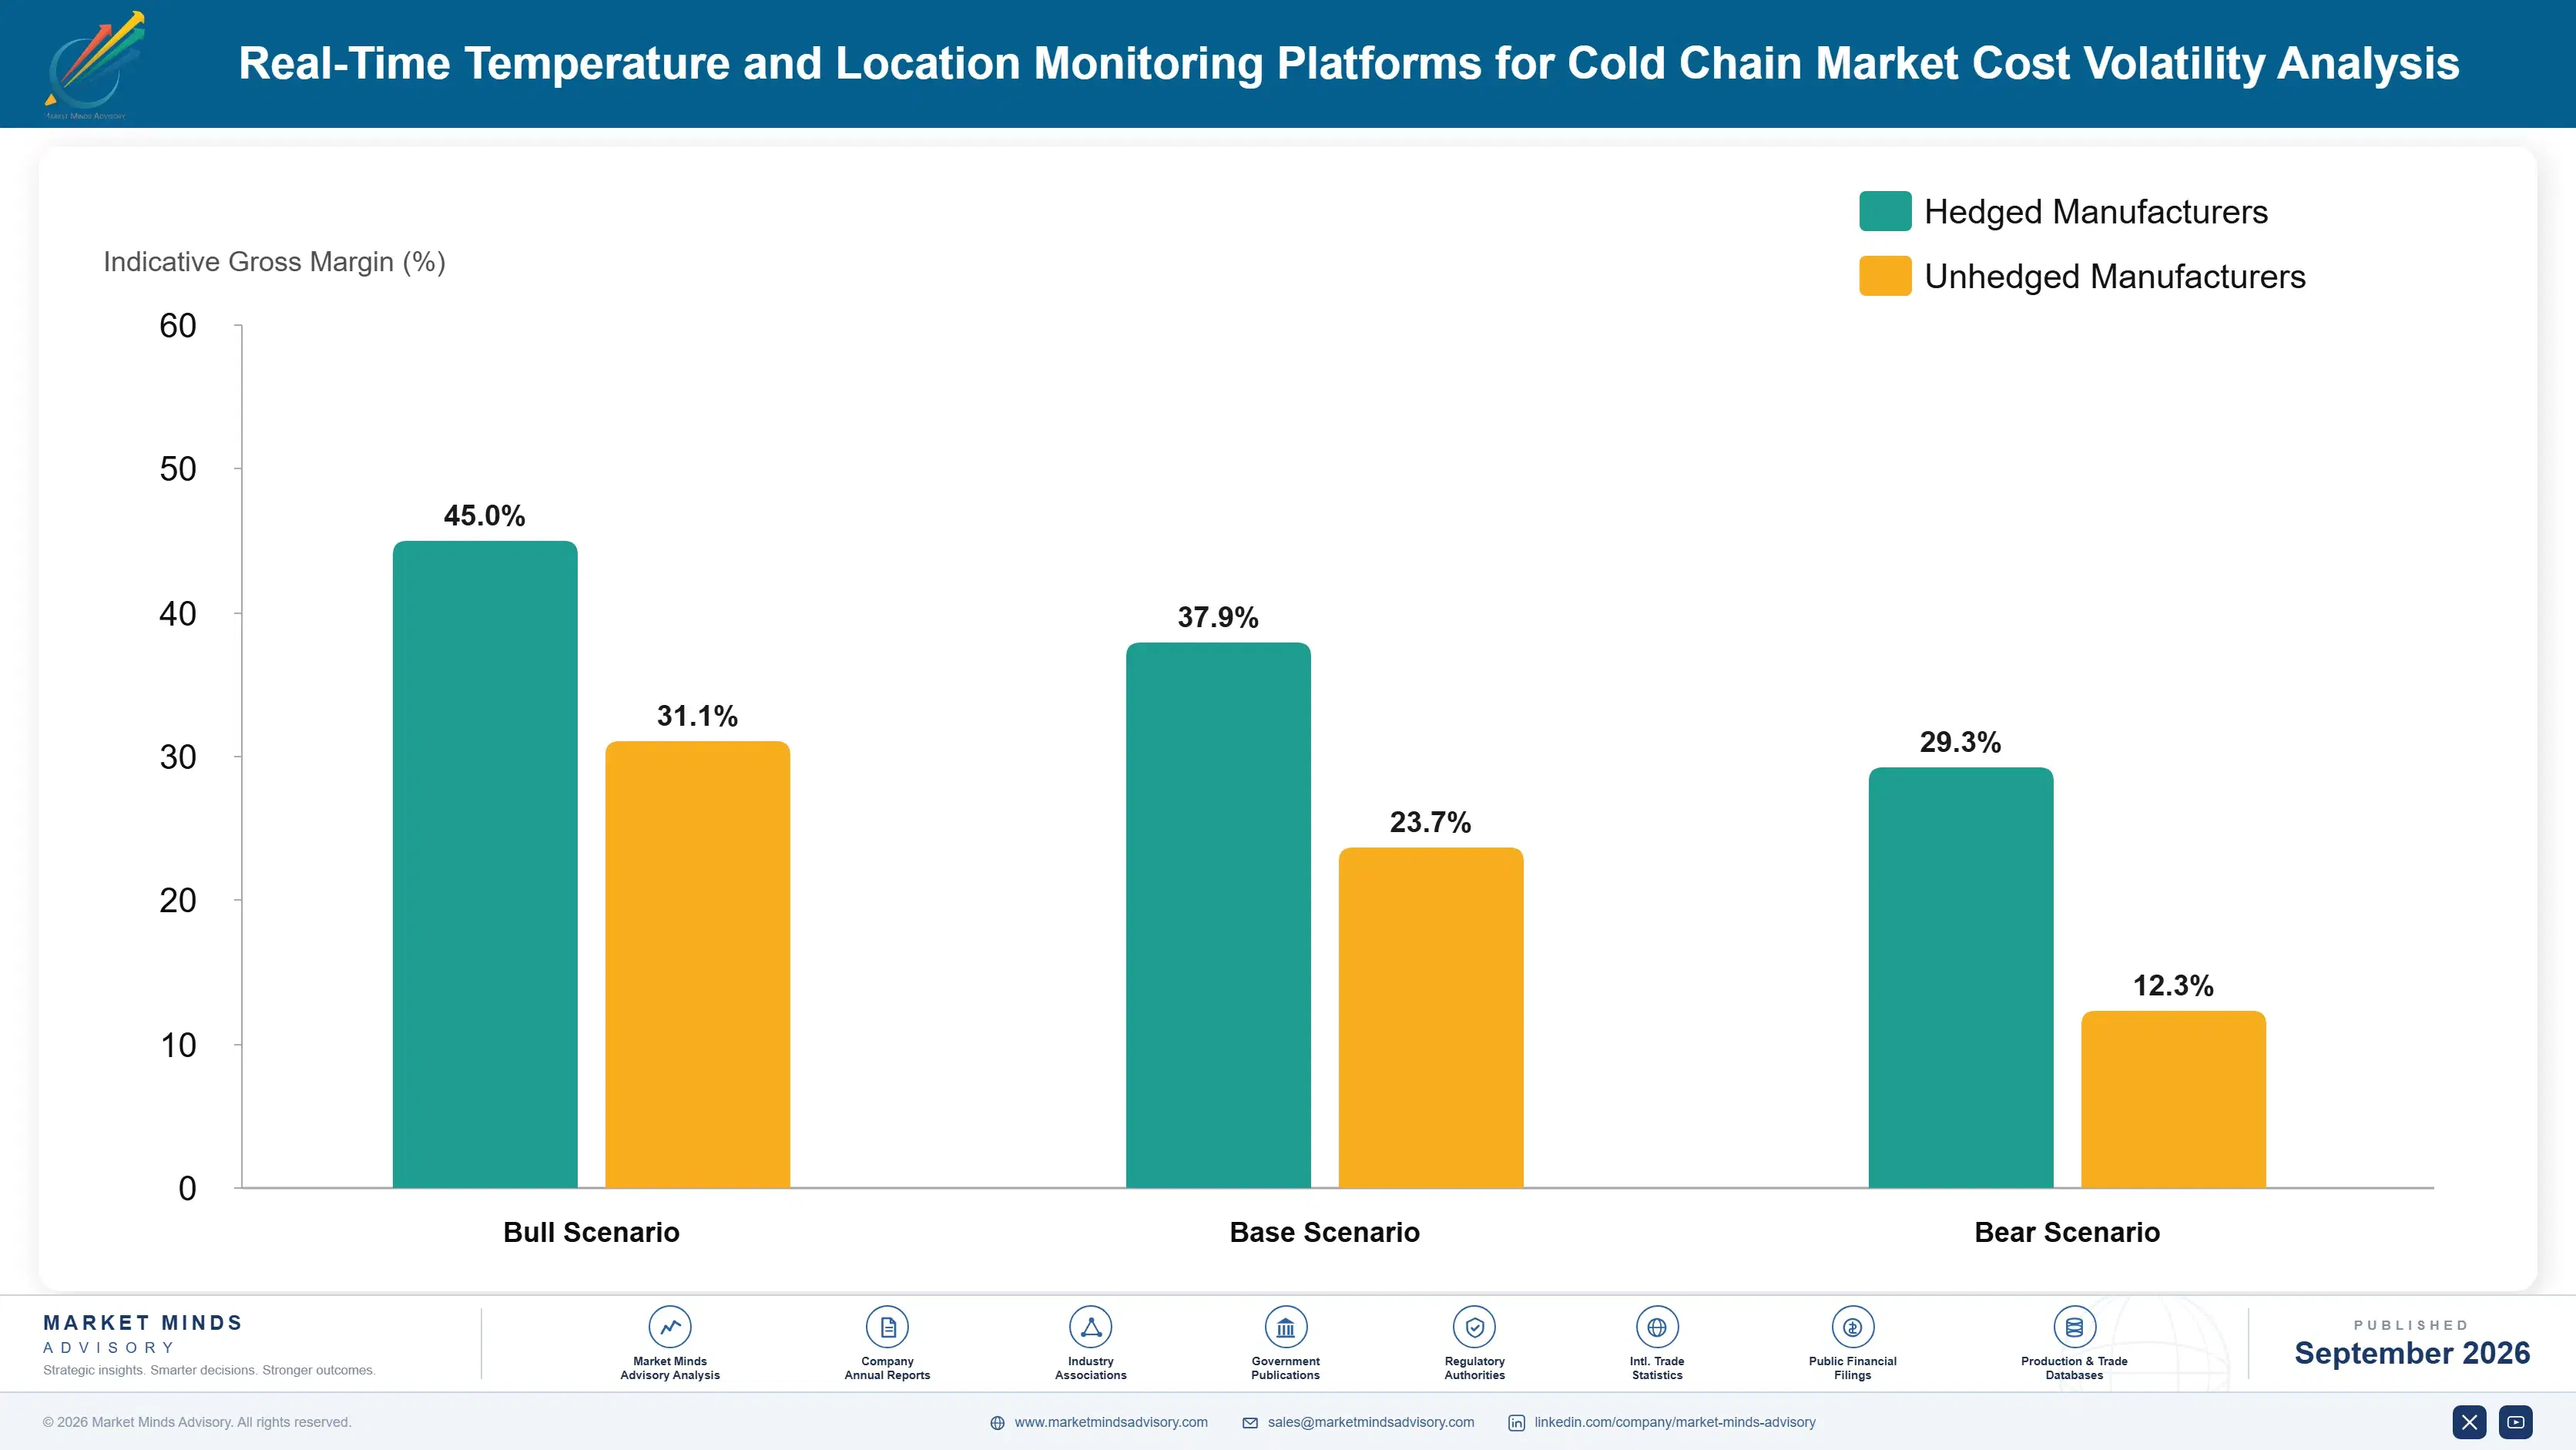
Device hardware dominates cost in single-use models and recedes in service ones. Across the market, sensor and electronics content runs between 29% and 41% of cost of goods, the range reflecting cellular against simpler logging designs. Primary cells add roughly 11%, connectivity and roaming 14%, enclosure and assembly 9%, and calibration and reverse logistics the balance. Monitoring operations labour sits outside cost of goods entirely.
Battery and connectivity costs have moved most. Lithium primary cell pricing followed the wider lithium market through 2024 and 2025, and IEA critical minerals and battery reporting documents the underlying movement. Retirement of older cellular networks also forced redesigns onto low-power wide-area technologies, lowering running cost and requiring field requalification. Carrier and Emerson both referenced component cost pressure in recent annual reporting. Redesign cost had been provisioned nowhere.

Exposure varies by commercial model rather than scale. Suppliers selling devices outright pass component cost through at each order and carry little risk. Those running reusable programmes carry hardware on their own balance sheet and absorb every device that fails to return, which turns the recovery problem into a financing one. Operated service suppliers carry monitoring staff as fixed cost, which rewards volume and punishes programme losses.
real-time-temperature-and-location-monitoring-plat-cost-volatility-analysis-1788419660083

Design for low-power wide-area connectivity from the outset

Devices built around older cellular technologies required redesign and field requalification when networks retired, at cost nobody had provisioned for. Designing onto low-power wide-area standards from the start cuts running connectivity cost by roughly 45% and extends battery life considerably. The complication is coverage, which remains uneven on some international routes, so dual-mode designs are usually necessary rather than optional.

Charge deposits on returnable devices rather than incentivising returns

Consignee incentive payments have never moved recovery rates far, because the person who must return a device is rarely the person receiving the payment. Deposits charged against the shipment and refunded on return shift the obligation to the party controlling the outcome. Buyers dislike the friction, which is why suppliers avoid the only structure that works.

Price monitoring operations per shipment not per subscription

Staffed monitoring is a fixed cost that must be carried whether shipments flow or not, and suppliers with subscription pricing absorb the whole variance when a customer programme slows. Per-shipment pricing aligns revenue with the activity that generates cost. Large customers resist because subscriptions are easier to budget, making this a negotiation about risk allocation.

Portfolio Architecture for Margin Defence

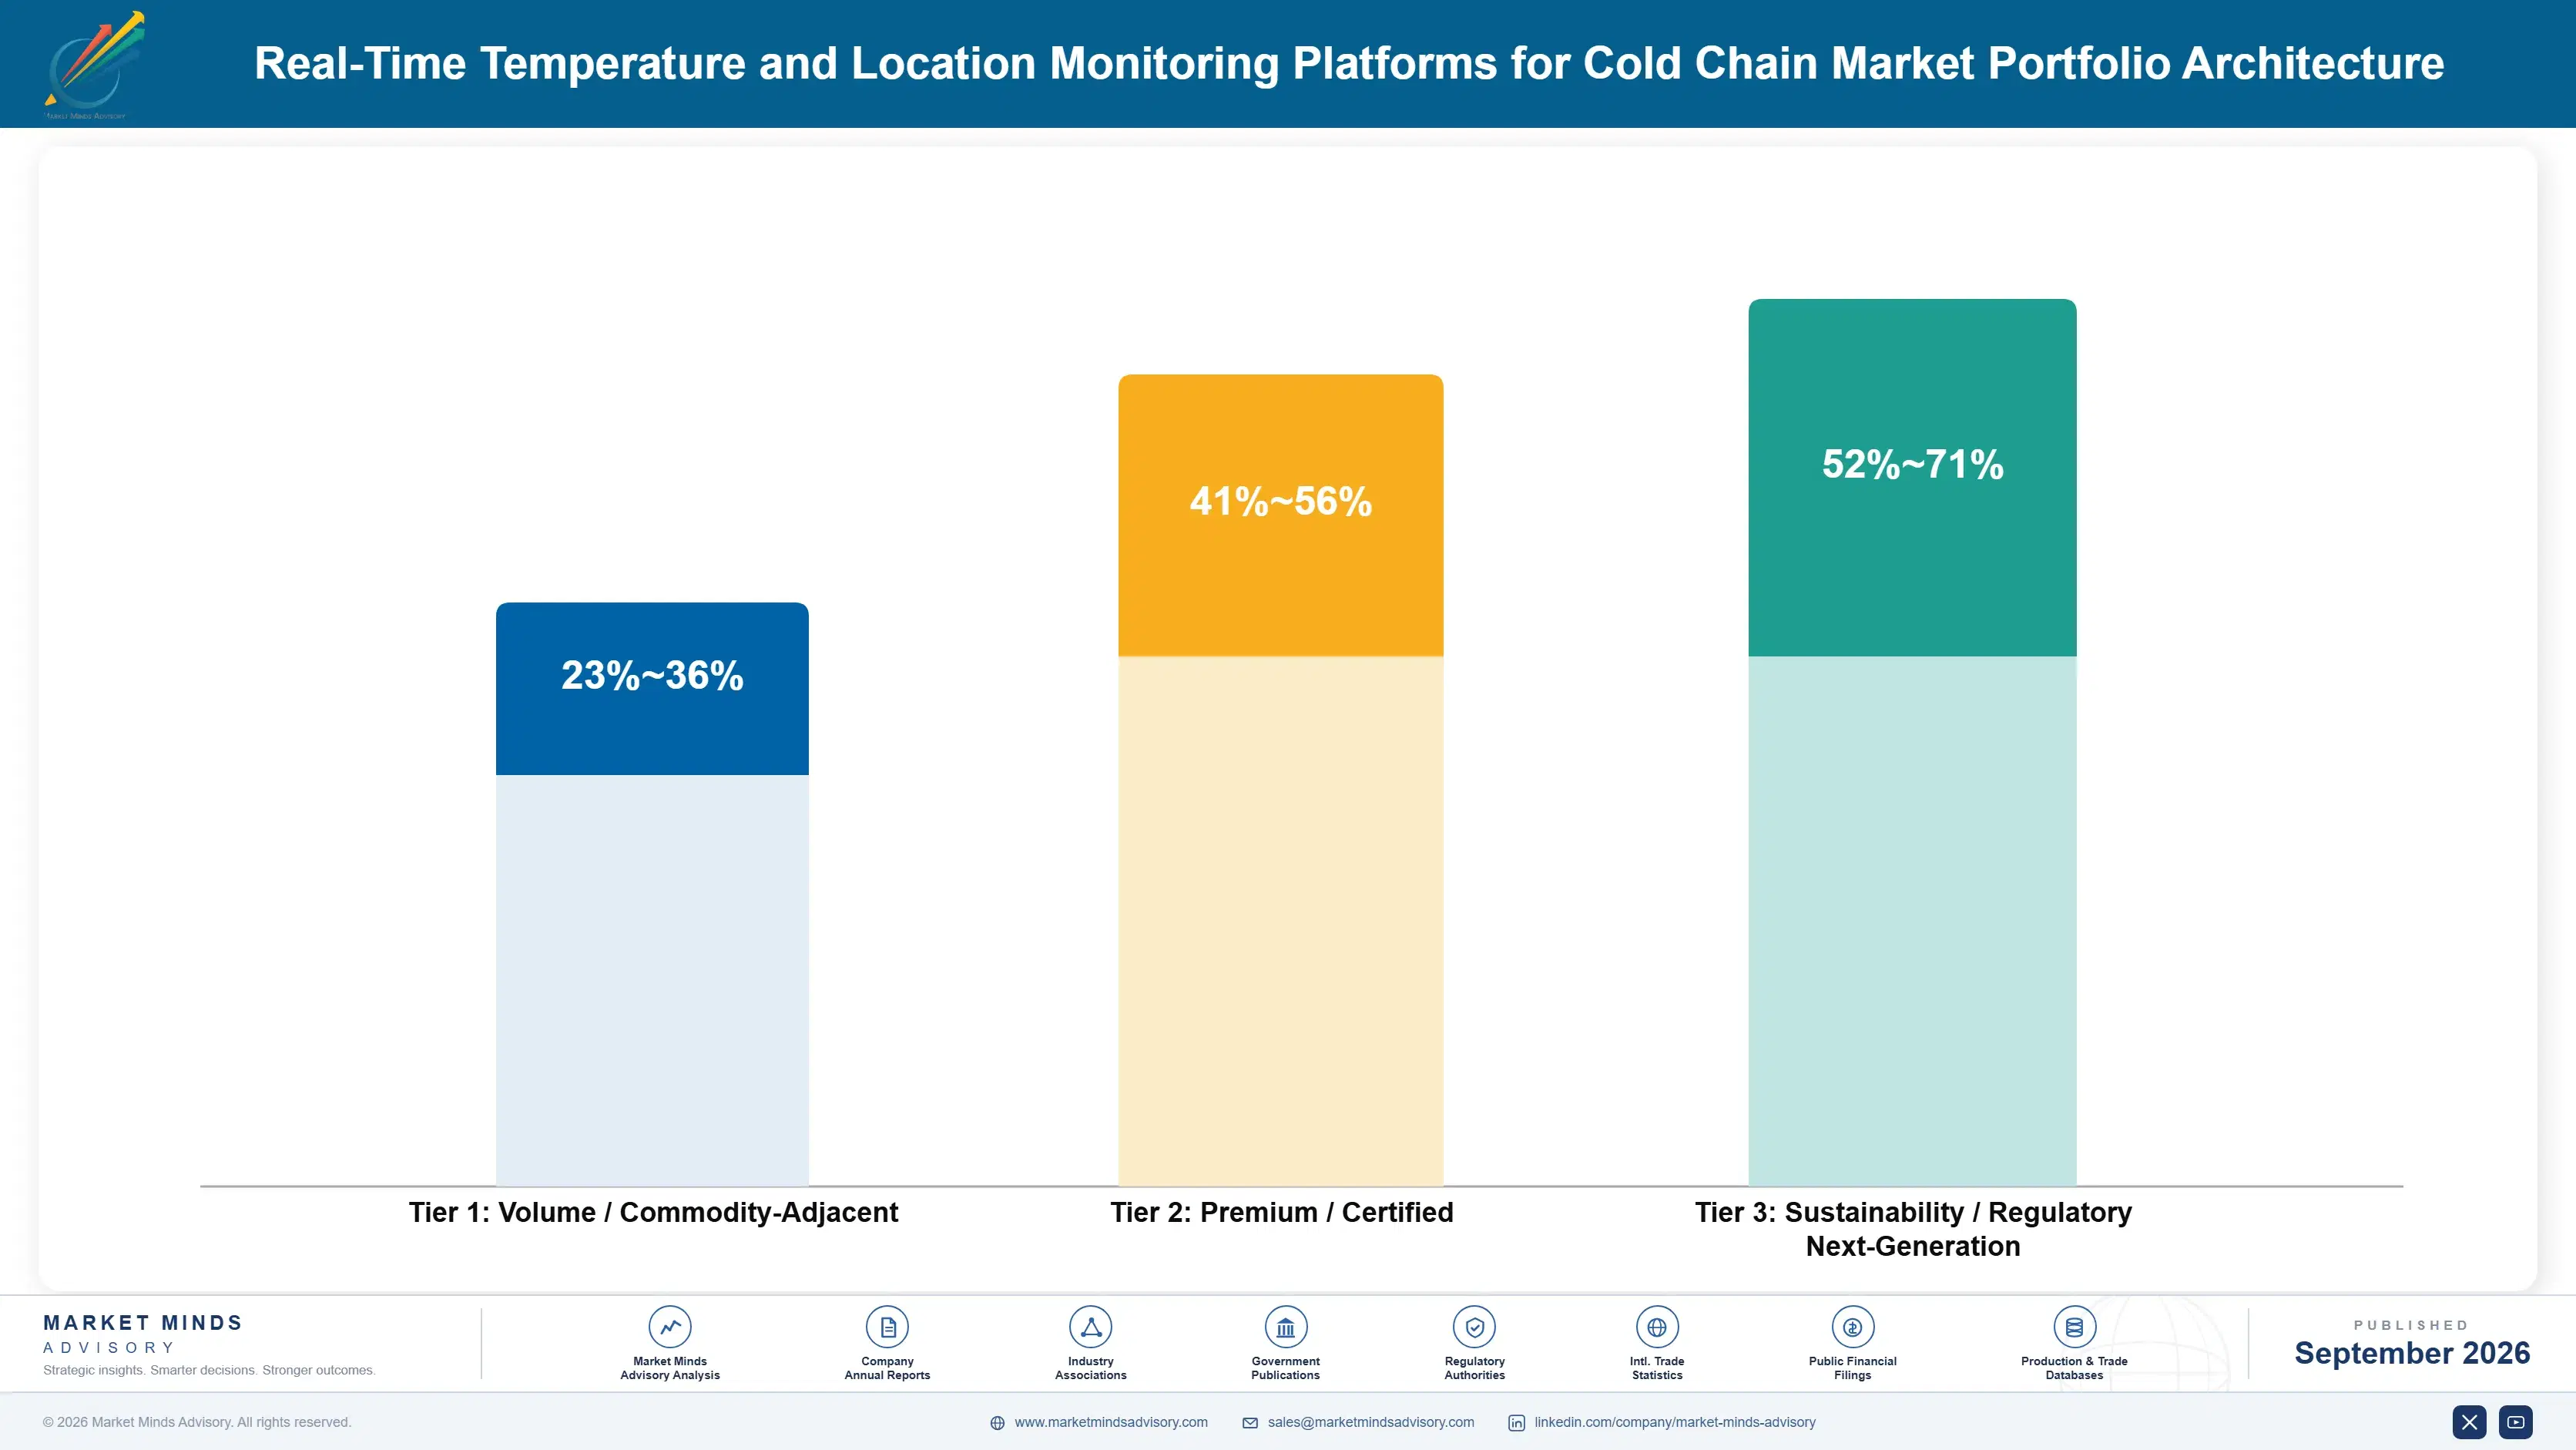
Margin architecture separates on whether the supplier sells hardware or an operated outcome. Device sales earn thin electronics margins that are compressing as cellular modules cheapen, and no sensor improvement changes how those tenders are evaluated. Operated monitoring with staffed response earns considerably more, because the buyer is purchasing intervention rather than data and has no comparable alternative to price it against.
The volume tension is between pharmaceutical value and food volume. Pharmaceutical cargo is 64% of value on a fraction of the shipments and supports pricing that needs no defending. Food and perishable volumes are enormous and grind price on every unit, and suppliers chasing them for scale found the margin did not survive the contract. Both are needed for manufacturing volume, but the balance has damaged more suppliers here than competitive losses have.

High-value revenue concentrates in operated monitoring for pharmaceutical cargo and in clinical trial supply, where documentation requirements exceed anything in commercial distribution. Both involve a customer whose downside is invalidated data or unusable therapy rather than replacement cost. Device supply occupies the volume position, provides the installed presence that service revenue is sold into, and generates progressively less of the profit each year.

Volume / Commodity-Adjacent

Single-use and reusable monitoring devices sold against specification on unit price. The wide range separates suppliers manufacturing at scale from those sourcing contract-built hardware. Falling cellular module costs are compressing this tier steadily and there is no sign of that reversing.
Gross Margin: 23-36%

Premium / Certified

Qualified monitoring platforms with validation documentation, calibration traceability and quality system integration for regulated distribution. Margin holds because requalification cost and audit history make switching genuinely expensive. Buyers here compare documentation rather than sensor specifications.
Gross Margin: 41-56%

Sustainability / Regulatory / Next-Generation

Operated monitoring services with staffed response, intervention logistics and clinical trial documentation programmes. The widest range in the portfolio, reflecting how much staffed operation is included against automated escalation. Highest margin and the least exposed to device price competition anywhere here.
Gross Margin: 52-71%
real-time-temperature-and-location-monitoring-plat-portfolio-architecture-1788419660581

High-value Sub-segments and Strategic Watch-out

Operated Monitoring Services

High value and high growth together, because buyers are purchasing intervention rather than data and no device supplier offers a comparable alternative. The margin range reflects staffing intensity and coverage hours. Customers who have suffered a loss buy this with very little negotiation at all.
Gross Margin: 58-71%

Clinical Trial Supply Documentation

High value with strong growth, driven by data integrity requirements rather than by product replacement cost. The range reflects retention obligations and reporting depth, which vary by sponsor and jurisdiction. Decentralised trial designs shipping to participants have expanded and complicated this segment considerably in the past three years.
Gross Margin: 50-64%

Monitoring Device Supply

The volume core of the market and its most exposed part, compressing as cellular module costs fall and logistics providers bundle hardware into freight services. It provides the installed presence that service revenue is sold into. Suppliers need it and are progressively less able to earn from it.
Gross Margin: 22-35%

Freight Provider Bundled Monitoring

The strategic watch-out, carried at zero because it represents monitoring supplied through logistics providers rather than sold directly. Bundling reaches the shipper before any specialist does and sets the reference price. Suppliers treating forwarders purely as channel partners are misreading who now controls access to the customer.
Gross Margin: 0-0%

How Monitoring Revenue Repeats

Revenue repeats per shipment rather than per contract, which makes it unusually sensitive to customer volumes the supplier cannot influence. A qualified programme renews reliably because requalification and audit history make switching expensive, but revenue rises and falls with shipment volumes. Suppliers running staffed operations carry that variance as fixed cost, which is why per-shipment pricing matters more here than in most subscription businesses.
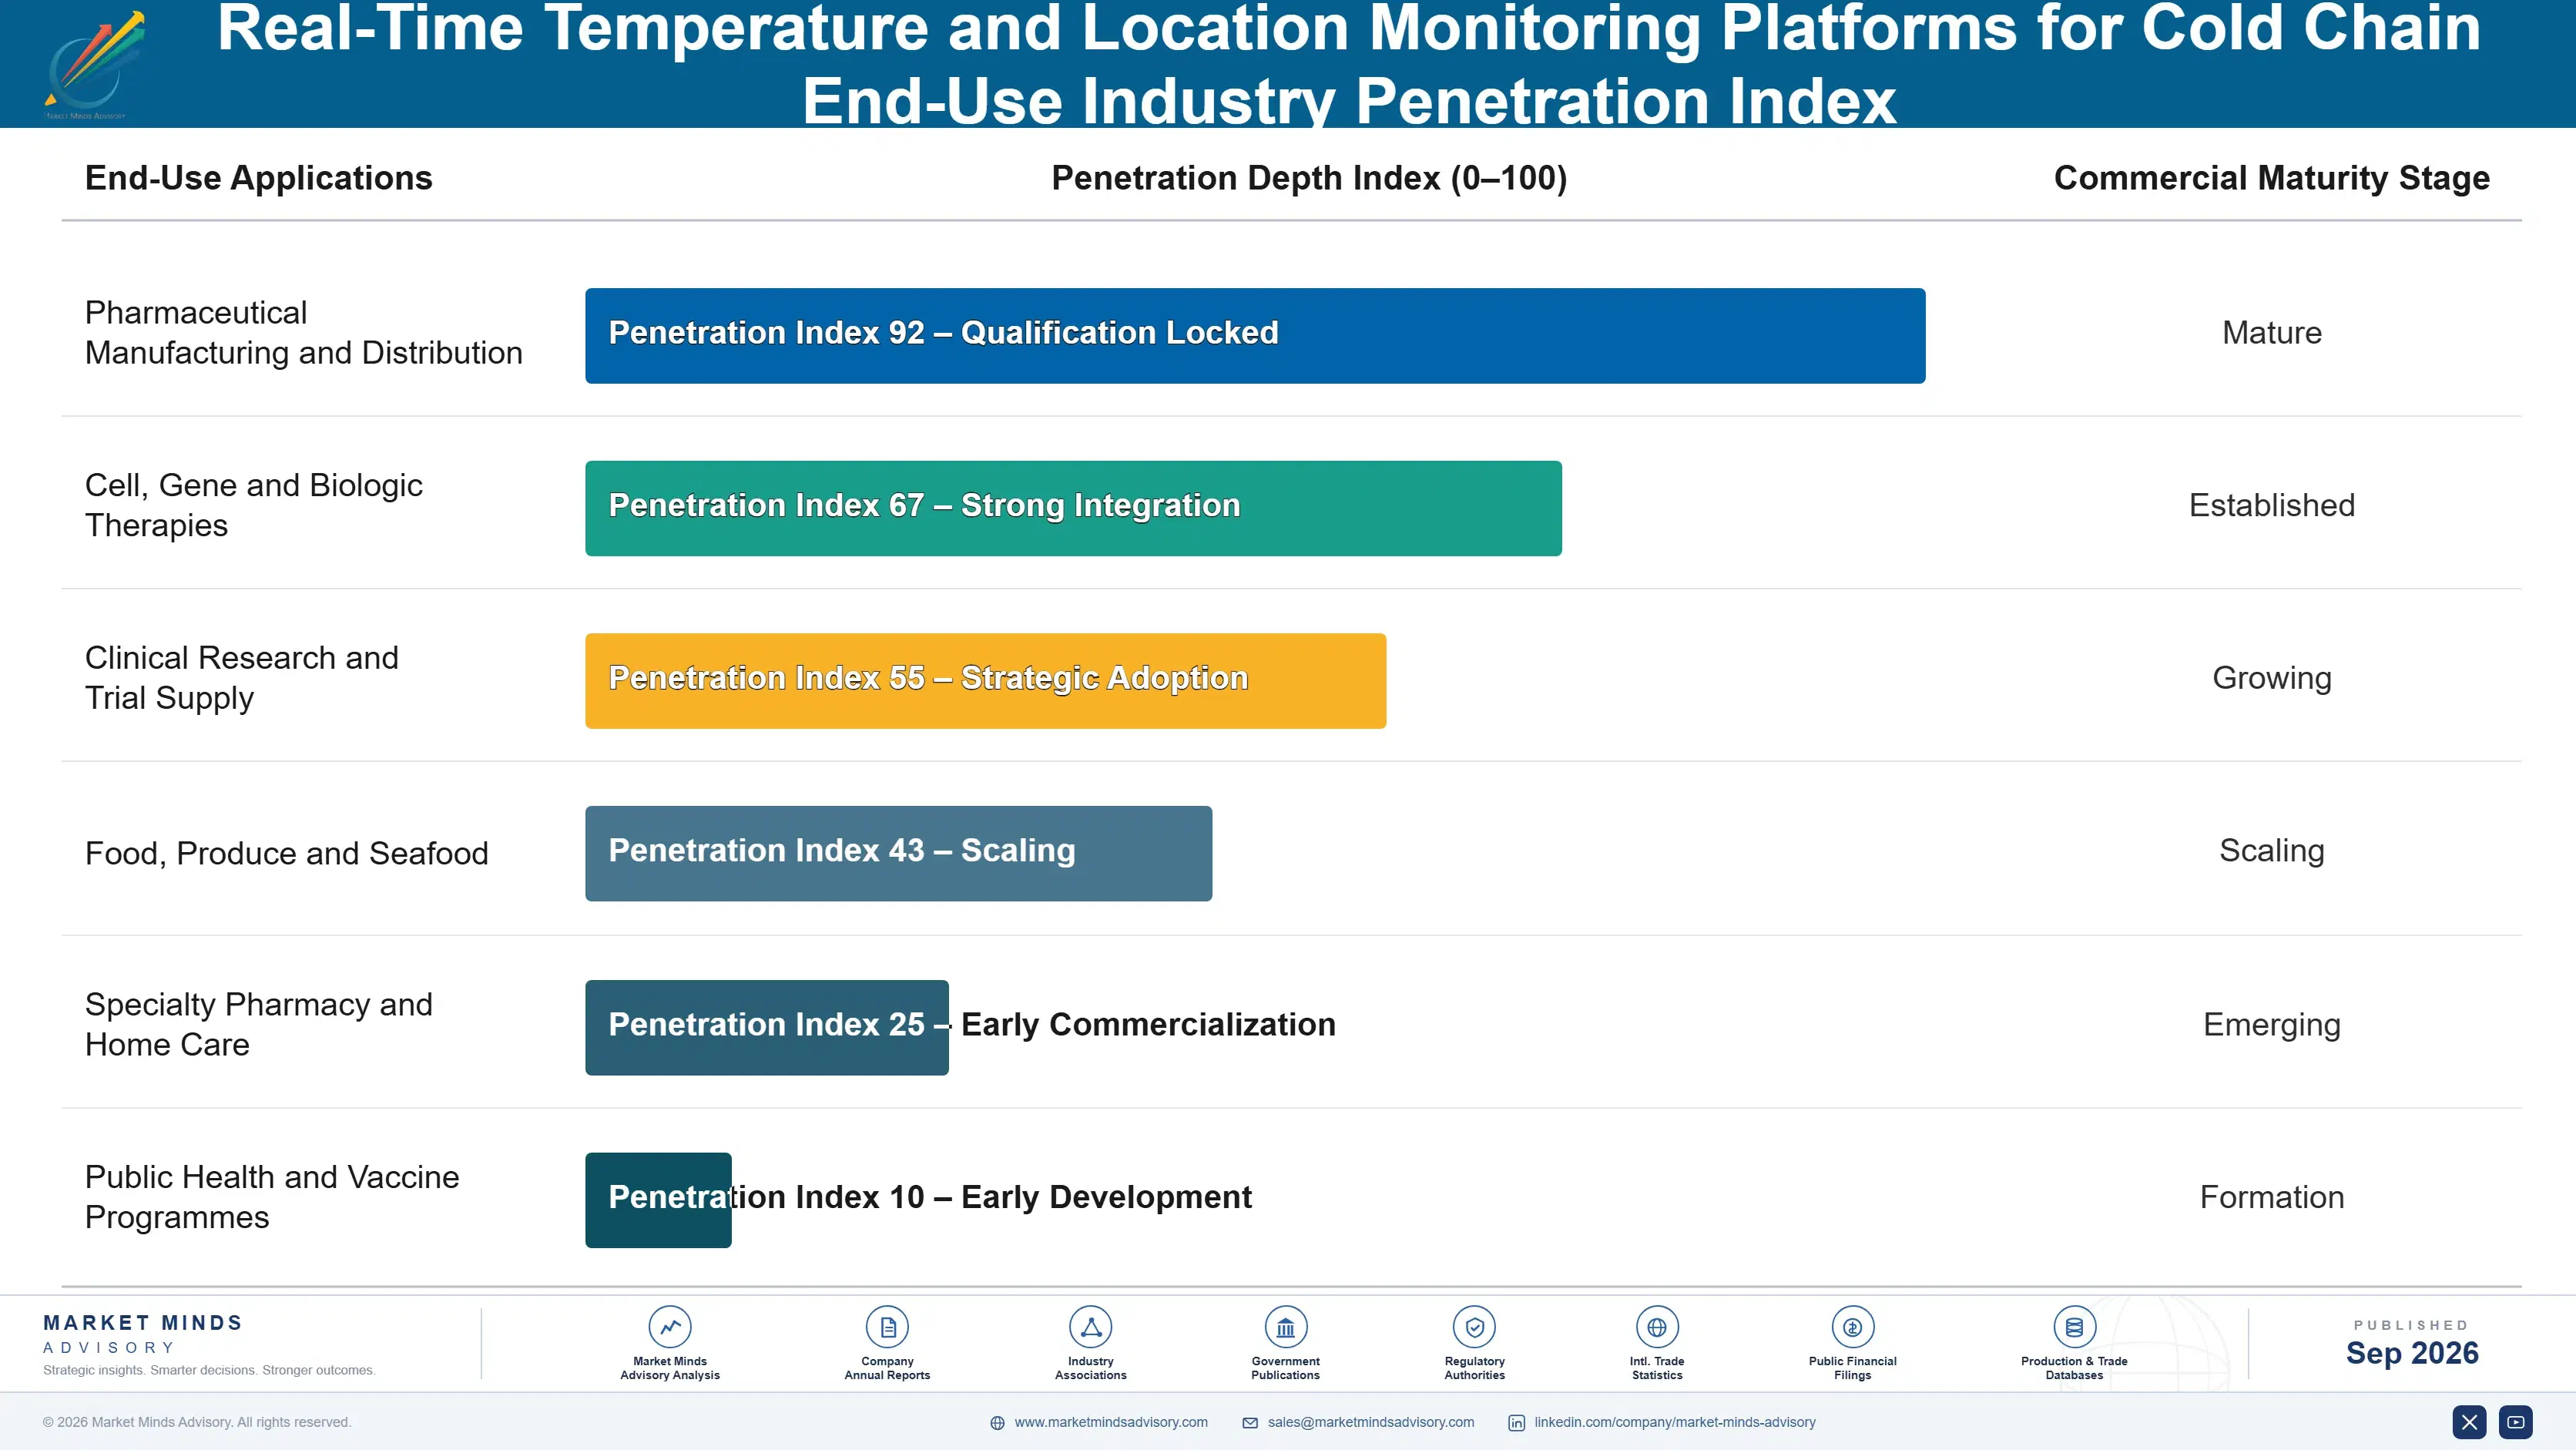
Adoption depth varies sharply by cargo type. Cell and gene therapy shippers monitor every consignment with redundant devices and staffed oversight, since a single failure destroys an irreplaceable product. Commercial pharmaceutical distribution monitors comprehensively but responds selectively. Clinical trial supply monitors for documentation more than intervention. Food shippers monitor at vehicle level and act only on systematic faults. Direct-to-patient delivery monitors intensively on the final leg and barely at all before it.

The buyer has moved from logistics operations toward quality assurance. Historically a transport manager chose monitoring to reduce claims and improve carrier performance overall. Today a quality function specifies it against distribution practice obligations and audit findings, and evaluates suppliers on validation documentation rather than device features. Suppliers selling to logistics alone address somebody who now needs quality approval first.
real-time-temperature-and-location-monitoring-plat-end-use-penetration-index-1788419661073

What This Market Rewards

These are among the four positions where our research anticipates prominent divergence between winners and laggards over the coming forecast period. Each is grounded in the demand model, the regulatory perimeter, and the announced capacity pipeline.
01 / RESPONSE LAYER OWNERSHIP

Sell intervention, because an unread alert changes nothing

Only about 23% of excursion alerts currently reach a person with the authority and the playbook to act, which undermines the whole argument for paying more than a passive logger would cost. Suppliers operating staffed monitoring with agreed escalation lift that above half and charge roughly 5 times device-only pricing for the same shipments. It removes them from hardware comparison entirely, and it is the only reliable way any supplier in this market has found to escape falling device prices.
02 / CARGO VALUE SELECTION

Follow high-value pharmaceutical freight, not food volume

Pharmaceutical and biologic cargo is 64% of market value because a single consignment can exceed an entire annual monitoring budget, which makes device cost an irrelevance rather than a negotiating point. Food and perishable shippers face the opposite arithmetic and grind price on every unit shipped. Suppliers concentrating on high-value cargo hold gross margins roughly 22 percentage points above those chasing food volume, and the pursuit of scale through food volume has damaged more suppliers in this market than competition ever has.
03 / DEVICE RECOVERY ECONOMICS

Fix returns properly or move to single-use hardware

Reusable monitors are priced on eight to ten uses and return roughly 58% of the time, which puts the real cost per shipment far above anything a proposal shows and quietly subsidises the customer instead. Suppliers have two honest options available: solve recovery properly through deposits and reverse logistics, or accept single-use economics and remove the problem entirely. This is an operations question rather than a technology one, which is exactly why so much of the industry has left it unaddressed.
04 / COURIER INTEGRATION DEPTH

Build delivery integrations before chasing last-mile growth

Last-mile and direct-to-patient monitoring grows at 17.4%, faster than anything else here, and it fails without courier cooperation because the failure mode is a package left at a door rather than a refrigeration fault. Suppliers holding delivery status integration with the specific couriers a customer actually uses win on capability that no sensor specification anywhere addresses. The work is slow, market-specific and thoroughly unglamorous, which is precisely why it defends a position in the fastest growing segment of this market.

Engagement Snapshot From the Field

A live engagement with an industry participant carrying material or product regulatory and market exposure ahead of a defining policy shift, showing how our research translates into a defensible multi-year portfolio strategy.
MARKET MINDS ADVISORY · CLIENT ENGAGEMENT SUMMARY
Real-Time Temperature and Location Monitoring Platforms for Cold Chain Producer Strategic Portfolio Review and Transition Roadmap 2026·Investment Scenario on Real-Time Temperature and Location Monitoring Platforms for Cold Chain Exposure Evaluation 2025-26
CLIENT PROFILE
A specialty pharmaceutical distributor handling roughly 190,000 temperature-controlled shipments annually across 14 countries (client-reported, unverified by MMA), including cell therapy consignments where individual product values exceeded USD 300,000. The company operated a reusable device programme covering about 60% of shipments, with passive loggers on the remainder and no consistent monitoring specification applied by cargo value at all.
STRATEGIC CHALLENGE
Device recovery had fallen to 51% and the monitoring programme was running roughly USD 3.4 million over budget annually as a direct result (client-reported, unverified by MMA). Separately, an inspection finding had identified that excursion alerts raised outside working hours were being recorded rather than actioned, with no documented escalation path to anyone able to intervene.
MMA APPROACH
MMA analysed recovery by consignee type rather than by route, which the distributor had never separated, and reconstructed the true cost per shipment including unreturned hardware. We interviewed 15 consignees, four suppliers and two logistics partners. Supplier evaluation weighted operated response capability and courier integration ahead of device specification, which changed the shortlist substantially from the internal assessment.
KEY FINDINGS
  1. Recovery was 79% from hospital pharmacies and 22% from clinics and physician offices, a difference the distributor had never seen because reporting aggregated all consignees together.
  2. Real cost per reusable shipment was roughly USD 71 once unreturned hardware was allocated, above the USD 54 single-use device the programme had rejected on price.
  3. Only 19% of out-of-hours alerts had produced any action, and no carrier contract contained a diversion or intervention obligation of any kind.
  4. Cell therapy shipments, worth more than all other cargo combined, used the same monitoring specification as routine refrigerated products worth a fraction as much.
CLIENT PROFILE
A specialty pharmaceutical distributor handling roughly 190,000 temperature-controlled shipments annually across 14 countries (client-reported, unverified by MMA), including cell therapy consignments where individual product values exceeded USD 300,000. The company operated a reusable device programme covering about 60% of shipments, with passive loggers on the remainder and no consistent monitoring specification applied by cargo value at all.
STRATEGIC CHALLENGE
Device recovery had fallen to 51% and the monitoring programme was running roughly USD 3.4 million over budget annually as a direct result (client-reported, unverified by MMA). Separately, an inspection finding had identified that excursion alerts raised outside working hours were being recorded rather than actioned, with no documented escalation path to anyone able to intervene.
MMA APPROACH
MMA analysed recovery by consignee type rather than by route, which the distributor had never separated, and reconstructed the true cost per shipment including unreturned hardware. We interviewed 15 consignees, four suppliers and two logistics partners. Supplier evaluation weighted operated response capability and courier integration ahead of device specification, which changed the shortlist substantially from the internal assessment.
KEY FINDINGS
  1. Recovery was 79% from hospital pharmacies and 22% from clinics and physician offices, a difference the distributor had never seen because reporting aggregated all consignees together.
  2. Real cost per reusable shipment was roughly USD 71 once unreturned hardware was allocated, above the USD 54 single-use device the programme had rejected on price.
  3. Only 19% of out-of-hours alerts had produced any action, and no carrier contract contained a diversion or intervention obligation of any kind.
  4. Cell therapy shipments, worth more than all other cargo combined, used the same monitoring specification as routine refrigerated products worth a fraction as much.
RECOMMENDED STRATEGY
Phase 1: Move all clinic and physician office shipments to single-use devices immediately, retaining reusable hardware only for hospital pharmacy destinations where recovery works. Phase 2: Contract operated monitoring with staffed out-of-hours response for cell therapy and high-value consignments, and negotiate diversion obligations into carrier agreements. Phase 3: Separate monitoring specifications by consignment value rather than continuing to apply one standard across a shipment population with hugely varying stakes.
OUTCOME
Total programme cost fell by roughly USD 2.6 million annually and out-of-hours alert action rose to 68% within seven months (client-reported, unverified by MMA). Two cell therapy shipments were successfully diverted during that period, and the inspection finding was formally closed out at the following audit.

Frequently Asked Questions

Foundational context covering the market sizes, CAGR, scope, country, region and competition that inform every finding below. This section is provided to cover basics and most often pre-purchase conversations, answered from the MMA Primary Research Dataset.

What is the current size of the Real-Time Temperature and Location Monitoring Platforms for Cold Chain Market?

The market was worth USD 2.6 billion in 2025 and reaches USD 2.90 billion in 2026. Pharmaceutical and biologic cargo accounts for roughly 64% of that value.

How large will the Real-Time Temperature and Location Monitoring Platforms for Cold Chain Market be by 2036?

MMA forecasts USD 8.69 billion by 2036, an expansion of 3.00 times over the forecast period. That represents USD 5.79 billion of incremental annual revenue against 2026.

What is the CAGR for the Real-Time Temperature and Location Monitoring Platforms for Cold Chain Market 2026 to 2036?

The base case is 11.6% compound annual growth, with a bull case at 12.8% and a bear case at 10.4%. Whether device costs fall far enough for food applications separates the scenarios.

Which segment is growing fastest?

Last-mile and direct-to-patient monitoring grows at 17.4%, half again the market rate of 11.6%. Home delivery moves product to addresses with no monitored storage and no trained receiver.

Who are the major companies in the Real-Time Temperature and Location Monitoring Platforms for Cold Chain Market?

Carrier, Emerson, Controlant, Tive and ORBCOMM lead on measured platform and device revenue. Together they hold roughly 39%, with a long tail of device specialists behind them.

Which country is growing fastest?

India grows fastest at 16.4%, on vaccine and generic biologic manufacturing shipping worldwide under customer documentation requirements, and on organised pharmacy chains replacing fragmented wholesale distribution.

Report Segmentation Architecture

The full report scope spans multiple orthogonal segmentation dimensions, with cross-tabulated demand data provided for each dimension pair. Coverage extends further to regional breakdowns, trend trajectories, and the competitive detail needed to support segment-level decision-making.

By Primary Market Dimension

  • In-Transit Shipment Monitoring
  • Facility and Storage Continuous Monitoring
  • Last-Mile and Direct-to-Patient Monitoring
  • Clinical Trial Supply Monitoring
  • Food and Perishable Retail Monitoring
  • Reusable Asset and Container Monitoring

By End-Use Industry

  • Pharmaceutical Manufacturing and Distribution
  • Cell, Gene and Biologic Therapies
  • Clinical Research and Trial Supply
  • Food, Produce and Seafood
  • Specialty Pharmacy and Home Care
  • Public Health and Vaccine Programmes

By Commercial Dimension

  • Direct Shipper Contracts
  • Operated Monitoring Service Subscriptions
  • Logistics Provider Bundled Supply
  • Distributor and Reseller Channels
  • Per Shipment Device Sales
  • Public Sector and Donor Procurement

By Region

  • North America
  • Western Europe
  • East Asia
  • South Asia and Pacific
  • Latin America
  • Middle East and Africa
  • Eastern Europe

Scope, Methodology, and Coverage

Every figure in this report is reproducible from documented input assumptions. The scope below maps the historical period, the forecast horizon, the segmentation dimensions, and the countries covered, alongside the underlying primary and qualitative methodology.
Historical Period
2020 to 2025
Forecast Period
2026 to 2036
Base Year
2025 (USD billions; MMA Primary Research Dataset, September 2026)
Market Definition
This market covers platforms combining monitoring hardware, connectivity and software that report temperature and location of temperature-sensitive goods during transit or storage, spanning in-transit shipment monitoring, facility and storage continuous monitoring, last-mile and direct-to-patient delivery, clinical trial supply, food and perishable retail, and reusable asset and container monitoring. Revenue is measured as device, connectivity, software subscription and operated monitoring service value at supplier level. Passive chemical time-temperature indicators, insulated packaging and phase change materials, refrigeration and cooling equipment, transport management systems and general freight visibility platforms without temperature capability are excluded.
Quantitative Units
USD billions, device, connectivity, software and service revenue
Segmentation Dimensions
Monitoring deployment context, end-use industry, commercial model, region
Regions Covered
North America, Western Europe, East Asia, South Asia and Pacific, Latin America, Middle East and Africa, Eastern Europe
Countries Covered
United States, Canada, Germany, Switzerland, Ireland, United Kingdom, France, Netherlands, Belgium, Denmark, Sweden, Italy, Spain, Poland, Romania, China, Japan, South Korea, Singapore, India, Thailand, Vietnam, Australia, Brazil, Mexico, Chile, Peru, Argentina, United Arab Emirates, South Africa
Key Companies Profiled
Carrier, Emerson, Controlant, Tive, ORBCOMM, SpotSee, Berlinger, ELPRO-BUCHS, DeltaTrak, Roambee, Copeland, Zebra Technologies, Testo, Monnit, Logmore, Blulog, Varcode, Hanhaa, Frigga, Sensire
Quantitative Methodology
Primary survey, n=3,800 respondents, Q4 2025, six countries; demand-side model with trade association cross-validation
Qualitative Methodology
47 expert interviews, Q4 2025; applied to validate demand model assumptions, identify emerging dynamics, and assess competitive positioning
Report Format
PDF and XLSX data workbook (Word format preview document)
Publisher
Market Minds Advisory
Report Code
MMA-2026-TEC-821
Published
September 2026
Contact
sales@marketmindsadvisory.com | www.marketmindsadvisory.com

Purchase the full Real-Time Temperature and Location Monitoring Platforms for Cold Chain Market Report (2026 to 2036).

The full MMA report examines why continuous monitoring only pays when somebody acts on the alert, and what that means for how these platforms should be built, priced and sold. It sizes the market to 2036 across six deployment contexts, seven regions and 30 countries, with segment growth rates and regional demand mechanisms set out in full. Competitive analysis covers 20 suppliers assessed on measured platform and device revenue, including moat and risk assessment for the two leaders. The report quantifies device cost structure, recovery economics and margin architecture across three portfolio tiers. It closes with four strategic verdicts and an anonymised specialty distributor engagement.
Six deployment contexts sized to 2036
Seven regions with demand mechanism analysis
Twenty suppliers on consistent revenue basis
Device cost and recovery rate benchmarks
Margin architecture across three portfolio tiers
Anonymised specialty distributor monitoring redesign engagement

Built For The People Who Decide

From boardroom strategy to bench-side execution, this report is read cover-to-cover by leaders shaping the next decade of their industry, turning demand scenarios, market dynamics and valuation benchmarks into decisions.
CXOs/ Presidents/ VPs/ Managers
M&A and Corporate Development
Strategy Teams and R&D Heads
Procurement and Product Directors
Regulatory and Compliance Leaders
Investor Relations and Equity Analysts