Market Minds Advisory
Real-Time Bioprocess Raman Analyzer Market

Real-Time Bioprocess Raman Analyzer Market: Process Analytical Technology Enters Continuous Manufacturing

Biopharmaceutical manufacturers are installing in-line Raman analyzers directly into bioreactor systems as continuous manufacturing adoption accelerates, pulling quality control decisions forward from end-of-batch laboratory testing into real-time automated process control.

Lead Analyst

Alice Ballenger

Published

August 2026

Make Smarter Decisions with Customized Research Insights

Request a free sample report and evaluate market opportunities, growth trends, and competitive dynamics relevant to your business needs.

2025 MARKET VALUE$0.6BMarket Size 2025
2036 FORECAST VALUE$2.0BBase Case , 2026 to 2036
CAGR 2026 TO 203611.0 %Bull 12.4% / Bear 9.6%
INCREMENTAL OPPORTUNITY$1.3BNet 10- year value creation
EXPANSION MULTIPLE2.84x2036 value over 2026 base
Strategic Levers
M&A Pipeline
Regional Outlook
Country Rankings
Competitive Intelligence
Segmental Deep-dive
Call-Us : 91 93563 13602

Executive Snapshot and Market Trajectory

Biomanufacturers increasingly treat Raman analyzers as a control system component rather than a laboratory instrument, wiring real-time spectral data directly into bioreactor feedback loops. Process engineers now expect this integration by default across most new facility designs today. That expectation now shapes procurement conversations from the earliest planning stage onward.
In-line analyzers integrated directly into single-use bioreactor systems are the clearest growth story, and commercial momentum concentrates in North America, where the largest concentration of biopharmaceutical manufacturing capacity and continuous processing adoption outpaces every other region MMA tracks by a considerable margin, reinforcing steady demand for both hardware and software. That regional concentration is unlikely to narrow meaningfully before the end of the decade under most current forecast scenarios. across most markets.
Five manufacturers hold roughly two-thirds of global revenue, reflecting how instrumentation precision and chemometric software quality still separate leaders from challengers even in a maturing category. Regulatory guidance on process analytical technology shapes purchasing decisions as much as raw spectral resolution does across every deployment format, and smaller specialists are using faster software iteration to chip away at established players' share each fiscal year.
Market Definition
The Real-Time Bioprocess Raman Analyzer Market covers in-line, at-line, and off-line Raman spectroscopy instruments, sampling probes, and chemometric modeling software used to monitor biopharmaceutical manufacturing processes in real time. It excludes general laboratory Raman microscopy systems and mass spectrometry instrumentation sold as separate product categories.
Base Year Value
$0.6B in 2025 (MMA Primary Research Dataset, August 2026)
Forecast Period
2026 to 2036, eleven discrete annual values
CAGR
11.0% base case. Bull 12.4%. Bear 9.6%.
Fastest Growth Segment
Chemometric Modeling Software: 15.0% CAGR
Fastest Growth Country
China: 13.0% CAGR
Fastest Growth Region
South Asia and Pacific: 13.0% CAGR
Largest Region
North America: 37% of 2025 global value
Market Leaders
Thermo Fisher Scientific Inc, Endress+Hauser Group, Bruker Corporation, Hamilton Company, Repligen Corporation. Source: MMA Analysis based on company annual reports.
Primary Survey
n=3,800 procurement and R&D decision-makers, Q4 2025, six countries
Methodology
Demand-side build-up, cross-validated against public data, 47 expert interviews

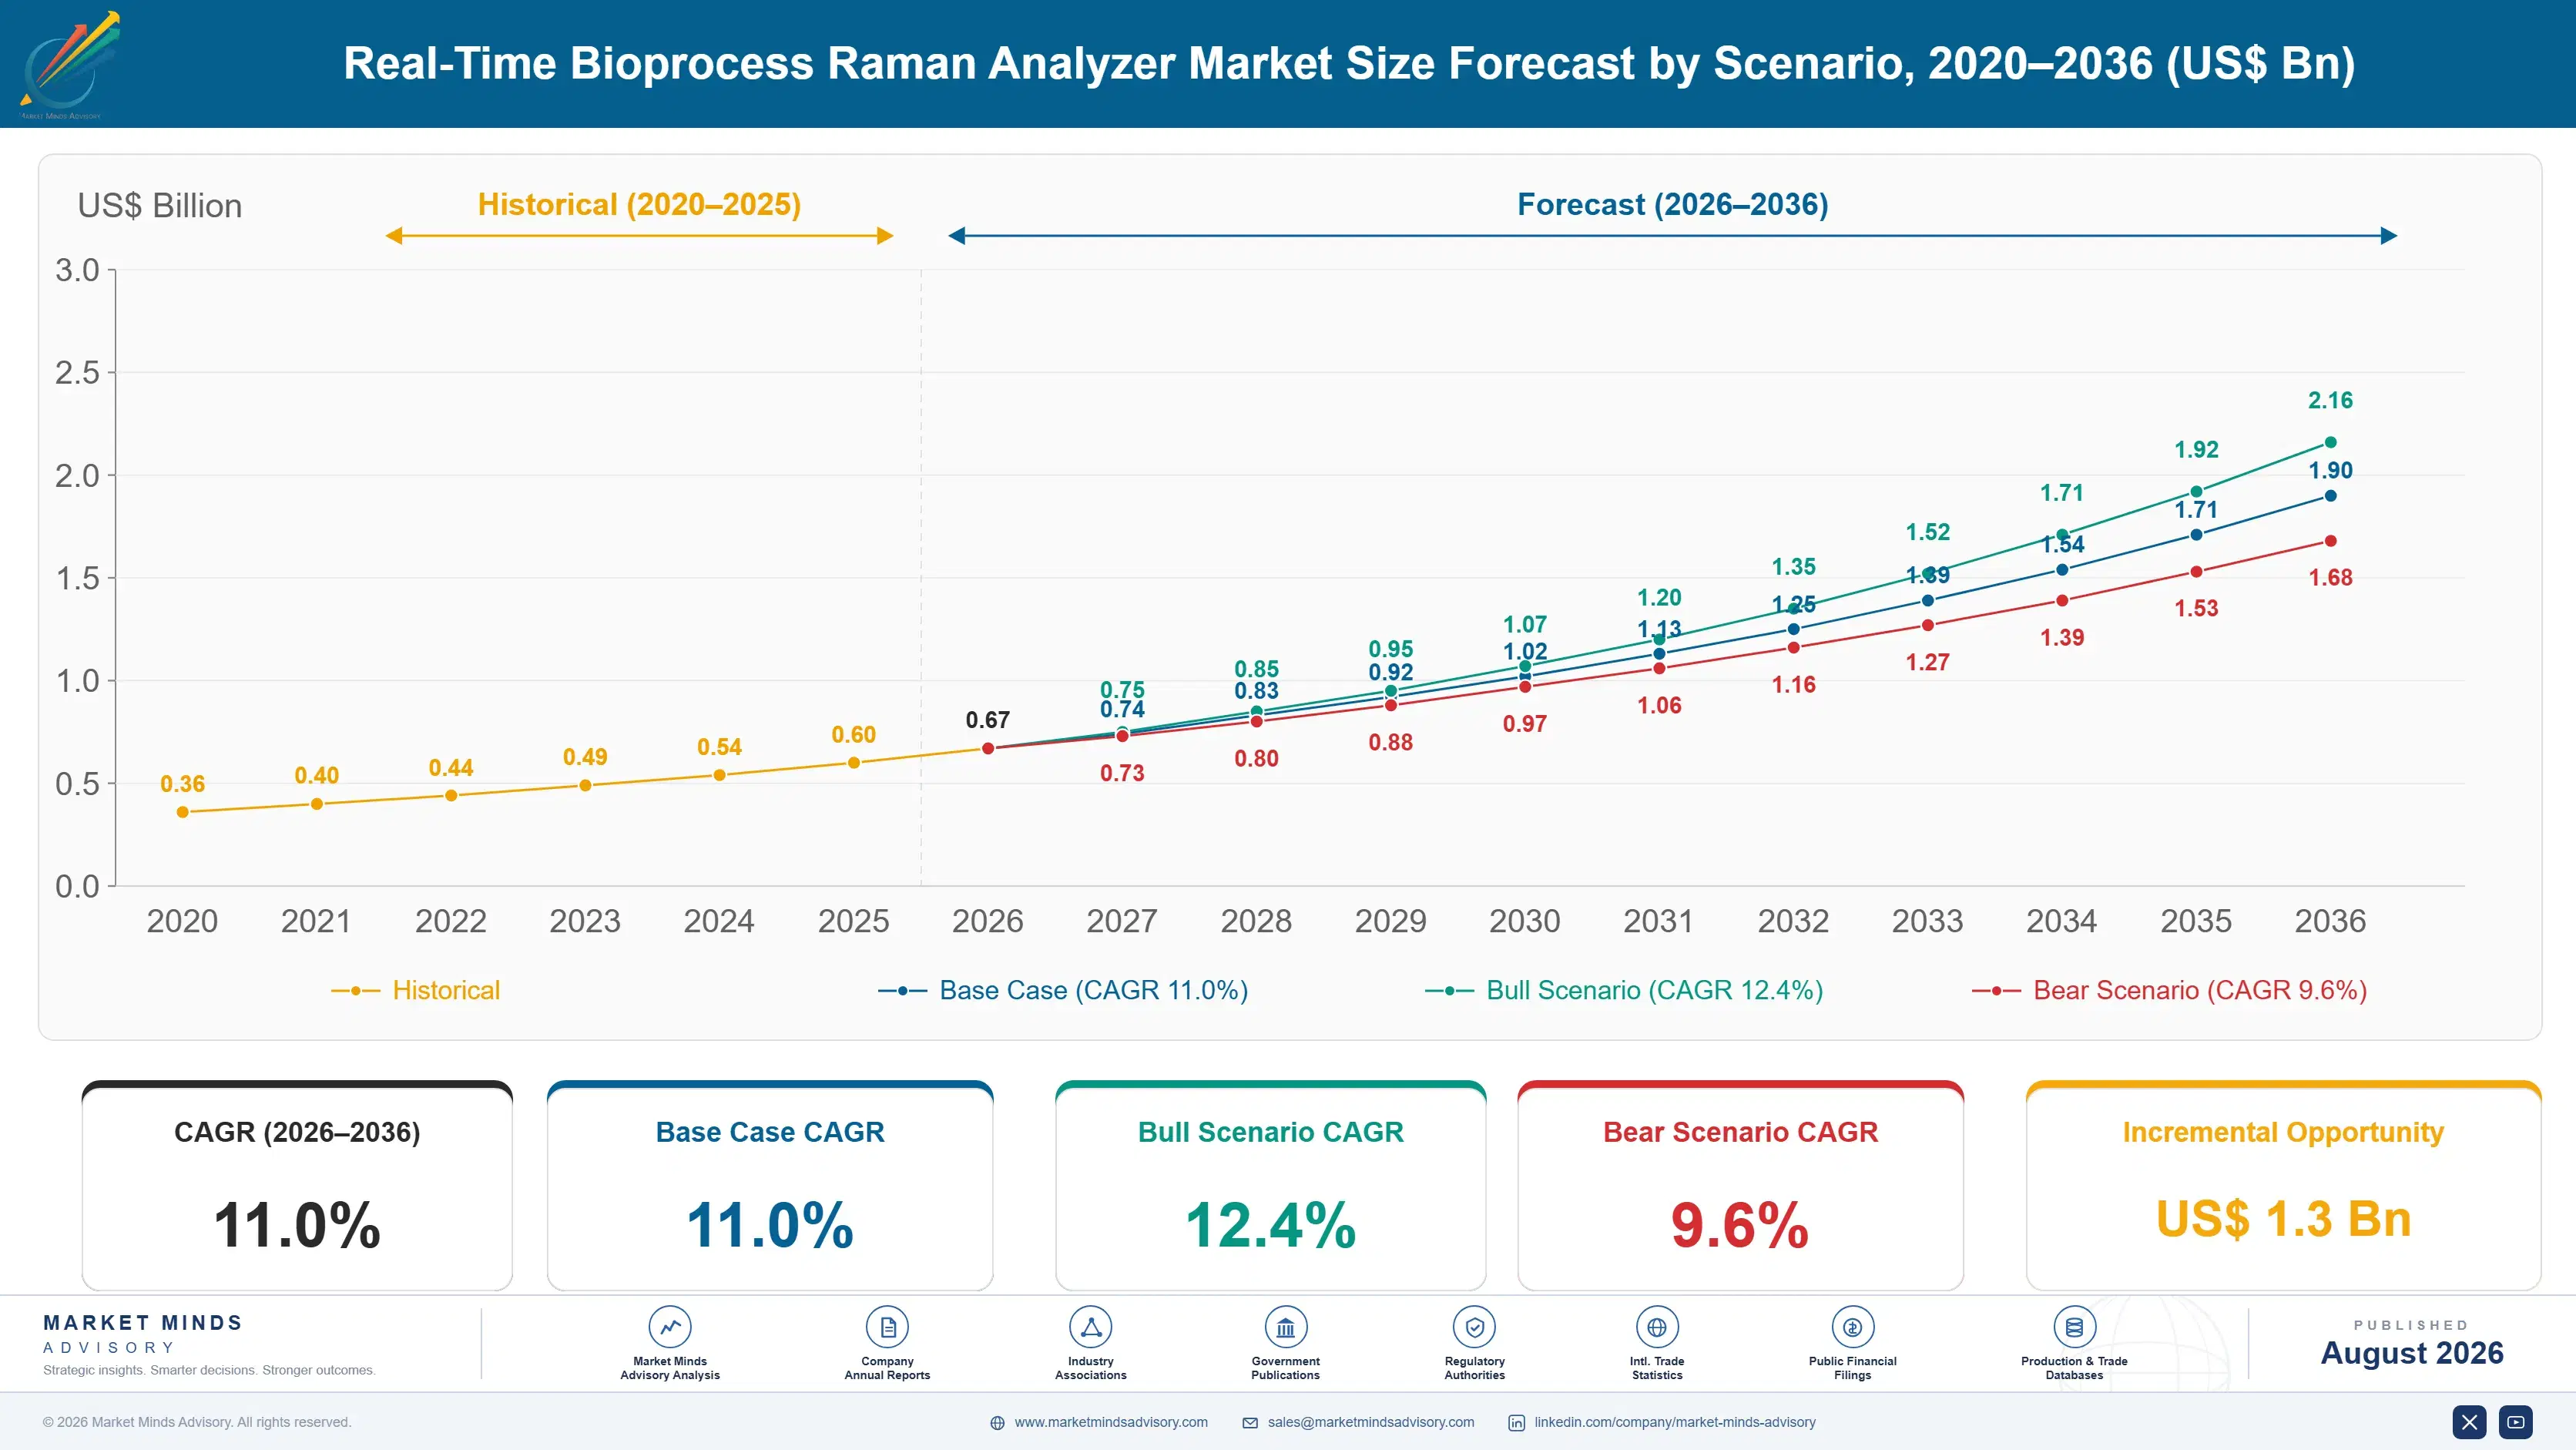
Real-Time Bioprocess Raman Analyzer Market Forecast Scenarios

real-time-bioprocess-raman-analyzer-market-size-forecast-scenario-1787306717803
Between 2020 and 2025 the market accelerated as continuous bioprocessing gained regulatory momentum and biopharmaceutical manufacturers sought real-time quality data, interrupted briefly by pandemic-era capital budget prioritization toward vaccine manufacturing capacity before broadening again through 2022 as general biomanufacturing investment resumed across most major markets. Vendors report order volumes largely normalized to a new, higher baseline by early 2023 across most major markets.
The base case assumes steady 11.0% annual growth through 2036, anchored to three mechanisms: regulatory guidance increasingly favoring process analytical technology over end-of-batch testing alone, continuous manufacturing adoption requiring real-time in-line monitoring capability, and chemometric modeling software maturing enough to reduce the specialized expertise historically required to interpret Raman spectral data. Group purchasing and capital project planning activity have reinforced this trajectory across most recent fiscal reporting quarters. Manufacturers report growing confidence in this outlook.
The bull case centers on continuous manufacturing adoption accelerating faster than currently modeled as regulatory bodies formalize process analytical technology guidance. The bear case centers on capital budget constraints at smaller biomanufacturers delaying instrument purchases, stretching adoption timelines by a year or more. Neither scenario shifts the leading five manufacturers' relative rankings materially within the coming decade.

Spectroscopy Moves Into the Control Loop

Biomanufacturers increasingly specify in-line Raman capability at the design stage of new manufacturing facilities, rather than retrofitting monitoring equipment after a facility has already begun production, a shift that has meaningfully changed how vendors engage with capital project planning teams. Vendors that cannot engage with capital project teams early increasingly lose consideration before installation planning even begins. Vendors increasingly assign specialists to engage facility team
MARKET CONCENTRATIONCR5 68%Reflects a moderately concentrated field of instrumentation vendors
AVERAGE SELLING PRICE$45,000-140,000 per systemVaries considerably by deployment format and probe count
TOP PRODUCING COUNTRYUnited States, 31% shareLargest base of instrument manufacturing and assembly capacity
CAPACITY UTILISATION69%Reflects steady but not maximal production line usage
REPLACEMENT CYCLE LENGTH7-9 yearsReflects the typical instrument lifespan before full replacement
FEEDSTOCK COST SHARE22% of COGSLaser diodes and detector components as input cost
Chemometric software quality now shapes purchasing decisions nearly as much as instrument hardware specifications do, since a spectrometer without a reliable calibration model cannot deliver actionable real-time process data regardless of its raw optical performance. Manufacturers increasingly treat software quality as a core purchasing criterion rather than a secondary consideration behind hardware specifications. A spectrometer without a validated calibration model delivers spectral data no facility can actually act on.
Over the next decade, in-line deployment will likely become the default configuration for new biomanufacturing capacity, narrowing the gap between facilities built around continuous processing and those still relying primarily on end-of-batch laboratory testing. Manufacturers still reliant entirely on off-line testing formats risk losing ground to faster-moving in-line competitors over time. This transition should reshape vendor pricing power across new and retrofit installations.
"The instrument is only half the sale now. Vendors that cannot deliver a validated calibration model lose to ones that can, regardless of spectral resolution."
Director, Life Sciences Instrumentation Practice · MMA Analytical Instrumentatio

Market Trends

Regulatory Guidance Favors Process Analytical Technology Over Batch Testing

Regulatory bodies including the FDA have increasingly encouraged process analytical technology adoption as part of broader quality-by-design manufacturing guidance, favoring real-time monitoring over reliance on end-of-batch laboratory testing alone. The FDA's continued emphasis on continuous manufacturing readiness since 2019 has pushed several major biopharmaceutical manufacturers to retrofit existing facilities with in-line monitoring capability ahead of new product approvals. Manufacturers report meaningfully faster regulatory review timelines for submissions that include comprehensive process analytical technology data compared to submissions relying primarily on traditional batch release testing. Trial and manufacturing site inspections increasingly favor facilities with demonstrated real-time monitoring capability.
Market Impact: Adds 5% annual line conversion
Single-Use Bioreactor Integration Becomes the Default Configuration

Raman probe integration directly into single-use bioreactor systems has become the default configuration for new biomanufacturing capacity, replacing the retrofit approach common in earlier facility generations where monitoring equipment was added after initial installation. Bioreactor manufacturers increasingly design probe ports into standard product lines rather than treating them as a custom modification, and this native integration has meaningfully shortened installation timelines for biomanufacturers adopting Raman monitoring as part of a new facility build rather than a retrofit project. Vendors report this native integration approach now accounts for a growing share of new system orders.
Market Impact: Adds roughly 40 new facilities year

Market Opportunities and Growth Drivers

Continuous Manufacturing Adoption Requires Real-Time Monitoring

Biopharmaceutical manufacturers are steadily shifting from traditional batch processing toward continuous manufacturing approaches that require real-time process monitoring rather than periodic sampling, since continuous processes lack the natural pause points where batch-based sampling traditionally occurred. Industry association surveys show meaningful year-over-year growth in continuous manufacturing capacity commitments among major biopharmaceutical manufacturers, and each new continuous manufacturing line represents a near-mandatory Raman monitoring installation given the absence of practical alternative real-time monitoring approaches at comparable cost and reliability. Facility engineering teams increasingly treat this monitoring requirement as a fixed design constraint rather than an option.
Market Impact: Limits adoption to 50% of facilitie

Biosimilar and Biologics Manufacturing Capacity Expansion

Global biologics and biosimilar manufacturing capacity continues expanding as patent expirations open new competitive opportunities and demand for monoclonal antibody therapeutics keeps rising across multiple therapeutic areas. Industry capacity tracking shows meaningful new facility announcements across North America, Western Europe, and East Asia over the past several years, and each new facility represents a discrete instrument purchasing decision independent of any existing installed base a manufacturer might already operate elsewhere in its network. Each new facility decision is made independently of any prior vendor relationship the manufacturer might hold elsewhere.
Market Impact: Extends timelines by 18 months

Market Restraints and Challenges

Chemometric Modeling Expertise Gap Limits Broader Adoption

Developing a reliable calibration model for a specific bioprocess requires specialized chemometric expertise that many smaller biomanufacturers lack in-house, limiting adoption among facilities without dedicated process analytical technology teams. The root cause is that chemometric modeling remains a specialized discipline taught in relatively few academic programs, creating a talent bottleneck that constrains how quickly smaller manufacturers can build internal capability. Vendors are expanding modeling-as-a-service offerings and pre-validated calibration libraries to reduce this barrier for facilities without in-house expertise. This talent constraint is expected to ease only gradually as academic programs expand their own course offerings.
Market Impact: Shortens review by 4 months

High Capital Cost Slows Adoption at Smaller Manufacturers

A complete in-line Raman monitoring system with multiple probes and chemometric software commonly runs $80,000 to $140,000, a capital outlay that smaller contract manufacturers and early-stage biotechnology companies often cannot justify against competing capital priorities in the same budget cycle. The root cause is that the return-on-investment case rests primarily on regulatory risk reduction and process consistency benefits that are harder to quantify than a direct cost or revenue offset. Vendors are exploring leasing and instrument-as-a-service models to lower the upfront barrier for smaller facilities. Early data suggests these models lower the adoption barrier for facilities with tighter budgets.
Market Impact: Cuts installation time by 6 weeks
3 additional market trends, 4 additional growth drivers, and 3 additional restraints and challenges are covered in the full report. Contact sales@marketmindsadvisory.com to access the complete intelligence.

Segment CAGR and Growth Architecture

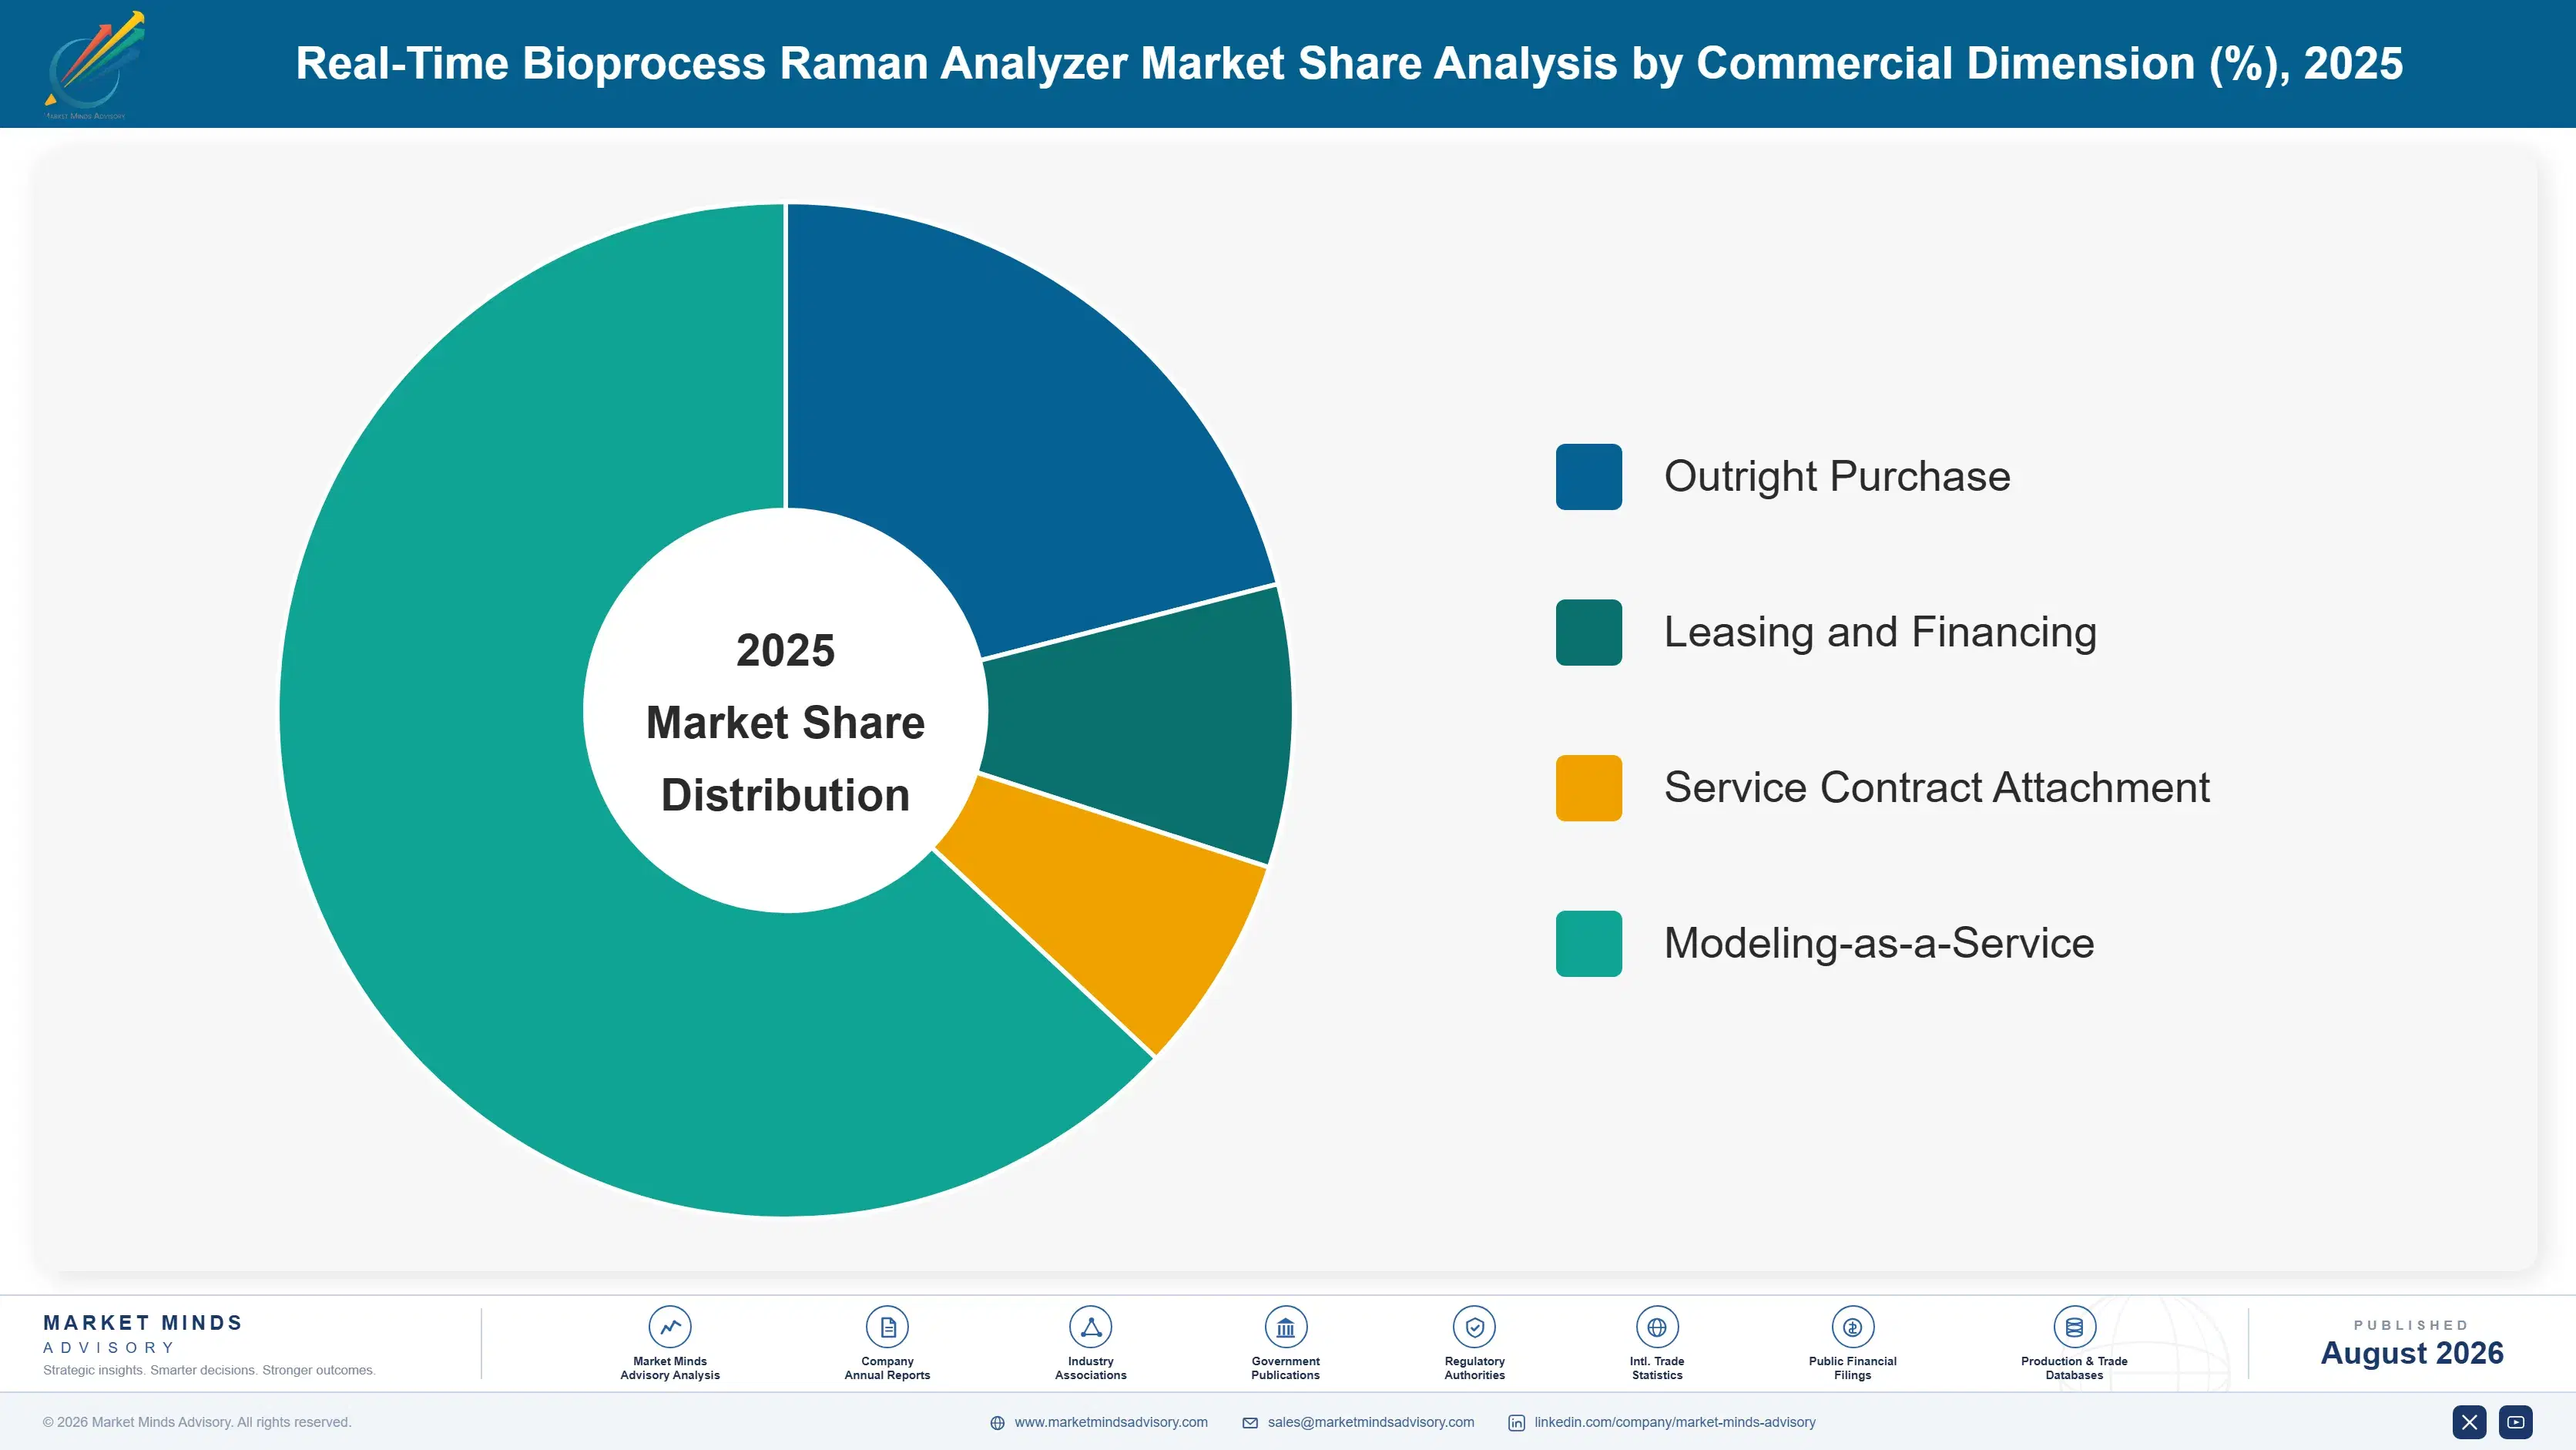
The market segments by deployment format and product type, spanning in-line, at-line, and off-line analyzers, sampling probes and accessories, and chemometric modeling software, since each format follows a distinct integration requirement and purchasing cycle across biomanufacturing facility settings. No single deployment format alone dominates purchasing decisions across every facility or manufacturing setting nationwide. today.
real-time-bioprocess-raman-analyzer-market-market-share-analysis-1787306718373

Chemometric Modeling Software

Chemometric modeling software is the fastest-growing segment as vendors increasingly bundle AI-enhanced calibration model development with hardware sales, reducing the specialized expertise historically required to build a reliable process-specific model from raw spectral data. Manufacturers have invested heavily in pre-validated calibration libraries covering common bioprocess types, addressing one of the most common reasons smaller biomanufacturers historically hesitated to adopt Raman monitoring over simpler alternative testing approaches. Vendors increasingly price this software as a recurring subscription layered on top of the hardware sale, and facilities that build their process history on one vendor's software platform face considerable switching costs, reinforcing the software vendor relationship well beyond the original instrument purchase and its typical multi-year hardware replacement cycle.
CAGR 15.0%

In-Line Raman Analyzers

In-line analyzers integrated directly into bioreactor systems are growing quickly as continuous manufacturing adoption expands and biomanufacturers increasingly specify this capability at the design stage of new facilities rather than retrofitting it later. Probe manufacturers have invested in improving sterilizability and single-use compatibility, addressing contamination risk concerns that limited earlier-generation in-line probe designs. Facility engineering teams increasingly treat in-line Raman capability as a standard specification for new bioreactor purchases rather than an optional add-on, reflecting how thoroughly this deployment format has moved from novel technology to expected infrastructure across new biomanufacturing capacity. Facility teams increasingly treat this configuration as standard infrastructure rather than a differentiated purchase decision. This shift keeps accelerating as more bioreactor makers adopt native probe design.
CAGR 13.5%
Full segment breakdown across 6 segments available in the complete report.

Regional Architecture and Country Demand Map

North America accounts for well over a third of global revenue, reflecting the deepest biomanufacturing capacity concentration anywhere, while South Asia and Pacific posts the fastest regional growth off a smaller existing base. Every region shows steady expansion, though pace varies by manufacturing infrastructure maturity.

North America

The United States carries the largest share of any market MMA tracks, a concentration well above the standard regional band that reflects the deepest concentration of biopharmaceutical manufacturing capacity and continuous processing adoption found anywhere globally. FDA guidance on process analytical technology has pushed several major biomanufacturers to retrofit existing facilities with in-line monitoring capability ahead of new product approvals. Canada's smaller biomanufacturing base keeps overall regional volume concentrated in the United States, though steady capacity investment continues there as well. New facility announcements across both countries increasingly specify in-line Raman capability at the design stage, reinforcing steady replacement and new-installation demand across most major markets tracked in this region.
Share: 37% | CAGR: 10.0% (2026 to 2036)

Western Europe

Germany and Ireland carry the largest share of regional demand, supported by dense biomanufacturing clusters built around major contract manufacturing organizations and established biopharmaceutical companies. The United Kingdom and Switzerland follow with steady demand tied to their own biomanufacturing capacity and strong academic research infrastructure. European Medicines Agency guidance on process analytical technology broadly mirrors FDA expectations, giving manufacturers a consistent regulatory rationale for instrument purchases across both major markets. Contract manufacturing organizations across the region increasingly specify in-line monitoring capability in new facility builds as a standard client expectation rather than an optional differentiator. Reimbursement and capital budget timelines here typically lag North American purchasing cycles by several months.
Share: 26% | CAGR: 9.5% (2026 to 2036)
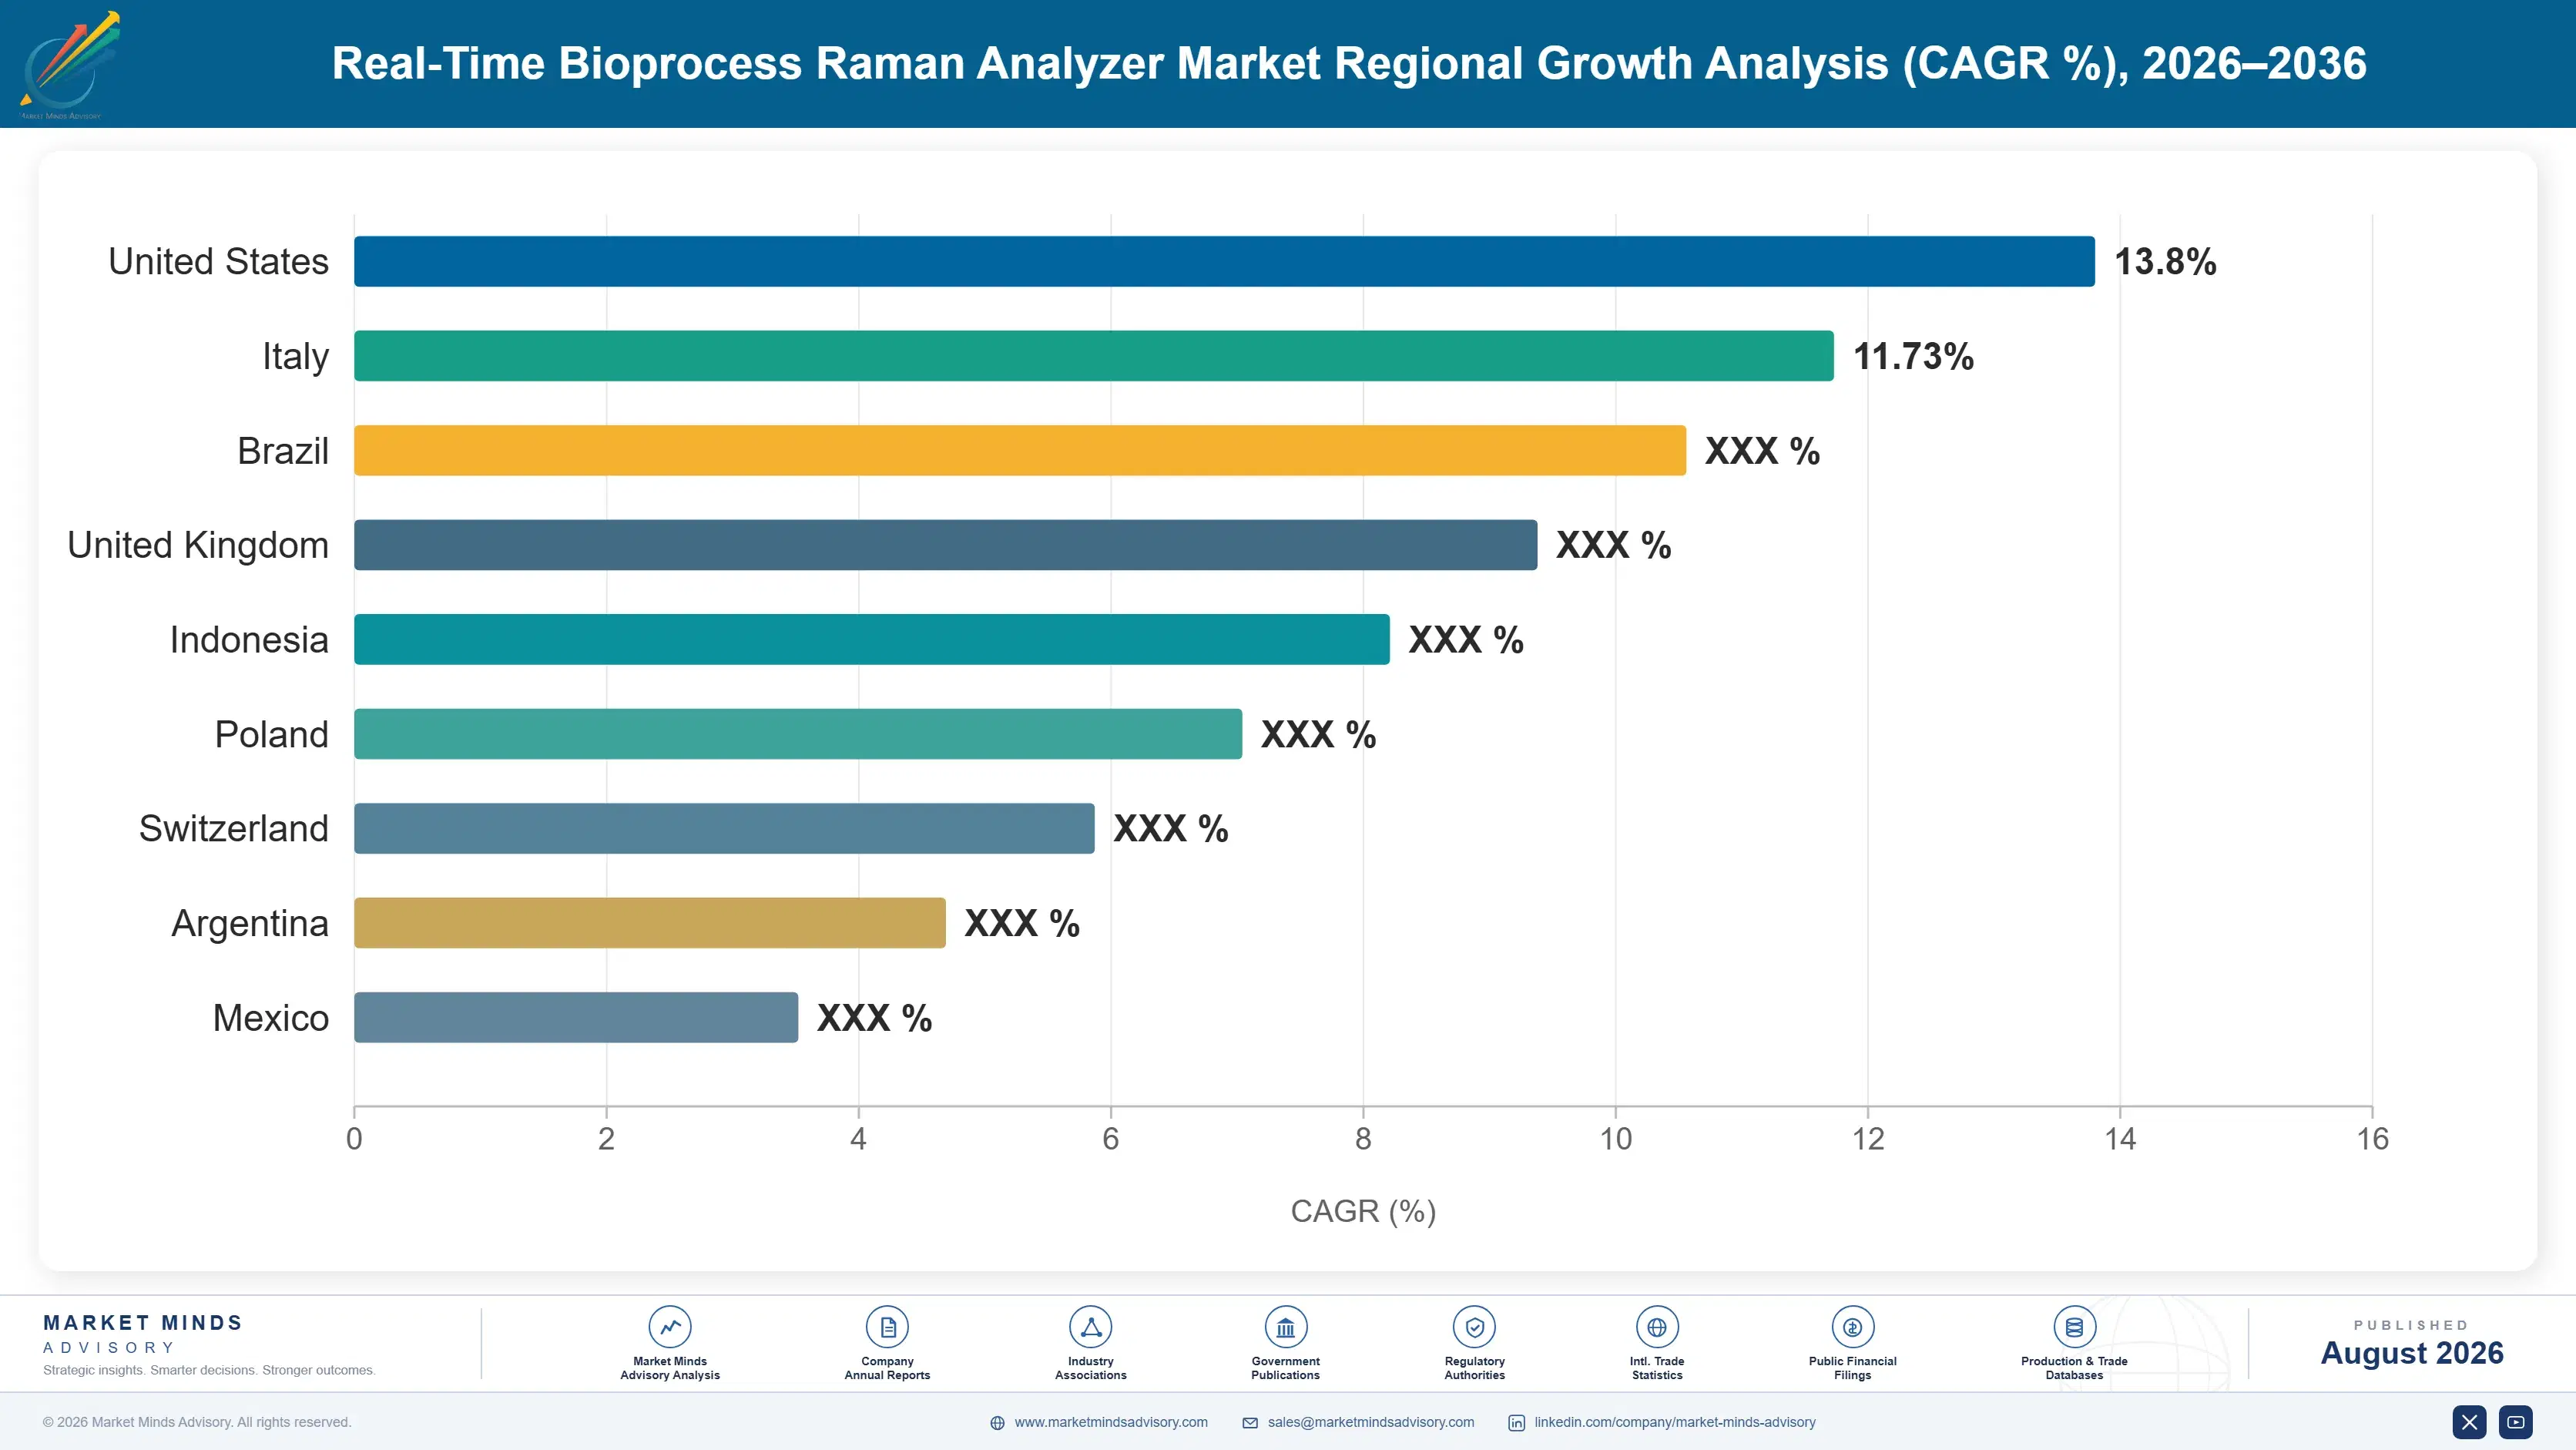
Regional intelligence for 5 additional markets available in the complete report: East Asia, South Asia and Pacific, Latin America, Middle East and Africa, Eastern Europe. Contact sales@marketmindsadvisory.com.
real-time-bioprocess-raman-analyzer-market-country-cagr-analysis-1787306718886

Where Instrumentation Makers Can Grow Margin

Beyond unit volume growth, vendors have several concrete paths to lift revenue per facility, spanning chemometric software subscriptions, service contract attachment, probe consumable replacement, and modeling-as-a-service offerings layered on top of the core instrument sale. None require heavy capital investment beyond routine software development and consulting staffing. Each applies broadly across facility relationships already engaged with the manufacturer.

Selling Chemometric Software as a Subscription

Vendors increasingly monetize chemometric modeling software as a recurring subscription layered on top of the hardware sale, typically priced between $8,000 and $18,000 annually per facility depending on the number of monitored process types. Facilities value continued model refinement and access to expanding calibration libraries enough to justify the ongoing fee, and once a facility builds its process history on one vendor's software platform, switching costs rise considerably, making the subscription a durable revenue stream that persists well beyond the original hardware purchase. Manufacturers report this premium window as the most profitable phase of a subscription's entire lifecycle.
Market Impact: Adds $8,000 to $18,000 annual reven

Attaching Multi-Year Service and Calibration Contracts

Vendors increasingly attach multi-year service and recalibration contracts to instrument sales, converting a one-time capital transaction into a recurring revenue relationship worth roughly 12 to 18% of the original equipment price annually. Facilities favor bundled service agreements because unplanned instrument downtime directly disrupts continuous manufacturing operations, creating strong incentive to prioritize uptime guarantees over marginal price savings from third-party calibration providers. Facilities favor bundled service agreements because unplanned downtime directly disrupts continuous manufacturing operations across the line. Vendors with the largest installed base capture disproportionate service revenue across their existing customer relationships.
Market Impact: Adds 12 to 18% recurring annual ser

Offering Modeling as a Service for Smaller Manufacturers

Vendors increasingly offer modeling-as-a-service engagements for smaller biomanufacturers lacking in-house chemometric expertise, converting a capability gap into a billable consulting revenue stream typically worth $25,000 to $60,000 per new process model developed. This service both lowers the adoption barrier for facilities that would otherwise defer Raman monitoring entirely and builds a durable advisory relationship that often leads to expanded hardware and software purchases as the facility's process portfolio grows. This service both lowers the adoption barrier and builds a durable advisory relationship over time. Manufacturers increasingly view this pathway as capital-efficient relative to broader marketing spend alone.
Market Impact: Adds roughly $25,000 to $60,000 per

Probe and Sampling Accessory Consumable Attachment

Single-use and sterilizable probe replacements represent a recurring consumable revenue stream distinct from the original instrument sale, since probes require periodic replacement due to wear and contamination risk in continuous bioprocessing environments. Vendors with the largest installed instrument base capture disproportionate consumable revenue simply by virtue of having more active monitoring points requiring replacement probes across their existing customer base, reinforcing scale advantages smaller competitors struggle to replicate. Vendors report probe replacement volume typically running 2 to 3 times annually per active monitoring point. This scale advantage compounds as more monitoring points require periodic replacement across the installed base.
Market Impact: Adds roughly $2,000 to $5,000 per p

Who Controls the Margin Pool

Five manufacturers hold 68% of global revenue, with Thermo Fisher and Endress+Hauser forming a clear leading pair whose combined instrumentation scale and chemometric software capability give them a durable gap over the next tier of challengers, including Bruker, Hamilton, and Repligen. None matches their combined instrumentation scale and chemometric software depth built over years of installed-base experience.
Current competitive activity centers on three dimensions: expanding pre-validated calibration libraries that lower the chemometric expertise barrier for smaller manufacturers, deepening single-use bioreactor integration partnerships with equipment manufacturers, and building modeling-as-a-service offerings that convert capability gaps into recurring consulting revenue. Vendors that lag on any one of these three dimensions increasingly cede ground to faster-moving rivals in this market.

Emerging pressure comes from specialized chemometric software startups that partner with established hardware vendors rather than competing directly on instrumentation, gaining ground fastest in the software layer where switching costs matter more than raw optical performance. Rankings among the established hardware leaders are unlikely to shift materially before 2030, but the software and modeling services layer is becoming considerably more contested territory. Several established hardware vendors have begun launching dedicated software partnership programs to defend that ground directly.
real-time-bioprocess-raman-analyzer-market-company-positioning-matrix-1787306719413

Competitive Moat and Risk Dimensions

THERMO FISHER SCIENTIFIC INC

Moat: Instrumentation Portfolio Breadth

Thermo Fisher's broad analytical instrumentation and bioprocessing portfolio gives its sales force existing relationships across nearly every biomanufacturing facility MMA tracks, letting it cross-sell Raman capability into accounts it already serves for other process equipment. That breadth lets Thermo Fisher defend account share against single-product specialists who must build relationships from scratch in every new facility.
THERMO FISHER SCIENTIFIC INC

Risk: Premium Pricing Exposure

Thermo Fisher's premium pricing position leaves it exposed as budget-constrained smaller manufacturers and contract organizations increasingly consider more focused specialists offering comparable core spectroscopy performance at meaningfully lower price points for facilities that do not need Thermo Fisher's full instrumentation portfolio. Regulatory harmonization has made this comparison increasingly straightforward for facility purchasing committees to evaluate.
ENDRESS+HAUSER GROUP

Moat: Process Instrumentation Integration Depth

Endress+Hauser's deep expertise in broader process instrumentation and control systems gives it integration credibility that pure spectroscopy specialists lack, letting it position Raman analyzers as part of a unified process control architecture rather than a standalone add-on instrument requiring separate integration work. This integration advantage lets Endress+Hauser compete for facility-wide control system contracts directly.
ENDRESS+HAUSER GROUP

Risk: Narrower Chemometric Software Depth

Endress+Hauser's chemometric software capability remains less mature than specialists focused primarily on spectroscopy data analysis, creating a feature gap that increasingly matters as facilities weigh software quality alongside hardware integration when making purchasing decisions for new monitoring capability. Facilities weighing software quality alongside integration increasingly favor competitors with stronger modeling capability.

Players Tracked

Prominent Players

Thermo Fisher Scientific Inc
Endress+Hauser Group
Bruker Corporation
Hamilton Company
Repligen Corporation

Other Key Players

Metrohm AG
Ocean Insight Inc
Tornado Spectral Systems Inc
Agilent Technologies Inc
B&W Tek Inc
Horiba Ltd
Wyatt Technology Corporation
Sartorius AG
Cytiva
Merck KGaA
PerkinElmer Inc
Mettler-Toledo International Inc
Malvern Panalytical Ltd
Optosky Photonics Inc
Danaher Corporation

Recent Developments

FEBRUARY 2026

Endress+Hauser Launches Expanded Calibration Library Platform

Endress+Hauser introduced an expanded pre-validated calibration library covering additional common bioprocess types, aimed at reducing the chemometric expertise required for smaller manufacturers to deploy Raman monitoring. The launch targeted contract manufacturing organizations first, with broader availability planned across the following fiscal year. Library validation data was published alongside the launch.
Signal: Pre-validated calibration libraries are qu
OCTOBER 2025

Thermo Fisher Acquires Chemometric Software Startup

Thermo Fisher completed the acquisition of a specialty chemometric modeling software startup focused on AI-enhanced calibration development for bioprocess applications. The deal brought advanced software capability in-house, expanding Thermo Fisher's digital offering considerably beyond its prior hardware-focused product line. Deal terms were not disclosed publicly by either company.
Signal: Chemometric modeling software is quickly b
MAY 2025

Hamilton Company Signs Multi-Year Bioreactor Integration Partnership

Hamilton Company entered a multi-year integration partnership with a leading single-use bioreactor manufacturer covering native probe port design across the manufacturer's full product line. The agreement was an integration partnership, not a joint venture or acquisition, covering design collaboration across the full multi-year term. Financial terms were not disclosed.
Signal: Multi-year, native integration partnership

Laser Diode and Detector Component Exposure

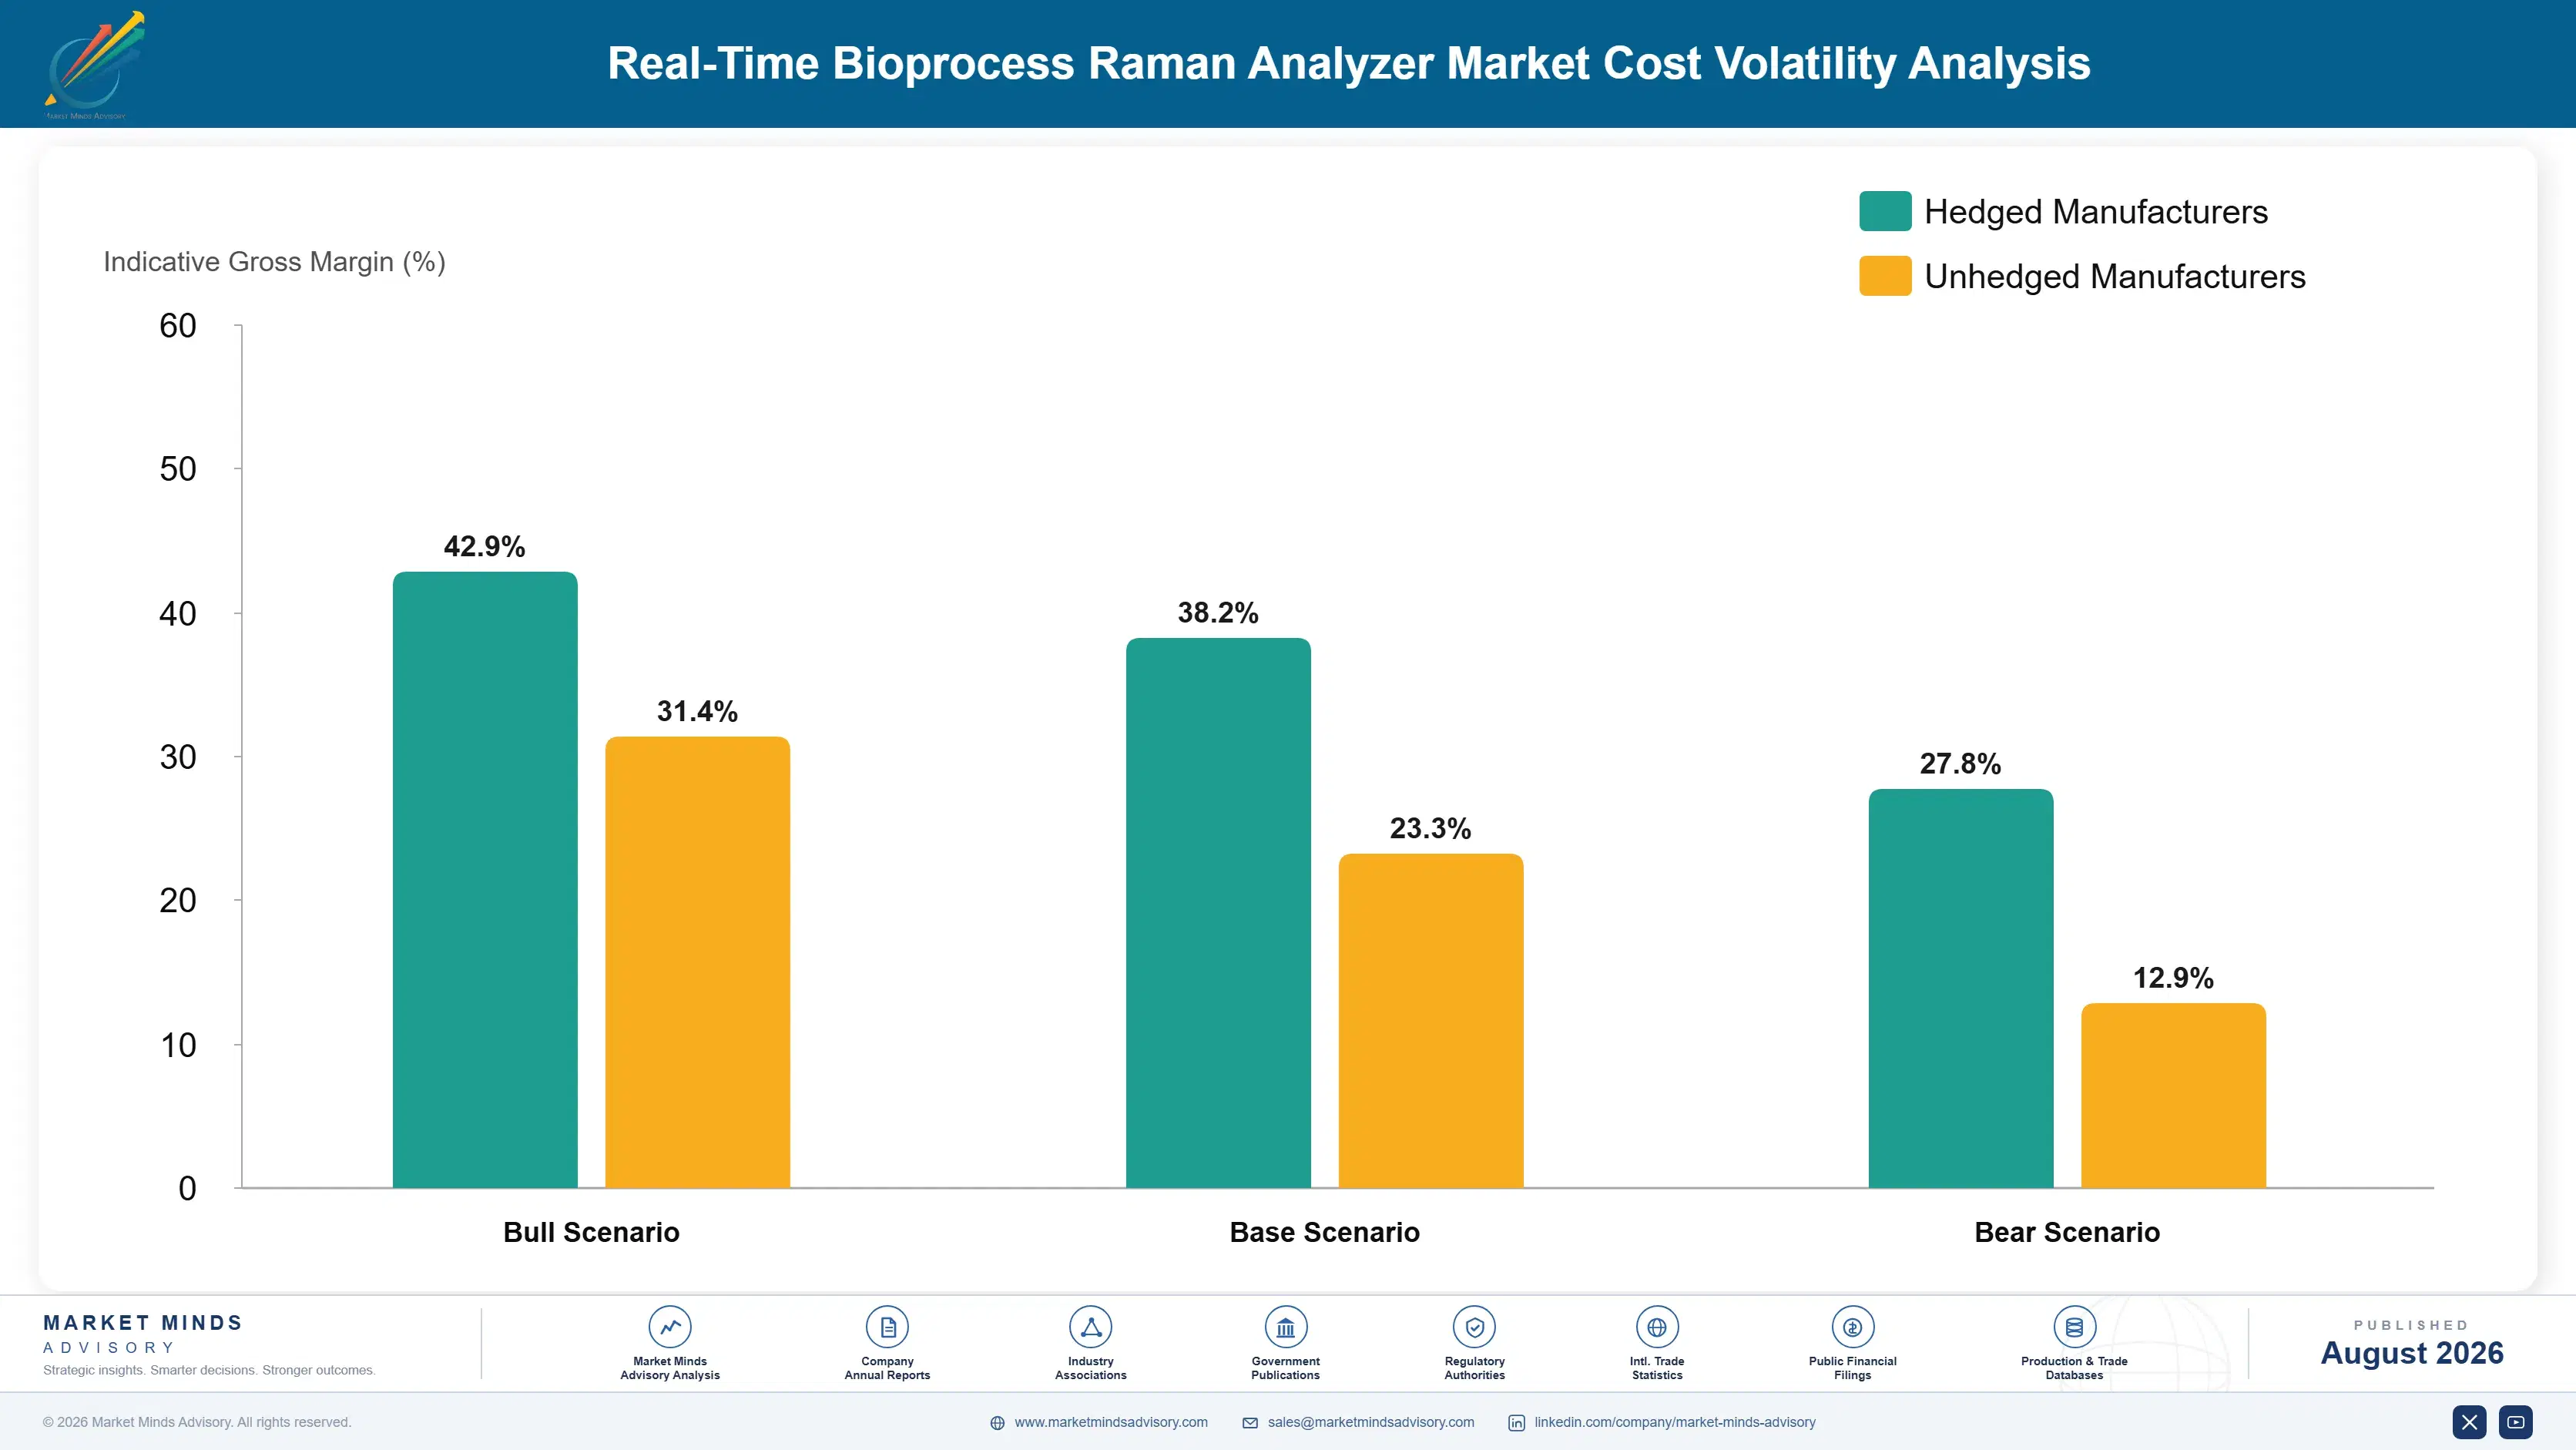
Laser diodes and detector components together represent roughly 22% of cost of goods sold for a complete Raman analyzer system, sourced predominantly from specialized photonics manufacturers concentrated in the United States, Germany, and Japan, with the highest-precision detector arrays sourced from an even smaller number of qualified global suppliers. Few alternate sourcing regions exist at comparable precision tolerances for these components.
The 2021 to 2022 global semiconductor shortage disrupted photonics component manufacturing broadly, with several manufacturers reporting extended lead times for laser diodes and detector arrays in company annual reports covering that period. The International Energy Agency's supply chain analysis of that period noted the shortage's disproportionate impact on specialized photonics manufacturers reliant on a concentrated supplier base not easily substituted on short notice. Manufacturers report continued monitoring of this supplier base given persistent trade risk.

Smaller manufacturers without long-term supply agreements or in-house photonics assembly capability bear considerably more exposure to price swings than the largest players, who can negotiate volume discounts and secure priority allocation during shortages. This dynamic reinforces the advantage already held by the leading five manufacturers, since a component shortage can delay a smaller competitor's shipments while the largest players continue fulfilling orders on schedule.
real-time-bioprocess-raman-analyzer-market-cost-volatility-analysis-1787306719610

Dual-Sourcing Laser Diode Suppliers

Larger manufacturers are qualifying second laser diode suppliers to reduce dependence on any single source, a step that adds qualification cost upfront but meaningfully reduces disruption risk during future shortages. Qualification cycles for precision laser diodes typically run twelve to eighteen months before volume production begins. Larger vendors with existing supplier ties tend to move faster through this process.

Long-Term Fixed-Price Component Supply Agreements

Several manufacturers have moved from spot purchasing to multi-year fixed-price agreements with photonics component suppliers, trading some pricing flexibility for supply certainty and predictable input costs across budget planning cycles. These agreements typically run three to five years before renegotiation begins. Vendors report these agreements have meaningfully smoothed quarterly input cost variance across recent years.

In-House Photonics Assembly Capability Investment

The largest manufacturers are investing in in-house photonics assembly capability to reduce reliance on external suppliers entirely for at least a portion of production volume, insulating margin from supplier-side price increases over a multi-year investment horizon smaller rivals generally cannot fund. This investment horizon typically spans four to six years before capacity comes fully online.

Portfolio Architecture for Margin Defence

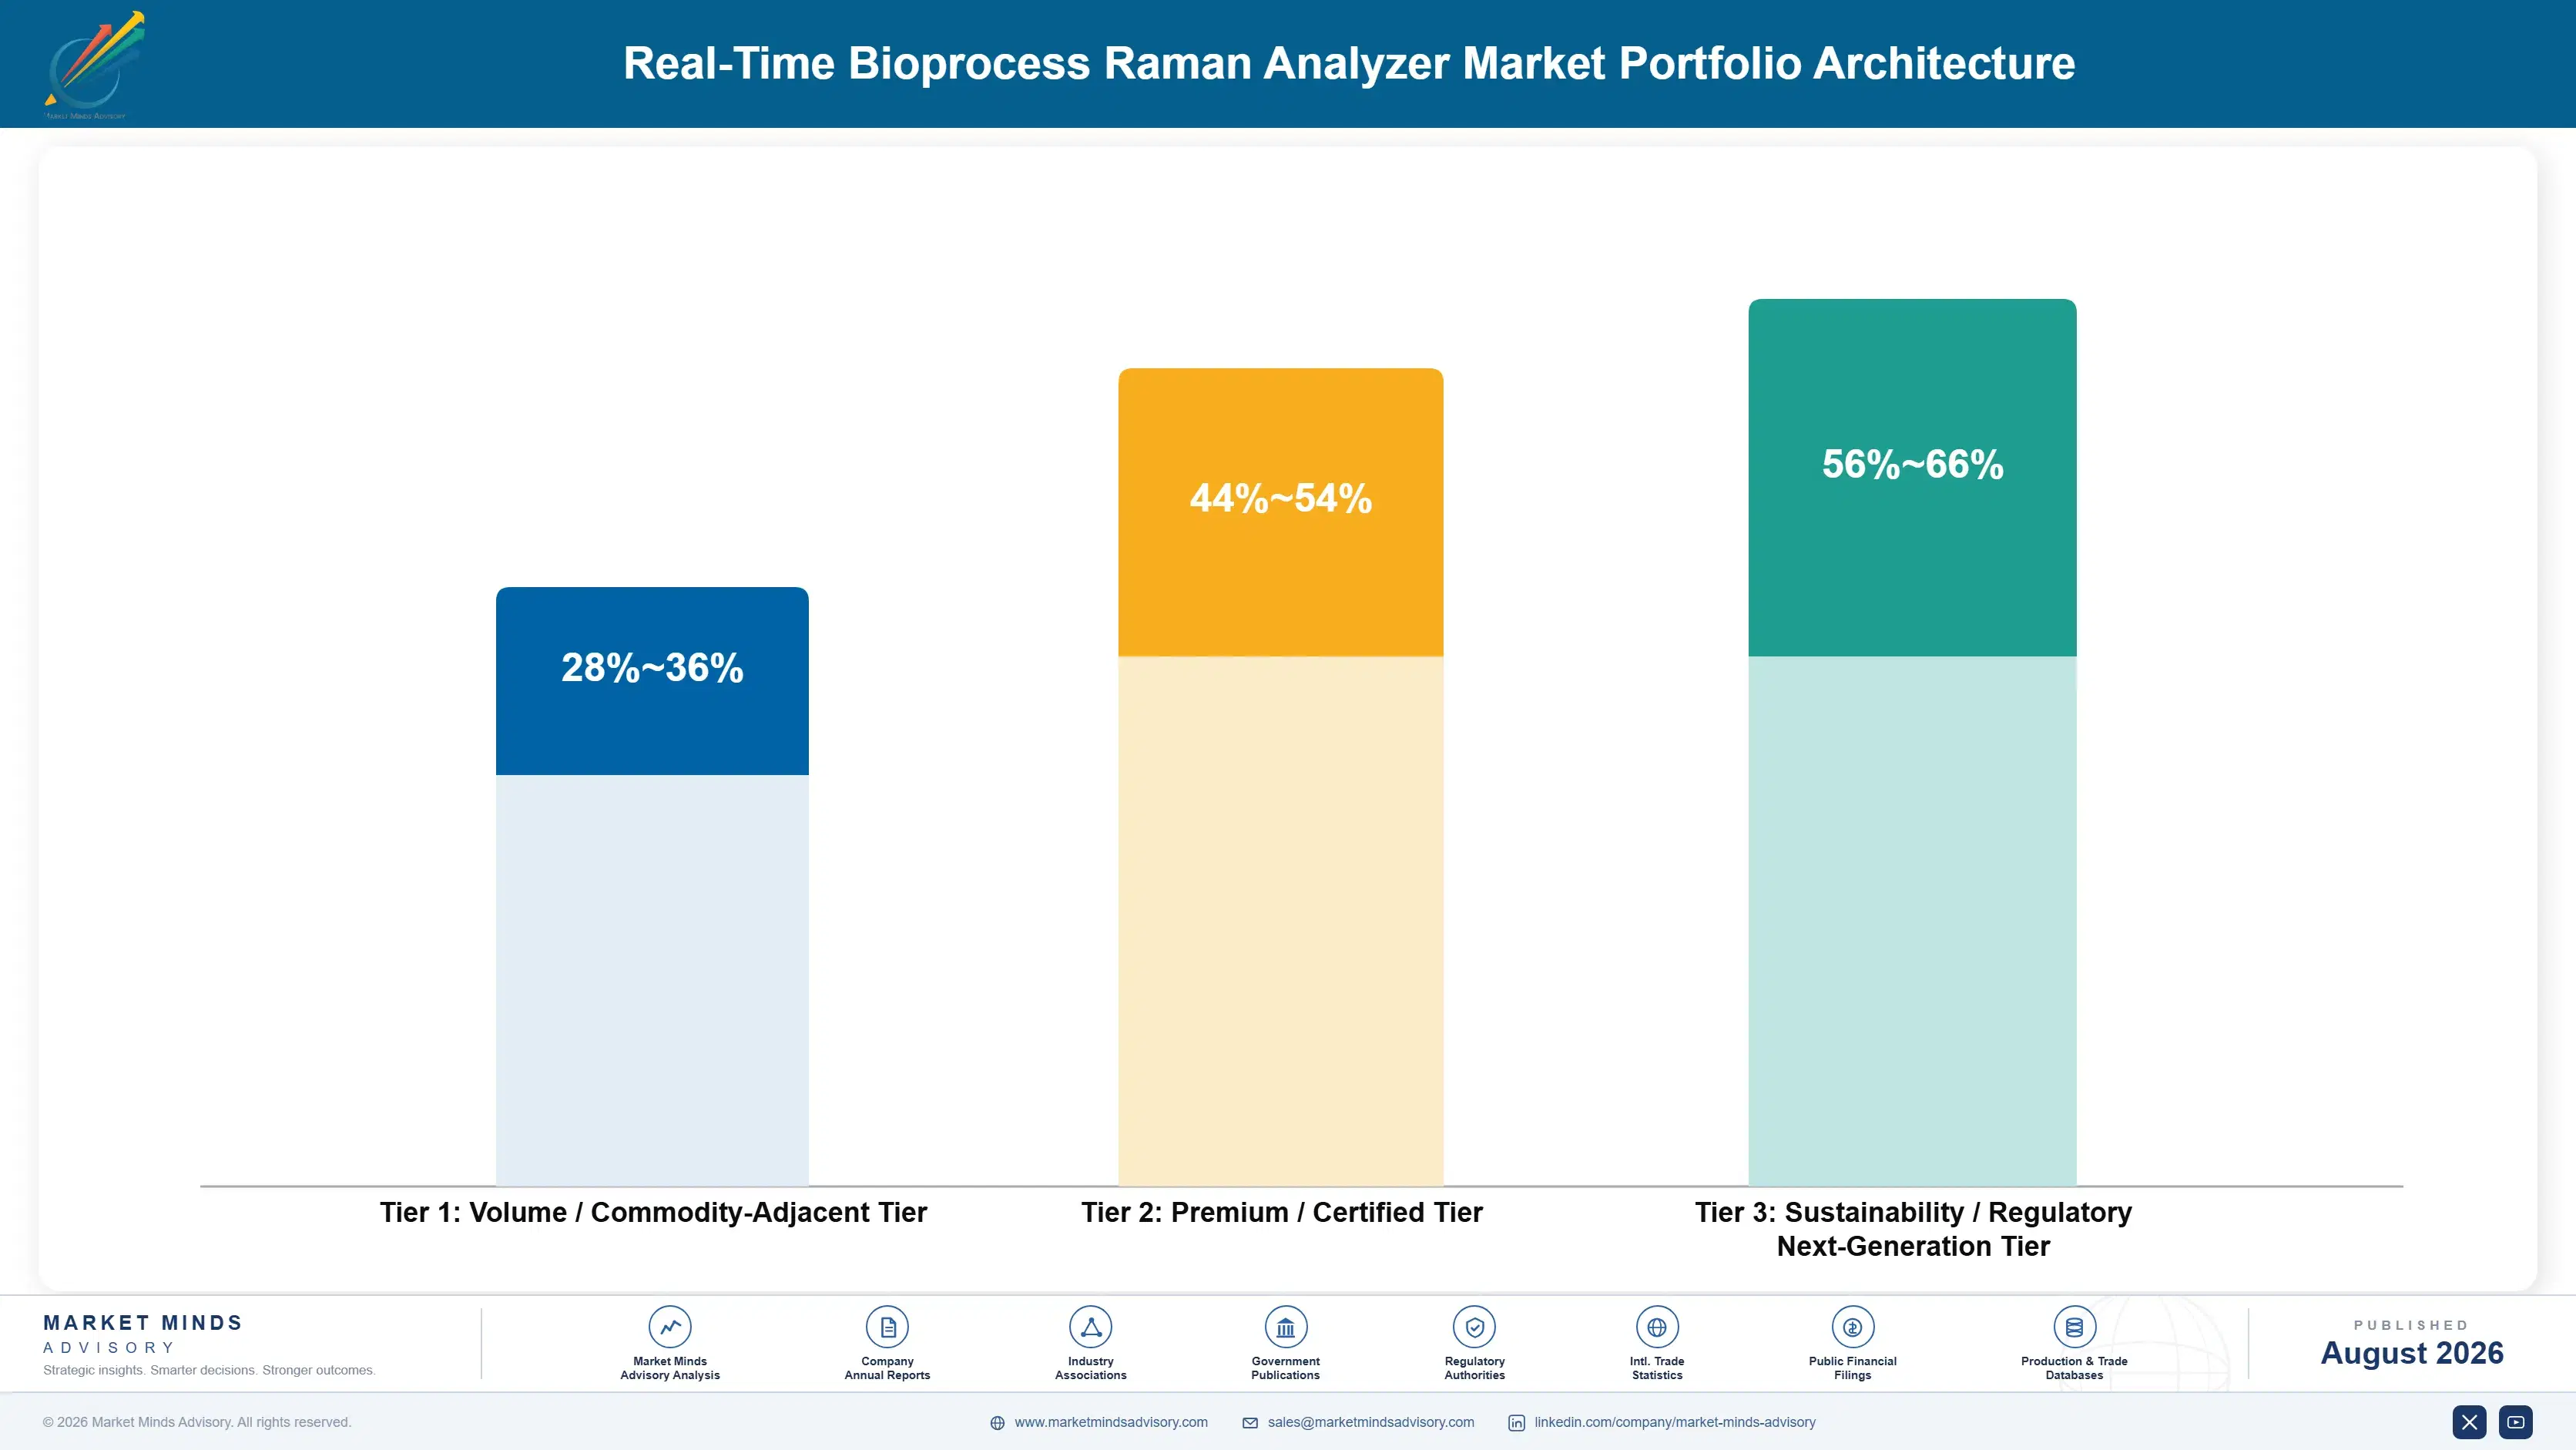
The market organizes into three tiers by deployment format and margin profile. Volume-tier off-line and at-line analyzers cover standard laboratory-based monitoring sold largely through established biomanufacturing relationships. Premium-tier in-line systems command meaningfully higher prices tied to continuous manufacturing integration and real-time control capability. A growing next-generation tier layers chemometric software subscriptions on top of the underlying in-line hardware sale entirel
Gross margins widen considerably moving up the tiers, since in-line systems carry disproportionate pricing power relative to their incremental manufacturing cost, while off-line analyzers compete primarily on price against a handful of established rivals. Facilities rarely trade back down once process engineering teams have grown accustomed to the real-time control in-line systems provide. Software revenue partially offsets this dynamic for manufacturers with the deepest existing installed hardware base.

High-value margin pools concentrate in in-line systems bundled with chemometric software subscriptions, where recurring digital revenue carries substantially wider margin than the underlying hardware sale that first brought the facility into a vendor's broader relationship. That gap is likely to widen further as in-line adoption matures and software attach rates climb across the base. Manufacturers positioned early stand to capture disproportionate share of this pool.

Volume / Commodity-Adjacent Tier

Off-line and at-line laboratory-based analyzers sold largely through established biomanufacturing relationships, competing primarily on price with limited room for premium differentiation beyond basic spectral resolution. Established relationship pricing determines most of the margin outcome for this tier's vendors.
Gross Margin: 28-36%

Premium / Certified Tier

In-line analyzers integrated directly into bioreactor systems carrying stronger continuous manufacturing credentials and integration support, commanding meaningfully wider margins than off-line equivalents. Facilities increasingly view these as the appropriate default for new continuous manufacturing lines.
Gross Margin: 44-54%

Sustainability / Regulatory / Next-Generation Tier

In-line systems paired with AI-enhanced chemometric modeling software subscriptions, representing the newest category and commanding the highest margins in the market given their recurring software revenue. Vendors are racing to expand this offering as software demand continues climbing steadily.
Gross Margin: 56-66%
real-time-bioprocess-raman-analyzer-market-portfolio-architecture-1787306720112

High-value Sub-segments and Strategic Watch-out

In-Line Systems With Chemometric Software Subscriptions

In-line systems paired with chemometric software subscriptions combine the category's fastest growth with its widest margins, drawing concentrated vendor investment as facilities increasingly demand pre-validated calibration models to reduce their own internal expertise requirements. MMA expects vendor investment here to keep climbing steadily through 2036 nationally.
Gross Margin: 58-68%

Modeling-as-a-Service Consulting Engagements

Modeling-as-a-service consulting engagements deliver strong recurring revenue growth as smaller manufacturers without in-house chemometric expertise turn to vendors for calibration model development, supported by rising continuous manufacturing adoption across most major markets. Growth should persist as smaller manufacturers continue turning to vendors for support globally.
Gross Margin: 48-58%

Standard Off-Line Laboratory Analyzers

Standard off-line analyzers remain the category's volume backbone across established biomanufacturing relationships worldwide, competing on price that leaves thin margins and limited room for feature differentiation beyond basic spectral resolution. Consolidation among smaller manufacturers looks likely as scale becomes key to survival. across most account types globally.
Gross Margin: 26-34%

Legacy Retrofit-Only Installation Projects

Legacy retrofit-only installation projects warrant monitoring as native bioreactor integration becomes the default configuration, a dynamic that could compress this once-standard installation path considerably faster than smaller integrators currently plan for in their own strategies. Vendors that diversify into native integration formats early could offset this segment's continued softness.
Gross Margin: 22-30%

Service Contracts and Facility Depth

Instruments generate recurring revenue well beyond the initial hardware sale through service contracts, probe consumable replacement, and increasingly through chemometric software subscriptions, giving vendors an annuity-like revenue stream that persists across the instrument's full seven-to-nine-year operating life rather than ending at the point of sale. That recurring revenue stream typically compounds further as facilities add software and service layers over time.
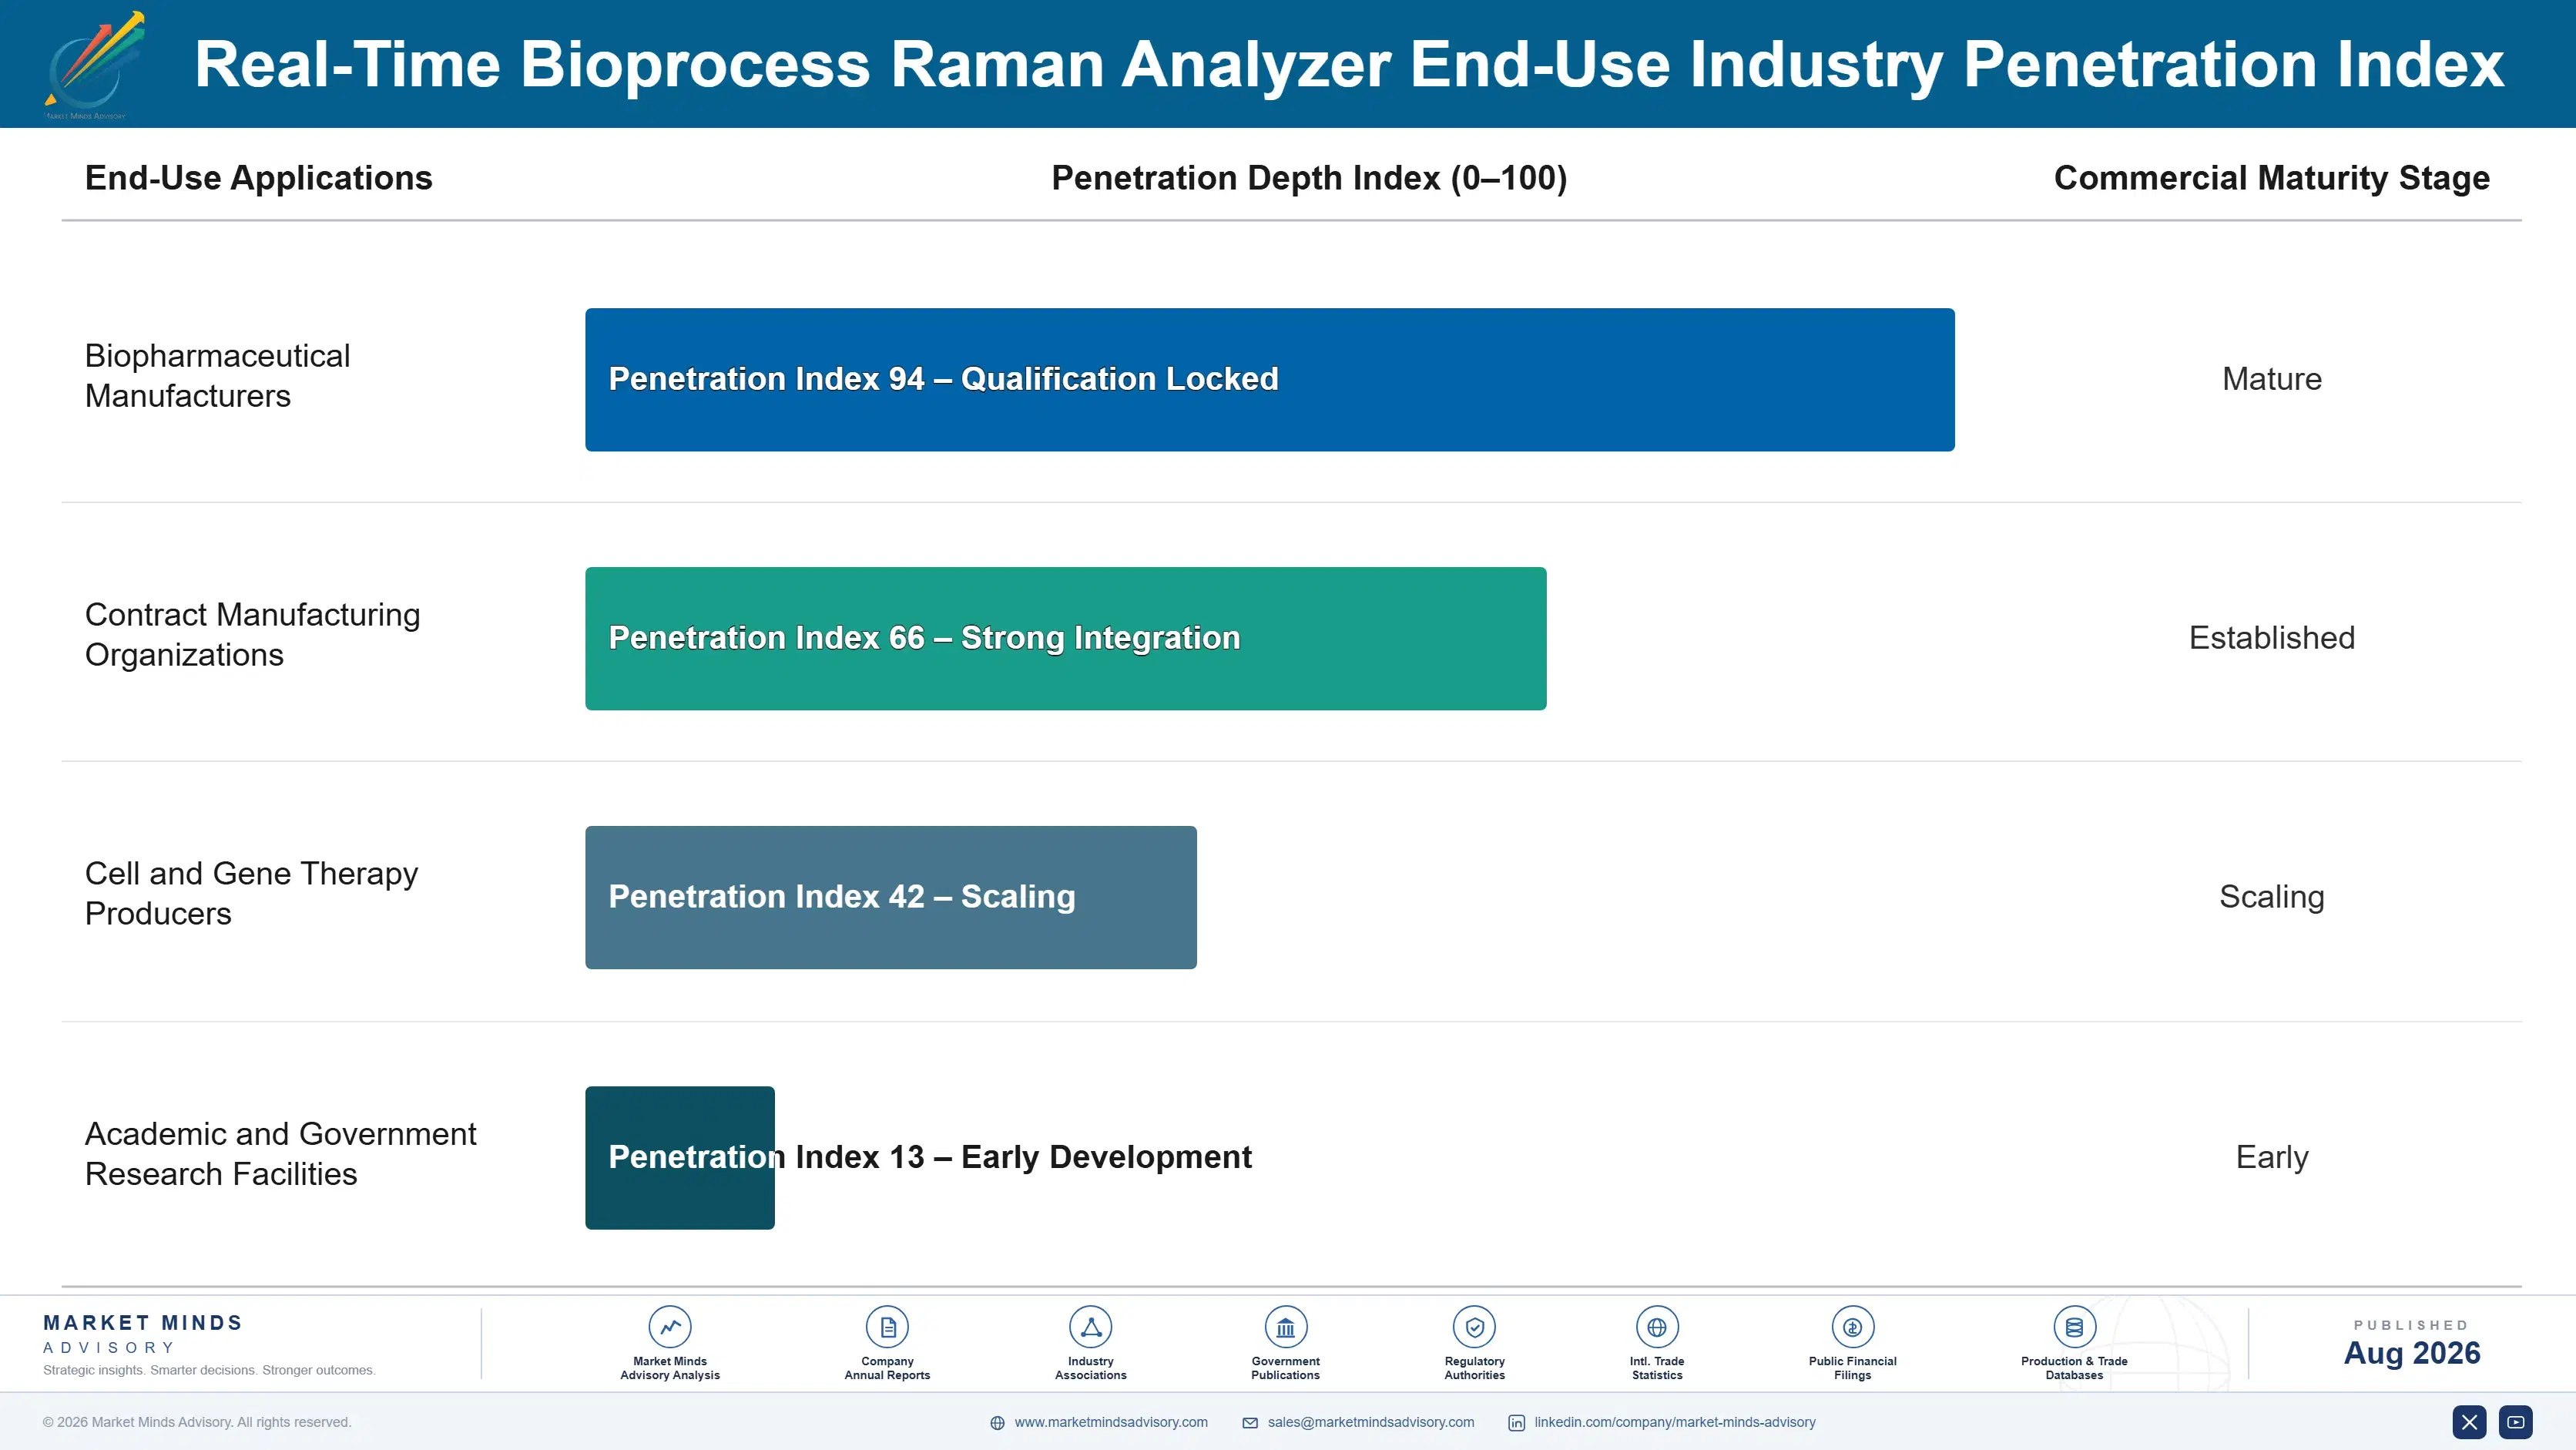
Adoption depth varies considerably by end-use vertical. Large multinational biopharmaceutical manufacturers adopt in-line capability fastest and often serve as reference sites vendors use to influence broader industry purchasing patterns, while smaller contract manufacturers and biotech startups typically wait for modeling-as-a-service options before committing to Raman monitoring at meaningful scale. Contract manufacturers sit closer to smaller biotech startups than to large multinationals in speed of adoption.

Buyer profiles are shifting generationally as younger process engineers who trained during the continuous manufacturing era show far greater comfort specifying in-line monitoring at the design stage than an older cohort that historically defaulted to end-of-batch testing before considering real-time alternatives. This generational shift is accelerating specification changes at the fastest-moving engineering training programs worldwide. and beyond across most established training institutions nationwide.
real-time-bioprocess-raman-analyzer-market-end-use-penetration-index-1787306720606

Positioning for the Continuous Manufacturing Shift

These are among the four positions where our research anticipates prominent divergence between winners and laggards over the coming forecast period. Each is grounded in the demand model, the regulatory perimeter, and the announced capacity pipeline.
01 / IN-LINE INTEGRATION STRATEGY

Vendors without native bioreactor integration will lose share to faster-moving rivals

In-line analyzers integrated directly into bioreactor systems command meaningfully higher pricing and adoption momentum than off-line alternatives, and vendors without native integration partnerships risk losing consideration entirely as continuous manufacturing becomes the default configuration for new facilities. This gap is widening as more bioreactor manufacturers design probe ports into standard product lines, and delayed action here carries real commercial cost. Companies that close this gap early stand to capture disproportionate share of new facility installations before rankings solidify further., and delayed integration investment compounds this gap further each fiscal quarter.
02 / CHEMOMETRIC SOFTWARE DEPTH

Calibration library breadth will separate margin leaders from hardware-only sellers

Vendors increasingly bundle pre-validated calibration libraries with hardware sales rather than selling either separately, and manufacturers without competitive chemometric software risk losing account share to competitors offering a fuller platform relationship. This shift is accelerating as more facilities demand reduced in-house expertise requirements, and delayed software investment carries real commercial cost. Companies that build this capability early stand to capture disproportionate share of the total facility budget., and delayed software investment carries meaningful commercial cost as calibration libraries grow more differentiated.
03 / MODELING SERVICES INVESTMENT

Modeling-as-a-service will open access for smaller manufacturers otherwise unable to adopt

Smaller biomanufacturers without in-house chemometric expertise represent a meaningful underserved market, and vendors offering modeling-as-a-service engagements convert this capability gap into both new adoption and recurring consulting revenue. This opportunity is widening as continuous manufacturing adoption spreads beyond the largest multinational manufacturers, and delayed investment in service capability carries real commercial cost. Companies that build this capability early stand to capture disproportionate share of this underserved segment., and delayed service investment carries meaningful commercial cost as this underserved segment keeps expanding.
04 / CONSUMABLE ATTACHMENT DEPTH

Probe replacement and service contract attachment will separate recurring revenue leaders

Probe consumable replacement and multi-year service contracts now carry meaningfully wider margins than the underlying hardware sale, and vendors with the largest installed instrument base capture disproportionate recurring revenue simply by virtue of having more active monitoring points requiring replacement. Manufacturers that treat the hardware sale as the primary transaction rather than the entry point into a longer recurring relationship will find their margin profile lagging competitors who prioritize attachment rates. That gap widens further for manufacturers slow to build dedicated consumable and service revenue programs.

Engagement Snapshot From the Field

A live engagement with an industry participant carrying material or product regulatory and market exposure ahead of a defining policy shift, showing how our research translates into a defensible multi-year portfolio strategy.
MARKET MINDS ADVISORY · CLIENT ENGAGEMENT SUMMARY
Real-Time Bioprocess Raman Analyzer Producer Strategic Portfolio Review and Transition Roadmap 2026·Investment Scenario on Real-Time Bioprocess Raman Analyzer Exposure Evaluation 2025-26
CLIENT PROFILE
The client is a regional contract biomanufacturing organization operating three facilities across the northeastern United States, serving approximately twelve biopharmaceutical clients across monoclonal antibody and cell therapy production. The organization reported approximately $410 million in annual revenue (client-reported, unverified by MMA) and had relied primarily on end-of-batch laboratory testing across its existing production lines. Its production network has grown steadily as client demand for biologics manufacturing has increased.
STRATEGIC CHALLENGE
The organization faced growing client requests for real-time process data as part of larger biopharmaceutical companies' own regulatory submissions, and leadership lacked clear data on whether investing in in-line Raman monitoring would meaningfully improve client retention relative to the upfront capital and chemometric expertise investment required. Leadership needed clear data before committing scarce capital to new instrumentation and modeling expertise.
MMA APPROACH
MMA benchmarked client retention and new business win rates at peer contract manufacturers with existing in-line monitoring capability against the client's current end-of-batch testing baseline, incorporating chemometric modeling-as-a-service cost estimates from three leading vendors. The analysis modeled projected outcomes over a five-year forward planning horizon under two adoption scenarios. Interviews with process engineering staff supplemented the desk-based competitive and financial analysis.
KEY FINDINGS
  1. Peer contract manufacturers with in-line monitoring capability won meaningfully more new client contracts than those relying on batch testing alone. This pattern held consistently across every comparable facility MMA reviewed in the benchmarking exercise.
  2. Modeling-as-a-service engagement costs were considerably lower than building equivalent in-house chemometric expertise from scratch. This finding removed the largest source of leadership hesitation around the modeling investment.
  3. Two of the organization's largest existing clients had already indicated preference for facilities with real-time monitoring capability. This signal strengthened the case for immediate action ahead of upcoming client contract renewals.
  4. Installation timelines using native bioreactor integration were meaningfully shorter than retrofitting the organization's existing equipment. Faster installation timelines meaningfully reduced the disruption risk to ongoing production schedules.
CLIENT PROFILE
The client is a regional contract biomanufacturing organization operating three facilities across the northeastern United States, serving approximately twelve biopharmaceutical clients across monoclonal antibody and cell therapy production. The organization reported approximately $410 million in annual revenue (client-reported, unverified by MMA) and had relied primarily on end-of-batch laboratory testing across its existing production lines. Its production network has grown steadily as client demand for biologics manufacturing has increased.
STRATEGIC CHALLENGE
The organization faced growing client requests for real-time process data as part of larger biopharmaceutical companies' own regulatory submissions, and leadership lacked clear data on whether investing in in-line Raman monitoring would meaningfully improve client retention relative to the upfront capital and chemometric expertise investment required. Leadership needed clear data before committing scarce capital to new instrumentation and modeling expertise.
MMA APPROACH
MMA benchmarked client retention and new business win rates at peer contract manufacturers with existing in-line monitoring capability against the client's current end-of-batch testing baseline, incorporating chemometric modeling-as-a-service cost estimates from three leading vendors. The analysis modeled projected outcomes over a five-year forward planning horizon under two adoption scenarios. Interviews with process engineering staff supplemented the desk-based competitive and financial analysis.
KEY FINDINGS
  1. Peer contract manufacturers with in-line monitoring capability won meaningfully more new client contracts than those relying on batch testing alone. This pattern held consistently across every comparable facility MMA reviewed in the benchmarking exercise.
  2. Modeling-as-a-service engagement costs were considerably lower than building equivalent in-house chemometric expertise from scratch. This finding removed the largest source of leadership hesitation around the modeling investment.
  3. Two of the organization's largest existing clients had already indicated preference for facilities with real-time monitoring capability. This signal strengthened the case for immediate action ahead of upcoming client contract renewals.
  4. Installation timelines using native bioreactor integration were meaningfully shorter than retrofitting the organization's existing equipment. Faster installation timelines meaningfully reduced the disruption risk to ongoing production schedules.
RECOMMENDED STRATEGY
Phase 1: Phase 1 (Months 1-3): Complete vendor evaluation and modeling-as-a-service partner selection across all three facilities. under close coordination with finance and operations leadership. Phase 2: Phase 2 (Months 4-8): Install in-line monitoring capability at the facility serving the largest client accounts first. with client feedback collected throughout the pilot phase. Phase 3: Phase 3 (Months 9-14): Expand installation to the remaining two facilities based on initial client feedback. with ongoing client retention monitoring built in.
OUTCOME
The organization installed in-line Raman monitoring across all three facilities using a modeling-as-a-service partnership for initial calibration development. Projected annual revenue growth from new client wins reached approximately $7.2 million (client-reported, unverified by MMA) against the prior testing baseline across the organization's full production network.

Frequently Asked Questions

Foundational context covering the market sizes, CAGR, scope, country, region and competition that inform every finding below. This section is provided to cover basics and most often pre-purchase conversations, answered from the MMA Primary Research Dataset.

What is the current size of the Real-Time Bioprocess Raman Analyzer Market?

The Real-Time Bioprocess Raman Analyzer Market was valued at approximately $0.62 billion globally in 2025. This includes in-line, at-line, and off-line analyzers along with chemometric modeling software.

How large will the Real-Time Bioprocess Raman Analyzer Market be by 2036?

The market is projected to reach approximately $1.95 billion by 2036, roughly 2.84 times its 2026 value. Growth is driven by continuous manufacturing adoption and expanding process analytical technology guidance.

What is the CAGR for the Real-Time Bioprocess Raman Analyzer Market 2026 to 2036?

The base case CAGR is 11.0% annually, with a bull case of 12.4% and a bear case of 9.6%. This reflects steady regulatory momentum alongside expanding continuous manufacturing capacity.

Which segment is growing fastest?

Chemometric modeling software is the fastest-growing segment, expanding at roughly 15.0% annually. Vendors increasingly bundle AI-enhanced calibration development directly with their own existing hardware sales.

Who are the major companies in the Real-Time Bioprocess Raman Analyzer Market?

Leading companies include Thermo Fisher Scientific, Endress+Hauser, Bruker, Hamilton, and Repligen. Together these five manufacturers hold 68% of global revenue in a moderately concentrated field.

Which country is growing fastest?

China is the fastest-growing country, expanding at roughly 13.0% annually through 2036. This reflects rapidly expanding biomanufacturing capacity investment and export market regulatory requirements nationwide.

Report Segmentation Architecture

The full report scope spans multiple orthogonal segmentation dimensions, with cross-tabulated demand data provided for each dimension pair. Coverage extends further to regional breakdowns, trend trajectories, and the competitive detail needed to support segment-level decision-making.

By Deployment Format and Product Type

  • In-Line Raman Analyzers
  • At-Line Raman Analyzers
  • Off-Line Laboratory Analyzers
  • Raman Probes and Sampling Accessories
  • Chemometric Modeling Software
  • Single-Use Bioreactor-Integrated Systems

By End-Use Industry

  • Biopharmaceutical Manufacturers
  • Contract Manufacturing Organizations
  • Cell and Gene Therapy Producers
  • Academic and Government Research Facilities

By Commercial Dimension

  • Outright Purchase
  • Leasing and Financing
  • Service Contract Attachment
  • Modeling-as-a-Service

By Region

  • North America
  • Western Europe
  • East Asia
  • South Asia and Pacific
  • Latin America
  • Middle East and Africa
  • Eastern Europe

Scope, Methodology, and Coverage

Every figure in this report is reproducible from documented input assumptions. The scope below maps the historical period, the forecast horizon, the segmentation dimensions, and the countries covered, alongside the underlying primary and qualitative methodology.
Historical Period
2020 to 2025
Forecast Period
2026 to 2036
Base Year
2025 (USD billions; MMA Primary Research Dataset, August 2026)
Market Definition
The Real-Time Bioprocess Raman Analyzer Market covers in-line, at-line, and off-line Raman spectroscopy instruments, sampling probes, and chemometric modeling software used to monitor biopharmaceutical manufacturing processes in real time. It excludes general laboratory Raman microscopy systems and mass spectrometry instrumentation sold as separate product categories.
Quantitative Units
USD billions (current prices); unit shipment volume where applicable
Segmentation Dimensions
By Deployment Format and Product Type; By End-Use Industry; By Commercial Dimension; By Region
Regions Covered
North America, Western Europe, East Asia, South Asia and Pacific, Latin America, Middle East and Africa, Eastern Europe
Countries Covered
USA, China, Germany, France, UK, Japan, South Korea, India, Australia, Canada, Brazil, Mexico, Indonesia, Vietnam, Thailand, Malaysia, UAE, Saudi Arabia, South Africa, Nigeria, Turkey, Poland, Netherlands, Italy, Spain, Sweden, Switzerland, Argentina, Colombia, Singapore, and additional markets relevant to this sector
Key Companies Profiled
Thermo Fisher Scientific Inc, Endress+Hauser Group, Bruker Corporation, Hamilton Company, Repligen Corporation, Metrohm AG, Ocean Insight Inc, Tornado Spectral Systems Inc, Agilent Technologies Inc, B&W Tek Inc, Horiba Ltd, Wyatt Technology Corporation, Sartorius AG, Cytiva, Merck KGaA, PerkinElmer Inc, Mettler-Toledo International Inc, Malvern Panalytical Ltd, Optosky Photonics Inc, Danaher Corporation
Quantitative Methodology
Primary survey, n=3,800 respondents, Q4 2025, six countries; demand-side model with trade association cross-validation
Qualitative Methodology
47 expert interviews, Q4 2025; applied to validate demand model assumptions, identify emerging dynamics, and assess competitive positioning
Report Format
PDF and XLSX data workbook (Word format preview document)
Publisher
Market Minds Advisory
Report Code
MMA-2026-CHM-140
Published
August 2026
Contact
sales@marketmindsadvisory.com | www.marketmindsadvisory.com

Purchase the full Real-Time Bioprocess Raman Analyzer Market Report (2026 to 2036).

The full report delivers detailed segmentation across all six deployment format and product categories, with country-level sizing for all thirty-one covered markets. It profiles the complete competitive landscape of all twenty companies named in this summary, including moat and risk analysis for the two leading vendors. Multi-year forecast models are provided under base, bull, and bear scenarios. Primary survey data drawn from process engineers, chemometric specialists, and biomanufacturing procurement executives across six countries supports every major finding, and purchasers receive editable data files alongside the formatted report.
In-line versus off-line adoption benchmark tracker
Chemometric software subscription pricing comparison model
New biomanufacturing facility announcement tracker monitor
Bioreactor integration partnership tracking database model
Modeling as a service engagement cost benchmark
Competitive benchmarking across key instrumentation vendors

Built For The People Who Decide

From boardroom strategy to bench-side execution, this report is read cover-to-cover by leaders shaping the next decade of their industry, turning demand scenarios, market dynamics and valuation benchmarks into decisions.
CXOs/ Presidents/ VPs/ Managers
M&A and Corporate Development
Strategy Teams and R&D Heads
Procurement and Product Directors
Regulatory and Compliance Leaders
Investor Relations and Equity Analysts