Market Minds Advisory
Ready-made Food Bases Market

Ready-made Food Bases Market: Ready-made Food Bases Market. Foodservice Consolidation, Hot Pot Bases and Ingredient Cost Pressure

Ready-made food bases are moving from restaurant back kitchens into retail pouches and ghost kitchens, with hot pot and curry pastes leading, yet spice and oil costs and sodium rules decide which makers protect margin.

Lead Analyst

Published

September 2026

Make Smarter Decisions with Customized Research Insights

Request a free sample report and evaluate market opportunities, growth trends, and competitive dynamics relevant to your business needs.

2025 MARKET VALUE$9.2BMarket Size 2025
2036 FORECAST VALUE$17.8BBase Case , 2026 to 2036
CAGR 2026 TO 20366.2 %Bull 7.5% / Bear 4.9%
INCREMENTAL OPPORTUNITY$8.1BNet 10- year value creation
EXPANSION MULTIPLE1.82x2036 value over 2026 base
Strategic Levers
M&A Pipeline
Regional Outlook
Country Rankings
Competitive Intelligence
Segmental Deep-dive
Call-Us : 91 93563 13602

Executive Snapshot and Market Trajectory.

Ready-made food bases are concentrated pastes, pouches and blends of vegetables, spices, oils and stock that give cooks a finished flavour foundation for curries, soups, stir-fries and sauces. Restaurants use them to cut labour, and shoppers use them to skip preparation. Consistency, not novelty, wins accounts.
Plant-Based and Clean-Label Bases grow fastest as brands remove additives and animal-derived stock, while curry, hot pot and soup bases still carry the largest sales. East Asia leads because Chinese hot pot and compound seasoning demand, Japanese curry roux and Korean pastes concentrate spend. Gross margins run 22% to 44%, and vegetable, spice, oil and packaging costs shape profit. Margins stay tight. Buyers reward reliable supply. Spices keep prices volatile. Allergen records shape every approval.
Five groups hold about 33% of value, led by Unilever, Nestle and Ajinomoto, so global food majors and Asian seasoning leaders compete with regional pastes makers and foodservice specialists. Allergen labelling, sodium targets, clean-label pressure and buyer audits govern positioning, and restaurant chains and retailers check recipe consistency, allergen controls and delivery reliability before approving suppliers or granting shelf space. Chains compare cost per kilogram. Audits decide new contracts.
Market Definition
The market covers global sales of ready-made food bases, defined as concentrated pastes, pouches, paste blocks and liquid bases that provide a finished flavour foundation for cooking, in curry and spice paste, soup and stock base, tomato and sofrito base, Asian stir-fry and hot pot base and plant-based and clean-label base forms, sold to foodservice operators, retailers and food manufacturers and valued at manufacturer sales revenue. It excludes dry seasoning blends, ready-to-eat meals, bouillon cubes sold as commodity stock and single-ingredient sauces.
Base Year Value
$9.2B in 2025 (MMA Primary Research Dataset, September 2026)
Forecast Period
2026 to 2036, eleven discrete annual values
CAGR
6.2% base case. Bull 7.5%. Bear 4.9%.
Fastest Growth Segment
Plant-Based and Clean-Label Bases: 8.7% CAGR
Fastest Growth Country
India: 9.0% CAGR
Fastest Growth Region
South Asia and Pacific: 8.2% CAGR
Largest Region
East Asia: 32% of 2025 global value
Market Leaders
Unilever, Nestle, Ajinomoto, Yihai International, Lee Kum Kee. Source: MMA Analysis, company annual reports.
Primary Survey
n=3,800 procurement and R&D decision-makers, Q4 2025, six countries
Methodology
Demand-side build-up, cross-validated against public data, 47 expert interviews

Ready-made Food Bases Market Forecast Scenarios

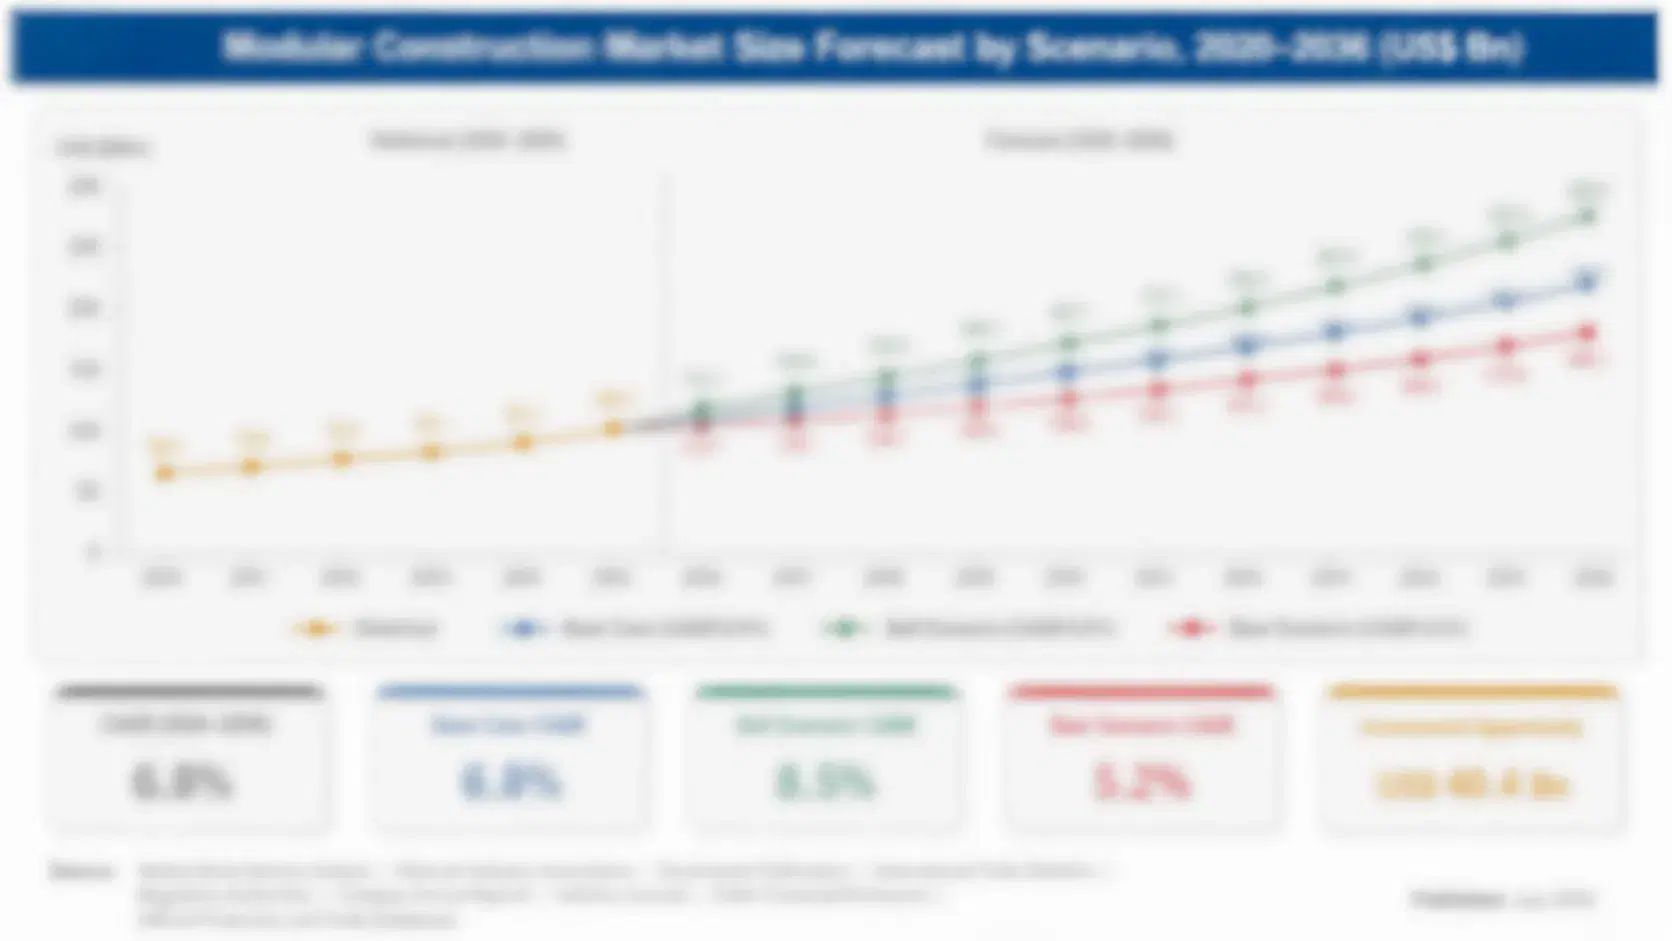
ready-made-food-bases-market-size-forecast-scenario-1790024843315
From 2020 to 2025 ready-made food base sales grew at about 5.4% a year. Home cooking lifted retail demand in 2020 and 2021, restaurants restored foodservice volumes in 2022 and 2023, and chains added centralised kitchens that rely on bases. Curry and hot pot pastes gained share steadily, while tomato and stock bases grew more slowly.
The base case of 6.2% rests on three named mechanisms. Restaurant chains and ghost kitchens standardise flavour with bases to cut labour and waste. Global adoption of Asian and Indian cuisines lifts demand for curry, hot pot and stir-fry bases at retail. Clean-label and plant-based reformulation lifts price per kilogram as brands remove additives. Each mechanism is visible in chain menu changes, retailer range changes and consumer surveys over the last three years.
The bull case reaches 7.5% if foodservice consolidation accelerates and clean-label ranges scale. The bear case falls to 4.9% if spice and oil costs spike again and operators return to scratch cooking. Both cases assume stable trade rules and no new sodium taxes on prepared foods. Neither case assumes a change in chain purchasing or in spice import rules.

Foodservice Standardisation, Hot Pot Bases and Spice Costs Set Base Returns

Makers roast or fry aromatics such as onion, garlic, ginger and chilli in oil, blend them with tomato, spices, stock, salt and stabilisers, then cook, concentrate and fill the paste into pouches, jars, tubs or bulk pails, and pasteurise or retort it for shelf life. Flavour depth, viscosity and heat stability decide quality, and recipe fidelity decides chain contracts. Buyers audit plants and allergen records every year before renewing approvals.
MARKET CONCENTRATION33% CR5Top five groups hold nearly one third of category sales
FOODSERVICE SHARE48%Portion of category sales sold to restaurants and caterers
RETAIL CHANNEL SHARE44%Portion of category sales made through grocery and online retail
INGREDIENT COST SHARE58% of COGSVegetables, oils, spices and pastes within total production cost
TYPICAL SHELF LIFE12-24 monthsTypical shelf life of sealed retort pouches and ambient jars
PREP TIME SAVING60-80%Share of cooking time saved against scratch preparation for restaurants
Value concentrates in five places. Curry and spice pastes carry large sales for retail and restaurants. Soup and stock bases serve caterers and manufacturers. Tomato and sofrito bases serve Mediterranean and Latin cooking. Asian stir-fry and hot pot bases are large in China, and plant-based and clean-label bases grow fastest as brands remove additives, animal stock and flavour enhancers. Recipe details stay closely guarded within each maker.
Supply combines large food plants with regional pastes makers. Tomatoes come from Italy, Spain, California and China, spices from India, Vietnam and Turkey, oils from Southeast Asia and Europe, and pouches and jars from packaging converters. Most bases are made near consumers, chains rotate specifications rarely, and qualifying a new foodservice supplier takes six to twelve months.
"A base is the part of the recipe nobody sees and every diner tastes. The suppliers who become invisible inside a chain's kitchen earn the longest contracts, while the ones selling on the shelf must earn a place with clean labels and real flavour."
Senior Analyst, Culinary Ingredients and Foodservice Practice · MMA Ready-made Food Bases Practice · September 2026

Market Trends

Plant-Based and Clean-Label Bases Remove Additives and Animal Stock

Brands are reformulating bases without artificial flavour enhancers, preservatives and animal-derived stock, using vegetable concentrates, yeast extracts and herbs, aimed at health-minded shoppers and vegan diners. Plant-Based and Clean-Label Bases grow about 8.7% a year, and gross margins run 32% to 44%. The trend needs flavour research, stable natural preservation and clear labelling, and it rewards makers with recipe skill and retailer ties, while natural ingredients cost 8% to 20% more, and shelf life can shorten. Buyers judge suppliers on consistency, documentation and delivery reliability. Makers with scale and clear plans hold the strongest positions.
Market Impact: foodservice buys 48% of sales

Chinese Hot Pot Bases Scale Through Retail and Export

Hot pot restaurant chains such as Haidilao, through Yihai International, and seasoning makers sell bases through retail and export, aimed at home diners and Asian restaurants worldwide. Hot pot bases carry a large share of Asian base sales. The trend needs stable chilli and Sichuan pepper supply, food safety controls and cold or ambient distribution, and it rewards makers with brand strength, while chilli costs swing, and imports face allergen and labelling rules. Makers with scale and clear plans hold the strongest positions. Early movers set the standard that later entrants must match.
Market Impact: curry pastes grow 7.4% yearly

Market Opportunities and Growth Drivers

Restaurant Chains and Ghost Kitchens Standardise Flavour With Bases

Chains and ghost kitchens need identical taste across outlets and cut skilled labour, so they buy bases for curries, soups and sauces. Foodservice buys about 48% of category sales. The driver rewards makers with custom recipes, bulk formats and reliable delivery, and it supports steady volume growth, while operators press on price, and some large chains move to in-house central kitchens, reducing outsourced demand. Early movers set the standard that later entrants must match. Foodservice buyers reward suppliers that respond quickly to specification changes. Progress should be reviewed every quarter against the agreed targets.
Market Impact: ingredients take 58% of cost

Global Adoption of Asian Cuisines Lifts Retail Base Demand

Shoppers outside Asia increasingly cook Indian, Thai, Chinese, Japanese and Korean dishes at home, and bases remove the need for many spices. Curry and spice pastes grow about 7.4% a year. The driver rewards makers with authentic flavour, familiar pack formats and retailer relationships, and it supports steady growth in retail bases, while shoppers prefer milder heat, and authenticity concerns limit trust in mass market brands. Foodservice buyers reward suppliers that respond quickly to specification changes. Progress should be reviewed every quarter against the agreed targets. Smaller makers carry the heaviest exposure and have the least room to adjust.
Market Impact: reformulation costs $0.5-3 million per range

Market Restraints and Challenges

Spice, Oil and Tomato Price Swings Squeeze Fixed-Price Margins

Vegetables, spices, oils and tomato pastes make up about 58% of production cost, and prices swung in 2022 and 2023 after sunflower oil disruption, weak chilli and cumin crops and tomato supply losses. The root cause is exposure to weather and geopolitics. Chains and retailers resist price rises, so makers lose two to five margin points until contracts reset. Makers respond with hedging, recipe changes and price formulas, though these steps take months. Progress should be reviewed every quarter against the agreed targets. Smaller makers carry the heaviest exposure and have the least room to adjust.
Market Impact: clean-label bases grow 8.7% yearly

Sodium Targets and Allergen Rules Constrain Formulation and Labelling

Bases carry high sodium for flavour and preservation, and health authorities in the United Kingdom, Europe and the United States push sodium targets, while allergen laws such as the UK's Natasha's Law and EU rules for celery and mustard require clear labels. The root cause is salt's role in taste and safety. Reformulation costs $0.5 million to $3 million per range, and mistakes cause recalls. Smaller makers carry the heaviest exposure and have the least room to adjust. Buyers judge suppliers on consistency, documentation and delivery reliability. Makers with scale and clear plans hold the strongest positions.
Market Impact: hot pot takes 20% of sales
3 additional market trends, 2 additional growth drivers, and 4 additional restraints and challenges are covered in the full report. Contact sales@marketmindsadvisory.com to access the complete intelligence.

Segment CAGR and Growth Architecture

The ready-made food base market is segmented by base type, which shows where cuisines, recipes and channel needs differ. Five segments cover curry and spice pastes, soup and stock bases, tomato and sofrito bases, Asian stir-fry and hot pot bases and plant-based and clean-label bases. Plant-based bases grow fastest, while curry and hot pot bases carry the largest sales.
ready-made-food-bases-market-market-share-analysis-1790024843827

Plant-Based and Clean-Label Bases

Plant-Based and Clean-Label Bases is the fastest-growing segment at 8.7% a year, about 1.40 times the overall market rate. Vegetable concentrates, yeast extracts and herbs replace animal stock and flavour enhancers, opening bases to vegan, health-minded and allergy-conscious buyers, and prices run 15% to 40% above conventional bases. Gross margins of 32% to 44% reward makers with flavour research, natural preservation skill and clean labels. Growth depends on taste depth, shelf life and retailer range reviews, while ingredient costs squeeze margins. Makers with strong brands hold the strongest positions. Early movers set the standard that later entrants must match. Foodservice buyers reward suppliers that respond quickly to specification changes. Progress should be reviewed every quarter against the agreed targets.
CAGR 8.7%

Curry and Spice Pastes

Curry and Spice Pastes grows at 7.4% a year, about 1.20 times the overall market rate, because restaurants, home cooks and food manufacturers use pastes for Indian, Thai and Southeast Asian dishes without sourcing dozens of spices. Makers use authentic recipes and regional variants to differentiate. Gross margins of 30% to 42% support brands with spice sourcing and strong retailer ties. Growth depends on flavour authenticity, spice supply and allergen control, and makers with consistent quality, clear labelling and dependable delivery hold the strongest positions with retailers and chains. Foodservice buyers reward suppliers that respond quickly to specification changes. Progress should be reviewed every quarter against the agreed targets. Buyers judge suppliers on consistency, documentation and delivery reliability.
CAGR 7.4%
Full segment breakdown across 5 segments available in the complete report.

Regional Architecture and Country Demand Map

East Asia leads at 32% because Chinese hot pot and compound seasoning demand, Japanese curry roux and Korean pastes concentrate spend, while North America and Western Europe each hold 20%. South Asia and Pacific holds 14%. Latin America and Middle East and Africa hold 5% each.

North America

North America holds 20% share, below its band, which is justified because American cooks and restaurants use more finished sauces and dry mixes than concentrated bases, so base demand rests on Asian, Latin and Indian cuisines and foodservice kitchens. Growth runs at 5.6%, below the global rate. Unilever, Nestle, McCormick and Kikkoman supply, chains adopt bases for consistency, and buyers require FDA-compliant labelling, allergen controls and reliable delivery before approving suppliers. Importers also review allergen controls and shelf life records before every annual contract renewal. Volumes stay steady, and suppliers compete mainly on recipe fidelity, documentation and delivery reliability. Distributors handle most shipments and set order sizes. Currency moves and freight rates change landed cost each quarter.
Share: 20% | CAGR: 5.6% (2026 to 2036)

Western Europe

Western Europe holds 20% share, inside its band, with growth of 4.8%, below the global rate. The United Kingdom, Germany, France and the Netherlands buy curry, soup, tomato and stock bases for retail and foodservice, led by Knorr, Sharwood's, Barilla and Baxters. Because East Asia and North America hold the top two slots, Western Europe acts as a mature, quality-focused market. Allergen rules and sodium targets shape formulation, and retailers push private label. Importers also review allergen controls and shelf life records before every annual contract renewal. Volumes stay steady, and suppliers compete mainly on recipe fidelity, documentation and delivery reliability. Distributors handle most shipments and set order sizes. Currency moves and freight rates change landed cost each quarter.
Share: 20% | CAGR: 4.8% (2026 to 2036)
Regional intelligence for 5 additional markets available in the complete report: East Asia, South Asia and Pacific, Latin America, Middle East and Africa, Eastern Europe. Contact sales@marketmindsadvisory.com.
ready-made-food-bases-market-country-cagr-analysis-1790024844347

Four Margin Routes for Food Base Makers

Margin in ready-made food bases comes from clean-label reformulation, custom foodservice programmes, ingredient cost protection and hot pot and curry expansion rather than volume alone. The routes below apply to food majors, Asian seasoning leaders and regional pastes makers, and each can start inside one planning cycle, with measures in gross margin points and cost per kilogram.

Reformulating Plant-Based and Clean-Label Bases Without Losing Flavour Depth

Health-minded shoppers pay for clean labels, so makers that replace enhancers and animal stock with vegetable concentrates and yeast extracts win listings worth 10% to 18% of category volume at gross margins of 32% to 44%. Development costs $0.5 million to $3 million per range. Makers should test taste blindly, protect shelf life with natural preservation and label clearly, since taste failures lose loyal buyers, and retailers drop weak launches quickly. Results should be reviewed every quarter against the agreed targets. Management should assign one owner to each programme from the start.
Market Impact: clean-label ranges win listings worth 10-18% of volume

Building Custom Foodservice Programmes With Chains and Central Kitchens

Restaurant chains pay for identical taste across outlets, so makers that develop custom bases, bulk formats and dependable delivery win contracts worth 12% to 20% of plant output at margins of 26% to 38%. Programmes cost $0.5 million to $4 million. Makers should work with chain chefs, hold spare capacity for menu launches and offer price formulas linked to ingredient indices, since operators switch suppliers when service slips. Management should assign one owner to each programme from the start. Early results also help persuade sceptical buyers. Costs are recovered faster in larger plants.
Market Impact: custom programmes win contracts worth 12-20% of plant output

Locking In Spice, Oil and Tomato Contracts to Protect Margins

Vegetables, spices, oils and tomato pastes make up about 58% of production cost and prices swing with weather, so makers that sign multi-season contracts and qualify several origins cut margin volatility by 25% to 40%. Programmes cost $0.3 million to $3 million in working capital. Makers should hold stock, review terms yearly and pass through index changes with a lag of one to two quarters, since spikes otherwise compress margins. Finance teams should track landed cost weekly. Early results also help persuade sceptical buyers. Costs are recovered faster in larger plants.
Market Impact: multi-origin contracts cut margin volatility by 25-40% across crop years

Expanding Curry and Hot Pot Bases Into Retail Channels

Global adoption of Asian cuisines lifts retail demand, so makers that adapt curry and hot pot bases to milder tastes and local pack sizes win volume worth 8% to 15% of sales at margins of 28% to 42%. Programmes cost $1 million to $6 million. Makers should partner with retailers and importers, comply with allergen labelling and keep authentic recipes, since dilution loses diaspora buyers, and mainstream shoppers reward clear cooking guidance. Costs are recovered faster in larger plants. Results should be reviewed every quarter against the agreed targets. Early results also help persuade sceptical buyers.
Market Impact: retail expansion wins volume worth 8-15% of sales

Who Controls the Margin Pool

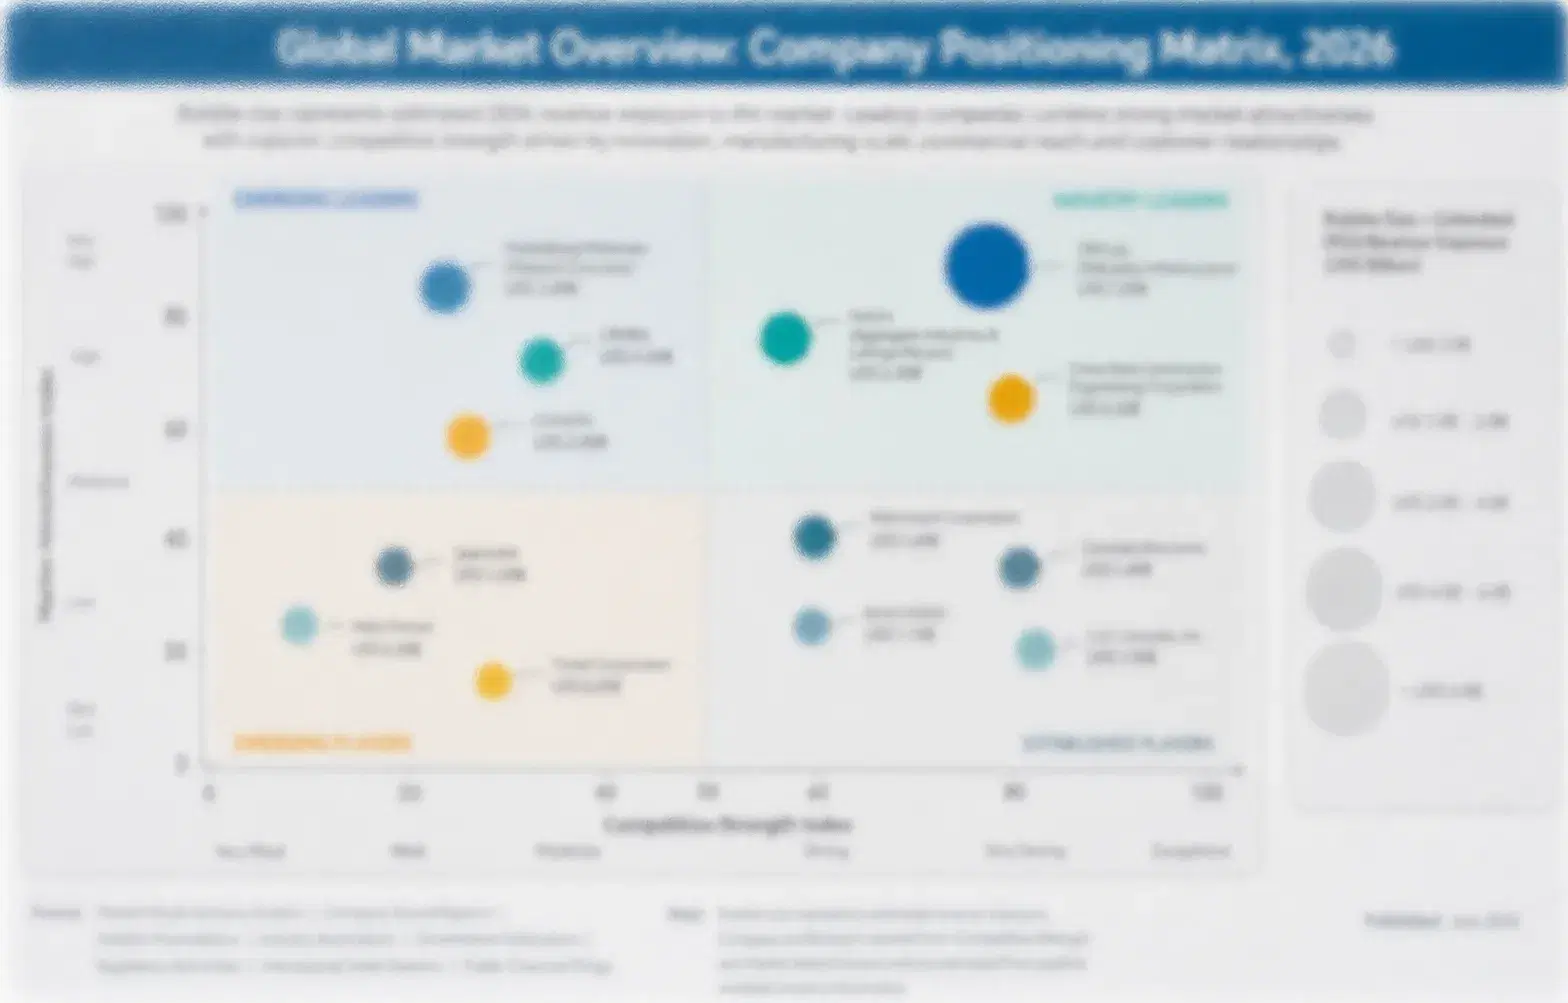
The ready-made food base market is moderately concentrated, with a CR5 of 33%, because a few global food majors and Asian seasoning leaders hold foodservice contracts, retailer relationships and large plants while many regional makers serve local buyers. This assessment measures participants on estimated food base sales value, held constant across all players. Unilever and Nestle lead through Knorr and Maggi ranges, Ajinomoto, Yihai International and Lee Kum Kee follow, and the gap between the leader and the fifth player is moderate. Regional makers and private label fill much of the remaining value.
Competition runs on four dimensions today: recipe fidelity and flavour consistency, foodservice service and custom capability, retailer listings and brand strength, and price per kilogram. Global majors win on scale and distribution, Asian leaders win on authentic cuisines, and regional makers win on local taste. Buyers compare flavour consistency, allergen records and delivery reliability.

Emerging pressure comes from private label bases, from Chinese hot pot brands expanding overseas and from clean-label specialists. Rankings shift where a maker wins chain contracts, secures spices at stable prices or launches a successful plant-based line, and consolidation continues as smaller makers face ingredient and compliance costs.
ready-made-food-bases-market-company-positioning-matrix-1790024844855

Competitive Moat and Risk Dimensions

UNILEVER

Moat: Knorr Portfolio and Foodservice Reach

Unilever is a global consumer goods company whose Knorr bases, pastes and stock products, and Unilever Food Solutions unit, reach households and professional kitchens across Europe, Asia, Africa and the Americas through large plants and distribution networks. Its brand recognition, recipe research and foodservice relationships give it durable access, and its size supports flavour development and sourcing across many origins.
UNILEVER

Risk: Portfolio Restructuring Risk

Unilever has restructured its food portfolio, which could slow investment in bases, while local and Asian rivals move faster. Spice, oil and tomato costs squeeze profit, retailers push private label, and sodium and allergen rules add reformulation cost. Investors expect steady returns. Rivals watch every move.
NESTLE

Moat: Maggi Brand and Global Distribution

Nestle is a global food company whose Maggi seasonings, bases and culinary aids, and Nestle Professional unit, reach households and restaurants across Asia, Africa, Europe and Latin America through large plants and retail networks. Its brand recognition, local recipe adaptation and distribution reach give it strong loyalty, and its size supports flavour research and clean-label reformulation.
NESTLE

Risk: Health Perception and Local Competition

Nestle faces sodium and additive criticism of culinary aids, and local rivals such as MTR and Haitian move faster on authentic recipes. Ingredient costs squeeze profit, retailers push private label, and reformulation adds cost and complexity. Investors expect steady returns. Rivals watch every move. Management attention remains the scarcest resource.

Players Tracked

Prominent Players

Unilever
Nestle
Ajinomoto
Yihai International
Lee Kum Kee

Other Key Players

Orkla
Haitian Flavouring and Food
Kikkoman
McCormick
Kerry Group
Premier Foods
Barilla
Mars Food
Campbell Soup Company
House Foods
S&B Foods
Tata Consumer Products
Gits Food Products
Everest Spices
Kraft Heinz

Recent Developments

JANUARY 2026

Seasoning Leader Launches Plant-Based Vegetable Concentrate Bases Without Enhancers for European Retail

A seasoning leader launched plant-based vegetable concentrate bases without enhancers for European retail, according to company communications. It is a product launch, not an acquisition, and it tests clean-label demand. The range uses yeast extracts and herbs. Sales terms were not disclosed. Rollout follows range reviews.
Signal: Confirms major brands are reformulating because clean-label pressure now shapes retailer listings and premium pricing in Europe.
FEBRUARY 2026

Hot Pot Seasoning Group Expands Overseas Retail Distribution of Chilli Bases Across Southeast Asia and Europe

A hot pot seasoning group expanded overseas retail distribution of chilli bases across Southeast Asia and Europe, according to company communications. It is a distribution expansion, not an acquisition, and it tests export demand. The expansion covers several retailers. Financial terms were not disclosed. Rollout follows range reviews.
Signal: Shows Chinese brands are scaling abroad because hot pot popularity supports base sales beyond restaurants and Asian diaspora.
MARCH 2026

Restaurant Chain Signs Multi-Year Custom Curry Base Supply Agreement With Food Manufacturer

A restaurant chain signed a multi-year custom curry base supply agreement with a food manufacturer, according to company communications. It is a supply agreement, not an acquisition, and it tests foodservice demand. The agreement covers annual volumes and recipes. Financial terms were not disclosed. Rollout follows range reviews.
Signal: Indicates chains are outsourcing flavour foundations because consistency and labour savings outweigh scratch cooking in most menus.

Spice, Oil and Tomato Cost Exposure

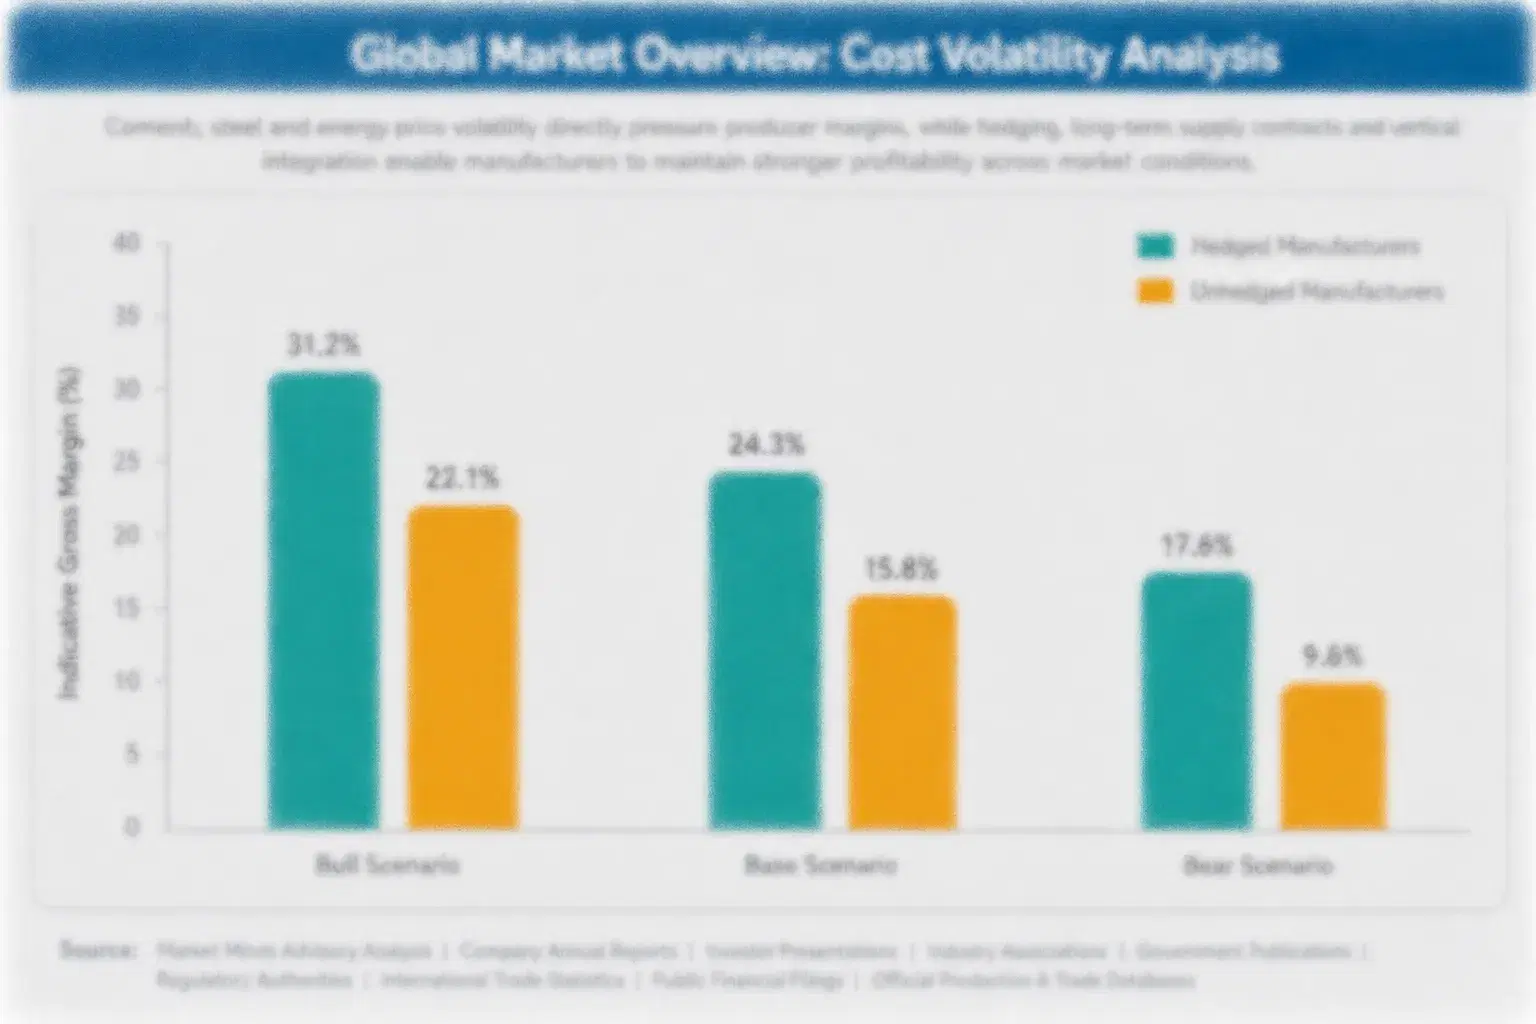
Vegetables and tomato pastes account for roughly 22% of production cost, spices and herbs about 16%, oils and fats about 14%, salt, sugar and starch about 6%, pouches, jars and pails about 14%, and labour, energy and overheads about 28%. Tomatoes come from Italy, Spain, California and China, spices from India, Vietnam and Turkey, and oils from Southeast Asia and Europe. Prices differ sharply by crop.
The clearest recent shock came in 2022 and 2023. USDA data show vegetable oil prices spiking after the war in Ukraine cut sunflower oil exports, while Eurostat data showed record food and energy inflation, and chilli and cumin prices rose after weather-hit Indian crops. Makers absorbed part of the increase, cut pack sizes and raised prices slowly, which compressed margins. Some relief came in 2024 and 2025.

The disadvantage falls on small and mid-sized makers without scale, long-term contracts or chain volume, because they buy spices in small lots and cannot pass through swings quickly. Exposure varies by player type: global majors hold contracts and hedges, foodservice specialists face chain price caps, and importers of finished bases carry currency risk until renewal dates.
ready-made-food-bases-market-cost-volatility-analysis-1790024845375

Multi-Season Spice and Tomato Contracts

Makers sign multi-season contracts with spice traders and tomato processors, with index-linked pricing, to cut cost swings of 15% to 30% between crop years. The main challenge is contract rigidity and counterparty risk, so makers split volumes across several origins and review terms each year. Procurement teams monitor positions each quarter against budgets. Buyers sign off first.

Recipe Flexibility and Alternative Ingredients

Makers qualify alternative oils, spice origins and vegetable concentrates to cut exposure to shortages and spikes of 10% to 25%. The main challenge is flavour matching for chain specifications, so makers stage testing across products and share results with buyers. Reviews occur every year, and quality managers approve each change before launch. Analysts check weekly reports.

Chain and Retail Price Formulas

Makers negotiate price formulas with chains and retailers that link prices to commodity indices, and redesign packs and sizes to hold price points, recovering 40% to 60% of cost increases. The main challenge is buyer resistance and shopper sensitivity, so makers test changes on small ranges first. Renewals follow published indices every half year. Managers approve each step.

Portfolio Architecture for Margin Defence

Margins run from modest returns on private label soup and tomato bases to strong returns on clean-label, curry and hot pot bases sold with authentic recipes and brand support. Three tiers separate volume products, premium certified lines and next-generation solutions, and each draws on different ingredient access, recipe credentials and buyer relationships in a moderately concentrated market.
The tension between volume and premium is sharp. Private label soup, stock and tomato bases fill shelves and kitchens at low prices and face ingredient cost swings, while clean-label, curry and hot pot bases earn higher margins on smaller volumes and depend on recipe credibility, ingredient sourcing and buyer trust. Makers that run only volume suffer when input prices spike, while premium-only makers struggle to reach scale beyond specialist retailers.

High-value pools concentrate in plant-based and clean-label bases and in curry and spice pastes for supermarkets, quick commerce and restaurant chains. They gather where buyers pay for authentic flavour, clean labels and consistency, not for volume alone. Asian stir-fry and hot pot bases add a solid pool, and strong makers hold more than one, though each needs different recipes, skills and buyer relationships to serve well.

Volume / Commodity-Adjacent

Private label soup, stock and tomato bases in large pouches and pails sold on price per kilogram to retailers and caterers. Buyers focus on cost and specification, contracts follow annual reviews, and technical differentiation is limited by shared recipes, shared ingredients and packaging formats.
Gross Margin: 22%-30%

Premium / Certified

Branded curry, stir-fry and hot pot bases with recognised recipes, halal or kosher certification and authentic origin claims sold through supermarkets, restaurants and online channels. Buyers value flavour, provenance and brand trust, and listings run for months to years with regular reviews.
Gross Margin: 30%-40%

Sustainability / Regulatory / Next-Generation

Plant-based, clean-label and reduced-sodium bases with verified sourcing and sodium data, sold to health-minded shoppers and chains meeting nutrition targets. Contracts depend on recipe credibility, regulatory compliance and consistent delivery performance across channels.
Gross Margin: 32%-44%
ready-made-food-bases-market-portfolio-architecture-1790024845855

High-value Sub-segments and Strategic Watch-out

Plant-Based and Clean-Label Bases

Plant-based and clean-label bases combine the fastest growth with the strongest pricing, since health-minded shoppers accept gross margins of 32% to 44% for clean labels and vegan flavour. Flavour research, natural preservation and clear labelling form the entry barrier, and makers with strong brands and retailer ties lead.
Gross Margin: 32%-44%

Curry and Spice Pastes

Curry and spice pastes deliver solid growth with premium pricing, since restaurants and home cooks support gross margins of 30% to 42% for authentic flavour. Spice sourcing and allergen control limit competition, though ingredient cost adds pressure. Reviews occur each season. Buyers renew listings each year.
Gross Margin: 30%-42%

Asian Stir-Fry and Hot Pot Bases

Asian stir-fry and hot pot bases are the volume core, with value growing about 6.6% a year. Chilli cost and brand strength decide profit, and Chinese and Japanese leaders hold most sales. Buyers renew each season at prices linked to chilli and oil indices across foodservice and retail.
Gross Margin: 26%-38%

Tomato and Sofrito Bases

Tomato and sofrito bases are the strategic watch-out, since growth of about 5.0% a year trails the leaders, private label holds a large share and tomato costs swing sharply. Makers should manage ranges selectively, avoid heavy capital and steer investment toward clean-label and curry lines with clearer buyers.
Gross Margin: 22%-32%

Why Kitchens Keep Reordering Bases

Food base demand behaves like an annuity attached to menus and recipes. Once a chain or household picks a base, orders repeat every few weeks, and switching means retesting flavour, texture and cost across dishes. Approved supplier lists follow trials and audits, so makers with stable recipes and clean records earn recurring contracts. Trust, once earned, takes years to lose. Recipes protect supply. Habit protects the specification.
Adoption stickiness differs by end-use vertical. Restaurant chains and central kitchens are the deepest, since bases are written into recipes and cost specifications. Households are moderately sticky, driven by taste and convenience. Small independent restaurants are more fluid, changing suppliers when a price gap appears, though makers with reliable flavour hold repeat orders for several seasons. Audits reinforce loyalty.

Buyer profiles are shifting between generations. Older buyers bought bases as time savers for traditional dishes, while younger buyers ask about clean labels, plant-based options, sodium and cuisine authenticity, and discover brands online. Ghost kitchen operators add a third group that wants flexible formats and quick delivery. Makers that publish clear ingredient and sodium information win newer buyers. Repeat orders follow flavour.
ready-made-food-bases-market-end-use-penetration-index-1790024846372

MMA Verdict: Food Base Strategy

These are among the four positions where our research anticipates prominent divergence between winners and laggards over the coming forecast period. Each is grounded in the demand model, the regulatory perimeter, and the announced capacity pipeline.
01 / CLEAN-LABEL REFORMULATION STRATEGY

Reformulate Clean-Label Bases Without Losing Flavour Depth Before Retailers Set Standards

Health-minded shoppers pay for clean labels, and bases that replace enhancers and animal stock with vegetable concentrates and yeast extracts win listings worth 10% to 18% of category volume at gross margins of 32% to 44%. Makers should invest $0.5 million to $3 million per range, test taste blindly and protect shelf life. Those that delay will lose shelf space over the next two years, while early movers hold premium prices, stronger margins and lasting presence across every range review and annual negotiation.
02 / FOODSERVICE PROGRAMME STRATEGY

Build Custom Foodservice Programmes With Chains Before Rivals Lock In Central Kitchens

Restaurant chains pay for identical taste across outlets, and custom bases, bulk formats and dependable delivery win contracts worth 12% to 20% of plant output at margins of 26% to 38%. Makers should invest $0.5 million to $4 million, work with chain chefs and hold spare capacity for menu launches. Those that delay will lose contracts over the next two years, while early movers hold steady volume, stronger relationships and better margins across every menu cycle, tender round and annual negotiation with chains.
03 / INGREDIENT COST PROTECTION

Lock In Spice, Oil and Tomato Contracts Before Price Swings Erase Margins

Vegetables, spices, oils and tomato pastes make up about 58% of production cost, and multi-season contracts with several origins cut margin volatility by 25% to 40%. Makers should invest $0.3 million to $3 million in working capital, hold stock and review terms yearly. Those that delay will absorb spikes over the next two years, while early movers hold protected margins, steady supply and stronger negotiating positions across every crop cycle, price revision and annual budget review for management, lenders and key retail partners.
04 / CUISINE EXPANSION STRATEGY

Expand Curry Bases Into Retail Before Local Brands Fill Shelves

Global adoption of Asian cuisines lifts retail demand, and curry and hot pot bases adapted to milder tastes and local pack sizes win volume worth 8% to 15% of sales at margins of 28% to 42%. Makers should invest $1 million to $6 million, partner with retailers and importers and comply with allergen labelling. Those that delay will lose listings over the next two years, while early movers hold wider reach, stronger importer ties and better margins across every market entry, range review and annual negotiation.

Engagement Snapshot From the Field

A live engagement with an industry participant carrying material or product regulatory and market exposure ahead of a defining policy shift, showing how our research translates into a defensible multi-year portfolio strategy.
MARKET MINDS ADVISORY · CLIENT ENGAGEMENT SUMMARY
Ready-made Food Bases Producer Strategic Portfolio Review and Transition Roadmap 2026·Investment Scenario on Ready-made Food Bases Exposure Evaluation 2025-26
CLIENT PROFILE
The client is a mid-sized European sauce and base manufacturer with annual sales near $280 million (client-reported, unverified by MMA), producing tomato, soup and curry bases for foodservice, supermarkets and private label customers from three plants. About 70% of sales came from tomato and soup bases, spice and oil costs had squeezed margins, and management wanted a plan to grow clean-label and curry lines.
STRATEGIC CHALLENGE
Standard base margins sat near 14% (client-reported, unverified by MMA), input costs had risen about 24% over two years and two chains had asked for custom curry bases and sodium reductions. Management had to decide whether to reformulate clean-label ranges, build custom foodservice programmes or expand curry capacity, with limited capital and three plants. Key buyers wanted samples within nine months.
MMA APPROACH
MMA analysed sales, cost and utilisation data across 70 products, interviewed 16 retail buyers, chain chefs and food technologists, and ran a shopper survey on clean labels, flavour and price across six countries. It modelled margin by product and channel, compared clean-label, foodservice and curry expansion options by payback and execution risk, and tested each against spice, oil and tomato price scenarios.
KEY FINDINGS
  1. A clean-label range would win listings worth about 10% of revenue at gross margins above 36% within three years (client-reported, unverified by MMA).
  2. Custom foodservice programmes would win contracts worth about 13% of plant output at margins near 30% across two years (client-reported, unverified by MMA).
  3. Multi-season spice and tomato contracts would cut margin volatility by about 27% across three years and every product line sold (client-reported, unverified by MMA).
  4. Curry base expansion would add retail volume worth about 9% of revenue at margins near 34% across three years (client-reported, unverified by MMA).
CLIENT PROFILE
The client is a mid-sized European sauce and base manufacturer with annual sales near $280 million (client-reported, unverified by MMA), producing tomato, soup and curry bases for foodservice, supermarkets and private label customers from three plants. About 70% of sales came from tomato and soup bases, spice and oil costs had squeezed margins, and management wanted a plan to grow clean-label and curry lines.
STRATEGIC CHALLENGE
Standard base margins sat near 14% (client-reported, unverified by MMA), input costs had risen about 24% over two years and two chains had asked for custom curry bases and sodium reductions. Management had to decide whether to reformulate clean-label ranges, build custom foodservice programmes or expand curry capacity, with limited capital and three plants. Key buyers wanted samples within nine months.
MMA APPROACH
MMA analysed sales, cost and utilisation data across 70 products, interviewed 16 retail buyers, chain chefs and food technologists, and ran a shopper survey on clean labels, flavour and price across six countries. It modelled margin by product and channel, compared clean-label, foodservice and curry expansion options by payback and execution risk, and tested each against spice, oil and tomato price scenarios.
KEY FINDINGS
  1. A clean-label range would win listings worth about 10% of revenue at gross margins above 36% within three years (client-reported, unverified by MMA).
  2. Custom foodservice programmes would win contracts worth about 13% of plant output at margins near 30% across two years (client-reported, unverified by MMA).
  3. Multi-season spice and tomato contracts would cut margin volatility by about 27% across three years and every product line sold (client-reported, unverified by MMA).
  4. Curry base expansion would add retail volume worth about 9% of revenue at margins near 34% across three years (client-reported, unverified by MMA).
RECOMMENDED STRATEGY
Phase 1: Phase 1 (Months 1-9): Sign multi-season spice and tomato contracts, pilot a clean-label range with two retailers and start chain recipe trials. Phase 2: Phase 2 (Months 10-24): Launch the clean-label and curry ranges widely, sign chain programmes and retire the weakest low-margin private label lines. Phase 3: Phase 3 (Months 25-42): Extend improved recipes across the range, review contracts yearly and decide on further capacity using margin data.
OUTCOME
Within 42 months, clean-label, curry and foodservice products reached 36% of sales, blended margins rose by about six points and input cost volatility fell by about 25% (client-reported, unverified by MMA). Two chains signed multi-year agreements, retailers widened listings, and reformulated recipes strengthened brand equity.

Frequently Asked Questions

Foundational context covering the market sizes, CAGR, scope, country, region and competition that inform every finding below. This section is provided to cover basics and most often pre-purchase conversations, answered from the MMA Primary Research Dataset.

What is the current size of the Ready-made Food Bases Market?

The global ready-made food bases market was valued at $9.2 billion in 2025 on a manufacturer sales revenue basis. Growth comes from foodservice standardisation and global cuisine adoption, and faces spice and oil costs and sodium rules.

How large will the Ready-made Food Bases Market be by 2036?

The market is projected to reach $17.83 billion by 2036, up from $9.77 billion in 2026. The increase of $8.06 billion reflects clean-label bases, curry pastes and chain kitchens.

What is the CAGR for the Ready-made Food Bases Market 2026 to 2036?

The market is forecast to grow at a 6.2% CAGR from 2026 to 2036. The bull case reaches 7.5% and the bear case 4.9%, depending on foodservice outsourcing, clean-label adoption and spice cost paths.

Which segment is growing fastest?

Plant-Based and Clean-Label Bases is the fastest-growing segment at 8.7% CAGR, roughly 1.40 times the overall market rate. Curry and Spice Pastes follows at 7.4% CAGR, led by home and restaurant use.

Who are the major companies in the Ready-made Food Bases Market?

Major companies include Unilever, Nestle, Ajinomoto, Yihai International and Lee Kum Kee. Orkla, Haitian Flavouring and Food, McCormick, House Foods and Tata Consumer Products also hold meaningful positions in specific channels.

Which country is growing fastest?

India is growing fastest at about 9.0% CAGR, because urban households adopt curry pastes while quick commerce and restaurant chains expand. China and Indonesia follow through hot pot and paste demand.

Report Segmentation Architecture

The full report scope spans multiple orthogonal segmentation dimensions, with cross-tabulated demand data provided for each dimension pair. Coverage extends further to regional breakdowns, trend trajectories, and the competitive detail needed to support segment-level decision-making.

By Primary Market Dimension

  • Curry and Spice Pastes
  • Soup and Stock Bases
  • Tomato and Sofrito Bases
  • Asian Stir-Fry and Hot Pot Bases
  • Plant-Based and Clean-Label Bases

By End-Use Industry

  • Restaurants and Quick-Service Chains
  • Institutional Catering
  • Household Consumers
  • Food Manufacturing Ingredients

By Commercial Dimension

  • Direct Foodservice Supply
  • Supermarket and Hypermarket Sales
  • Quick Commerce and Online Retail
  • Distributor Sales
  • Private Label Contract Manufacturing

By Region

  • North America
  • Western Europe
  • East Asia
  • South Asia and Pacific
  • Latin America
  • Middle East and Africa
  • Eastern Europe

Scope, Methodology, and Coverage

Every figure in this report is reproducible from documented input assumptions. The scope below maps the historical period, the forecast horizon, the segmentation dimensions, and the countries covered, alongside the underlying primary and qualitative methodology.
Historical Period
2020 to 2025
Forecast Period
2026 to 2036
Base Year
2025 (USD billions; MMA Primary Research Dataset, September 2026)
Market Definition
The market covers global sales of ready-made food bases, defined as concentrated pastes, pouches, paste blocks and liquid bases that provide a finished flavour foundation for cooking, in curry and spice paste, soup and stock base, tomato and sofrito base, Asian stir-fry and hot pot base and plant-based and clean-label base forms, sold to foodservice operators, retailers and food manufacturers and valued at manufacturer sales revenue. It excludes dry seasoning blends, ready-to-eat meals, bouillon cubes sold as commodity stock and single-ingredient sauces.
Quantitative Units
USD billions (manufacturer sales revenue); tonnes for volume references
Segmentation Dimensions
By Base Type; By End-Use Industry; By Commercial Dimension; By Region
Regions Covered
North America, Western Europe, East Asia, South Asia and Pacific, Latin America, Middle East and Africa, Eastern Europe
Countries Covered
China, Japan, South Korea, India, Indonesia, Thailand, Vietnam, Singapore, Australia, United States, Canada, United Kingdom, Germany, France, Italy, Spain, Netherlands, Poland, Czechia, Hungary, Brazil, Mexico, Argentina, Chile, United Arab Emirates, Saudi Arabia, South Africa, and additional markets relevant to this sector
Key Companies Profiled
Unilever, Nestle, Ajinomoto, Yihai International, Lee Kum Kee, Orkla, Haitian Flavouring and Food, Kikkoman, McCormick, Kerry Group, Premier Foods, Barilla, Mars Food, Campbell Soup Company, House Foods, S&B Foods, Tata Consumer Products, Gits Food Products, Everest Spices, Kraft Heinz
Quantitative Methodology
Primary survey, n=3,800 respondents, Q4 2025, six countries; demand-side model with trade association cross-validation
Qualitative Methodology
47 expert interviews, Q4 2025; applied to validate demand model assumptions, identify emerging dynamics, and assess competitive positioning
Report Format
PDF and XLSX data workbook (Word format preview document)
Publisher
Market Minds Advisory
Report Code
MMA-2026-AGR-280
Published
September 2026
Contact
sales@marketmindsadvisory.com | www.marketmindsadvisory.com

Purchase the full Ready-made Food Bases Market Report (2026 to 2036).

The full report delivers a detailed assessment of the global ready-made food bases market through 2036, covering base type, end-use, channel and regional forecasts, competitive benchmarking of leading food majors, Asian seasoning leaders and regional makers, and input cost analysis. It combines MMA primary research, including a six-country survey of 3,800 respondents and 47 expert interviews, with public statistical and company data. Analysts also model spice, oil and tomato price scenarios. Clients receive segment margin ranges, supply maps and a case study on growth strategy. Buyer negotiation frameworks are also included.
Ten-year base type and channel demand forecasts
Spice, oil and tomato cost tracking
Competitive benchmarking of leading food base makers
Allergen and sodium regulation change tracker
Regional comparative analysis and forecasts included
Quarterly primary survey data update access

Built For The People Who Decide

From boardroom strategy to bench-side execution, this report is read cover-to-cover by leaders shaping the next decade of their industry, turning demand scenarios, market dynamics and valuation benchmarks into decisions.
CXOs/ Presidents/ VPs/ Managers
M&A and Corporate Development
Strategy Teams and R&D Heads
Procurement and Product Directors
Regulatory and Compliance Leaders
Investor Relations and Equity Analysts