Market Minds Advisory
Rare Neurological Disease Treatment Market

Rare Neurological Disease Treatment Market: Gene Therapy and RNA-Based Modality Expansion Economics

One-time gene replacement therapies are displacing chronic dosing regimens across an expanding list of rare neurological conditions, pressuring manufacturers of older modalities to defend franchise revenue against treatments that cure rather than merely manage.

Lead Analyst

Alice Ballenger

Published

September 2026

Make Smarter Decisions with Customized Research Insights

Request a free sample report and evaluate market opportunities, growth trends, and competitive dynamics relevant to your business needs.

2025 MARKET VALUE$14.5BMarket Size 2025
2036 FORECAST VALUE$49.5BBase Case , 2026 to 2036
CAGR 2026 TO 203611.8 %Bull 13.1% / Bear 10.5%
INCREMENTAL OPPORTUNITY$33.2BNet 10- year value creation
EXPANSION MULTIPLE3.05x2036 value over 2026 base
Strategic Levers
M&A Pipeline
Regional Outlook
Country Rankings
Competitive Intelligence
Segmental Deep-dive
Call-Us : 91 93563 13602

Executive Snapshot and Market Trajectory

One-time gene replacement therapies are displacing chronic dosing regimens across an expanding list of rare neurological conditions, pressuring older modality manufacturers to defend franchise revenue. Physicians increasingly view gene replacement as first-line consideration rather than reserved therapy. Chronic dosing manufacturers face growing pressure to defend prescriber loyalty.
Commercial demand concentrates around spinal muscular atrophy, Duchenne-associated neurological complications, and a growing list of ultra-rare conditions where newborn screening programmes increasingly identify patients before symptom onset, expanding the treatable population meaningfully beyond historical diagnosis patterns. North America accounts for the largest share of treated patient revenue, reflecting premium orphan drug pricing and the fastest regulatory approval pathways among major markets. This concentration continues reinforcing manufacturer investment priorities significantly.
Competitive intensity centers on modality differentiation, newborn screening advocacy, and long-term outcomes data rather than list price alone. Gene therapy manufacturers are steadily capturing patients and revenue from chronic ASO and enzyme replacement franchises as durability data accumulates across treated patient cohorts. Manufacturers unable to match established franchise scale increasingly compete on clinical differentiation and durability evidence instead. Growing newborn screening investment further reinforces this competitive divergence across manufacturer portfolios. This dynamic increasingly reshapes strategy.
Market Definition
This market covers pharmaceutical and biological therapies approved or in late-stage development for rare neurological diseases affecting small, genetically defined patient populations, spanning gene replacement, antisense oligonucleotide, RNA interference, enzyme replacement, monoclonal antibody, and small molecule modalities. It excludes therapies for common neurological conditions affecting broad patient populations and unrelated rare disease categories outside neurological indications.
Base Year Value
$14.5B in 2025 (MMA Primary Research Dataset, August 2026)
Forecast Period
2026 to 2036, eleven discrete annual values
CAGR
11.8% base case. Bull 13.1%. Bear 10.5%.
Fastest Growth Segment
Gene Replacement Therapies: 18.5% CAGR
Fastest Growth Country
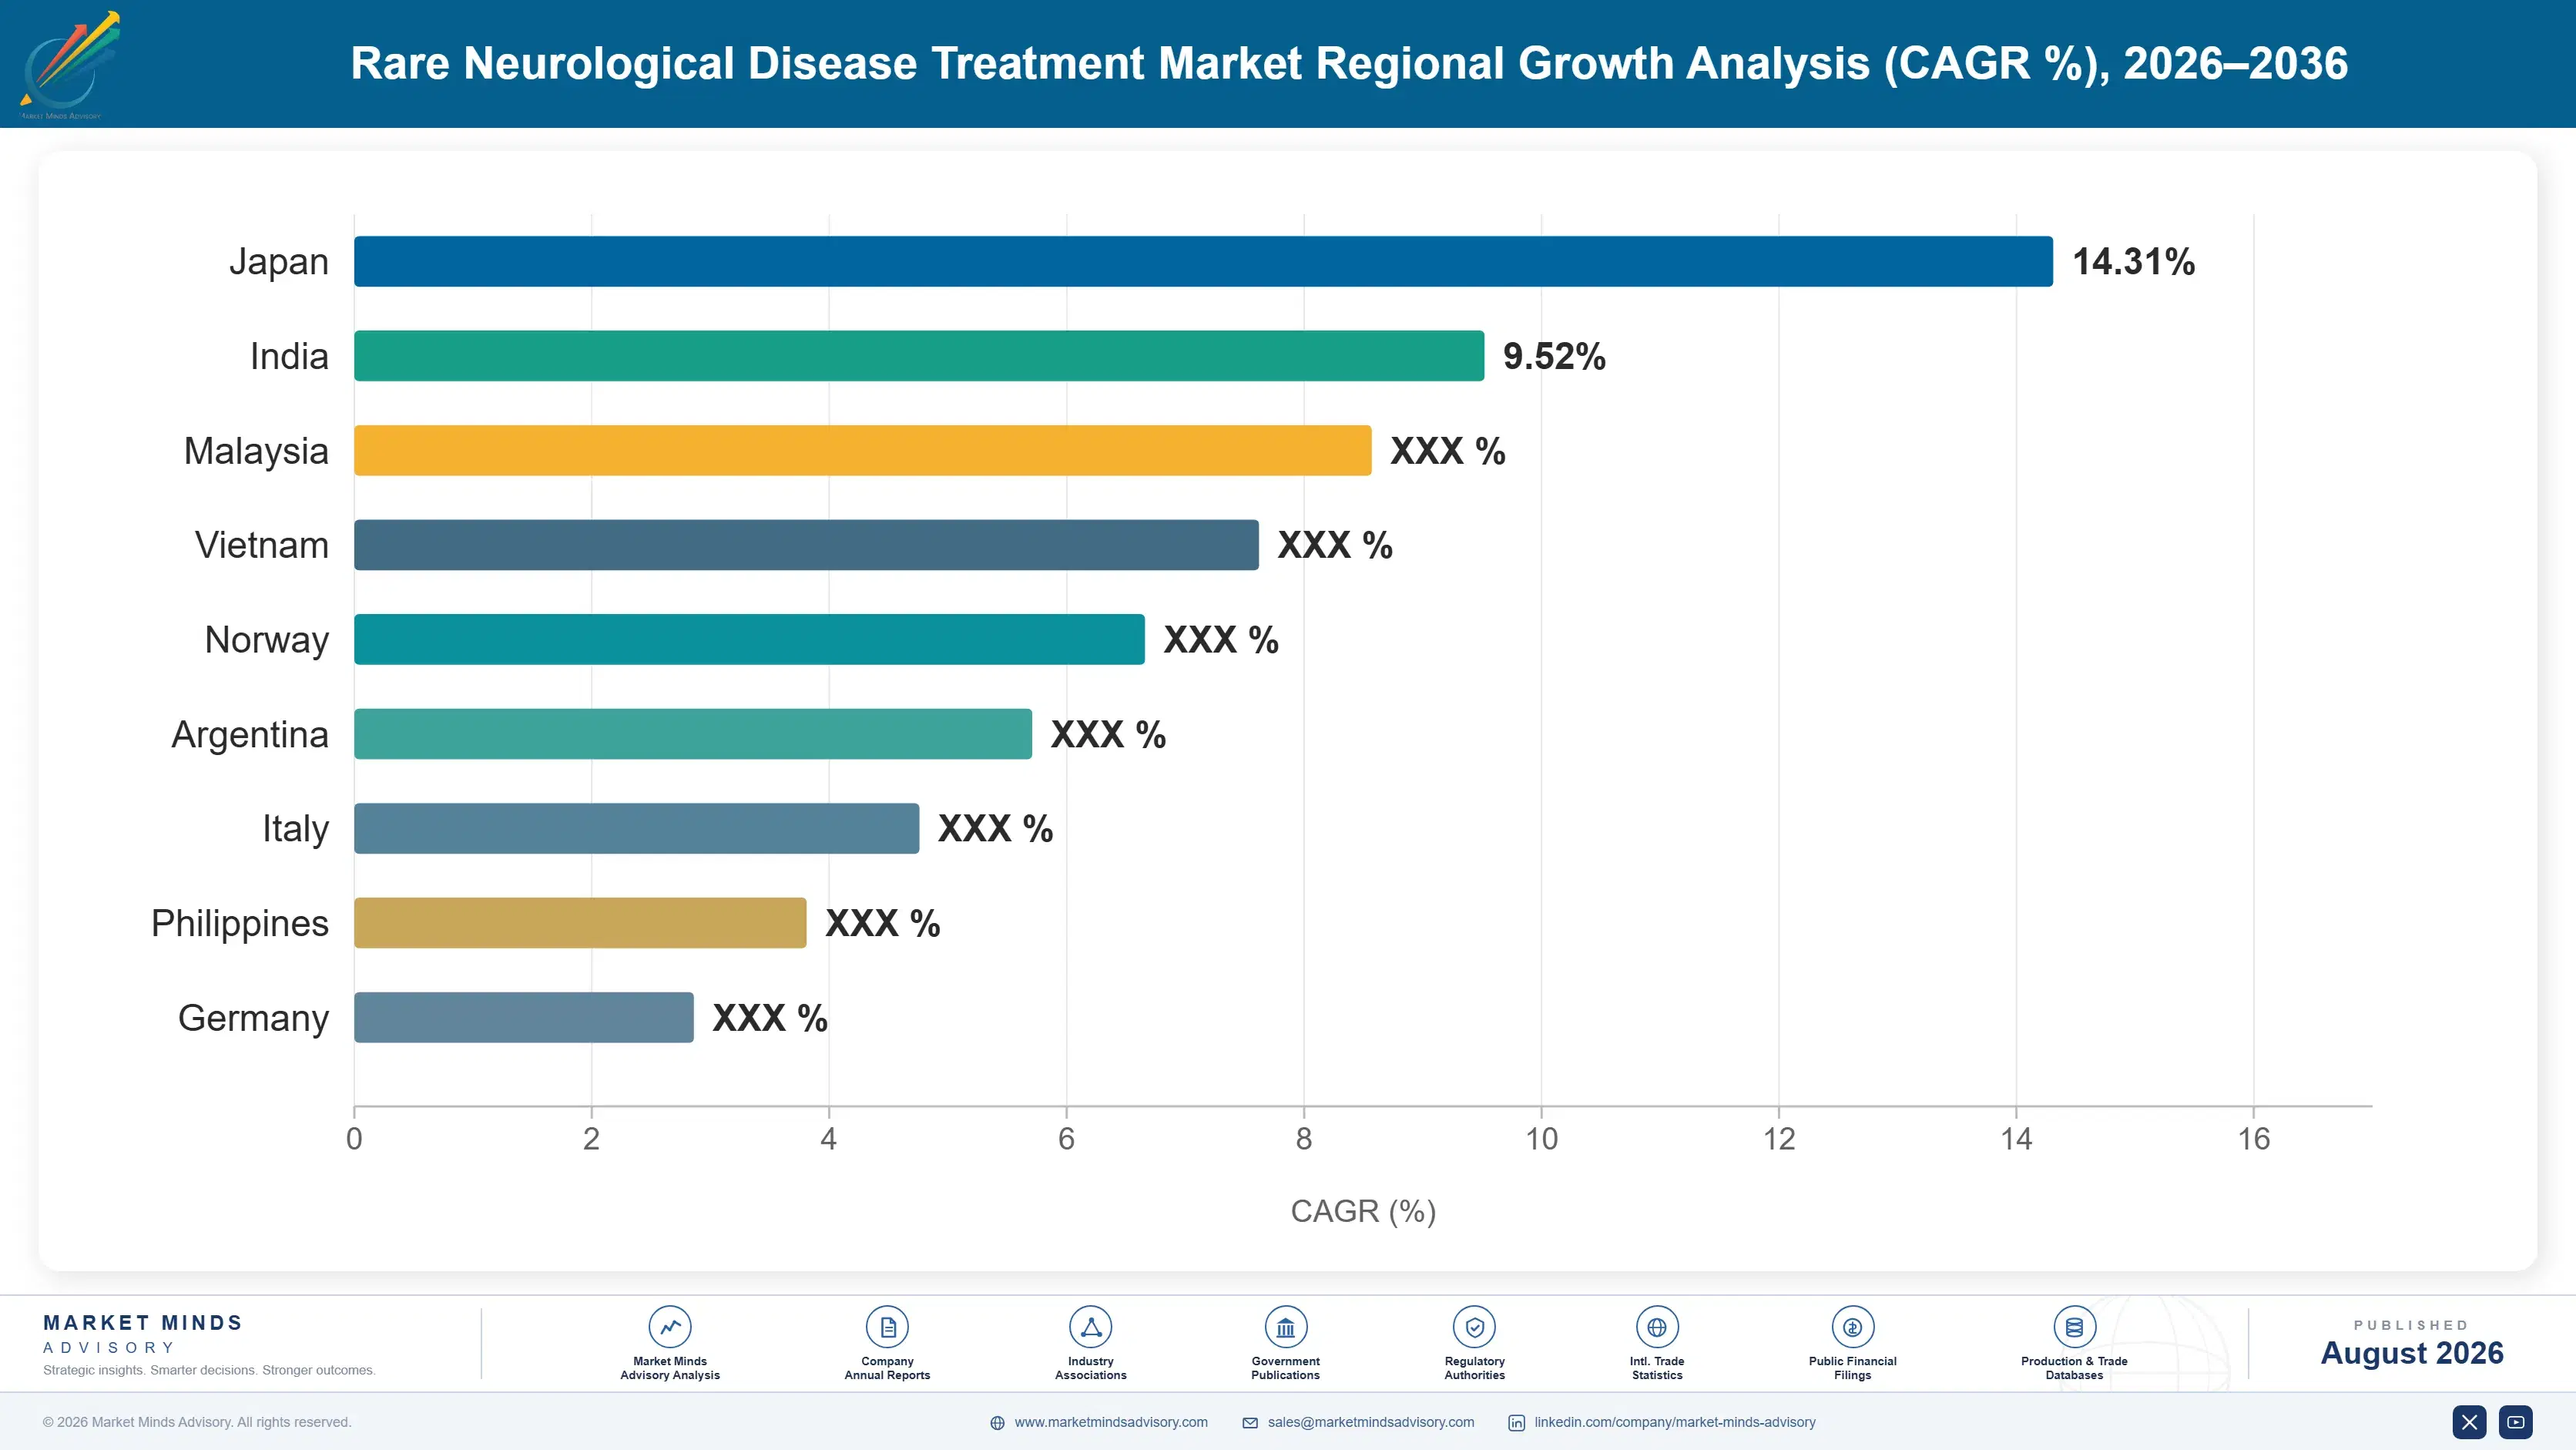
China: 15.0% CAGR
Fastest Growth Region
South Asia and Pacific: 13.8% CAGR
Largest Region
North America: 34% of 2025 global value
Market Leaders
Biogen, Novartis, Roche, Sarepta Therapeutics, Ionis Pharmaceuticals. Source: MMA Analysis based on company annual reports and investor filings.
Primary Survey
n=3,800 procurement and R&D decision-makers, Q4 2025, six countries
Methodology
Demand-side build-up, cross-validated against public data, 47 expert interviews

Rare Neurological Disease Treatment Market Forecast Scenarios

rare-neurological-disease-treatment-market-size-forecast-scenario-1787309476635
Rare neurological disease treatment demand grew rapidly between 2020 and 2025 as gene replacement therapies gained regulatory approval and newborn screening programmes expanded, identifying patients earlier than traditional symptom-based diagnosis previously allowed. Manufacturers investing early in newborn screening advocacy reported gradually rising pre-symptomatic patient identification across this window as programme coverage expanded. Manufacturer clinical trial investment expanded meaningfully.
The base case assumes continued gene therapy pipeline expansion across additional rare neurological conditions, growing newborn screening programme adoption identifying pre-symptomatic patients, and steady RNA-based modality development addressing conditions without approved therapy. Expanding orphan drug regulatory pathways, rising patient advocacy driving diagnosis awareness, and continued manufacturer investment in ultra-rare condition pipelines together sustain demand growth across the therapeutic category through the forecast period. Manufacturers positioned with pipeline diversification and durability evidence continue capturing disproportionate share of this steady underlying demand growth.
A stronger scenario emerges if regulators accelerate approval pathways for gene therapies addressing additional ultra-rare conditions faster than currently planned, pulling treatment access forward materially ahead of typical development timelines. The bear case involves persistent payer resistance to premium one-time gene therapy pricing, meaningfully slowing broader adoption despite regulatory approval and clinical enthusiasm. Regulatory clarity would influence the outcome.

Modality Transition and Newborn Screening Expansion Dynamics

Gene replacement therapy manufacturers are steadily capturing treatment-naive patients as newborn screening programmes expand across major developed markets, identifying rare neurological disease patients before symptom onset when treatment intervention delivers the strongest clinical outcomes. This diagnostic evolution mirrors similar screening-driven identification cycles observed across other rare disease categories facing comparable early intervention opportunity from genetic testing advance
THERAPY CONCENTRATION46% CR5Top five companies combined total prescription revenue share
AVERAGE GENE THERAPY COST$2,100,000Typical one-time gene replacement therapy list price estimate
LEADING REGION SHARENorth America 34%Region currently leading global treated patient revenue overall
NEWBORN SCREENING COVERAGE38%Share of births covered by relevant genetic screening programmes
PRE-SYMPTOMATIC TREATMENT RATE52%Share of gene therapy patients treated before symptom onset
PIPELINE ASSET COUNT22 in Phase 2 or 3Late-stage clinical assets currently in active development overall
Prescription revenue remains moderately concentrated among established biopharmaceutical companies with orphan drug regulatory expertise, while a growing group of gene therapy-focused biotechnology companies increasingly compete for approval across an expanding list of ultra-rare neurological conditions previously without any approved therapy option. Investor attention increasingly favors gene therapy-focused companies advancing mechanisms distinct from the chronic dosing drug classes facing accelerating displacement pressure across major developed markets.
Long-term durability data continues shaping payer and physician confidence in gene therapy's curative positioning relative to chronic dosing alternatives, with manufacturers generating multi-year outcomes data increasingly capturing patients and prescribers previously cautious about one-time treatment permanence claims. Manufacturers investing in extended outcomes tracking increasingly capture payers and prescribers previously cautious about permanence claims. This trend is gradually raising baseline evidence expectations across the entire modality category.
"Every rare neurological disease used to mean a lifetime prescription. Gene therapy is quietly turning some of them into a single appointment, and the whole commercial model has to catch up."
Director, Rare Disease and Gene Therapy Therapeutics Practice · MMA Rare Disease

Market Trends

Newborn Screening Programme Expansion Identifying Patients Earlier

National newborn screening programmes continue adding rare neurological disease panels, identifying patients before symptom onset when gene replacement and enzyme therapy intervention delivers meaningfully stronger clinical outcomes than symptomatic treatment initiation. Major health systems have expanded screening panel coverage specifically targeting conditions with available approved therapy, supporting broader pre-symptomatic treatment access. Manufacturers with approved therapies for screened conditions report meaningfully higher treatment initiation rates than conditions lacking newborn screening infrastructure, reinforcing continued advocacy investment targeting screening panel expansion specifically. Manufacturers continue expanding advocacy investment to capture this accelerating screening demand.
Market Impact: Adds accelerated pathways across 8
Gene Therapy Durability Data Strengthening Payer Confidence

Manufacturers continue publishing multi-year durability data from early gene replacement therapy patient cohorts, demonstrating sustained clinical benefit that increasingly supports premium one-time pricing relative to lifetime chronic dosing cost comparisons payers historically used for value assessment. Major payers have begun adjusting value-based pricing agreements specifically incorporating this durability evidence into coverage decisions. This accumulating evidence is gradually shifting payer skepticism toward broader acceptance of gene therapy's premium pricing structure across an expanding list of approved and pipeline conditions. Manufacturers with established durability portfolios increasingly capture payer-driven coverage decisions. This pattern shows no sign of slowing.
Market Impact: Adds 9 percent advocacy-driven diag

Market Opportunities and Growth Drivers

Expanding Orphan Drug Regulatory Pathways Accelerating Approval

Regulatory agencies across major developed markets continue expanding accelerated and breakthrough designation pathways specifically targeting rare neurological conditions with high unmet medical need, meaningfully shortening development timelines relative to standard regulatory review processes. Manufacturers increasingly pursue these designations early in development, securing more frequent regulatory engagement and potentially reduced trial size requirements. Continued regulatory pathway expansion, particularly for ultra-rare conditions affecting fewer than one thousand patients globally, sustains steady underlying pipeline development investment across manufacturer portfolios through the forecast period. Manufacturers serving these expanding regulatory pathways continue investing in expanded pipeline development accordingly.
Market Impact: Delays payer approval by 11 months

Rising Patient Advocacy Driving Diagnosis Awareness

Patient advocacy organizations increasingly collaborate with manufacturers and health systems on diagnosis awareness campaigns targeting rare neurological conditions historically underdiagnosed given nonspecific early symptom presentation. Specialized rare disease diagnostic centers report meaningfully higher identification rates than general neurology practices operating without dedicated rare disease expertise. This advocacy-driven diagnostic awareness is expanding the treatable population meaningfully beyond patients identified through traditional specialist referral pathways, sustaining demand growth across manufacturer commercial teams. Manufacturers positioned with cross-specialty advocacy relationships continue expanding capacity ahead of slower-moving competitors. This collaborative model continues expanding rather steadily.
Market Impact: Limits production capacity by 24 pe

Market Restraints and Challenges

Payer Resistance to Premium One-Time Therapy Pricing

Payers across multiple major markets continue resisting premium one-time gene therapy pricing despite favorable lifetime cost comparisons against chronic dosing alternatives, creating meaningful access friction for patients and prescribers seeking treatment. The root cause lies in payer budget cycle structures that struggle to absorb large upfront costs even when long-term value calculations favor gene therapy over extended chronic treatment. This pressure disproportionately affects smaller regional payers and health systems in markets without established value-based or installment payment frameworks. Manufacturers are responding by developing outcomes-based payment agreements spreading cost across multiple years contingent on sustained clinical benefit.
Market Impact: Expands screened population by 27 p

Limited Manufacturing Capacity Constraining Gene Therapy Supply

Specialized viral vector manufacturing capacity required for gene replacement therapy production remains limited relative to expanding demand across an increasing number of approved and pipeline conditions, creating supply constraints that limit treatment availability even where regulatory approval and payer coverage exist. The root cause is the highly specialized nature of viral vector production, requiring dedicated facilities and expertise that take years to establish and cannot be rapidly scaled. This constraint disproportionately affects smaller biotechnology companies lacking established manufacturing partnerships or internal capacity. Manufacturers are responding by investing directly in expanded internal manufacturing capability and diversified contract partnerships.
Market Impact: Adds 5 new value-based pricing agre
4 additional market trends, 3 additional growth drivers, and 3 additional restraints and challenges are covered in the full report. Contact sales@marketmindsadvisory.com to access the complete intelligence.

Segment CAGR and Growth Architecture

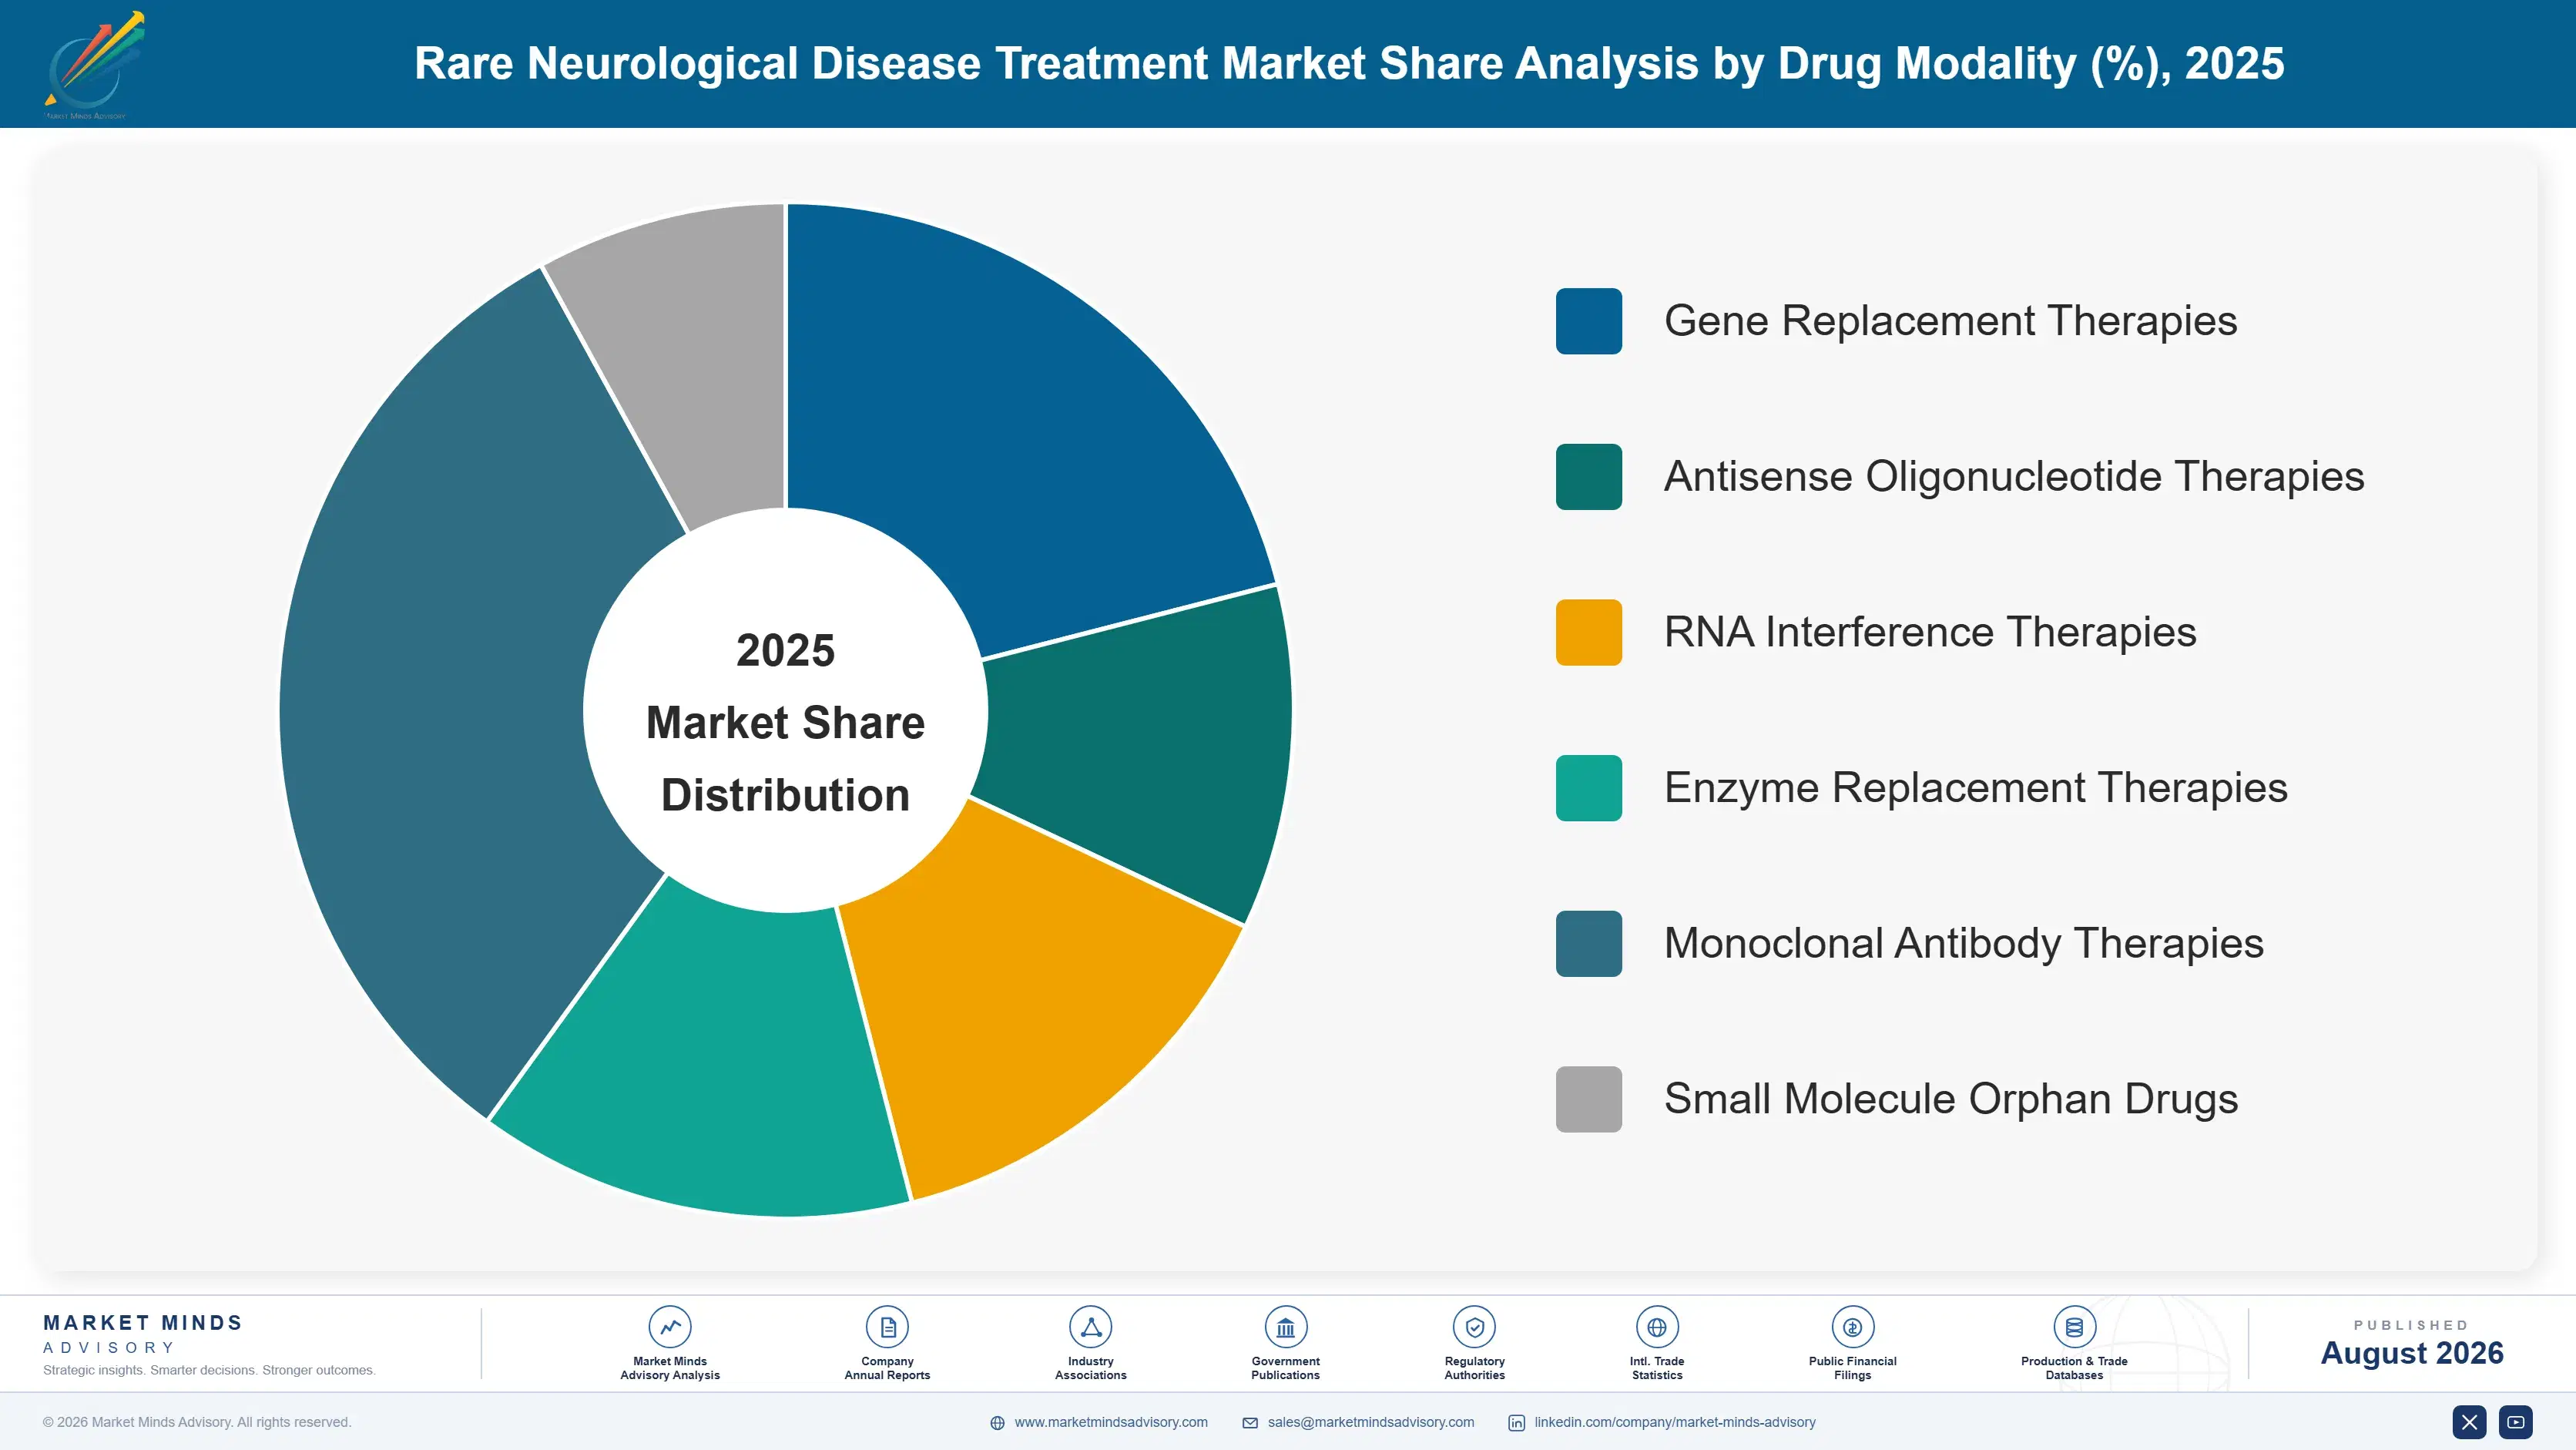
This market segments by drug modality spanning gene replacement, antisense oligonucleotide, RNA interference, enzyme replacement, monoclonal antibody, and small molecule orphan drug classes used across the rare neurological disease treatment landscape spanning both pediatric and adult patient populations broadly. Upstream target discovery research and downstream diagnostic testing remain treated as separate discussion outside this framework.
rare-neurological-disease-treatment-market-market-share-analysis-1787309477175

Gene Replacement Therapies

Gene replacement therapies, which deliver a functional copy of a missing or defective gene through a single administered dose, are gaining share rapidly as regulatory approvals expand across an increasing list of rare neurological conditions previously managed only through chronic supportive care. Accumulating multi-year durability data increasingly supports the modality's curative positioning, strengthening payer and physician confidence relative to earlier skepticism about treatment permanence claims. Manufacturers continue expanding pipeline investment specifically targeting ultra-rare conditions previously considered commercially unviable given small patient populations, since orphan drug pricing and regulatory incentives increasingly make even ultra-small indications commercially attractive. Newborn screening programme expansion further accelerates this segment's growth by identifying pre-symptomatic patients earlier.
CAGR 18.5%

RNA Interference Therapies

RNA interference therapies, which silence disease-causing gene expression through targeted messenger RNA degradation, appeal particularly to conditions where reducing production of a toxic or dysfunctional protein delivers meaningful clinical benefit without requiring full gene replacement. This modality has demonstrated genuine efficacy across several rare neurological conditions where traditional small molecule approaches proved insufficient, drawing on RNA interference development expertise established in adjacent rare disease categories. Development activity has accelerated meaningfully as manufacturers advance candidates through Phase 2 and Phase 3 trials targeting conditions including certain rare epilepsies and neurodegenerative disorders previously lacking targeted therapeutic options. Manufacturers continue expanding delivery technology investment specifically addressing blood-brain barrier penetration challenges. This positioning appeals particularly to conditions previously lacking any viable targeted treatment option.
CAGR 15.5%
Full segment breakdown across 6 segments available in the complete report.

Regional Architecture and Country Demand Map

North America leads global treated patient revenue given premium orphan drug pricing and the fastest regulatory approval pathways among major markets. [house] This share exceeds the standard regional band because US orphan drug economics genuinely concentrate revenue beyond patient population distribution. South Asia sustains meaningful additional growth.

North America

[house] United States prescribers lead regional treatment, driven by premium orphan drug pricing structures and the fastest regulatory approval pathways among major markets, which together concentrate global revenue in this region beyond what patient population distribution alone would suggest. This share exceeds the standard regional band because US rare disease drug economics genuinely reflect this pricing and access advantage rather than a modeling artifact. Canada follows a broadly similar demand pattern at smaller absolute scale, concentrated primarily among academic medical centers serving complex rare disease referrals. Payer coverage decisions across both countries continue expanding to encompass newer gene therapy mechanisms meaningfully. This coverage evolution sustains manufacturer confidence in long-term commercial investment.
Share: 34% | CAGR: 12.2% (2026 to 2036)

Western Europe

Germany anchors regional demand through its substantial rare disease specialist network and comprehensive national health insurance coverage supporting gene therapy access despite premium pricing considerations. Regional prescribers increasingly favor early treatment initiation given growing clinical evidence supporting pre-symptomatic intervention outcomes. France and the United Kingdom contribute meaningful additional demand through their own substantial rare disease specialist networks and national reimbursement frameworks. Southern European health systems, including those in Italy and Spain, expand gene therapy coverage more gradually given differing national reimbursement timelines. Regulatory harmonization across the European Union continues supporting cross-border reimbursement decisions and clinical guideline adoption. Manufacturers value this regulatory clarity considerably across national markets. Growth continues steadily overall.
Share: 24% | CAGR: 10.3% (2026 to 2036)
Regional intelligence for 5 additional markets available in the complete report: East Asia, South Asia and Pacific, Latin America, Middle East and Africa, Eastern Europe. Contact sales@marketmindsadvisory.com.
rare-neurological-disease-treatment-market-country-cagr-analysis-1787309477697

Where Manufacturers Capture Modality Transition Premium

Manufacturers that invest early in newborn screening advocacy, expand durability data generation, and deepen manufacturing capacity capture commercial gains unavailable to companies relying solely on symptomatic diagnosis and chronic dosing commercial models. Manufacturers slower to invest in these capabilities increasingly cede ground to faster-moving competitors across most pre-symptomatic and treatment-experienced patient segments served. Franchise diversification leadership increasingly comp

Newborn Screening Advocacy Investment Ahead of Panels

Manufacturers investing early in newborn screening advocacy and panel expansion capture pre-symptomatic patients before competitors establish equivalent diagnostic infrastructure relationships. This lever requires substantial advocacy and health system partnership investment, but successfully expanded screening captures durable, long-term treatment relationships that symptomatic-diagnosis-dependent competitors cannot access as early. Manufacturers report screening advocacy investment improving new patient identification by roughly 24 percent compared to competitors relying solely on traditional symptomatic referral pathways. Manufacturers moving early secure durable, multi-year prescriber loyalty that symptomatic-diagnosis-dependent competitors cannot easily displace once established. This approach positions manufacturers favorably as screening panel coverage continues expanding steadily.
Market Impact: Improves new patient identification

Long-Term Durability Data Generation Programme Investment

Manufacturers investing in extended patient outcomes tracking and durability data publication capture payer and physician confidence that competitors without comparable evidence cannot establish. This lever requires sustained clinical follow-up investment across extended timeframes, but successfully generated data captures durable premium pricing power and payer coverage confidence. Manufacturers report durability data investment improving payer coverage approval rates by roughly 19 percent compared to competitors lacking comparable long-term evidence. Manufacturers that establish this capability early typically retain payer confidence well beyond the initial evidence publication, generating durable long-term coverage relationships. This approach positions manufacturers favorably as payer skepticism gradually resolves.
Market Impact: Improves payer coverage approval ra

Manufacturing Capacity Expansion Ahead of Pipeline Approvals

Manufacturers investing early in expanded viral vector manufacturing capacity capture commercial launch readiness that competitors facing capacity constraints cannot match at approval. This lever requires substantial capital investment in specialized manufacturing infrastructure, but successfully expanded capacity captures durable market access and supply reliability that capacity-constrained competitors struggle to establish. Manufacturers report manufacturing capacity investment improving commercial launch revenue by roughly 21 percent compared to competitors facing supply constraints at launch. Manufacturers that formalize this capacity gain meaningfully steadier commercial launch readiness than competitors dependent on constrained external contract manufacturing. This capacity readiness increasingly matters as pipeline approvals accelerate.
Market Impact: Improves commercial launch revenue

Outcomes-Based Payment Agreement Development Growth Strategy

Manufacturers developing outcomes-based and installment payment agreements with payers capture access that upfront premium pricing alone cannot secure, particularly important given persistent payer budget cycle resistance to large one-time gene therapy costs. This lever requires meaningful payer relationship and financial structuring investment, but successfully developed agreements capture durable payer partnerships and broader coverage that rigid pricing models cannot achieve. Manufacturers report outcomes-based agreement development improving payer approval speed by roughly 14 percent compared to standard fixed-price contracting. Manufacturers pursuing this path typically phase agreement structuring gradually to validate payment terms across representative payer negotiation scenarios.
Market Impact: Improves payer approval speed by ro

Who Controls the Margin Pool

The top five companies control roughly 46% of global rare neurological disease prescription revenue, a moderately concentrated tier reflecting the substantial clinical development and manufacturing infrastructure investment required to compete across gene therapy, RNA-based, and traditional modality classes. Biogen and Novartis lead this top tier given their established SMA franchises over Sarepta Therapeutics and Ionis Pharmaceuticals within their modality positions.
Current competitive activity centers on newborn screening advocacy investment, durability data generation, and manufacturing capacity expansion targeting both established and pipeline conditions. Novartis and Roche continue advancing gene therapy and RNA-based mechanisms respectively, while Biogen defends its established ASO franchise through continued lifecycle management and newer modality investment. Sarepta Therapeutics and Ionis Pharmaceuticals continue expanding pipeline diversification beyond their established franchises, competing primarily on modality breadth and clinical differentiation.

Emerging pressure comes from gene therapy-focused biotechnology companies advancing candidates for ultra-rare conditions previously without any approved therapy, alongside RNA interference specialists expanding blood-brain barrier delivery technology that could eventually reshape which companies lead specific condition categories. Should these entrants achieve regulatory approval faster than established incumbents can respond, category leadership within newly addressable ultra-rare segments could shift meaningfully. Established incumbents are responding by accelerating investment to defend these positions.
rare-neurological-disease-treatment-market-company-positioning-matrix-1787309478219

Competitive Moat and Risk Dimensions

BIOGEN

Moat: Established SMA Franchise Depth

Biogen maintains the most established prescriber and patient relationships within spinal muscular atrophy treatment built over years of continuous chronic dosing franchise management, giving it clinical trust that newer gene therapy entrants have not yet fully displaced. This relationship depth supports continued prescribing even as gene replacement alternatives gain broader adoption.
BIOGEN

Risk: Gene Therapy Displacement Exposure

Biogen's chronic dosing franchise faces meaningful displacement risk from one-time gene replacement therapy as durability data continues strengthening payer and physician confidence in the curative alternative. Continued gene therapy adoption could meaningfully erode Biogen's franchise prescription volume over the coming several years absent accelerated newer modality investment.
NOVARTIS

Moat: First-Mover Gene Therapy Leadership

Novartis maintains first-mover clinical and commercial leadership in gene replacement therapy for spinal muscular atrophy, giving it accumulated durability data and physician trust that newer gene therapy entrants have not yet established. This leadership position supports continued premium pricing power that later entrants struggle to command.
NOVARTIS

Risk: Expanding Modality Competition Risk

Novartis faces meaningful competitive pressure as RNA interference and next-generation gene therapy approaches advance through development, potentially offering improved delivery or broader condition applicability. Continued modality innovation from competitors could meaningfully narrow Novartis's first-mover advantage over the coming several years. Continued modality diversification investment would meaningfully strengthen Novartis's competitive positioning against this intensifying pipeline competition.

Players Tracked

Prominent Players

Biogen
Novartis
Roche
Sarepta Therapeutics
Ionis Pharmaceuticals

Other Key Players

PTC Therapeutics
BioMarin Pharmaceutical
Alnylam Pharmaceuticals
uniQure N.V.
Amicus Therapeutics
Vertex Pharmaceuticals
Neurogene Inc.
Passage Bio Inc.
Taysha Gene Therapies
Encoded Therapeutics
Ultragenyx Pharmaceutical
Denali Therapeutics
Prilenia Therapeutics
Wave Life Sciences
CRISPR Therapeutics

Recent Developments

MARCH 2026

Novartis Reports Extended Gene Therapy Durability Data

Novartis published extended multi-year durability data for its spinal muscular atrophy gene therapy, reporting sustained motor function benefit across the initial treated patient cohort. The data strengthens payer confidence in the therapy's long-term value proposition. Physicians increasingly favor this durability evidence when counseling eligible patients.
Signal: Signals accelerating durability evidence s
SEPTEMBER 2025

Alnylam Pharmaceuticals Advances RNA Interference Trial

Alnylam Pharmaceuticals advanced its RNA interference candidate targeting a rare neurodegenerative condition into expanded Phase 3 enrollment, addressing a population previously without any approved targeted therapeutic option. The candidate targets a population previously without any approved targeted therapeutic option available through conventional treatment pathways. Alnylam continues expanding trial infrastructure.
Signal: Reflects continued RNA-based modality inve
DECEMBER 2025

Biogen Expands Newborn Screening Advocacy Partnership

Biogen expanded its newborn screening advocacy partnership with health systems across additional states, aiming to accelerate pre-symptomatic patient identification for conditions where its therapies demonstrate strongest clinical benefit. The partnership aims to accelerate pre-symptomatic patient identification for conditions where Biogen's therapies demonstrate strongest clinical benefit.
Signal: Underscores continued manufacturer investm

Viral Vector Manufacturing and Clinical Development Exposure

Viral vector manufacturing and specialized clinical trial execution together represent roughly 44% of total commercialization cost for rare neurological disease therapeutics, with viral vector manufacturing capacity concentrated among a limited group of specialized contract manufacturers and originator internal facilities. Specialized cell and gene therapy manufacturing infrastructure requires meaningfully higher fixed capital investment than conventional small-molecule pharmaceutical production
Viral vector manufacturing costs rose meaningfully during 2021 and 2022 amid broader biopharmaceutical supply chain disruption and constrained specialized manufacturing capacity relative to rapidly expanding gene therapy pipeline demand, with company annual reports from major manufacturers confirming elevated production costs persisted through much of 2022 before moderating gradually through 2023 and 2024. Published biopharmaceutical manufacturing industry commentary corroborates the pattern, showing capacity constraints remained a meaningful cost pressure point throughout this disruption period.

Manufacturers without established internal manufacturing capacity or long-term contract manufacturing relationships face materially higher production cost exposure than better-resourced competitors. Smaller gene therapy biotechnology companies face the steepest exposure, since they typically lack the capital scale to secure priority manufacturing capacity allocation. This exposure gap disproportionately affects clinical-stage gene therapy developers competing against larger originator manufacturers with established manufacturing infrastructure.
rare-neurological-disease-treatment-market-cost-volatility-analysis-1787309478414

Internal Viral Vector Manufacturing Investment

Larger manufacturers are investing directly in internal viral vector manufacturing capacity, reducing dependency on external contract manufacturers for their highest-value gene therapy products. This path demands substantial capital investment, but delivers durable production continuity that externally-sourced competitors cannot match at comparable scale. Manufacturers typically phase this capital deployment across several years to manage financing and integration risk carefully.

Long-Term Contract Manufacturing Agreements

Smaller manufacturers are locking in multi-year contract manufacturing agreements with specialized viral vector producers, securing reliable capacity ahead of anticipated commercial demand. This approach requires meaningful negotiating capacity, but delivers considerably steadier supply continuity than spot-market manufacturing arrangements. Manufacturers typically negotiate these agreements during periods of stable capacity availability to secure favorable long-term terms.

Strategic Partnership and Co-Development Agreements

Smaller biotechnology companies are pursuing strategic partnerships and co-development agreements with larger pharmaceutical companies, sharing development cost and manufacturing risk. This path requires meaningful equity or royalty concessions, but insulates smaller companies from capital constraints that could otherwise delay development timelines. Manufacturers typically pursue these agreements during earlier development phases to secure favorable terms before clinical validation.

Portfolio Architecture for Margin Defence

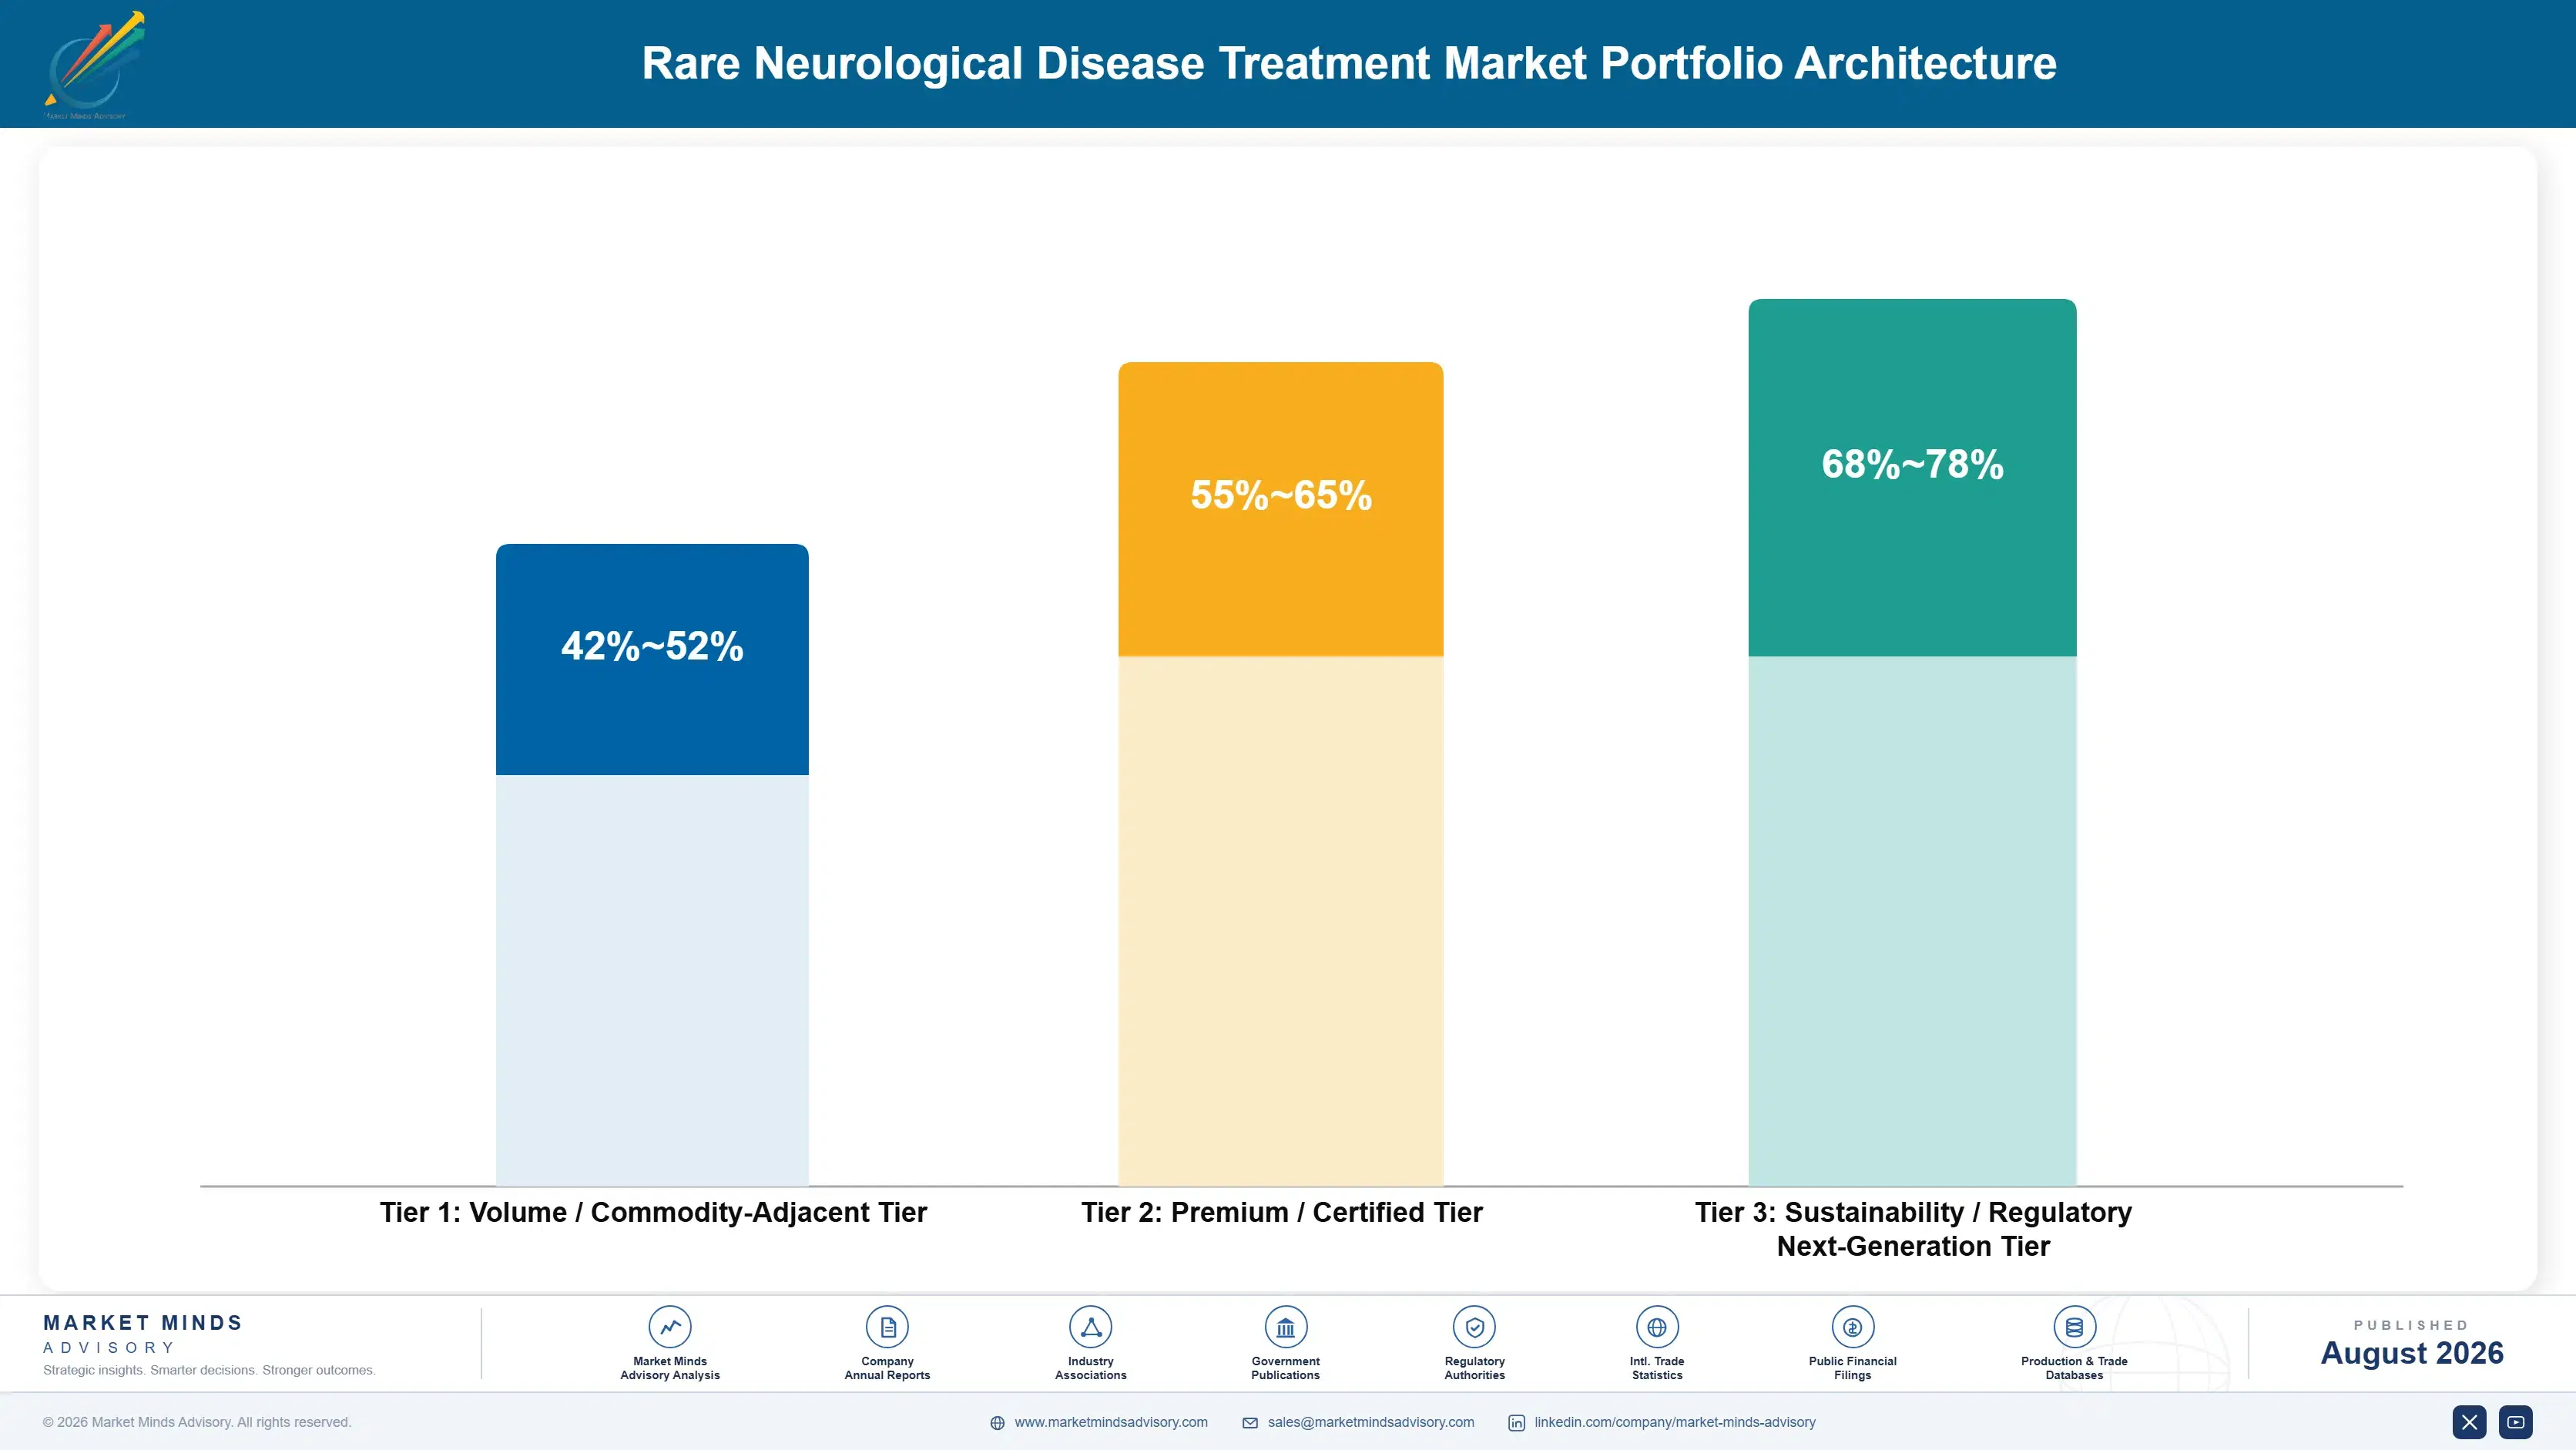
This market organizes into three commercial tiers spanning established chronic dosing therapies at the volume end, branded RNA-based and enzyme replacement mechanisms in the middle tier, and premium gene replacement therapies capturing the strongest margins at the top given curative positioning and durability evidence. Gross margins widen meaningfully moving up this ladder, reflecting the curative positioning and durability evidence each successive tier demands relative to chronic dosing therapy
Established and premium tiers pull manufacturers in genuinely different directions: established chronic dosing therapies sustain broad treated population revenue at moderating margins as gene therapy competition intensifies, while premium gene replacement mechanisms deliver materially stronger margins that increasingly fund the clinical development and manufacturing investment this diversifying category requires. Manufacturers that balance both sustain the treated population scale needed to fund development while shifting mix toward higher-margin gene therapy categories.

The highest-value pools concentrate around premium gene replacement therapies sold to pre-symptomatic and early-diagnosed patients, where curative positioning and accumulating durability evidence together sustain premium pricing power that chronic dosing alternatives increasingly cannot match. Manufacturers without meaningful presence in these premium categories increasingly find themselves competing purely on established relationships within a segment capturing a shrinking share of overall category profit.

Volume / Commodity-Adjacent Tier

Established chronic dosing therapies facing moderating exclusivity and growing gene therapy competitive displacement pressure. Competition centers increasingly on price and formulary access rather than clinical differentiation as gene therapy competition intensifies.
Gross Margin: 42-52%

Premium / Certified Tier

Branded RNA-based and enzyme replacement mechanisms within active patent protection serving conditions without gene therapy alternatives. These therapies command meaningfully stronger margins than chronic dosing output given their active patent protection and mechanism specificity.
Gross Margin: 55-65%

Sustainability / Regulatory / Next-Generation Tier

Premium gene replacement therapies commanding the strongest curative positioning and durability premium available currently. Manufacturers serving this tier typically maintain dedicated clinical development and manufacturing capability few smaller rivals can match.
Gross Margin: 68-78%
rare-neurological-disease-treatment-market-portfolio-architecture-1787309478905

High-value Sub-segments and Strategic Watch-out

Gene Replacement Therapies

The fastest-growing and highest-margin segment, combining strong pre-symptomatic treatment demand momentum with genuine willingness to pay premium pricing for curative positioning. Manufacturers with early durability advantages here are positioned to capture disproportionate category profit growth over the coming decade. Contract wins secured now compound meaningfully across the following decade.
Gross Margin: 68-78%

RNA Interference Therapies

Strong margins and rapid growth driven by expanding treatable condition categories that sustain category momentum as delivery technology continues advancing. Manufacturers advancing delivery technology early are best positioned to capture this broadening treatable condition demand pool. Clinical data readouts increasingly determine which manufacturers win this expanding demand pool.
Gross Margin: 60-70%

Established ASO and Enzyme Replacement Therapies

The volume core segment sustaining broad treated population revenue even as premium categories increasingly capture disproportionate profit growth. Manufacturers here compete primarily on established relationships and reimbursement access rather than novel differentiation currently. Scale and prescriber relationships remain the decisive factors separating leaders from laggards here.
Gross Margin: 42-52%

Small Molecule Orphan Drugs

A strategic watch-out segment facing narrowing addressable indications, requiring manufacturers to defend volume against expanding biologic and gene therapy alternatives industry-wide. Developers focused solely on this modality risk continued displacement unless they diversify into biologic and gene therapy categories. Investors continue watching closely for signs of continued relevance here.
Gross Margin: 36-46%

Chronic and Curative Treatment Cycles

Manufacturers of chronic dosing therapies capture durable, recurring prescription revenue over extended treatment durations, while gene replacement therapy manufacturers capture concentrated one-time revenue per patient, creating fundamentally different annuity structures within the same broader therapeutic category. This fundamental economic difference reshapes how manufacturers model long-term revenue predictability across their broader therapeutic portfolios. Payers increasingly develop disti
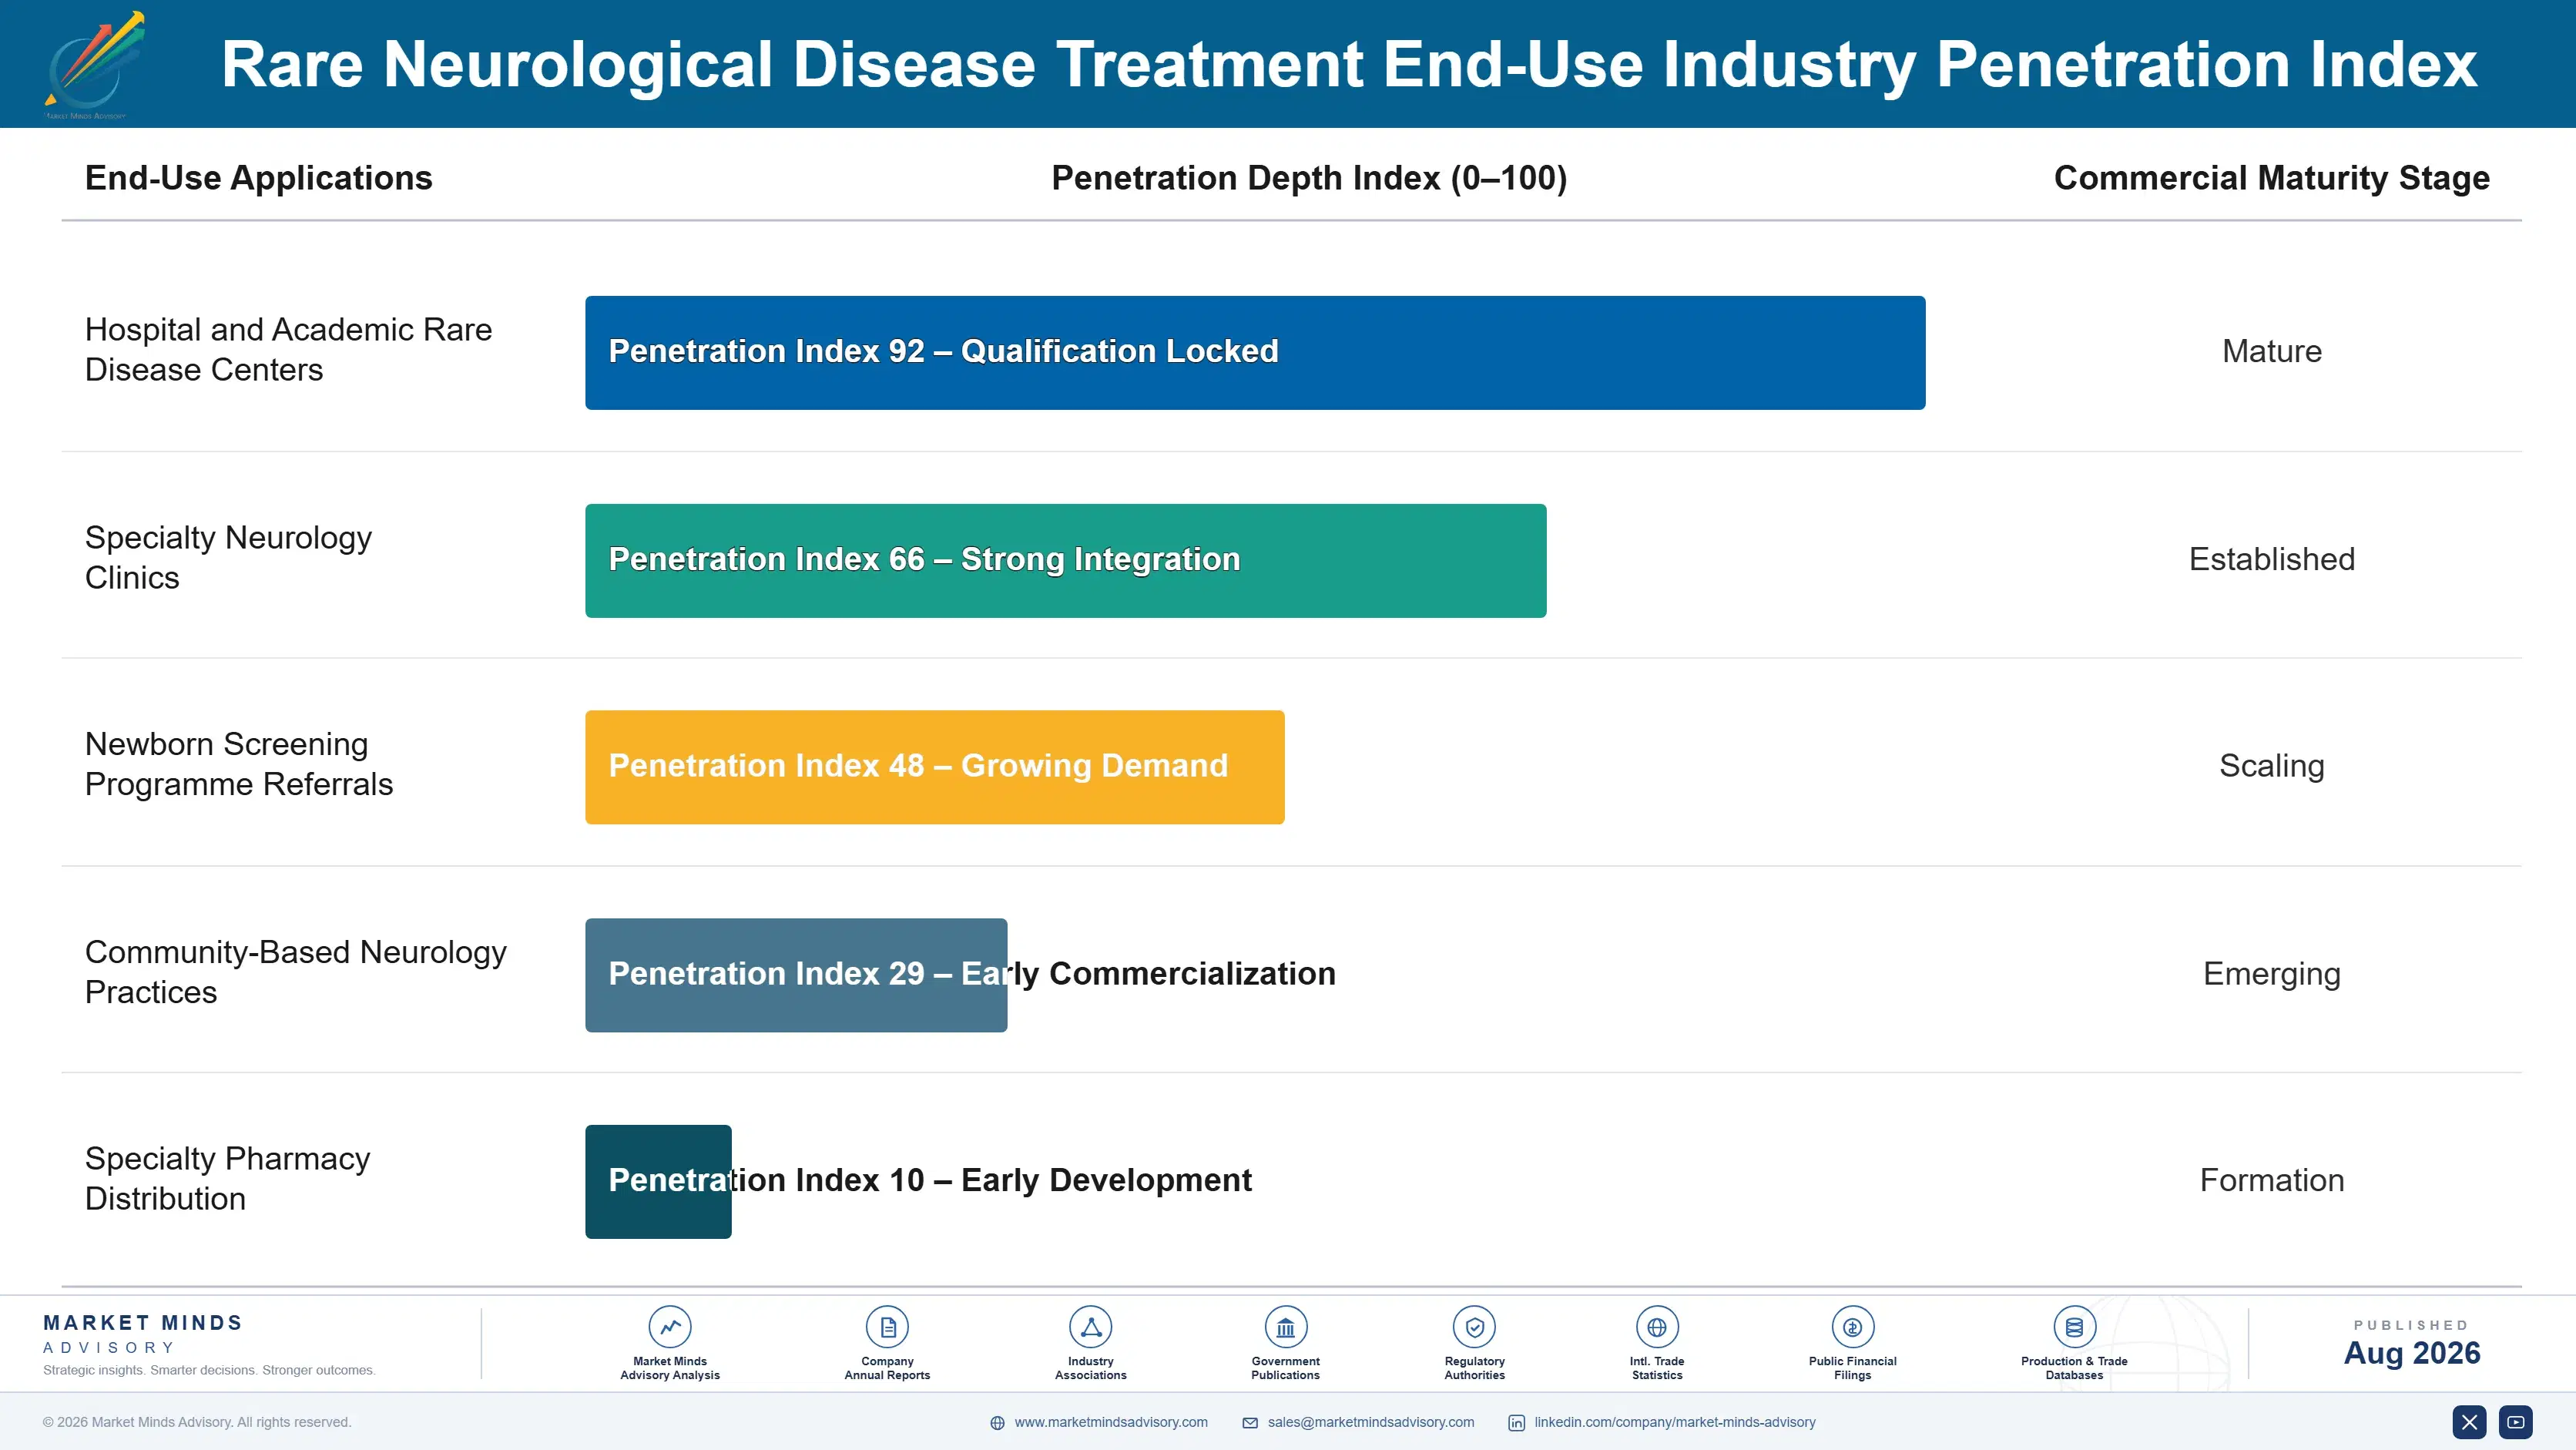
Adoption depth varies considerably by diagnosing pathway: patients identified through newborn screening programmes demonstrate the deepest treatment commitment given pre-symptomatic intervention timing and comprehensive specialist support, while patients diagnosed through traditional symptomatic presentation adopt more variably, facing diagnostic delay and later-stage intervention with less certain outcomes. Manufacturers serving both pathways increasingly maintain differentiated support programmes to address these divergent diagnostic timing needs.

A generational shift is underway as younger neurologists increasingly favor early, genetically confirmed diagnosis and immediate treatment initiation over the extended diagnostic odyssey earlier physician generations often required, reshaping treatment initiation timing across prescriber populations of varying experience. Younger prescriber cohorts increasingly enter practice already favoring evidence-based genetic confirmation over historical extended diagnostic odyssey norms. This shift meaningfully expands the treated population toward earlier, less advanced disease presentations.
rare-neurological-disease-treatment-market-end-use-penetration-index-1787309479394

Where Manufacturer Investment Should Concentrate

These are among the four positions where our research anticipates prominent divergence between winners and laggards over the coming forecast period. Each is grounded in the demand model, the regulatory perimeter, and the announced capacity pipeline.
01 / NEWBORN SCREENING INVESTMENT

Prioritize screening advocacy ahead of pre-symptomatic demand

Manufacturers investing in newborn screening advocacy and panel expansion are capturing a disproportionate share of the expanding pre-symptomatic diagnosed population, where screening access increasingly determines which companies capture prescription volume from patients identified before symptom onset. Companies without meaningful screening investment risk being confined to traditional symptomatic referral pathways facing a fundamentally limited, slower-growing addressable population. Expect newborn screening investment to become the single most important commercial differentiator for manufacturers seeking sustainable growth, particularly within gene therapy and enzyme replacement categories specifically.
02 / DURABILITY EVIDENCE INVESTMENT

Build durability data ahead of payer resistance resolution

Manufacturers investing in extended patient outcomes tracking and durability data publication are capturing a disproportionate share of payer and physician trust today, where documented evidence increasingly determines which companies win coverage approval amid persistent gene therapy pricing skepticism. Companies without meaningful durability investment risk losing access to the fastest-growing, most evidence-sensitive coverage decisions entirely to better-prepared competitors. Expect durability evidence depth to become an increasingly important determinant of manufacturer commercial leadership across premium modality categories, as coverage decisions continue tightening steadily.
03 / MANUFACTURING CAPACITY MANAGEMENT

Manage vector supply exposure through capacity investment

Manufacturers investing in internal viral vector manufacturing capacity and diversified contract relationships are sustaining considerably steadier production continuity than competitors exposed fully to concentrated external manufacturing dependency, and this advantage compounds further during periods of supply disruption affecting the broader industry. Companies without meaningful capacity investment face persistently higher launch delay risk regardless of underlying candidate quality or clinical trial design sophistication. Expect manufacturing capacity sophistication to become an increasingly important determinant of manufacturer commercial launch success going forward, particularly for smaller developers lacking comparable resources.
04 / PAYER PAYMENT MODEL INNOVATION

Watch outcomes-based agreements reshape access economics

Continued development of outcomes-based and installment payment agreements is steadily reshaping how payers approach premium gene therapy pricing, reflecting both persistent budget cycle constraints and a growing manufacturer willingness to share financial risk tied to sustained, well-documented clinical benefit. This trajectory shows no sign of reversing given sustained manufacturer investment in payment innovation and expanding payer acceptance outpacing traditional rigid pricing models. Expect payment model innovation to continue expanding meaningfully throughout the current forecast period across premium modality categories broadly.

Engagement Snapshot From the Field

A live engagement with an industry participant carrying material or product regulatory and market exposure ahead of a defining policy shift, showing how our research translates into a defensible multi-year portfolio strategy.
MARKET MINDS ADVISORY · CLIENT ENGAGEMENT SUMMARY
Rare Neurological Disease Treatment Producer Strategic Portfolio Review and Transition Roadmap 2026·Investment Scenario on Rare Neurological Disease Treatment Exposure Evaluation 2025-26
CLIENT PROFILE
The client is a gene therapy biopharmaceutical company generating projected annual revenue of approximately $420 million (client-reported, unverified by MMA) upon successful commercial launch of its rare neurological disease gene therapy candidate. The company had historically operated primarily within clinical development with limited prior payer relationship infrastructure. The company had historically maintained close relationships with a small group of academic key opinion leaders spanning several years of clinical trial partnership.
STRATEGIC CHALLENGE
The client had developed a promising gene replacement candidate demonstrating strong durability data, and leadership was uncertain whether investing in outcomes-based payment agreement development would generate sufficient payer coverage speed to justify the substantial commercial launch investment required given persistent premium pricing resistance. Leadership also questioned whether internal payer relations staffing could scale quickly enough to support a phased negotiation rollout.
MMA APPROACH
MMA's team benchmarked comparable gene therapy commercial launch and payer negotiation strategies, modeled projected coverage approval timelines and payment structure impact under various negotiation scenarios, and assessed the client's target payer landscape for outcomes-based agreement readiness across major markets. The team benchmarked realistic negotiation timelines given the client's constrained internal payer relations staffing and moderate risk tolerance.
KEY FINDINGS
  1. Comparable gene therapy launches achieved meaningfully faster payer coverage approval when paired with dedicated outcomes-based payment structuring (client-reported, unverified by MMA). This performance held across launches of comparable therapeutic differentiation.
  2. Payers expressed strong willingness to consider installment payment models given persistent budget cycle constraints affecting large upfront gene therapy cost absorption. This willingness extended across both public and private payer segments surveyed.
  3. Newborn screening partnership development generated meaningfully higher pre-symptomatic patient identification than symptomatic referral pathways operating independently. This partnership approach proved especially effective across health systems with pre-existing screening infrastructure.
  4. Outcomes-based agreement development, while a substantial upfront structuring cost, was offset by considerably faster payer coverage approval than standard fixed-price negotiation. This offset held consistently across multiple negotiation cycles evaluated during the pilot period.
CLIENT PROFILE
The client is a gene therapy biopharmaceutical company generating projected annual revenue of approximately $420 million (client-reported, unverified by MMA) upon successful commercial launch of its rare neurological disease gene therapy candidate. The company had historically operated primarily within clinical development with limited prior payer relationship infrastructure. The company had historically maintained close relationships with a small group of academic key opinion leaders spanning several years of clinical trial partnership.
STRATEGIC CHALLENGE
The client had developed a promising gene replacement candidate demonstrating strong durability data, and leadership was uncertain whether investing in outcomes-based payment agreement development would generate sufficient payer coverage speed to justify the substantial commercial launch investment required given persistent premium pricing resistance. Leadership also questioned whether internal payer relations staffing could scale quickly enough to support a phased negotiation rollout.
MMA APPROACH
MMA's team benchmarked comparable gene therapy commercial launch and payer negotiation strategies, modeled projected coverage approval timelines and payment structure impact under various negotiation scenarios, and assessed the client's target payer landscape for outcomes-based agreement readiness across major markets. The team benchmarked realistic negotiation timelines given the client's constrained internal payer relations staffing and moderate risk tolerance.
KEY FINDINGS
  1. Comparable gene therapy launches achieved meaningfully faster payer coverage approval when paired with dedicated outcomes-based payment structuring (client-reported, unverified by MMA). This performance held across launches of comparable therapeutic differentiation.
  2. Payers expressed strong willingness to consider installment payment models given persistent budget cycle constraints affecting large upfront gene therapy cost absorption. This willingness extended across both public and private payer segments surveyed.
  3. Newborn screening partnership development generated meaningfully higher pre-symptomatic patient identification than symptomatic referral pathways operating independently. This partnership approach proved especially effective across health systems with pre-existing screening infrastructure.
  4. Outcomes-based agreement development, while a substantial upfront structuring cost, was offset by considerably faster payer coverage approval than standard fixed-price negotiation. This offset held consistently across multiple negotiation cycles evaluated during the pilot period.
RECOMMENDED STRATEGY
Phase 1: Phase 1 (Months 1-7): Develop outcomes-based payment structures targeting the client's highest-priority payer relationships in its primary launch markets first. Phase 2: Phase 2 (Months 8-15): Expand newborn screening partnership development while finalizing payer coverage agreements across additional markets. Build dedicated payer relations capability focused on structuring durable coverage agreements. Phase 3: Phase 3 (Months 16-24): Scale commercial investment further based on realized coverage approval speed and patient identification performance results. Evaluate further investment based on realized approval speed and identification outcomes.
OUTCOME
The client developed its outcomes-based payment structures and newborn screening partnerships within the recommended timeline, reporting coverage approval speed and patient identification results consistent with initial modeling projections (client-reported, unverified by MMA). The company also secured coverage agreements with eleven major payers within the first year of commercial launch.

Frequently Asked Questions

Foundational context covering the market sizes, CAGR, scope, country, region and competition that inform every finding below. This section is provided to cover basics and most often pre-purchase conversations, answered from the MMA Primary Research Dataset.

What is the current size of the Rare Neurological Disease Treatment Market?

The market was valued at approximately $14.5 billion in 2025. This includes gene replacement, RNA-based, enzyme replacement, and small molecule therapies for rare neurological conditions.

How large will the Rare Neurological Disease Treatment Market be by 2036?

The market is projected to reach approximately $49.46 billion by 2036, up from about $16.21 billion in 2026. This reflects gene therapy expansion and newborn screening growth.

What is the CAGR for the Rare Neurological Disease Treatment Market 2026 to 2036?

The market is expected to grow at a compound annual growth rate of 11.8% between 2026 and 2036. This reflects accelerating gene replacement therapy adoption industry-wide.

Which segment is growing fastest?

Gene replacement therapies are the fastest-growing segment, expanding at approximately 18.5% annually. This reflects strong demand for curative treatment among pre-symptomatic patients identified through newborn screening.

Who are the major companies in the Rare Neurological Disease Treatment Market?

Leading companies include Biogen, Novartis, Roche, Sarepta Therapeutics, and Ionis Pharmaceuticals. Together these five companies account for roughly 46% of total global prescription revenue overall.

Which country is growing fastest?

China is the fastest-growing major country at an estimated 15.0% CAGR, driven by rapidly expanding diagnostic infrastructure and rapidly rising newborn screening investment across the country.

Report Segmentation Architecture

The full report scope spans multiple orthogonal segmentation dimensions, with cross-tabulated demand data provided for each dimension pair. Coverage extends further to regional breakdowns, trend trajectories, and the competitive detail needed to support segment-level decision-making.

By Drug Modality

  • Gene Replacement Therapies
  • Antisense Oligonucleotide Therapies
  • RNA Interference Therapies
  • Enzyme Replacement Therapies
  • Monoclonal Antibody Therapies
  • Small Molecule Orphan Drugs

By End-Use Industry

  • Hospital and Academic Rare Disease Centers
  • Specialty Neurology Clinics
  • Newborn Screening Programme Referrals
  • Community-Based Neurology Practices
  • Specialty Pharmacy Distribution

By Commercial Dimension

  • Branded Prescription Sales
  • Specialty Pharmacy Distribution
  • Outcomes-Based Payer Agreements
  • Patient Assistance Programme Access

By Region

  • North America
  • Western Europe
  • East Asia
  • South Asia and Pacific
  • Latin America
  • Middle East and Africa
  • Eastern Europe

Scope, Methodology, and Coverage

Every figure in this report is reproducible from documented input assumptions. The scope below maps the historical period, the forecast horizon, the segmentation dimensions, and the countries covered, alongside the underlying primary and qualitative methodology.
Historical Period
2020 to 2025
Forecast Period
2026 to 2036
Base Year
2025 (USD billions; MMA Primary Research Dataset, August 2026)
Market Definition
This market covers pharmaceutical and biological therapies approved or in late-stage development for rare neurological diseases affecting small, genetically defined patient populations, spanning gene replacement, antisense oligonucleotide, RNA interference, enzyme replacement, monoclonal antibody, and small molecule modalities. It excludes therapies for common neurological conditions affecting broad patient populations.
Quantitative Units
USD billions (current prices); treated patients; prescription volume
Segmentation Dimensions
By Drug Modality; By End-Use Industry; By Commercial Dimension; By Region
Regions Covered
North America, Western Europe, East Asia, South Asia and Pacific, Latin America, Middle East and Africa, Eastern Europe
Countries Covered
USA, China, Germany, France, UK, Japan, South Korea, India, Australia, Canada, Brazil, Mexico, Indonesia, Vietnam, Thailand, Malaysia, UAE, Saudi Arabia, South Africa, Nigeria, Turkey, Poland, Netherlands, Italy, Spain, Sweden, Switzerland, Argentina, Colombia, Singapore, and additional markets relevant to this sector
Key Companies Profiled
Biogen, Novartis, Roche, Sarepta Therapeutics, Ionis Pharmaceuticals, PTC Therapeutics, BioMarin Pharmaceutical, Alnylam Pharmaceuticals, uniQure N.V., Amicus Therapeutics, Vertex Pharmaceuticals, Neurogene Inc., Passage Bio Inc., Taysha Gene Therapies, Encoded Therapeutics, Ultragenyx Pharmaceutical, Denali Therapeutics, Prilenia Therapeutics, Wave Life Sciences, CRISPR Therapeutics
Quantitative Methodology
Primary survey, n=3,800 respondents, Q4 2025, six countries; demand-side model with trade association cross-validation
Qualitative Methodology
47 expert interviews, Q4 2025; applied to validate demand model assumptions, identify emerging dynamics, and assess competitive positioning
Report Format
PDF and XLSX data workbook (Word format preview document)
Publisher
Market Minds Advisory
Report Code
MMA-2026-HLT-152
Published
August 2026
Contact
sales@marketmindsadvisory.com | www.marketmindsadvisory.com

Purchase the full Rare Neurological Disease Treatment Market Report (2026 to 2036).

The full report provides detailed modality segmentation, treated patient and prescription revenue trend analysis, and regional reimbursement tracking across major global markets covered in this study. It includes company-level competitive benchmarking based on prescription revenue and pipeline breadth, alongside detailed viral vector manufacturing cost commentary. Subscribers receive quarterly updates tracking new clinical trial results and regulatory developments as they occur. A companion dataset provides treated patient volume estimates by country for detailed market sizing purposes. A dedicated appendix profiles the twenty leading companies named in this study, covering their pipeline breadth and clinical development stage in detail.
Modality segmentation breakdown by drug class
Country-level treated patient volume trend dataset
Pipeline tracking and clinical trial benchmarking service
Company competitive benchmarking scorecards and overview
Quarterly clinical trial and regulatory update service
Treated patient volume dataset segmented by region

Built For The People Who Decide

From boardroom strategy to bench-side execution, this report is read cover-to-cover by leaders shaping the next decade of their industry, turning demand scenarios, market dynamics and valuation benchmarks into decisions.
CXOs/ Presidents/ VPs/ Managers
M&A and Corporate Development
Strategy Teams and R&D Heads
Procurement and Product Directors
Regulatory and Compliance Leaders
Investor Relations and Equity Analysts