Market Minds Advisory
Rare Disease Clinical Trials Market

Rare Disease Clinical Trials Market: Finding Forty Patients Across Nine Countries and Persuading Half of Them to Travel

A rare disease trial needs forty patients scattered across nine countries, and the recruitment problem is not persuading them to enrol but finding out that they exist at all. or that anybody has diagnosed them.

Lead Analyst

Alice Ballenger

Published

September 2026

Make Smarter Decisions with Customized Research Insights

Request a free sample report and evaluate market opportunities, growth trends, and competitive dynamics relevant to your business needs.

2025 MARKET VALUE$9.6BMarket Size 2025
2036 FORECAST VALUE$30.5BBase Case , 2026 to 2036
CAGR 2026 TO 203611.0 %Bull 12.4% / Bear 9.6%
INCREMENTAL OPPORTUNITY$19.8BNet 10- year value creation
EXPANSION MULTIPLE2.84x2036 value over 2026 base
Strategic Levers
M&A Pipeline
Regional Outlook
Country Rankings
Competitive Intelligence
Segmental Deep-dive
Call-Us : 91 93563 13602

Executive Snapshot and Market Trajectory

A rare disease trial inverts every assumption of conventional clinical development. Instead of screening thousands to enrol hundreds, the sponsor is hunting for perhaps forty eligible patients worldwide, and the binding problem is identifying them rather than convincing them to participate. Every operational decision follows from that inversion.
Decentralised and home-based delivery compounds at 16.5%, exactly 1.50 times the market, because asking a family to travel to a distant site every fortnight is what actually loses these trials. North America holds 30% of spend on site density and sponsor concentration. Screen failure runs near 34% even after identification. Around 61% of programmes overrun their enrolment plan by a full year. Identification is the binding constraint.
Five providers hold 42%, which is low for clinical development, because rare disease work rewards therapeutic depth over global site networks. A provider who knows where the patients are beats one with sixty offices. Feasibility built on published prevalence rather than diagnosed and unenrolled prevalence is what causes almost every one of those overruns, and it is entirely avoidable. Registry access and competing trial intelligence both accumulate over years. Neither can be bought late.
Market Definition
The market covers clinical development services for rare and ultra-rare disease trials, spanning patient identification and registry services, site management and monitoring, decentralised and home-based trial delivery, natural history and external control studies, specialised endpoint and biomarker assessment, and regulatory and market access evidence support. Preclinical research services, commercial-scale manufacturing, post-approval commercial activity, patient advocacy funding unconnected to a trial, and diagnostic testing sold outside a study protocol are excluded.
Base Year Value
$9.6B in 2025 (MMA Primary Research Dataset, August 2026)
Forecast Period
2026 to 2036, eleven discrete annual values
CAGR
11.0% base case. Bull 12.4%. Bear 9.6%.
Fastest Growth Segment
Decentralised and Home-Based Trial Delivery: 16.5% CAGR
Fastest Growth Country
China: 13.7% CAGR
Fastest Growth Region
South Asia and Pacific: 13.2% CAGR
Largest Region
North America: 30% of 2025 global value
Market Leaders
IQVIA, Parexel, Premier Research, Medpace, Rare Disease Research Partners. Source: MMA Analysis based on company annual reports.
Primary Survey
n=3,800 procurement and R&D decision-makers, Q4 2025, six countries
Methodology
Demand-side build-up, cross-validated against public data, 47 expert interviews

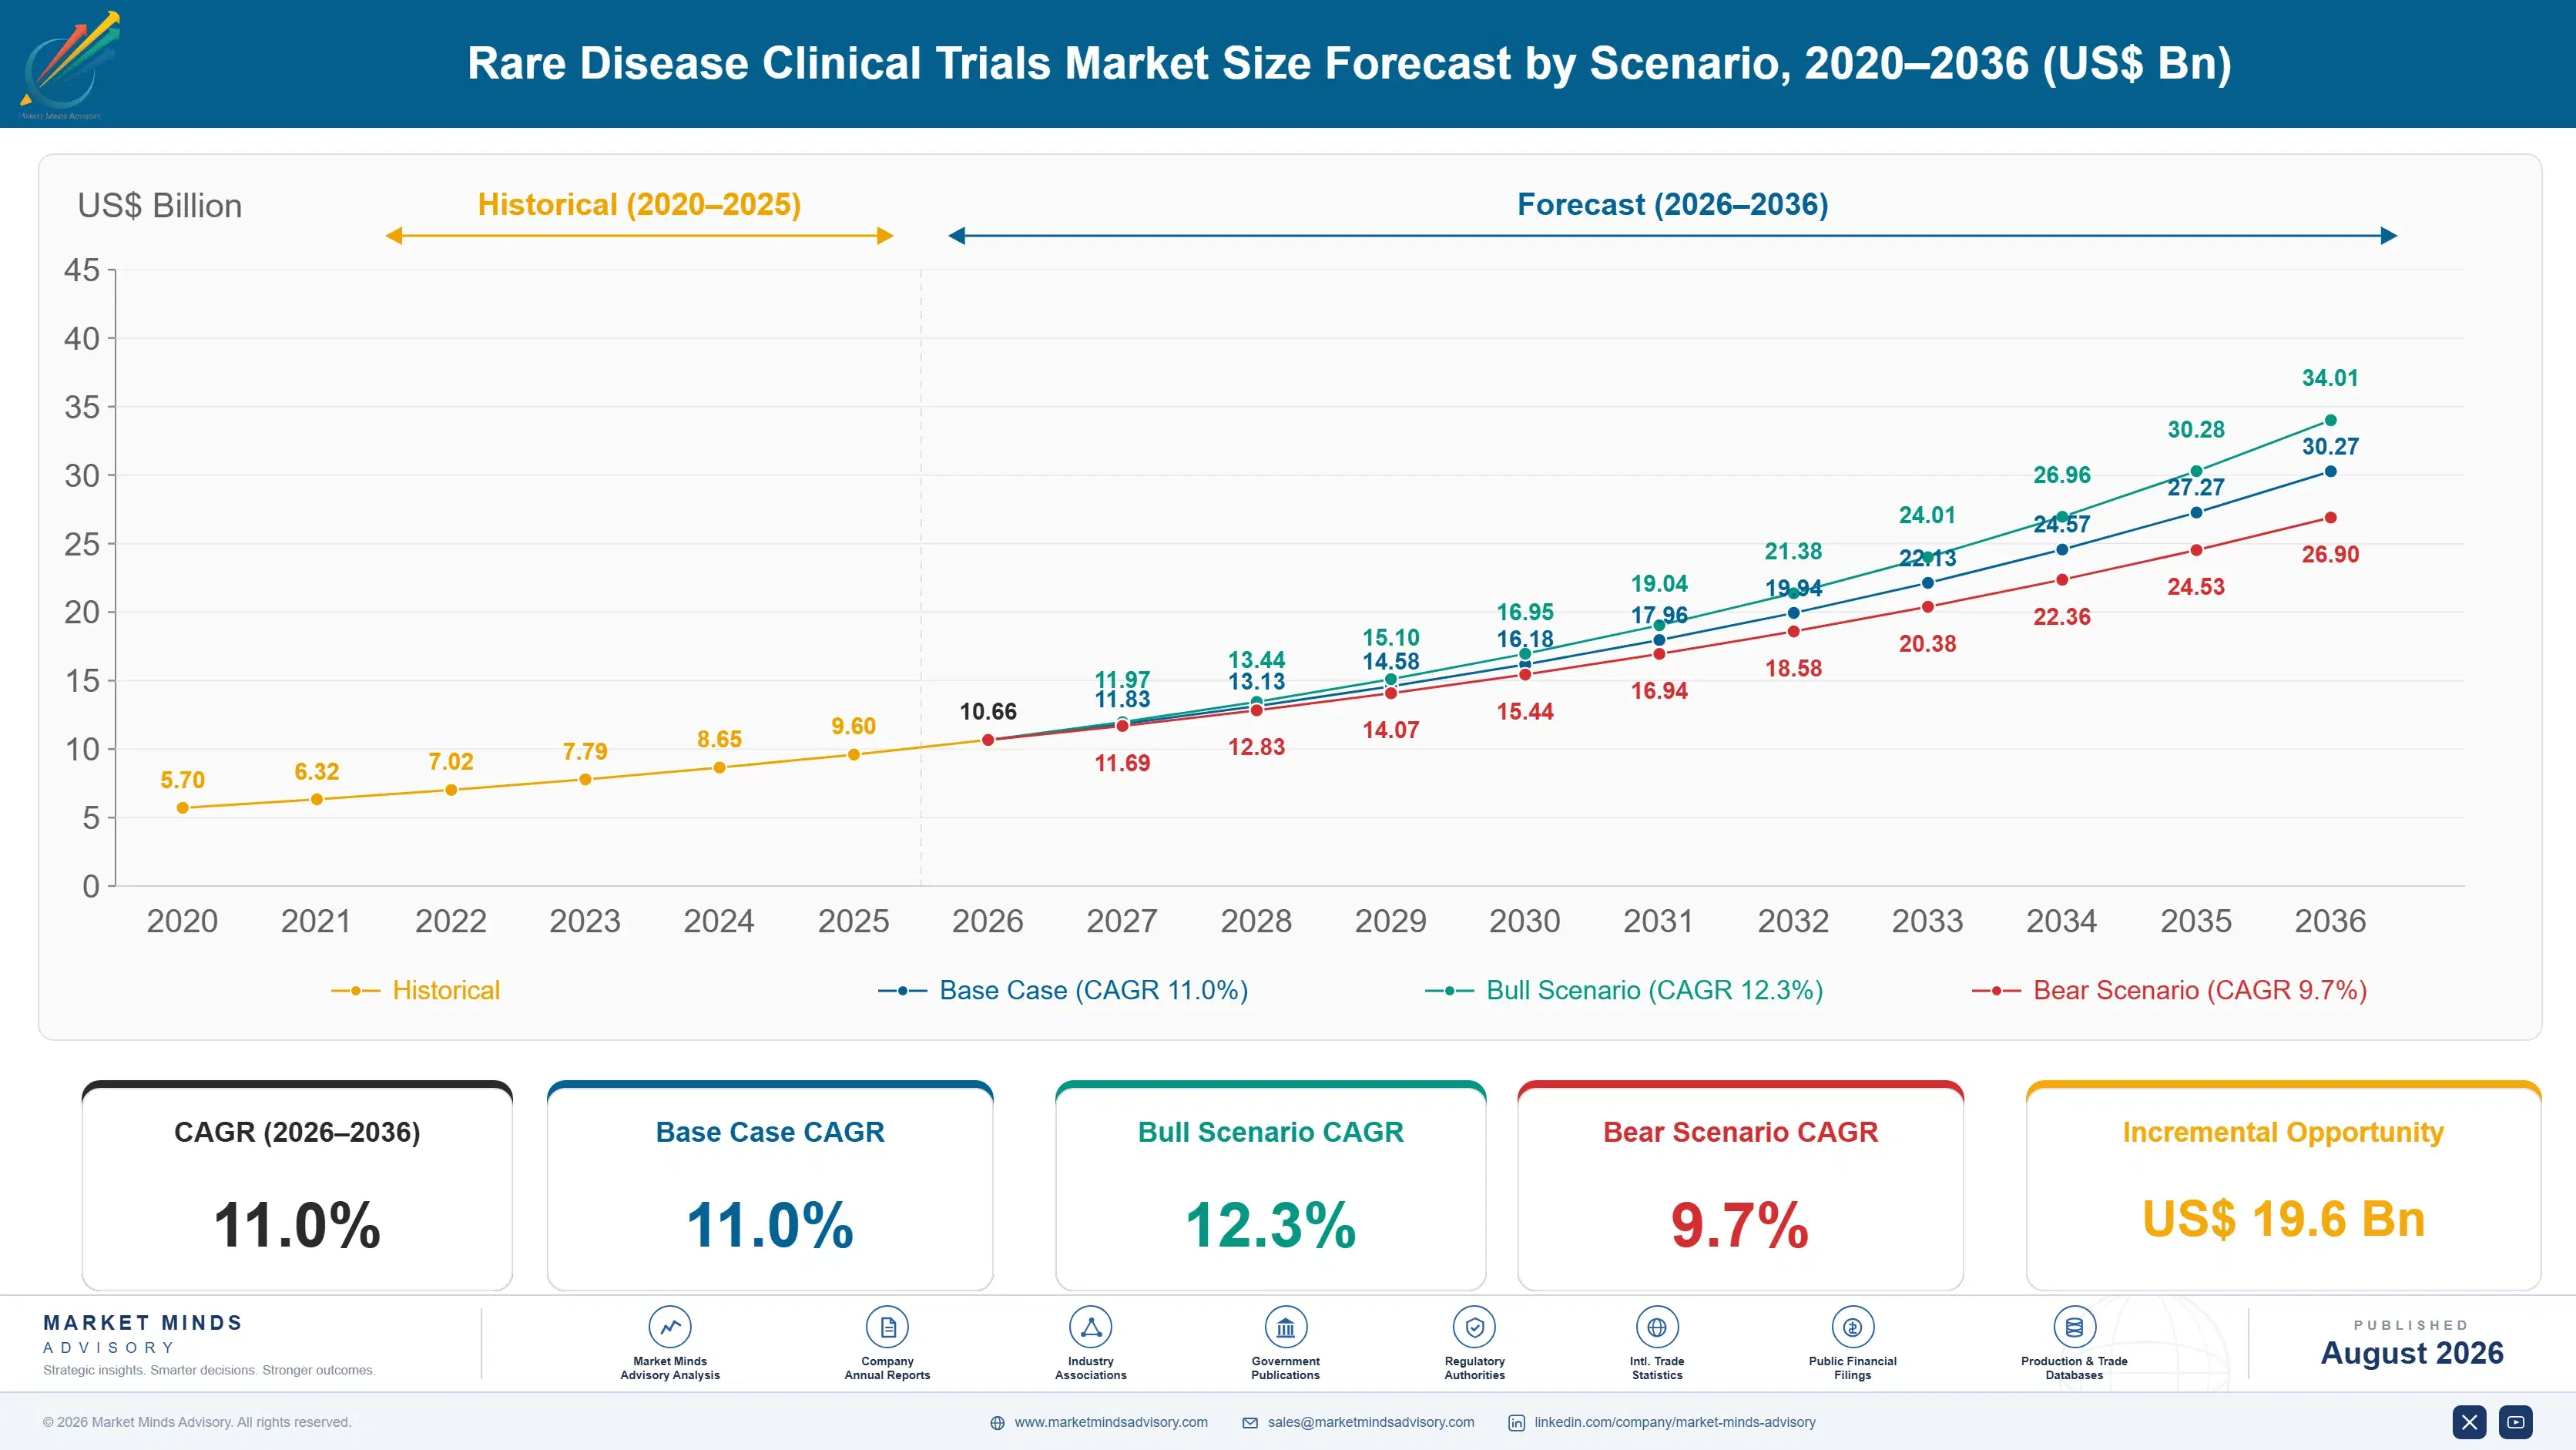
Rare Disease Clinical Trials Market Forecast Scenarios

rare-disease-clinical-trials-market-size-forecast-scenario-1787309270271
Growth of 9.7% across 2020 to 2025 came from an expanding pipeline meeting a fixed patient pool. Orphan designations kept rising, gene therapy programmes multiplied, and the binding constraint proved to be access to patients already known to a few centres. Cost per patient rose sharply, and several programmes were abandoned for enrolment failure rather than for safety or efficacy.
The base case of 11.0% rests on three mechanisms. Decentralised delivery is removing the travel burden that made participation impossible for families managing a severely affected child, which converts identified patients into enrolled ones. Registry and natural history study demand keeps growing because regulators accept external control arms where randomisation is impractical. And newborn genetic screening is identifying patients before symptom onset, creating trial-eligible populations that did not previously exist.
The bull case of 12.3% assumes newborn screening panels expand substantially across major systems, since presymptomatic identification transforms both trial feasibility and the therapeutic window available. The bear case of 9.7% reflects the constraint nobody has solved: patient pools stay fixed, competing programmes bid site capacity away from each other, and enrolment timelines extend until sponsors abandon indications that remain scientifically attractive but operationally impossible.

Hunting Patients Rather Than Recruiting Them

Conventional clinical development screens thousands of patients to enrol hundreds. Rare disease development does the opposite: a typical ultra-rare programme needs around 42 randomised patients and has to assemble them across nine countries, because no single country holds enough diagnosed cases. The scarce resource is the patient, and every operational decision follows from that inversion.
TOP FIVE CONCENTRATION42%Combined share held by the five largest clinical development providers
MEDIAN ENROLMENT TARGET42 patientsTypical randomised population across an ultra-rare disease programme
COUNTRIES PER PROGRAMME9 countriesGeographic spread required to assemble a viable study population
SCREEN FAILURE RATE34% of referralsShare of identified candidates ineligible after formal screening assessment
SITE VISIT BURDEN26 visitsProtocol visits families must attend across a typical study
TRIALS RUNNING BEYOND PLAN61% of programmesShare exceeding original enrolment timelines by a full year
Identification rather than persuasion is the constraint. Families with a rare diagnosis are usually eager to participate, and around 34% of identified candidates still fail formal screening on genotype, disease stage or prior treatment criteria. That leaves a very small pool from which to build a study, and 61% of programmes exceed their original enrolment timeline by a year or more as a direct consequence.
The other reliable failure is burden. A protocol demanding 26 site visits over two years asks a family already managing a serious chronic condition to travel repeatedly to a centre that may be in another country. Decentralised and home-based delivery removes most of that, which is why it compounds at 16.5%, and it is an operational decision rather than a scientific one. Regulatory acceptance of remote endpoints is now the binding constraint.
"Sponsors budget carefully for site payments and monitoring and then lose two years because the protocol asked a family with a sick child to fly to another country twenty-six times. That is a design failure, not a recruitment failure."
Principal, Rare Disease Clinical Development Practice · MMA Clinical Development

Market Trends

Decentralised Delivery Removes the Burden That Loses Trials

A protocol requiring 26 site visits over two years asks a family managing a serious condition to travel repeatedly, frequently across borders, and that burden rather than any reluctance to participate is what causes dropout and slow enrolment. Home nursing visits, local laboratory collection and remote assessment remove most of it. The approach compounds at 16.5% against a market at 11.0%, and the constraint is now regulatory acceptance of remote endpoint capture rather than any operational difficulty. Hybrid designs with anchor site visits are the practical compromise that regulators accept today.
Market Impact: Overruns affecting 61% of all progr
External Control Arms Replace Randomisation Where It Fails Ethically

Randomising 42 patients against placebo in a progressive fatal condition raises objections no ethics committee overlooks, which has blocked programmes that were otherwise viable. Natural history studies and disease registries provide external control data that regulators increasingly accept, and building that evidence before the interventional trial has become a distinct service line. It also requires the sponsor to commit years earlier than a conventional programme would, which changes development planning substantially. Sponsors who fund natural history early gain a feasible development path, and those who do not discover the obstacle after scoping.
Market Impact: Screen failure removing 34% of refe

Market Opportunities and Growth Drivers

Orphan Programme Volume Keeps Outpacing Patient Availability

Regulatory incentives have pulled an unusually large number of developers into rare disease simultaneously, and in the conditions attracting most attention several programmes now compete for the same diagnosed patients. That raises the value of any provider who can identify patients nobody else has found, and it makes site selection a competitive rather than a logistical exercise. Around 61% of programmes already exceed their original enrolment timeline by a year or more. Site level feasibility mapping has become essential rather than optional in the crowded conditions. Site selection has become a competitive exercise rather than a logistical one.
Market Impact: Targets near 42 patients per study

Genetic Diagnosis Expansion Creates Newly Identifiable Populations

Panel and whole genome sequencing entering routine paediatric and specialist practice identifies conditions that previously went unnamed for years, which converts invisible patients into potential trial participants. That expansion benefits every sponsor working in the affected conditions and it arrives unevenly by country, so a provider who tracks where diagnostic capability has recently improved can find populations that were unavailable eighteen months earlier. Screen failure still removes around 34% of those identified. A provider tracking where diagnostic capability improved recently finds populations unavailable eighteen months earlier. Diagnostic capability improves unevenly by country, which rewards tracking it closely.
Market Impact: Cutting from 26 visits per protocol

Market Restraints and Challenges

Competing Trials Exhaust the Diagnosed Patient Pool

In conditions attracting several simultaneous programmes, the diagnosed population is simply insufficient for all of them, and sponsors discover this only when enrolment stalls at a site that has already committed its patients elsewhere. The root cause is that feasibility assessments use epidemiological prevalence rather than diagnosed and unenrolled prevalence. Providers mitigate by mapping competing trial activity site by site before committing, and by prioritising countries where diagnostic capability has recently improved. Countries where diagnostic capability has recently improved are where uncommitted patients actually sit. Sponsors discover this only when enrolment stalls at a committed site.
Market Impact: Removing most of 26 protocol visits

Remote Endpoint Capture Faces Uneven Regulatory Acceptance

Decentralised delivery works operationally and regulators differ considerably on whether remotely captured functional and imaging endpoints support a registration claim. The root cause is that validation of remote assessment against site-based measurement is incomplete for many rare disease endpoints. Providers mitigate by running hybrid designs with anchor site visits, by validating remote instruments against conventional assessment within the study, and by agreeing endpoint approach with regulators before finalising protocol design. Agreeing the endpoint approach with regulators before finalising protocol design avoids the whole problem. Hybrid designs with anchor visits remain the practical compromise here.
Market Impact: Randomising only 42 patients per pr
4 additional market trends, 3 additional growth drivers, and 2 additional restraints and challenges are covered in the full report. Contact sales@marketmindsadvisory.com to access the complete intelligence.

Segment CAGR and Growth Architecture

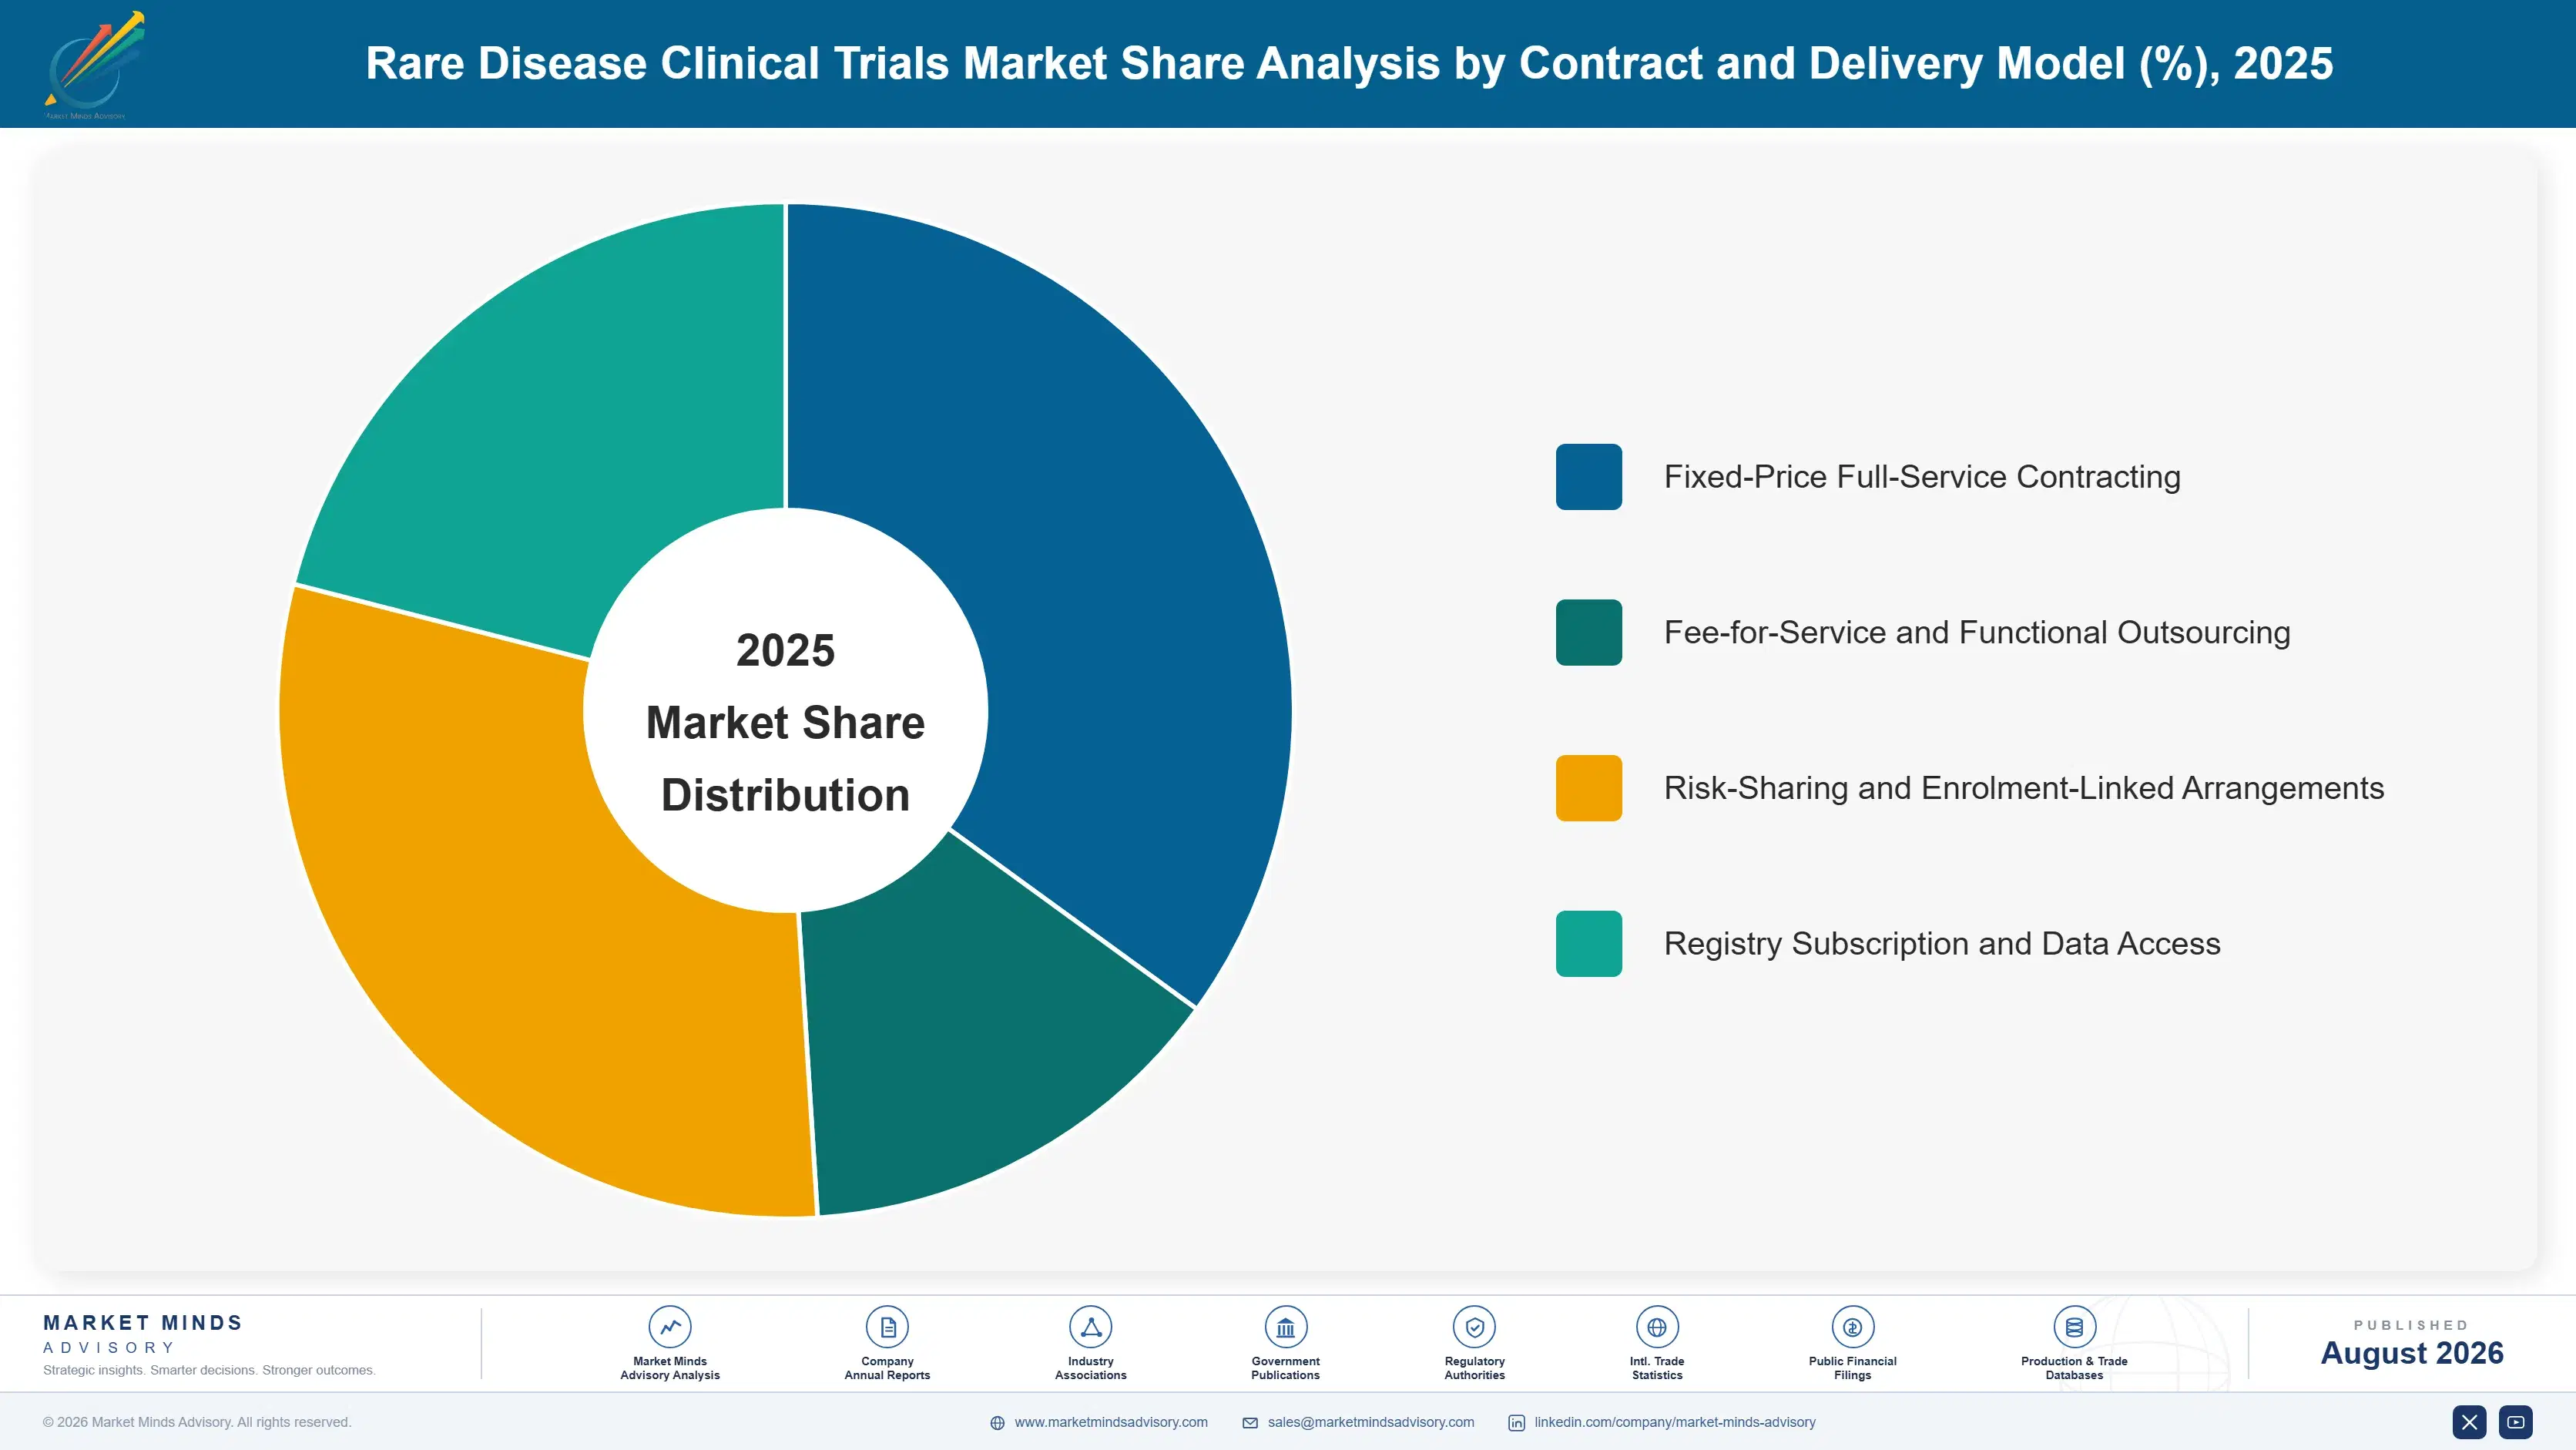
Segmentation follows service function, because each addresses a different failure mode in rare disease development: finding the patient, keeping them enrolled, generating a control arm, or measuring an endpoint nobody has validated. Sponsors buy these separately and rarely from a single provider. Six service functions sit in this hierarchy. Sponsors buy them separately and rarely from one provider.
rare-disease-clinical-trials-market-market-share-analysis-1787309270803

Decentralised and Home-Based Trial Delivery

Decentralised delivery compounds at 16.5%, exactly 1.50 times the market, because participant burden rather than participant willingness is what loses rare disease trials. A protocol demanding 26 visits over two years asks a family already managing a serious chronic condition to travel repeatedly and often internationally, and dropout follows predictably. Home nursing, local phlebotomy, mobile imaging and remote assessment remove most of that burden while keeping the participant enrolled. Operationally this is now well understood; the live constraint is regulatory acceptance of remotely captured functional and imaging endpoints, which varies by agency and by endpoint. Hybrid designs with anchor site visits are the practical compromise, and they still remove the majority of the travel that families cannot sustain.
CAGR 16.5%

Natural History and External Control Studies

Natural history and external control work grows at 14.9% because randomising around 42 patients against placebo in a progressive fatal condition raises objections that block otherwise viable programmes. A well-constructed natural history dataset provides the comparator instead, and regulators have become considerably more willing to accept it where the disease course is well characterised and the outcome measure is objective. The commercial difficulty is timing: this evidence has to be assembled years before the interventional trial, which means committing capital long before a molecule has shown anything. Sponsors who fund it early gain a feasible development path, and those who do not frequently discover the ethical obstacle after the programme is already scoped.
CAGR 14.9%
Full segment breakdown across 6 segments available in the complete report.

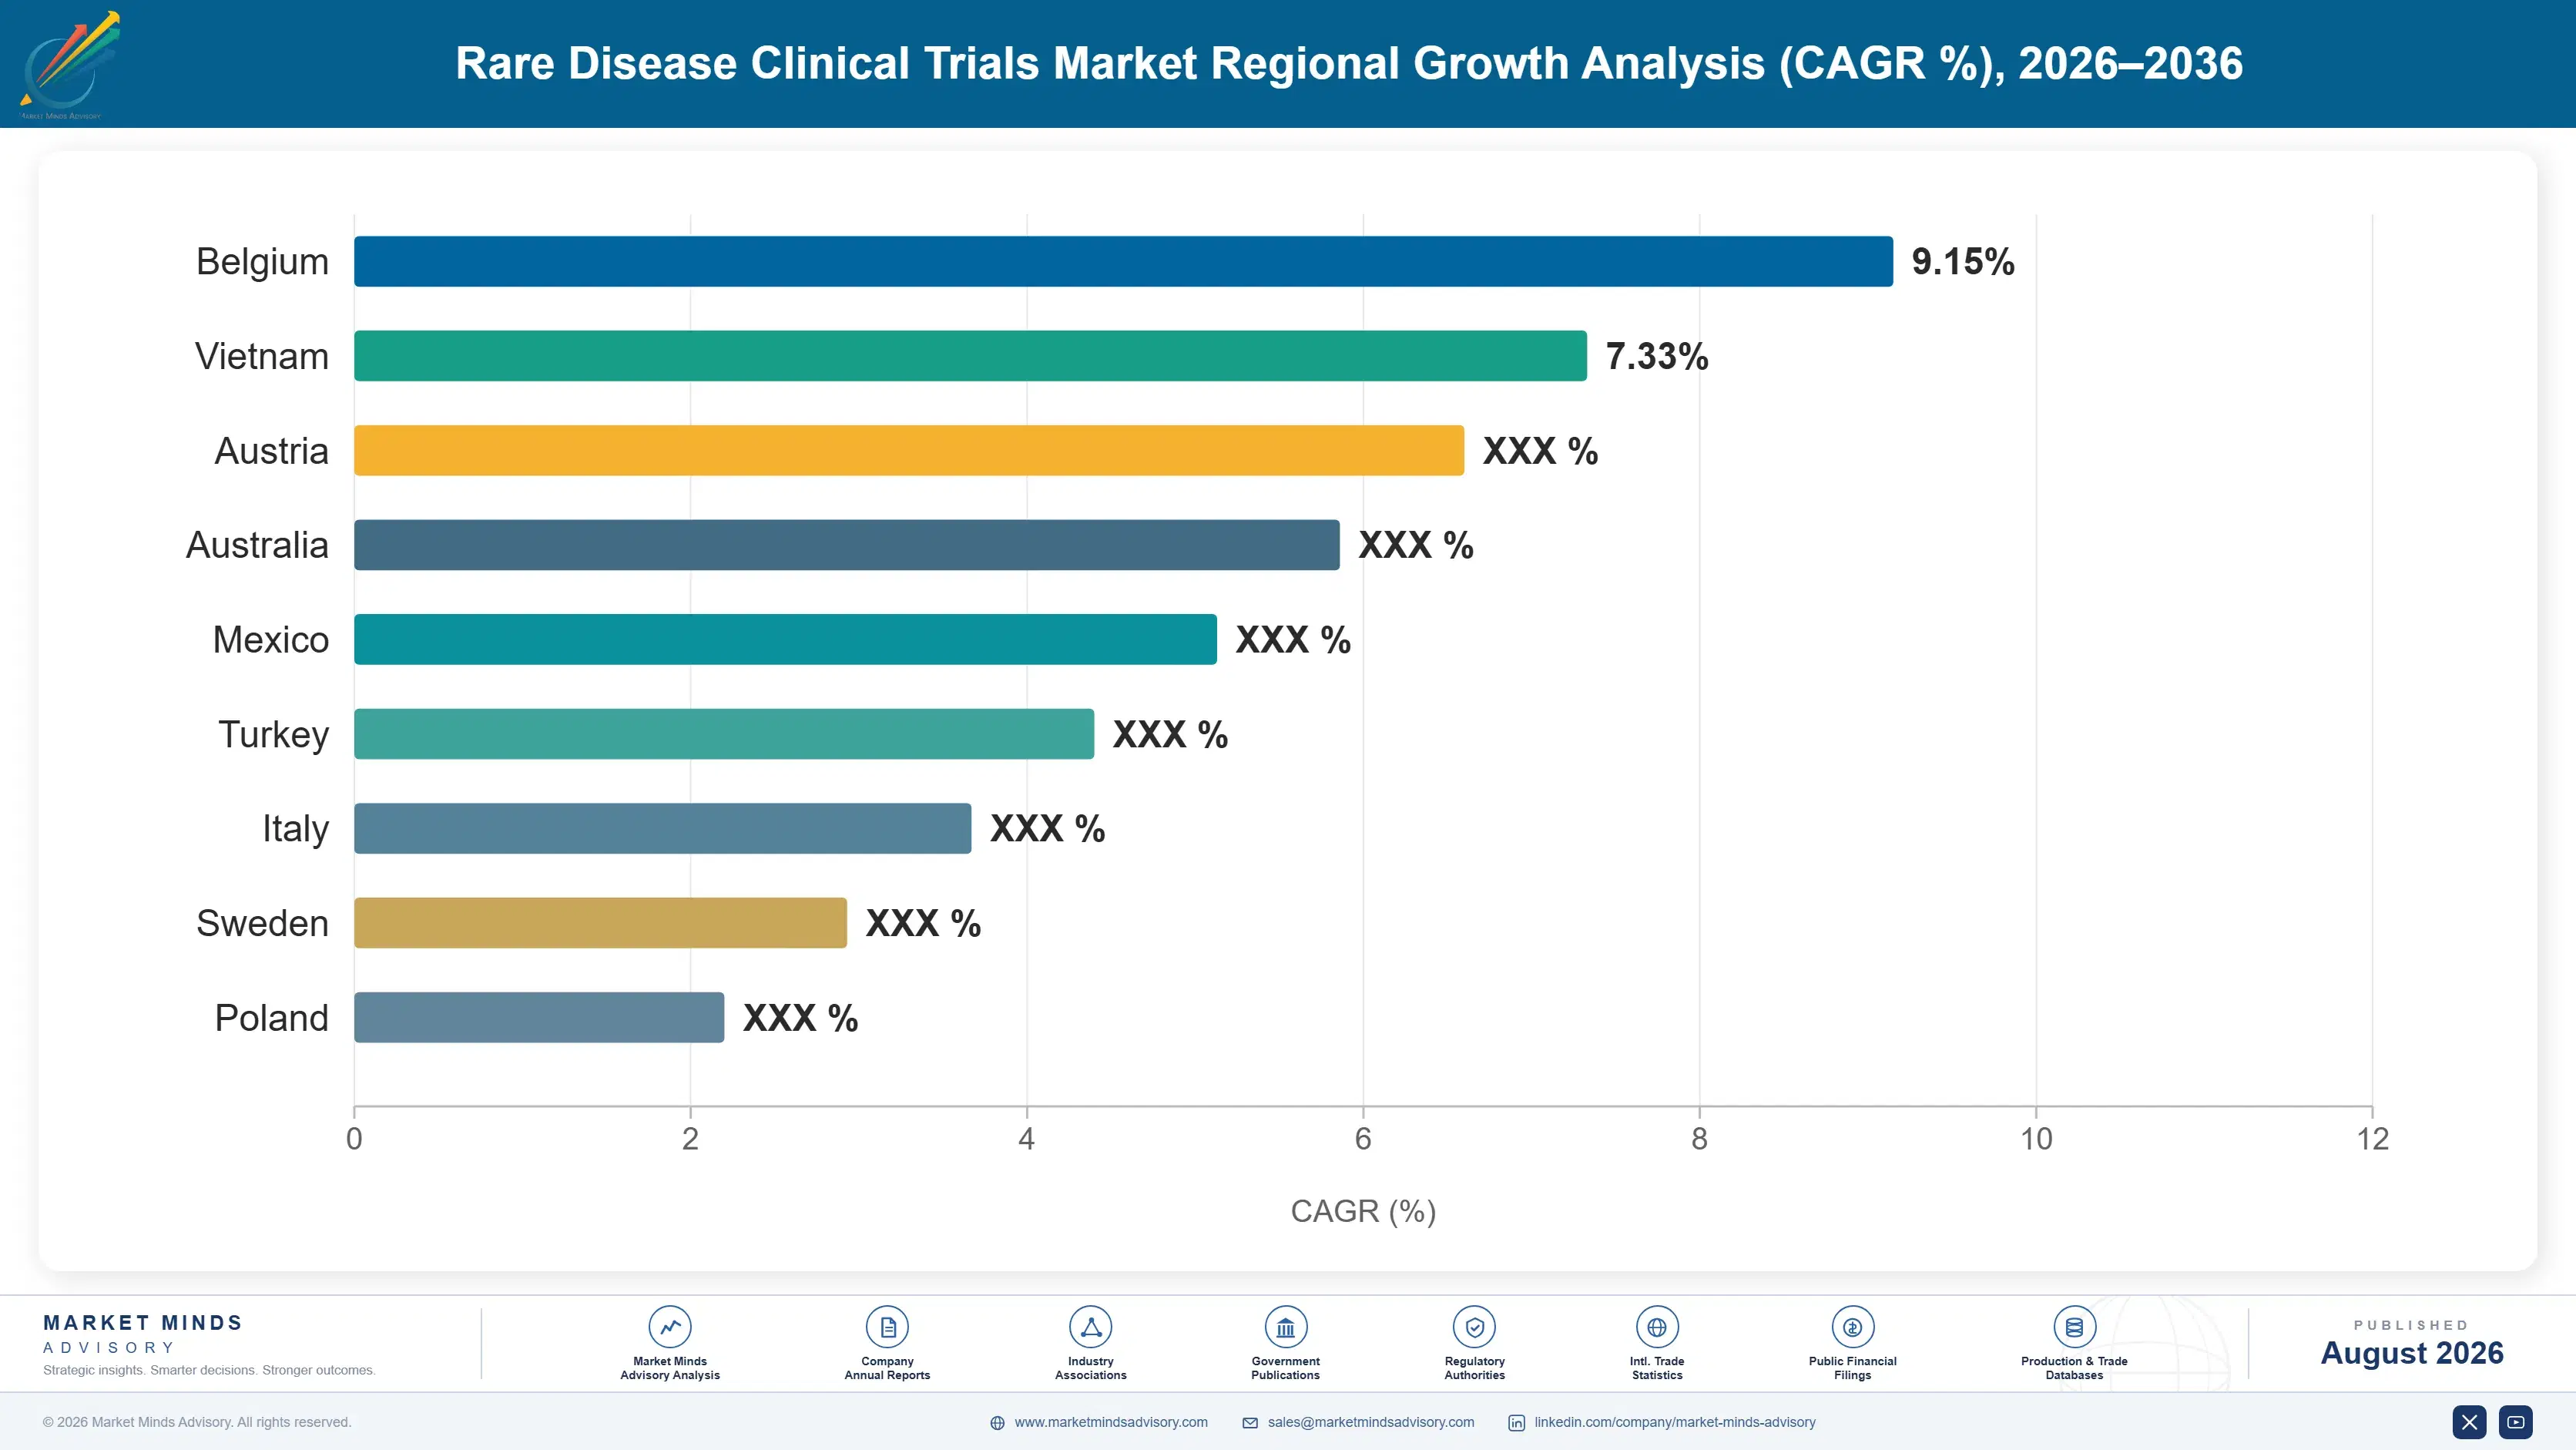
Regional Architecture and Country Demand Map

Demand follows sponsor location and specialist site density rather than patient distribution, since trials are contracted where developers sit and delivered wherever diagnosed patients can actually be reached. Contracting geography and delivery geography differ sharply here. Trials are contracted where developers sit and delivered where patients are.

North America

North America holds 30% of spend, the largest regional share, growing at 10.7%. Most rare disease developers are headquartered here and contract from here, which places the service revenue in the region regardless of where patients are eventually enrolled. Designated centres of excellence give the densest specialist site network anywhere, and orphan designation incentives have generated a programme volume that now exceeds available patients in several conditions. Competing trial activity at individual sites is more intense here than anywhere, which makes site-level feasibility mapping essential rather than optional. Site level feasibility mapping is essential here rather than merely advisable. Competing trial activity at individual sites is more intense here than anywhere else.
Share: 30% | CAGR: 10.7% (2026 to 2036)

Western Europe

Twenty-six percent of spend sits in Western Europe, growing at 9.2%. European reference network structures concentrate rare disease patients into identified centres in a way no other region matches, which makes feasibility assessment more reliable and patient identification genuinely easier. That is the region's real advantage in this market. Regulatory willingness to accept external control evidence has developed steadily. Cross-border participation is administratively demanding, since a nine country programme inside Europe still involves nine separate approvals and nine sets of local requirements. Reference network concentration is the region's genuine operational advantage in this market, and it makes feasibility assessment considerably more reliable than elsewhere. A nine country programme inside Europe still requires nine separate approvals.
Share: 26% | CAGR: 9.2% (2026 to 2036)
Regional intelligence for 5 additional markets available in the complete report: East Asia, South Asia and Pacific, Latin America, Middle East and Africa, Eastern Europe. Contact sales@marketmindsadvisory.com.
rare-disease-clinical-trials-market-country-cagr-analysis-1787309271311

Knowing Where the Patients Are

Every rare disease programme fails in one of two ways: nobody can find the patients, or the ones found cannot sustain the protocol. Four positions matter, and all of them are operational rather than scientific capabilities a provider can acquire. All four are accumulated capabilities rather than purchasable ones. None can be bought when a programme already needs them.

Map Competing Trial Activity Before Committing to Sites

Feasibility assessments routinely use epidemiological prevalence rather than diagnosed and unenrolled prevalence, which is why 61% of programmes exceed their enrolment timeline by a year or more. Providers who map competing trial activity site by site, and know which centres have already committed their patients elsewhere, prevent the most expensive failure in rare disease development. That intelligence is accumulated rather than purchased, and it is the clearest reason to choose a specialist over a large generalist provider. It is the clearest reason to choose a specialist over a large generalist.
Market Impact: Preventing overruns across 61% of a

Design Protocols Around What Families Can Actually Sustain

A protocol demanding 26 visits over two years asks a family managing a serious condition to travel repeatedly and often internationally, and dropout follows from that burden rather than from any reluctance to participate. Providers who challenge visit schedules at protocol design, and substitute home nursing and local collection where the endpoint permits, keep participants enrolled. Decentralised delivery compounds at 16.5% precisely because sponsors have learned this the expensive way. Sponsors have learned this the expensive way across several programmes. Substituting home nursing and local collection where the endpoint permits is the practical mechanism.
Market Impact: Reducing burden from all 26 of thos

Build Natural History Evidence Before the Interventional Trial

Randomising around 42 patients against placebo in a progressive fatal condition raises objections that block programmes after they have been scoped and budgeted. A natural history dataset provides the external comparator instead, and regulators accept it increasingly where disease course is well characterised. The difficulty is timing, since this evidence must be assembled years earlier, and providers who persuade sponsors to commit early secure both the natural history study and the trial that follows it. Committing capital before a molecule has shown anything is the real obstacle. Providers who persuade sponsors to commit early secure both studies.
Market Impact: Comparators fully replacing the 42

Target Consanguinity-Elevated Populations That Sponsors Overlook

Consanguinity across the Gulf, Turkey, North Africa and parts of South Asia raises prevalence of specific recessive disorders substantially above global rates, which makes certain programmes viable in those countries when they are marginal elsewhere. Around 34% of identified candidates still fail screening, so a larger identifiable pool matters disproportionately. Providers with genuine site relationships in those geographies solve feasibility problems that Western-focused competitors present to the sponsor as insoluble. Gulf, Turkish and North African sites solve feasibility problems Western-focused competitors call insoluble. A larger identifiable pool matters disproportionately when screening removes a third.
Market Impact: Screen failure still removing 34% o

Who Controls the Margin Pool

Five providers hold 42% measured on rare disease clinical development service revenue, the basis applied throughout this section. Concentration is low for clinical development because therapeutic and operational depth in specific rare conditions outweighs global footprint, and a small specialist who knows where the patients are beats a large generalist with offices everywhere. IQVIA and Parexel lead on scale and data assets respectively.
Competition operates on three dimensions. Patient identification capability, including registry access and knowledge of where diagnostic capability has recently improved, decides whether a programme is feasible at all. Competing trial intelligence decides whether the feasibility assessment is honest. And decentralised delivery capability decides whether enrolled participants stay enrolled across a long protocol. Global footprint decides remarkably little of it. Registry assets and site-level intelligence decide almost all of it.

Two pressures are moving position. Programme volume now exceeds available patients in the most attractive conditions, which rewards providers holding genuine patient identification advantage. Meanwhile regulatory acceptance of external controls is widening. Rankings will shift toward providers combining registry assets with real decentralised delivery infrastructure rather than either alone. Programme volume now exceeds available patients in the most attractive conditions.
rare-disease-clinical-trials-market-company-positioning-matrix-1787309271831

Competitive Moat and Risk Dimensions

IQVIA

Moat: Patient data asset breadth

IQVIA holds healthcare data assets across many countries that can identify where diagnosed rare disease patients actually sit, which addresses the binding constraint in this market directly rather than through investigator relationships alone. That data position took decades and considerable acquisition spend to assemble and cannot be replicated by a specialist provider however deep its therapeutic knowledge.
IQVIA

Risk: Ultra-rare therapeutic depth

In ultra-rare conditions with perhaps a few hundred diagnosed patients worldwide, data breadth matters less than knowing the twelve investigators who manage them and what each has already committed. Specialist providers hold those relationships and that competing trial intelligence, and no data asset substitutes for a conversation with a clinician who knows their patients individually.
PAREXEL

Moat: Regulatory and orphan pathway depth

Parexel built substantial regulatory consulting depth in orphan designation, external control acceptance and accelerated pathway strategy, which shapes trial design before any site is selected. In a field where whether a randomised design is even ethically feasible determines the whole programme, that upstream influence is worth more than downstream operational efficiency.
PAREXEL

Risk: Decentralised delivery infrastructure

Home nursing networks, mobile phlebotomy and remote assessment logistics are operational assets requiring capital and geographic coverage rather than consulting expertise. Decentralised delivery compounds at 16.5% and providers without that infrastructure subcontract it, which erodes both margin and control over the participant experience that determines retention.

Players Tracked

Prominent Players

IQVIA
Parexel
Premier Research
Medpace
Rare Disease Research Partners

Other Key Players

ICON
Fortrea
Thermo Fisher Scientific
Syneos Health
Novotech
Veristat
Worldwide Clinical Trials
Cmed Clinical Services
Emmes
Science 37
Clinerion
TrialSpark
Cerebral Therapeutics Research
Alira Health
Lindus Health

Recent Developments

JANUARY 2025

Regulators broaden acceptance of external control arms in ultra-rare disease

Regulatory guidance clarified conditions under which natural history and registry data may serve as external comparators in ultra-rare disease registration, where randomisation raises ethical objections. These were regulatory guidance decisions rather than commercial developments among clinical development providers. Programmes previously blocked on ethical grounds became viable.
Signal: Accepting external controls makes feasible
JUNE 2025

Competing trials exhaust diagnosed patient pools in attractive conditions

Multiple sponsors running simultaneous programmes in the same rare conditions found enrolment stalling as sites had already committed patients to earlier studies, extending timelines substantially. This reflects programme volume conditions rather than any transaction among the providers involved. Site feasibility questionnaires had not asked about competing commitments as.
Signal: Feasibility built on epidemiological preva
OCTOBER 2025

Remote endpoint validation studies address decentralised acceptance gap

Investigator-led work validating remotely captured functional and imaging endpoints against site-based assessment expanded across several rare disease areas, addressing the regulatory acceptance constraint on decentralised delivery. This reflects methodological research rather than corporate developments among service providers. Agency positions on remote capture still differ considerably.
Signal: Validating remote endpoints removes the ve

Investigator Sites, Home Nursing and Data

Investigator site payments and per-patient grants account for roughly 38% of delivered cost, and they run substantially above conventional trial rates because a site enrolling three patients still carries the full start-up and training burden. Project management and monitoring staff add about 27%. Home nursing, mobile phlebotomy and logistics for decentralised delivery are a growing element that scales with participants rather than with sites.
Investigator grant rates and specialist clinical staffing costs rose sharply through 2021 and 2024 as programme volume competing for the same rare disease sites drove up per-patient payments. Company annual reports across the clinical development providers disclose the resulting pass-through and margin effects. World Health Organization reporting on rare disease research capacity documents the concentration of qualified investigators in a small number of centres. Per-patient grants rose faster than any trial budget.

Exposure divides by pass-through structure rather than by scale. Providers passing investigator grants through at cost carry no site payment exposure and thin margin on the largest cost line. Those bundling delivery into a fixed price carry the escalation directly. Decentralised delivery shifts cost from site payments to home nursing logistics, which is a labour cost behaving quite differently through a cycle.
rare-disease-clinical-trials-market-cost-volatility-analysis-1787309272026

Contract investigator grants with escalation clauses upfront

Per-patient grant rates in competitive rare conditions have escalated faster than any trial budget anticipated, and a fixed-price delivery contract absorbs all of that. Agreeing escalation terms with the sponsor at contracting, referenced to observable site payment benchmarks, moves the exposure to the party that can adjust the programme budget rather than the provider.

Build home nursing capacity rather than subcontracting it

Decentralised delivery compounds at 16.5% and providers without their own home nursing and mobile collection infrastructure subcontract it, losing margin and control over the participant experience that determines retention. Building that capacity in the countries where programmes concentrate is capital-intensive and it converts a subcontracted cost into a differentiated service. Retention depends on that participant experience directly.

Reuse natural history data assets across sponsor programmes

A natural history study assembled for one sponsor characterises the disease course for every subsequent programme in that condition, and providers frequently treat each as bespoke work. Structuring the dataset for reuse, with appropriate consent and commercial arrangements, converts a single-sponsor cost into an asset that shortens every later feasibility assessment. Every later feasibility assessment gets shorter.

Portfolio Architecture for Margin Defence

The portfolio separates on which failure mode each service prevents. Patient identification and registry services address the programme that cannot start. Decentralised delivery addresses the programme that loses participants. Natural history and external control work addresses the programme that cannot ethically randomise. Site management, endpoint assessment and regulatory support are the conventional services underneath all of it. Each prevents a different and specific programme failure.
The tension is between conventional volume and specialist value. Site management and monitoring generate the largest revenue and are contested by every large clinical development provider on price. Patient identification, external control design and decentralised delivery carry the value and require capabilities that take years to build. A provider weighted toward conventional delivery is competing on cost in a market that rewards knowledge. Knowledge rather than cost is what this market pays for.

High-value pools concentrate where the sponsor cannot solve the problem itself. Registry access and competing trial intelligence, external control study design, and owned decentralised delivery infrastructure all qualify, and none of them is won on price per patient monitored. What they share is that a sponsor cannot assemble them internally in the time a programme allows.

Volume / Commodity-Adjacent Tier

Conventional site management, monitoring and data management services delivered against rare disease protocols. Largest revenue line, contested on price by every large clinical development provider, and differentiated mainly by therapeutic familiarity rather than capability.
Gross Margin: 22-34%

Premium / Certified Tier

Specialised endpoint and biomarker assessment plus regulatory and market access evidence support shaping design upstream. Orphan pathway expertise and endpoint validation capability qualify the provider before any operational discussion begins at all.
Gross Margin: 34-48%

Sustainability / Regulatory / Next-Generation Tier

Patient identification and registry services, natural history and external control studies, and owned decentralised delivery infrastructure. The wide margin range separates accumulated registry and intelligence assets from capital-intensive delivery networks still being built.
Gross Margin: 38-64%
rare-disease-clinical-trials-market-portfolio-architecture-1787309272524

High-value Sub-segments and Strategic Watch-out

Decentralised and Home-Based Delivery

Compounding at 16.5% because participant burden across 26 protocol visits rather than willingness is what loses these trials. Regulatory acceptance of remotely captured endpoints is now the binding constraint rather than any operational difficulty. Hybrid designs with anchor visits are the practical compromise regulators accept.
Gross Margin: 40-58%

Natural History and External Control Studies

Growing at 14.9% because randomising 42 patients against placebo in a fatal progressive condition blocks otherwise viable programmes. The evidence must be assembled years before the interventional trial, which is the commercial difficulty. Regulators accept it where disease course is objectively well characterised. Objective outcome measures make acceptance considerably easier.
Gross Margin: 44-64%

Conventional Site Management and Monitoring

The volume core at 8.1%, contested on price by every large provider and differentiated only by therapeutic familiarity. A site enrolling three patients still carries full start-up cost, which distorts the economics substantially. Therapeutic familiarity is the only differentiator here, and start-up cost distorts the economics on tiny enrolments.
Gross Margin: 22-34%

Patient Identification and Registry Services

The strategic watch-out and the most valuable capability. Registry access and competing trial intelligence prevent the expensive failure, and both are accumulated over years rather than purchased when a programme needs them. Purchasing it when a programme needs it is simply not possible at all.
Gross Margin: 42-62%

Programmes Not Contracts

Revenue arrives as programmes rather than as recurring service. A rare disease trial runs three to seven years, and a provider that performs well is retained across the sponsor's subsequent programmes in adjacent conditions because the accumulated patient knowledge transfers directly. That produces a sponsor relationship considerably stickier than conventional clinical development, where providers are re-tendered study by study on price. Accumulated patient knowledge transfers between programmes
Depth varies by disease rarity and by sponsor size. Ultra-rare programmes with a few hundred diagnosed patients worldwide generate the deepest engagements, since the sponsor cannot possibly solve identification alone. Larger rare disease programmes behave more conventionally. Small biotechnology sponsors buy the full service including regulatory strategy. Large pharmaceutical sponsors buy delivery and keep strategy internal, which is lower value work.

The deciding party is unusually senior and unusually anxious. Development leadership selects rare disease providers because an enrolment failure delays a programme by years and threatens the funding round behind it. Procurement participates within a shortlist somebody else set on capability. A provider that overran a previous programme rarely reaches that shortlist twice. An overrun rarely gets a second.
rare-disease-clinical-trials-market-end-use-penetration-index-1787309273014

Where Providers Build Position

These are among the four positions where our research anticipates prominent divergence between winners and laggards over the coming forecast period. Each is grounded in the demand model, the regulatory perimeter, and the announced capacity pipeline.
01 / UNENROLLED PREVALENCE INTELLIGENCE

Epidemiological prevalence is not an available patient pool

Feasibility assessments routinely use published prevalence rather than diagnosed and unenrolled prevalence, which is why around 61% of programmes exceed their enrolment timeline by a year or more. Providers who map competing trial activity site by site, and know which centres have already committed patients elsewhere, prevent the single most expensive failure in rare disease development. That intelligence accumulates over years and cannot be purchased when a sponsor needs it, and it is the clearest argument for choosing a specialist provider.
02 / PARTICIPANT BURDEN DESIGN

Twenty-six visits loses families, not reluctance to enrol

Families with a rare diagnosis are usually eager to participate, and a protocol demanding 26 visits over two years asks them to travel repeatedly and frequently internationally while managing a serious condition. Dropout follows from that burden rather than from any unwillingness. Providers who challenge visit schedules during protocol design and substitute home nursing where the endpoint permits keep participants enrolled, which is why decentralised delivery compounds at 16.5%, and sponsors have learned this the expensive way more than once.
03 / EXTERNAL CONTROL ANTICIPATION

The ethics objection arrives after the programme is budgeted

Randomising around 42 patients against placebo in a progressive fatal condition raises objections that block programmes already scoped and funded, and sponsors regularly discover this late. Natural history datasets provide exactly the external comparator that regulators increasingly accept wherever the disease course is objectively well characterised. The evidence must be assembled years earlier, so providers who persuade sponsors to commit early secure both that study and the interventional trial after it, and committing capital that early is the genuine obstacle throughout.
04 / CONSANGUINITY POPULATION ACCESS

Recessive prevalence is far higher where sponsors do not look

Consanguinity across the Gulf, Turkey, North Africa and parts of South Asia raises prevalence of specific recessive disorders substantially above global rates, making programmes viable there that are marginal elsewhere. With around 34% of all identified candidates still failing formal screening, a larger identifiable pool matters disproportionately to programme feasibility. Providers holding genuine site relationships across those geographies solve feasibility problems that Western-focused competitors routinely present to the sponsor as insoluble, and most sponsors never look at those geographies at all.

Engagement Snapshot From the Field

A live engagement with an industry participant carrying material or product regulatory and market exposure ahead of a defining policy shift, showing how our research translates into a defensible multi-year portfolio strategy.
MARKET MINDS ADVISORY · CLIENT ENGAGEMENT SUMMARY
Rare Disease Clinical Trials Producer Strategic Portfolio Review and Transition Roadmap 2026·Investment Scenario on Rare Disease Clinical Trials Exposure Evaluation 2025-26
CLIENT PROFILE
A clinical stage company developing an enzyme replacement therapy for an ultra-rare metabolic disorder, with a randomised programme targeting 44 patients across seven countries and roughly USD 180 million raised (client-reported, unverified by MMA). Enrolment stood at nine patients twenty-two months into a study planned to complete recruitment in fourteen. Diagnosed prevalence had never actually been measured anywhere.
STRATEGIC CHALLENGE
The programme was fourteen months behind its enrolment plan and the funding runway assumed completion within eight more. Leadership attributed the shortfall to site activation delays and had added three further sites without effect. Nobody had established how many diagnosed and unenrolled patients actually existed in the participating countries. Site activation had never been the binding constraint.
MMA APPROACH
MMA reconstructed diagnosed prevalence country by country from registry data, laboratory volumes and specialist centre records, then mapped competing trial activity at every participating and candidate site. Protocol visit burden was assessed against the travel each enrolled family had actually undertaken. Consanguinity-elevated prevalence was estimated for countries not yet included.
KEY FINDINGS
  1. Diagnosed and unenrolled prevalence across the seven participating countries totalled 31 patients, against a randomisation target of 44, which made the programme arithmetically infeasible as designed.
  2. Two competing programmes had already enrolled patients at four of the eleven active sites, and site feasibility questionnaires had not asked about competing trial commitments at all.
  3. Consanguinity-elevated prevalence in three Gulf countries and Turkey indicated roughly 26 additional diagnosed patients, and none of those countries had been considered during feasibility.
  4. The protocol required 28 visits over 24 months, and three of the nine enrolled families were travelling internationally for each, with two already reporting they could not continue.
CLIENT PROFILE
A clinical stage company developing an enzyme replacement therapy for an ultra-rare metabolic disorder, with a randomised programme targeting 44 patients across seven countries and roughly USD 180 million raised (client-reported, unverified by MMA). Enrolment stood at nine patients twenty-two months into a study planned to complete recruitment in fourteen. Diagnosed prevalence had never actually been measured anywhere.
STRATEGIC CHALLENGE
The programme was fourteen months behind its enrolment plan and the funding runway assumed completion within eight more. Leadership attributed the shortfall to site activation delays and had added three further sites without effect. Nobody had established how many diagnosed and unenrolled patients actually existed in the participating countries. Site activation had never been the binding constraint.
MMA APPROACH
MMA reconstructed diagnosed prevalence country by country from registry data, laboratory volumes and specialist centre records, then mapped competing trial activity at every participating and candidate site. Protocol visit burden was assessed against the travel each enrolled family had actually undertaken. Consanguinity-elevated prevalence was estimated for countries not yet included.
KEY FINDINGS
  1. Diagnosed and unenrolled prevalence across the seven participating countries totalled 31 patients, against a randomisation target of 44, which made the programme arithmetically infeasible as designed.
  2. Two competing programmes had already enrolled patients at four of the eleven active sites, and site feasibility questionnaires had not asked about competing trial commitments at all.
  3. Consanguinity-elevated prevalence in three Gulf countries and Turkey indicated roughly 26 additional diagnosed patients, and none of those countries had been considered during feasibility.
  4. The protocol required 28 visits over 24 months, and three of the nine enrolled families were travelling internationally for each, with two already reporting they could not continue.
RECOMMENDED STRATEGY
Phase 1: Phase 1 (months 1 to 4): Open sites in the three Gulf countries and Turkey where consanguinity-elevated diagnosed prevalence had been identified. Phase 2: Phase 2 (months 4 to 10): Amend the protocol to home nursing and local collection for eighteen of the twenty-eight visits, retaining anchor site assessments. Phase 3: Phase 3 (months 10 to 20): Rebuild the enrolment forecast on diagnosed and unenrolled prevalence and revise the funding plan against it.
OUTCOME
Enrolment reached 34 patients within eleven months of opening the additional countries and amending the visit schedule (client-reported, unverified by MMA). Both families who had reported they could not continue remained in the study after the protocol amendment (client-reported, unverified by MMA). Feasibility assessment at the company now requires diagnosed and unenrolled prevalence rather than published epidemiological estimates.

Frequently Asked Questions

Foundational context covering the market sizes, CAGR, scope, country, region and competition that inform every finding below. This section is provided to cover basics and most often pre-purchase conversations, answered from the MMA Primary Research Dataset.

What is the current size of the Rare Disease Clinical Trials Market?

The global market was worth USD 9.6 billion in 2025, reaching USD 10.75 billion in 2026. North America holds the largest regional share at 30% of spend.

How large will the Rare Disease Clinical Trials Market be by 2036?

MMA forecasts USD 30.52 billion by 2036, an expansion multiple of 2.84 times the 2026 base. That represents roughly USD 19.77 billion of incremental value.

What is the CAGR for the Rare Disease Clinical Trials Market 2026 to 2036?

The base case compounds at 11.0% annually, with a bull case of 12.4% and a bear case of 9.6%. Historical growth from 2020 to 2025 ran at 9.7%.

Which segment is growing fastest?

Decentralised and home-based trial delivery compounds at 16.5%, exactly 1.50 times the market rate. Participant travel burden rather than willingness is what loses these trials.

Who are the major companies in the Rare Disease Clinical Trials Market?

IQVIA, Parexel, Premier Research, Medpace and Rare Disease Research Partners hold a combined 42% of the market. Therapeutic depth outweighs global footprint in this particular market.

Which country is growing fastest?

China compounds at 13.7%, ahead of every other national market. Regulatory acceptance of multiregional data and steadily improving diagnostic capability together transformed its role entirely.

Report Segmentation Architecture

The full report scope spans multiple orthogonal segmentation dimensions, with cross-tabulated demand data provided for each dimension pair. Coverage extends further to regional breakdowns, trend trajectories, and the competitive detail needed to support segment-level decision-making.

By Service Function

  • Patient Identification and Registry Services
  • Site Management and Monitoring
  • Decentralised and Home-Based Trial Delivery
  • Natural History and External Control Studies
  • Specialised Endpoint and Biomarker Assessment
  • Regulatory and Market Access Evidence Support

By End-Use Industry

  • Clinical Stage Biotechnology Sponsors
  • Large Pharmaceutical Rare Disease Units
  • Academic and Investigator-Led Programmes
  • Gene and Cell Therapy Developers
  • Patient Organisation Funded Research

By Commercial Dimension

  • Full Service Programme Contracts
  • Functional Service Provision
  • Registry and Data Access Licensing
  • Consulting and Feasibility Engagements

By Region

  • North America
  • Western Europe
  • East Asia
  • South Asia and Pacific
  • Latin America
  • Middle East and Africa
  • Eastern Europe

Scope, Methodology, and Coverage

Every figure in this report is reproducible from documented input assumptions. The scope below maps the historical period, the forecast horizon, the segmentation dimensions, and the countries covered, alongside the underlying primary and qualitative methodology.
Historical Period
2020 to 2025
Forecast Period
2026 to 2036
Base Year
2025 (USD billions; MMA Primary Research Dataset, August 2026)
Market Definition
The market covers clinical development services for rare and ultra-rare disease trials, spanning patient identification and registry services, site management and monitoring, decentralised and home-based trial delivery, natural history and external control studies, specialised endpoint and biomarker assessment, and regulatory and market access evidence support. Preclinical and discovery research services, clinical and commercial-scale manufacturing, post-approval commercial and medical affairs activity, patient advocacy funding unconnected to a specific trial, diagnostic testing sold outside a study protocol, and non-rare disease clinical development are excluded. Sizing is measured at service provider revenue in current prices.
Quantitative Units
USD billions (current prices); enrolled patients, programme counts and enrolment timelines where applicable
Segmentation Dimensions
By Service Function; By End-Use Industry; By Commercial Dimension; By Region
Regions Covered
North America, Western Europe, East Asia, South Asia and Pacific, Latin America, Middle East and Africa, Eastern Europe
Countries Covered
USA, Germany, UK, France, Italy, Spain, Netherlands, Sweden, Denmark, Canada, Japan, China, South Korea, Taiwan, India, Australia, Brazil, Argentina, Mexico, Colombia, Turkey, Israel, Saudi Arabia, UAE, Qatar, Egypt, South Africa, Poland, Czech Republic, Hungary, and additional markets relevant to this sector
Key Companies Profiled
IQVIA, Parexel, Premier Research, Medpace, Rare Disease Research Partners, ICON, Fortrea, Thermo Fisher Scientific, Syneos Health, Novotech, Veristat, Worldwide Clinical Trials, Cmed Clinical Services, Emmes, Science 37, Clinerion, TrialSpark, Cerebral Therapeutics Research, Alira Health, Lindus Health
Quantitative Methodology
Primary survey, n=3,800 respondents, Q4 2025, six countries; demand-side model with trade association cross-validation
Qualitative Methodology
47 expert interviews, Q4 2025; applied to validate demand model assumptions, identify emerging dynamics, and assess competitive positioning
Report Format
PDF and XLSX data workbook (Word format preview document)
Publisher
Market Minds Advisory
Report Code
MMA-2026-HLT-962
Published
August 2026
Contact
sales@marketmindsadvisory.com | www.marketmindsadvisory.com

Purchase the full Rare Disease Clinical Trials Market Report (2026 to 2036).

The full report sizes rare disease clinical development services across six service functions, three commercial dimensions and seven regions, with annual forecasts to 2036 under base, bull and bear scenarios. Diagnosed and unenrolled prevalence is estimated by condition and country against competing trial activity, which is the calculation that determines whether a programme is feasible at all. Protocol visit burden is measured against retention across decentralised and conventional designs. Regulatory acceptance of external controls and remote endpoints is tracked by agency. Twenty providers are profiled on a consistent rare disease service revenue basis.
Diagnosed and unenrolled prevalence estimated by condition and country
Competing trial activity mapped at site level across active programmes
Protocol visit burden measured against retention by design type
Regulatory acceptance of external controls tracked by agency
Consanguinity-elevated prevalence quantified for recessive disorders
Investigator grant rate escalation compared across competitive conditions

Built For The People Who Decide

From boardroom strategy to bench-side execution, this report is read cover-to-cover by leaders shaping the next decade of their industry, turning demand scenarios, market dynamics and valuation benchmarks into decisions.
CXOs/ Presidents/ VPs/ Managers
M&A and Corporate Development
Strategy Teams and R&D Heads
Procurement and Product Directors
Regulatory and Compliance Leaders
Investor Relations and Equity Analysts