

Market Minds Advisory
Flatware Market

Flatware Market: Flatware Market: Alloy Grade Disclosure, Weight As Quality and The Canteen Set That Went Away

Nickel volatility pushed the industry from one stainless grade to a cheaper one without telling anyone, and the alloy it moved to is the one that pits at the tines in a dishwasher.

Lead Analyst

Published

September 2026

Make Smarter Decisions with Customized Research Insights

Request a free sample report and evaluate market opportunities, growth trends, and competitive dynamics relevant to your business needs.

2025 MARKET VALUE$12.8BMarket Size 2025
2036 FORECAST VALUE$20.6BBase Case , 2026 to 2036
CAGR 2026 TO 20364.4 %Bull 5.6% / Bear 3.2%
INCREMENTAL OPPORTUNITY$7.2BNet 10- year value creation
EXPANSION MULTIPLE1.54x2036 value over 2026 base
Strategic Levers
M&A Pipeline
Regional Outlook
Country Rankings
Competitive Intelligence
Segmental Deep-dive
Call-Us : 91 93563 13602

Executive Snapshot and Market Trajectory.

Two stainless grades dominate this market and they behave entirely differently in a dishwasher. The nickel-bearing alloy resists pitting for years; the nickel-free one rusts at the tines and along the bowl edge within months. Around 19% of products on a shelf name which of the two they are.
Coated and decorative finishes grow at 6.6%, half again the market rate of 4.4%, as colour moves from a hospitality novelty into mainstream households. Alternative material flatware follows at 5.9% from a much smaller base. Silver-plated grows slowest of the six constructions at 2.4%, carrying a regular maintenance requirement that almost nobody is willing to accept any longer. Sterling sits just above it at 2.9%.
The boxed canteen has largely gone and taken a whole purchase occasion with it. Roughly 21% of retail value still moves as a cased set, against a clear majority a generation ago, because households now buy open stock in small quantities and mix patterns deliberately rather than receiving a complete service as a wedding gift. Ranges built around the cased format are serving an occasion that has for the most part stopped happening.
Market Definition
This market covers eating and serving flatware for domestic and hospitality use, spanning eighteen ten stainless, eighteen zero stainless, coated and decorative finish, silver-plated, sterling silver and alternative material construction. Sizing is at wholesale shipment value and includes coated decorative finishes, which MMA analyses separately at greater depth. Disposable cutlery, cooking and kitchen utensils, knife blocks and chef knives, and hollowware serving dishes are excluded.
Base Year Value
$12.8B in 2025 (MMA Primary Research Dataset, September 2026)
Forecast Period
2026 to 2036, eleven discrete annual values
CAGR
4.4% base case. Bull 5.6%. Bear 3.2%.
Fastest Growth Segment
Coated And Decorative Finish Flatware: 6.6% CAGR
Fastest Growth Country
India: 7.2% CAGR
Fastest Growth Region
South Asia and Pacific: 6.4% CAGR
Largest Region
East Asia: 33% of 2025 global value
Market Leaders
Lifetime Brands, Zwilling JA Henckels, Groupe SEB, Sambonet Paderno, Villeroy and Boch. Source: MMA Primary Research Dataset, July 2026.
Primary Survey
n=3,800 procurement and R&D decision-makers, Q4 2025, six countries
Methodology
Demand-side build-up, cross-validated against public data, 47 expert interviews

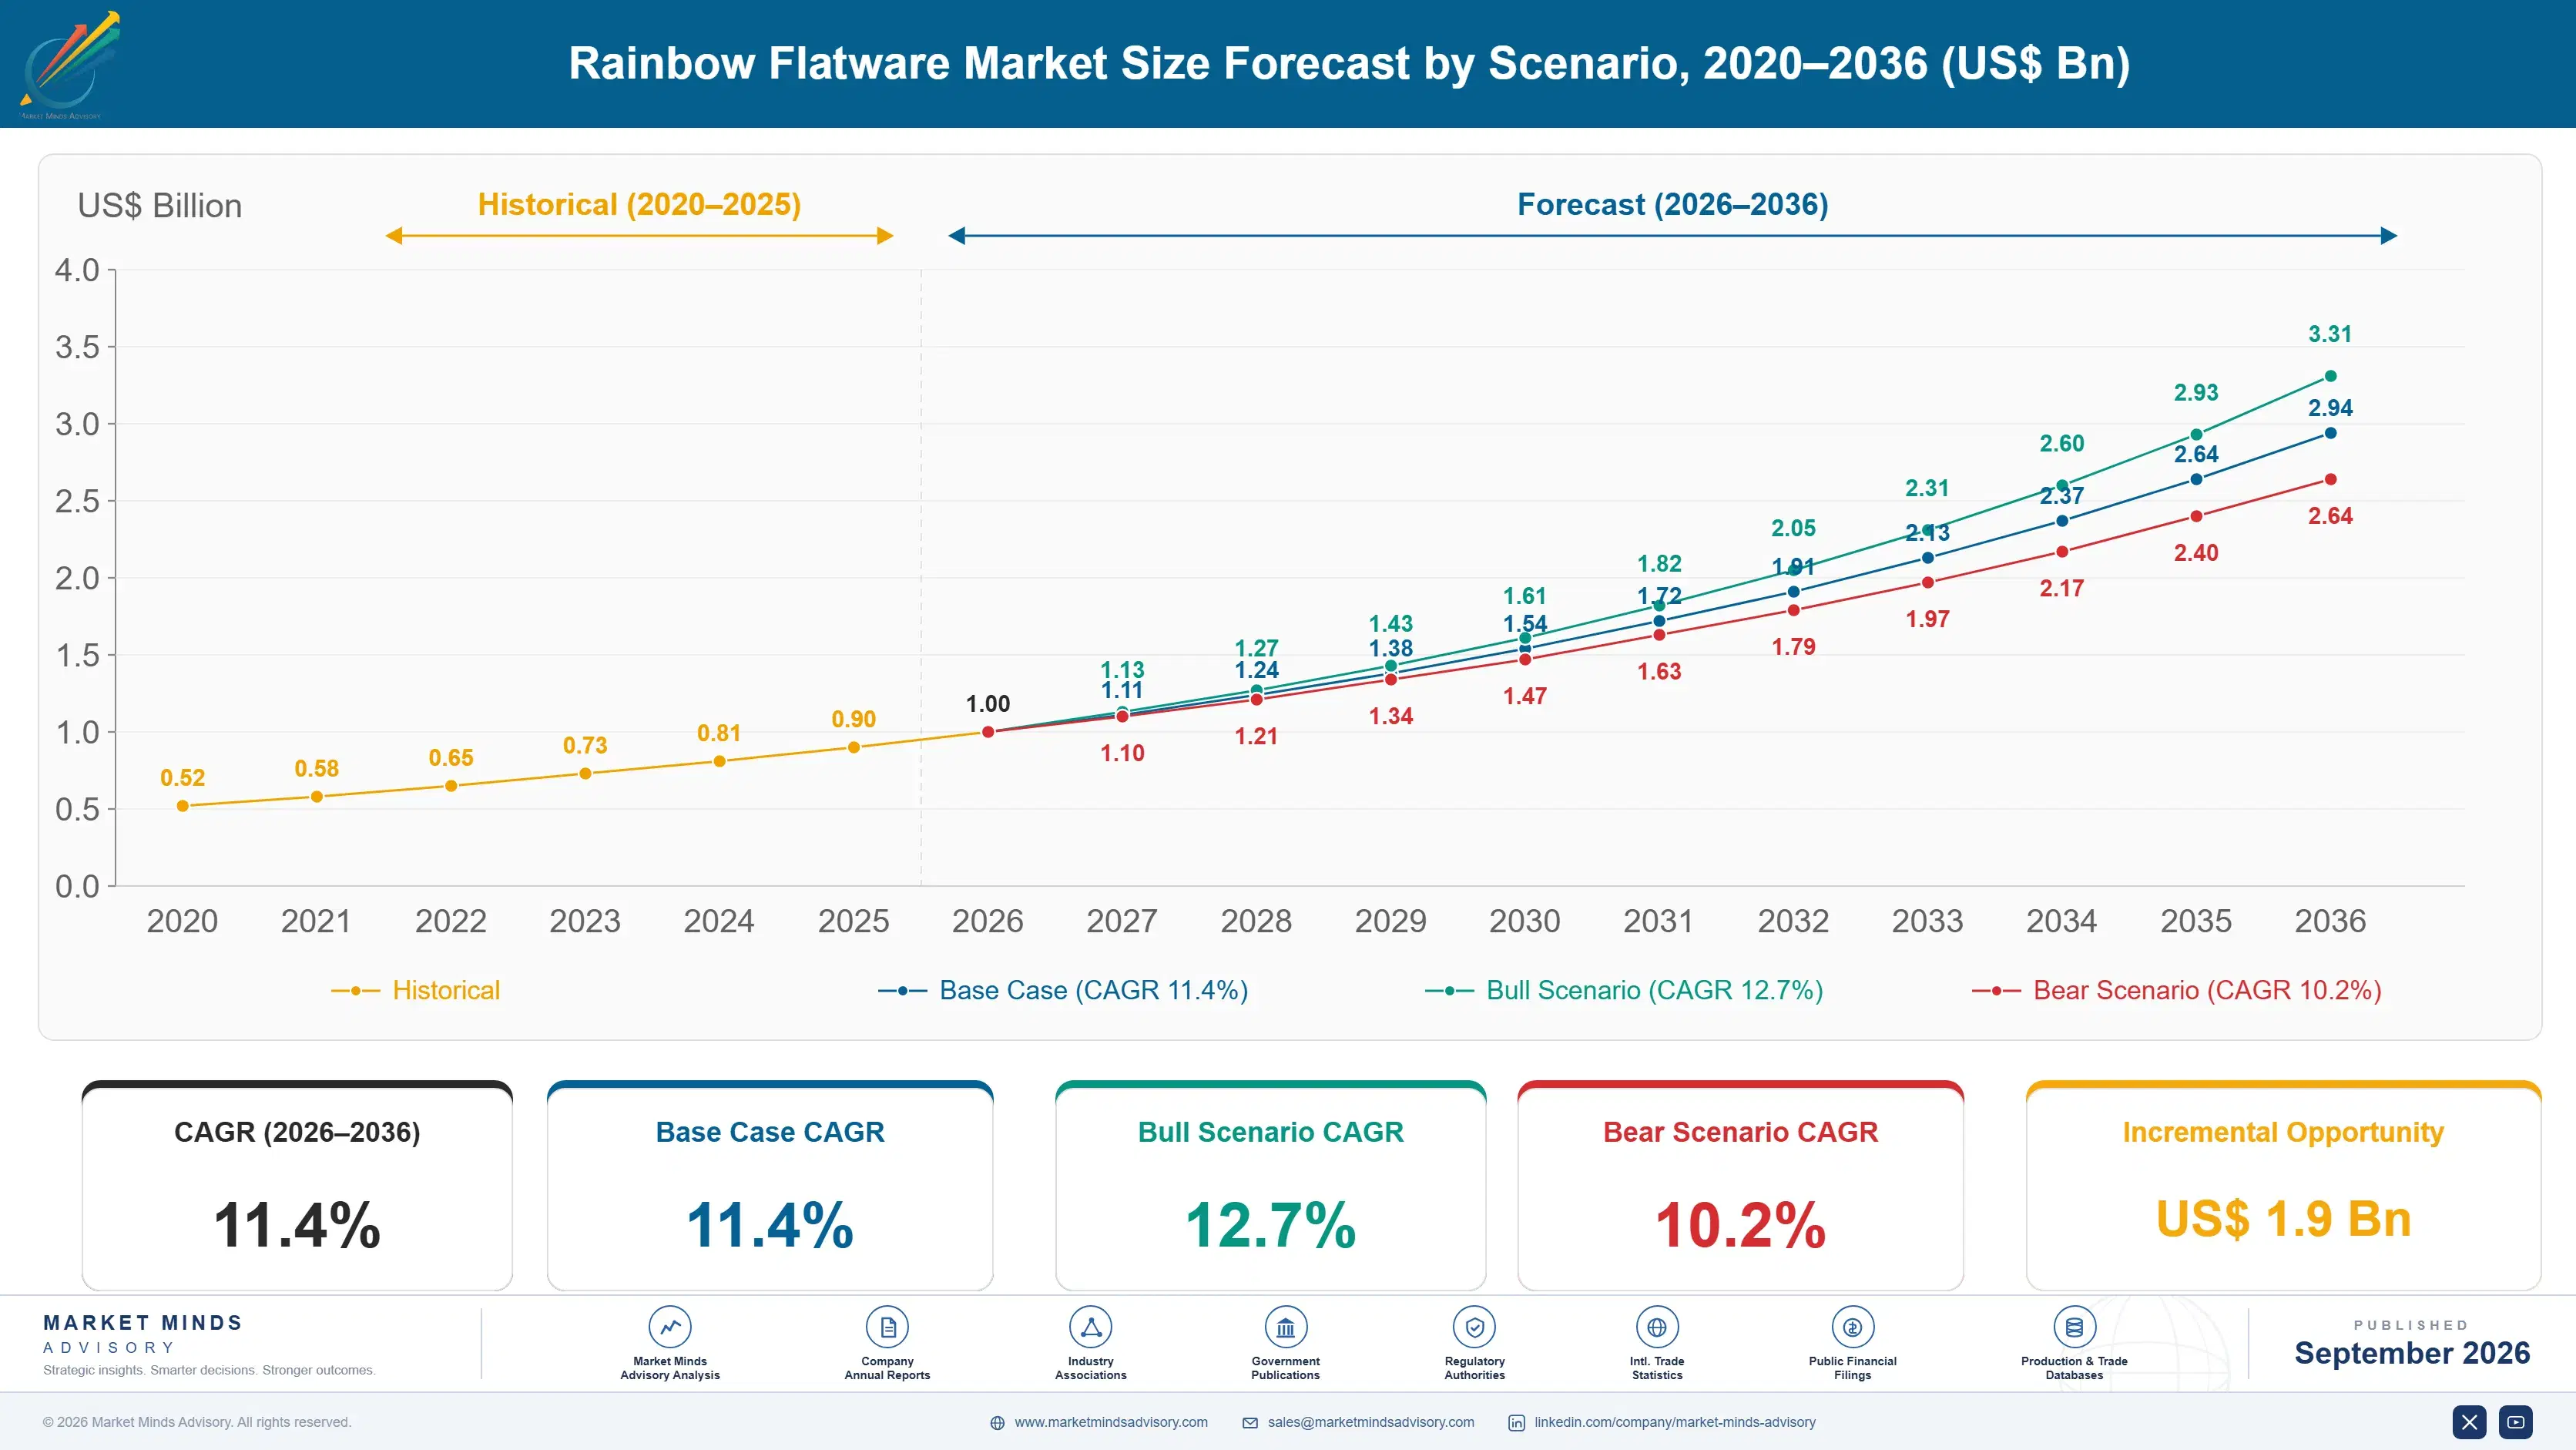
Rainbow Flatware Market Forecast Scenarios

rainbow-flatware-market-size-forecast-scenario-1790023400295
Growth of 10.1% between 2020 and 2025 came from photography rather than from dining. Home entertaining moved coloured flatware from a specialist hospitality product into mainstream households, driven by platforms where a place setting is content. Event hire demand collapsed through 2020 and 2021 and returned strongly from 2023, which is when durability became commercially visible.
Three mechanisms carry the base case. Matte finishes grow at 17.1% because they conceal the wear that polished coatings display, which extends perceived life without any change in the coating itself. Event rental operators now take roughly 23% of category value and replace on a cycle driven by damage rather than by fashion. Indian and Southeast Asian demand expands from low bases as wedding and hospitality volumes grow, with India at 14.8%.
The bull case is durability disclosure. If any participant publishes a tested dishwasher cycle count alongside the substrate alloy, the products that genuinely last separate immediately from those that do not, and the category stops competing purely on photographs. The bear case is a wave of visible failures. Coloured flatware that dulls within a season creates review damage that reaches the whole category rather than the brand responsible for it.

What Grade Actually Decides

Everything that matters about a fork is decided by an alloy specification the buyer almost never sees. Eighteen ten stainless contains nickel, forms a stable passive layer and survives years of dishwasher detergent; eighteen zero contains none, takes a coarser finish and pits at the tines and the bowl edge. Roughly 19% of products state which grade they are, and the two look identical in a shop.
TOP FIVE CONCENTRATION18%Combined shipment value share held by the five largest participants
ALLOY GRADE DISCLOSED19%Products naming the stainless alloy grade on pack
AVERAGE SET PRICEUSD 42Weighted wholesale price of a twenty piece stainless set
GRAM WEIGHT PUBLISHED6%Products stating the mass of a place setting anywhere
HOSPITALITY ANNUAL LOSS16%Flatware lost from a restaurant inventory each year
CANTEEN SET SHARE21%Retail value still sold as a boxed canteen set
Weight is the other unstated attribute and it is what people mean when they call flatware good. A heavier, properly balanced piece sits differently in the hand and hospitality buyers specify by mass per dozen for exactly that reason. Retail states it on around 6% of products, which leaves a shopper judging balance by picking up a fork through a plastic window.
The category lost a purchase occasion rather than losing demand. A boxed canteen in a wooden case was once a wedding gift that furnished a household for decades, and roughly 21% of retail value still moves that way. Households now buy open stock in small quantities and mix patterns on purpose. Mixing is now a deliberate choice.
"The industry quietly changed the steel it makes forks from and kept the photographs identical, then wondered why people think flatware is worse than it used to be. It is, and nobody was told."
Director, Tabletop and Housewares Practice · MMA Consumer and Industrial Goods Practice · September 2026

Market Trends

Open Stock Replaces The Complete Service Entirely

A cased canteen furnishing a household for decades was a gift-driven purchase tied to marriage conventions that have changed considerably, and roughly 21% of retail value still moves that way against a clear majority a generation ago. Households now buy four or six place settings at a time and add or mix deliberately, which lowers the ticket, raises purchase frequency and makes pattern availability over years far more important than it used to be. Participants still building ranges around a boxed set are serving an occasion that has largely stopped happening.
Market Impact: India grows 2.8 points faster

Hospitality Replenishes On Loss Rather Than On Wear

Restaurants lose roughly 16% of their flatware inventory each year to bins, to customers and to breakage of the handle joint, which makes replenishment rather than replacement the demand driver there. That changes what a hospitality buyer values: pattern availability over several years matters more than durability, because a fork that lasts a decade is irrelevant if it left in a napkin after six months. Suppliers who discontinue patterns quickly lose accounts regardless of product quality, and very few manage stock availability accordingly. Availability is a stock decision rather than a product one, which is why it stays unaddressed.
Market Impact: Grows 2.2 points above category

Market Opportunities and Growth Drivers

Indian Manufacturing And Household Formation Together

India is unusual in this category because domestic manufacturing capacity at Moradabad and Jagadhri sits alongside rapid urban household formation, which means growth is served locally rather than through imports. India grows at 7.2%, the fastest national market covered here. Buying patterns skew heavily toward open stock in small quantities rather than cased sets, reflecting both household budgets and a gifting culture that operates differently from the Western wedding canteen. Export capacity from the same base supplies a meaningful share of global volume. That combination of local supply and local demand growth is rare in this category anywhere else.
Market Impact: Only 19% name the grade

Colour Moves From Hospitality Into Domestic Tables

Coated decorative finishes began as a hospitality and event product and have moved into mainstream households over roughly five years, driven by social platforms where a place setting is photographed rather than used. Coated finishes grow at 6.6% against 4.4% for the category. The coating technology is well established and widely available, which means participation is a decision rather than a capability. What it requires is attention to substrate preparation, since coating adhesion depends more on the steel underneath than on deposition. Participants treating coating as a finishing step rather than a substrate question find that out slowly.
Market Impact: Only 6% publish gram weight

Market Restraints and Challenges

Alloy Grade Is Not Disclosed On Four Products In Five

Around 19% of flatware states its stainless grade, and the difference between the nickel-bearing and nickel-free alloys decides whether a set survives a dishwasher for years or pits within months. The root cause is competitive rather than technical: naming the cheaper grade invites comparison while naming nothing invites nothing, and buyers have never been taught to ask. Commercially this leaves genuinely durable product indistinguishable from short-lived product at the shelf. Participants using the better alloy now state it prominently, which works while most competitors stay silent. Whether it keeps working depends on how long that silence holds.
Market Impact: Canteen sets hold 21% share

Weight Is What Buyers Mean And Nobody Publishes It

Mass per place setting is what people are describing when they call flatware good or cheap, and hospitality buyers specify by it for that reason, yet around 6% of retail products state it anywhere. The root cause is that lighter product is cheaper to make and ship, so publishing the figure works against the volume tiers. Commercially it removes the one attribute a buyer could actually compare between two sets behind plastic. Some participants now print grams per piece, and it functions as a premium signal immediately. The rest of the category has no reason to follow them there.
Market Impact: Restaurants lose 16% annually
3 additional market trends, 4 additional growth drivers, and 2 additional restraints and challenges are covered in the full report. Contact sales@marketmindsadvisory.com to access the complete intelligence.

Segment CAGR and Growth Architecture

Segmentation follows construction material, the dimension on which corrosion behaviour, manufacturing route, maintenance requirement and price all divide together. Six constructions are assessed at wholesale shipment value. Disposable cutlery, cooking utensils, knife blocks and chef knives, and hollowware serving dishes sit outside the defined scope here. Coated decorative finishes are included in this sizing and analysed at greater depth separately.
rainbow-flatware-market-market-share-analysis-1790023400854

Coated And Decorative Finish Flatware

Coated finishes grow at 6.6%, half again the market rate of 4.4%, and the demand moved from hospitality into households over roughly five years rather than being created by any manufacturer. Social platforms where a place setting is photographed rather than eaten from did most of the work. The deposition technology is well established and available to anyone placing an order, so participation is a commercial decision rather than a technical capability. What separates a coating that lasts from one that dulls within a season is the preparation of the steel beneath it, and that preparation is the first step shortened when a contracted facility comes under cost pressure. MMA analyses this segment separately in greater depth.
CAGR 6.6%

Alternative Material Flatware

Alternative materials including titanium, resin and wood-handled construction grow at 5.9% from a small base, and the demand is genuinely varied rather than a single trend. Titanium serves outdoor and travel use where weight matters more than anything else. Wood and resin handles serve a design preference and carry a real constraint, since neither survives a dishwasher indefinitely and both fail at the joint where the handle meets the steel. That joint is the one place this construction reliably breaks, and hospitality buyers avoid it entirely for that reason while domestic buyers frequently discover it only after the first failure. Growth from that small base is therefore genuine but constrained by where the construction can credibly be sold.
CAGR 5.9%
Full segment breakdown across 6 segments available in the complete report.

Regional Architecture and Country Demand Map

Regional shares measure wholesale shipment value where flatware is sold rather than where it is forged. East Asia sits above its standard band and North America marginally below, on manufacturing concentration and household mix respectively. Both deviations carry a named reason in the body concerned.

East Asia

At 33% this sits above the standard band because the region both manufactures most of the world's flatware and consumes a very large share of it. The Jieyang cluster in Guangdong concentrates forging, stamping and polishing capacity at a scale found nowhere else, and nearly every brand sold globally has product made within a short radius of it. Chinese household demand has grown as Western-style dining formats spread beyond the major cities. Japanese and Korean demand is distinctive, with domestic eating utensils occupying a share that Western flatware never reaches. Growth runs at 5.3%. Manufacturing concentration and domestic consumption both sit here, which is why the share exceeds the standard band.
Share: 33% | CAGR: 5.3% (2026 to 2036)

Western Europe

The 22% position sits inside the standard band and this remains the market where flatware is most likely to be judged on weight and finish rather than on appearance alone. German, Italian and French manufacturers including Zwilling, Sambonet and Christofle hold positions built on forging quality and pattern heritage, and silver-plate retains a presence that has faded almost everywhere else. Growth of 3.0% is the slowest of the seven regions, reflecting fully penetrated households and the near disappearance of the cased canteen as a gifting convention across the region. Hospitality specification remains the steadier half of regional demand and is where weight and alloy are still argued about openly. That argument is unusual.
Share: 22% | CAGR: 3.0% (2026 to 2036)
Regional intelligence for 5 additional markets available in the complete report: North America, South Asia and Pacific, Latin America, Middle East and Africa, Eastern Europe. Contact sales@marketmindsadvisory.com.
rainbow-flatware-market-country-cagr-analysis-1790023401399

Four Moves Worth Making Now

These four address a category where the two attributes that decide satisfaction, alloy grade and weight, are both invisible at the shelf. Each has been executed by at least one participant with measurable results, and three of the four cost a print change rather than any alteration to how the product is made. The fourth changes packaging.

Name The Stainless Grade On Every Pack

Around 19% of products state their alloy, and the difference between the nickel-bearing and nickel-free grades decides whether a set survives years of dishwasher use or pits within months. Stating it costs an artwork revision and converts an invisible quality difference into a visible one at the shelf. Participants using the better grade and saying so report price realisation around 1.5 times comparable undisclosed products, and competitors using the cheaper alloy cannot follow without inviting exactly the comparison they have avoided. The window for that advantage stays open only while most of the category keeps quiet.
Market Impact: Lifts price realisation to roughly 1.5 times higher

Print Grams Per Piece Alongside The Pattern

Mass per place setting is what buyers mean when they call flatware good, hospitality specifies by it, and around 6% of retail products state it anywhere. Printing grams per piece gives a shopper the one attribute they could genuinely compare between two sets behind plastic windows. Participants doing it report price realisation around 1.3 times comparable products with no stated weight, because the figure functions immediately as a premium signal in a category that offers no other. Hospitality buyers have specified this way for decades, so the figure is already measured on every production line.
Market Impact: Lifts price realisation to roughly 1.3 times higher

Guarantee Pattern Availability For Hospitality Accounts

Restaurants lose roughly 16% of flatware inventory each year and replenish rather than replace, which makes pattern availability over several years worth more to them than durability. Suppliers who discontinue quickly lose accounts regardless of how good the product was. Committing to a stated availability period and holding stock against it converts an operational promise into a specification advantage. Participants offering multi-year availability report hospitality account retention around 2.3 times competitors who discontinue on a normal range cycle. The cost is inventory carry across a longer tail rather than any change to what gets manufactured.
Market Impact: Raises hospitality account retention to 2.3 times higher

Build Ranges Around Open Stock Not Cased Sets

Roughly 21% of retail value still moves as a boxed canteen against a clear majority a generation ago, and households now buy four or six place settings and mix patterns deliberately. Ranges built around a complete service serve an occasion that has largely stopped happening, while open stock raises purchase frequency and makes availability matter. Participants restructuring toward open stock report retail sell-through rising by roughly 29%, on a packaging and merchandising decision rather than any manufacturing change. Boxed sets stay in the range for the gifting share that remains, at a smaller allocation.
Market Impact: Lifts retail sell-through by roughly 29% overall in stores

Who Controls the Margin Pool

Concentration is very low at 18% held by the top five, measured on wholesale shipment value rather than on pieces, which would distort across a teaspoon and a steak knife. The leader to challenger gap is wide in retail and hospitality distribution and in pattern heritage, both accumulated over decades, and effectively absent in manufacturing, where the Guangdong and Moradabad clusters serve anyone placing an order.
Competition runs on three dimensions currently. Retail shelf and department placement decide household volume, since the purchase is visual and no specification is offered to compare. Hospitality distribution decides the steadier half of the market, where buyers specify weight, grade and availability explicitly. Price decides the value tier, where domestic manufacturers in China, India and Brazil hold cost positions imported product cannot contest at home.

Pressure is building on disclosure, and that is where positions will move. A category in which four products in five do not name the alloy that decides corrosion is vulnerable to any participant willing to state it, and hospitality buyers already ask. Once a specification buyers can check exists at retail, the products quietly built from the cheaper grade have nowhere to go but downward on price.
rainbow-flatware-market-company-positioning-matrix-1790023401926

Competitive Moat and Risk Dimensions

LIFETIME BRANDS

Moat: Retail Distribution And Breadth

Housewares distribution across North American mass, department and online channels places flatware in front of buyers at a scale specialists cannot approach, and breadth across tabletop makes the company a range partner for retail buyers managing a whole department rather than a single-category vendor. Specialists cannot assemble that shelf position quickly.
LIFETIME BRANDS

Risk: Value Tier Alloy Exposure

Volume weighted toward accessible price points implies alloy choices that the disclosure argument would expose directly, and hospitality buyers already ask the question that retail does not. As grade naming spreads, price positions built quietly on the cheaper stainless become difficult to defend at any shelf.
ZWILLING JA HENCKELS

Moat: Forging Reputation And Heritage

A manufacturing reputation built on blade and cutlery metallurgy over generations gives the company credibility on exactly the attributes this category hides, and pattern heritage supports pricing that appearance alone would not sustain in a market where visually similar product is widely available. Few competitors can make that argument credibly.
ZWILLING JA HENCKELS

Risk: Formal Dining Occasion Decline

Positions built on pattern heritage and complete services are exposed to a gifting convention that has largely disappeared, with cased sets down to roughly a fifth of retail value. Rebuilding around open stock requires merchandising and availability discipline that a heritage range structure was never designed to deliver.

Players Tracked

Prominent Players

Lifetime Brands
Zwilling JA Henckels
Groupe SEB
Sambonet Paderno
Villeroy and Boch

Other Key Players

Fortessa Tableware Solutions
Steelite International
Christofle
Robert Welch Designs
Rayware Group
Amefa
Hepp
Arc Holdings
Mepra
Cutipol
Degrenne
Tramontina
Narumi
Bergner
Wilmax

Recent Developments

MARCH 2025

Groupe SEB consolidates European tableware distribution

The company concentrated European warehousing and distribution for tableware categories into fewer facilities as part of a wider cost programme. This was an internal logistics decision taken on cost grounds, involving no acquisition, divestiture or external partner at any stage. Existing supplier relationships continued unchanged throughout the consolidation.
Signal: Distribution cost is being addressed while the category's disclosure question stays open. Cost is where management attention sits.
NOVEMBER 2024

Tramontina expands Brazilian flatware manufacturing capacity

The company added forging and finishing capacity at its Brazilian operations serving domestic demand and regional export markets. This was organic capital investment funded internally, with no joint venture, acquisition or contract manufacturing partner involved anywhere. Output serves both domestic retail and hospitality demand across the region, alongside export volume.
Signal: Regional manufacturing outside Asia stays viable where domestic demand supports it. Freight avoidance is a real cost position.
MAY 2025

Sambonet Paderno acquires European tableware brand

The company completed the acquisition of a European tableware business, adding pattern heritage and hospitality distribution to its existing portfolio. This was a completed acquisition rather than a merger or joint venture, with both brands continuing under common ownership. Distribution overlap between the two was limited.
Signal: Pattern heritage and hospitality accounts are being bought rather than built. Heritage trades at a price now.

Where Stainless Cost Sits

Stainless coil accounts for roughly 41% of manufacturing cost and the alloy choice dominates that figure, since the nickel-bearing grade carries ten percent nickel and the nickel-free grade carries none. Forging, stamping and edge work add about 22%, and polishing a further 14%, which is the step most often shortened under pressure. Packaging and freight take the remainder on a dense product that ships well.
The 2022 nickel episode reshaped the industry within weeks rather than over a cycle. Exchange nickel pricing dislocated violently in March of that year and the nickel-bearing grade became far more expensive than the alternative, which pushed production downward across much of the category while descriptions and photographs stayed unchanged. Lifetime Brands and Groupe SEB reporting for that period both identify raw material inflation as requiring pricing action.

Exposure varies by alloy choice and by manufacturing location. Participants specifying the nickel-bearing grade carry an exposure that nickel-free producers avoid completely, and they also carry the higher polishing cost that a finer finish demands. Manufacturers producing in China, India and Brazil for their own domestic markets avoid the freight layer that importers pay, which is most of why domestic brands hold the value positions they do.
rainbow-flatware-market-cost-volatility-analysis-1790023402185

Contract stainless coil across a full production cycle

Nickel pricing moves violently and unpredictably, and a manufacturer buying coil at spot absorbs a movement it cannot pass through mid-season. Contracting across a production cycle stabilises cost and preserves the ability to hold a published price. Smaller producers avoid the commitment because it lands before the selling season generates cash, which is exactly when the exposure matters.

Hold both alloy grades in the range with honest labelling

Nickel exposure sits entirely in one grade while the other avoids it completely, which makes a single-alloy range unnecessarily exposed to a metal market nobody in tabletop can forecast. Running both lets pricing and mix flex through a dislocation. The requirement is that each is labelled for what it is rather than presented as equivalent.

Protect polishing time in the manufacturing specification

Polishing is around a seventh of manufacturing cost and the first step shortened when a contracted facility comes under pressure, and it determines both finish quality and how well a coating adheres if one is applied. Writing polishing standards into the supply agreement and auditing against them costs inspection time rather than material. Most contracts do not specify it.

Portfolio Architecture for Margin Defence

Margin architecture divides by disclosure and by channel rather than by manufacturing cost, which is not what a production model would suggest. Undisclosed value sets sold through mass and online channels run at gross margins in the low to high twenties, competing against visually identical product whose alloy and weight may differ entirely behind the same photograph and price point.
Disclosed grade and stated weight products sold through department, specialty and design channels hold gross margins in the high thirties to mid forties. The spread reflects disclosure and channel rather than material, since the alloy difference is real but modest against retail price. Buyers who have replaced a pitted set once ask the question unprompted and pay the difference without hesitation.

The highest-value pool is hospitality specification, at margins in the mid forties to mid fifties. Those buyers state weight per dozen, require alloy grade and demand multi-year pattern availability, and they pay for all three because losing 16% of inventory annually makes replenishment certainty worth more than a unit price saving. Value retail sets fill the presses. They do not build a position. That is the shape of the category.

Volume / Commodity-Adjacent

Undisclosed value sets sold through mass and online channels. Visually identical product whose alloy and weight may differ entirely competes at the same price behind the same photograph. Nothing on the pack lets a buyer tell them apart.
Gross Margin: 22 to 30%

Premium / Certified

Disclosed grade and stated weight product sold through department, specialty and design channels. The eight-point range reflects disclosure and channel rather than material, which differs modestly. Buyers who replaced a pitted set once ask the question unprompted.
Gross Margin: 38 to 46%

Sustainability / Regulatory / Next-Generation

Hospitality specification product with stated weight per dozen, named alloy and multi-year availability. Losing a sixth of inventory annually makes replenishment certainty worth more than unit price. Requalifying a specification and retraining a service team is genuinely inconvenient.
Gross Margin: 46 to 54%
rainbow-flatware-market-portfolio-architecture-1790023402692

High-value Sub-segments and Strategic Watch-out

Hospitality Specified Flatware

High value and steady growth. Buyers state weight per dozen, require alloy grade and demand multi-year availability, and losing 16% of inventory annually makes replenishment certainty worth paying for. Requalification friction makes these accounts the most durable in the market. Unit price saving does not move these accounts.
Gross Margin: 48 to 54%

Disclosed Grade Retail Ranges

High value and moderate growth. Around 19% of products name the alloy, and participants using the better grade and saying so report price realisation about 1.5 times comparable undisclosed competitors. The advantage holds while the rest of the shelf stays silent. Naming it costs an artwork revision.
Gross Margin: 40 to 46%

Undisclosed Value Retail Sets

Volume core, competing on photograph and price against product that may be made from an entirely different alloy. It fills the presses and builds no defensible position for anyone anywhere. Private label competes on the same terms with the same invisibility. Volume is real and margin is thin.
Gross Margin: 22 to 29%

Silver-Plated And Sterling Ranges

Strategic watch-out. Growing slowest at 2.4% and 2.9% respectively, carrying a polishing requirement almost nobody accepts now. The sixteen-point range reflects how differently heritage brands price a declining format. Pattern heritage still supports pricing that appearance alone could not. Polishing is the requirement buyers now refuse.
Gross Margin: 28 to 44%

How Replacement Now Works

Household replacement here used to be generational and is now incremental, which changes almost everything commercially. A cased canteen furnished a home for decades and was replaced rarely; open stock bought four pieces at a time is added to, replaced piecemeal and mixed deliberately. That raises purchase frequency, lowers the ticket and makes pattern availability over several years far more important than manufacturers previously needed.
Stickiness varies sharply by channel and by what went wrong. Hospitality accounts are the most durable, because requalifying flatware against a specification and retraining a service team is genuinely inconvenient and losing a sixth of inventory annually makes availability decisive. Households that replaced a pitted set once return asking about alloy and weight. Households buying on appearance through marketplaces have no attachment whatsoever and select on photograph and price.

Buyer behaviour shifted in one direction over the past five years. The cohort that bought inexpensive sets during the home spending period has now put them through several hundred dishwasher cycles, and a meaningful share found rust at the tines they had no reason to anticipate. That group arrives at replacement asking a specification question, and almost nothing on a shelf answers it.
rainbow-flatware-market-end-use-penetration-index-1790023403189

Where Disclosure Would Pay

These are among the four positions where our research anticipates prominent divergence between winners and laggards over the coming forecast period. Each is grounded in the demand model, the regulatory perimeter, and the announced capacity pipeline.
01 / ALLOY GRADE DISCLOSURE

Name the steel the fork is made from

Around 19% of flatware states its stainless grade, and the difference between the nickel-bearing and nickel-free alloys decides whether a set survives years of dishwasher detergent or pits within months at the tines. Naming it costs an artwork revision and converts an invisible quality difference into a visible one at the shelf. Participants using the better grade and saying so report price realisation around 1.5 times comparable undisclosed products, and cheaper competitors cannot follow without inviting the comparison, which is exactly the comparison they have spent years avoiding.
02 / WEIGHT STATEMENT PRACTICE

Print the grams buyers are already judging

Mass per place setting is what people mean when they call flatware good or cheap, hospitality buyers specify by it explicitly, and around 6% of retail products state it anywhere at all. Printing grams per piece gives a shopper the one attribute they could genuinely compare between two sets sealed behind plastic windows. Participants doing it report price realisation around 1.3 times comparable products with no stated weight, because the figure reads immediately as a premium signal, in a category that currently offers a shopper no other comparable figure.
03 / AVAILABILITY COMMITMENT DISCIPLINE

Promise the pattern will still exist

Restaurants lose roughly 16% of flatware inventory each year to bins, customers and handle failure, which makes replenishment rather than replacement the demand driver and pattern availability worth more than durability. A supplier who discontinues a pattern quickly loses the account regardless of how good the product was. Participants committing to a stated availability period and holding stock against it report hospitality account retention around 2.3 times competitors running normal range cycles, and the cost is inventory carry rather than any manufacturing change at all.
04 / OPEN STOCK RESTRUCTURING

Build the range households actually buy

Roughly 21% of retail value still moves as a boxed canteen against a clear majority a generation ago, because households now buy four or six place settings at a time and mix patterns deliberately rather than receiving a complete service as a gift. Ranges built around a cased set serve an occasion that has largely stopped happening. Participants restructuring toward open stock report retail sell-through rising by roughly 29%, on a merchandising decision rather than any manufacturing change, since the boxed format stays in the range at a smaller allocation.

Engagement Snapshot From the Field

A live engagement with an industry participant carrying material or product regulatory and market exposure ahead of a defining policy shift, showing how our research translates into a defensible multi-year portfolio strategy.
MARKET MINDS ADVISORY · CLIENT ENGAGEMENT SUMMARY
Flatware Producer Strategic Portfolio Review and Transition Roadmap 2026·Investment Scenario on Flatware Exposure Evaluation 2025-26
CLIENT PROFILE
A tabletop supplier selling flatware to European and North American retail and hospitality distributors with category revenue near USD 76 million (client-reported, unverified by MMA). No retail product named its alloy grade or stated a weight, and the range was built around boxed sets with limited open stock. Hospitality revenue was 22% of the total and patterns were discontinued on a three-year cycle.
STRATEGIC CHALLENGE
Retail revenue had fallen for two consecutive years while hospitality held flat, and management attributed the decline to private label pressure. A cost reduction programme targeting stainless specification had been approved. Nobody had tested returned product for alloy grade, or asked hospitality accounts why they had not grown. Both assumptions went untested for two full financial years.
MMA APPROACH
MMA analysed returned and complaint product for alloy composition rather than relying on supplier declaration, then benchmarked weight per place setting against eight competitors. Hospitality accounts were interviewed about specification and availability requirements. Retail sell-through was compared between boxed set and open stock presentations across matched stores. Findings were reconciled against the client's own purchase specifications.
KEY FINDINGS
  1. Alloy analysis showed 71% of the retail range built from the nickel-free grade despite purchase specifications stating otherwise, which nobody had verified in four years of supply.
  2. Corrosion complaints traced entirely to that portion of the range, and the proposed cost reduction programme targeted stainless specification further downward further, on cost grounds nobody had questioned.
  3. Every hospitality account interviewed named multi-year pattern availability as a primary requirement, and the client's three-year discontinuation cycle had cost it two accounts already.
  4. Open stock presentation delivered sell-through 34% above boxed sets in matched stores, and open stock accounted for only 17% of the range.
CLIENT PROFILE
A tabletop supplier selling flatware to European and North American retail and hospitality distributors with category revenue near USD 76 million (client-reported, unverified by MMA). No retail product named its alloy grade or stated a weight, and the range was built around boxed sets with limited open stock. Hospitality revenue was 22% of the total and patterns were discontinued on a three-year cycle.
STRATEGIC CHALLENGE
Retail revenue had fallen for two consecutive years while hospitality held flat, and management attributed the decline to private label pressure. A cost reduction programme targeting stainless specification had been approved. Nobody had tested returned product for alloy grade, or asked hospitality accounts why they had not grown. Both assumptions went untested for two full financial years.
MMA APPROACH
MMA analysed returned and complaint product for alloy composition rather than relying on supplier declaration, then benchmarked weight per place setting against eight competitors. Hospitality accounts were interviewed about specification and availability requirements. Retail sell-through was compared between boxed set and open stock presentations across matched stores. Findings were reconciled against the client's own purchase specifications.
KEY FINDINGS
  1. Alloy analysis showed 71% of the retail range built from the nickel-free grade despite purchase specifications stating otherwise, which nobody had verified in four years of supply.
  2. Corrosion complaints traced entirely to that portion of the range, and the proposed cost reduction programme targeted stainless specification further downward further, on cost grounds nobody had questioned.
  3. Every hospitality account interviewed named multi-year pattern availability as a primary requirement, and the client's three-year discontinuation cycle had cost it two accounts already.
  4. Open stock presentation delivered sell-through 34% above boxed sets in matched stores, and open stock accounted for only 17% of the range.
RECOMMENDED STRATEGY
Phase 1: Phase one: halt the specification reduction, verify alloy on every inbound shipment and name the grade on all retail packaging. Phase 2: Phase two: extend pattern availability commitments to five years for hospitality accounts and publish the commitment. prominently in every hospitality tender document. Phase 3: Phase three: rebuild the range around open stock and print grams per piece across every retail product. sold through retail channels within twelve months.
OUTCOME
Retail revenue returned to growth within three quarters and corrosion complaints fell by roughly four fifths once verified alloy reached the field (client-reported, unverified by MMA). The published grade became the range's primary retail differentiator, and the availability commitment recovered one of the two lost hospitality accounts.

Frequently Asked Questions

Foundational context covering the market sizes, CAGR, scope, country, region and competition that inform every finding below. This section is provided to cover basics and most often pre-purchase conversations, answered from the MMA Primary Research Dataset.

What is the current size of the Flatware Market?

The market was valued at USD 12.8 billion in 2025, rising to USD 13.4 billion in 2026. Sizing is at wholesale shipment value across six construction materials.

How large will the Flatware Market be by 2036?

MMA forecasts USD 20.6 billion by 2036, an increase of USD 7.2 billion over the 2026 base. That represents expansion of 1.54 times across the forecast period.

What is the CAGR for the Flatware Market 2026 to 2036?

The base case CAGR is 4.4%, with a bull case of 5.6% and a bear case of 3.2%. Historical growth between 2020 and 2025 ran at 3.3%.

Which segment is growing fastest?

Coated and decorative finish flatware grows at 6.6%, half again the market rate, as colour moves from hospitality into households. Alternative material flatware follows at 5.9%.

Who are the major companies in the Flatware Market?

Lifetime Brands, Zwilling JA Henckels, Groupe SEB, Sambonet Paderno and Villeroy and Boch lead on shipment value, holding a combined 18%. Manufacturing concentrates in Guangdong and Moradabad.

Which country is growing fastest?

India grows fastest at 7.2%, because domestic manufacturing capacity at Moradabad and Jagadhri sits alongside rapid urban household formation in the same market. Export volume from the same base supplies a meaningful share of global demand.

Report Segmentation Architecture

The full report scope spans multiple orthogonal segmentation dimensions, with cross-tabulated demand data provided for each dimension pair. Coverage extends further to regional breakdowns, trend trajectories, and the competitive detail needed to support segment-level decision-making.

By Construction Material

  • Eighteen Ten Stainless Flatware
  • Eighteen Zero Stainless Flatware
  • Coated and Decorative Finish Flatware
  • Silver-Plated Flatware
  • Sterling Silver Flatware
  • Alternative Material Flatware

By End-Use Setting

  • Domestic Everyday Dining
  • Domestic Formal and Occasion Use
  • Hotel and Restaurant Service
  • Banqueting and Catering
  • Institutional and Healthcare Dining
  • Gifting and Registry Purchase

By Distribution Channel

  • Department Stores
  • Mass and Discount Retail
  • Home and Lifestyle Specialty Retail
  • Online Marketplaces
  • Hospitality Supply Distributors
  • Brand Direct and Design Retail

By Region

  • East Asia
  • Western Europe
  • North America
  • South Asia and Pacific
  • Latin America
  • Middle East and Africa
  • Eastern Europe

Scope, Methodology, and Coverage

Every figure in this report is reproducible from documented input assumptions. The scope below maps the historical period, the forecast horizon, the segmentation dimensions, and the countries covered, alongside the underlying primary and qualitative methodology.
Historical Period
2020 to 2025
Forecast Period
2026 to 2036
Base Year
2025 (USD billions; MMA Primary Research Dataset, September 2026)
Market Definition
This market covers eating and serving flatware for domestic and hospitality use, spanning eighteen ten stainless, eighteen zero stainless, coated and decorative finish, silver-plated, sterling silver and alternative material construction. Sizing is at wholesale shipment value across department, mass, specialty, marketplace, hospitality distributor and direct channels, and includes coated decorative finishes which MMA analyses separately at greater depth in a dedicated report. Disposable cutlery, cooking and kitchen utensils, knife blocks and chef knives, and hollowware serving dishes are excluded throughout.
Quantitative Units
USD billions at wholesale shipment value; volume in millions of place settings; mass in grams per piece.
Segmentation Dimensions
Construction material, end-use setting, distribution channel, and geographic region.
Regions Covered
East Asia, Western Europe, North America, South Asia and Pacific, Latin America, Middle East and Africa, Eastern Europe
Countries Covered
China, India, Germany, United States, Brazil, United Arab Emirates
Key Companies Profiled
Lifetime Brands, Zwilling JA Henckels, Groupe SEB, Sambonet Paderno, Villeroy and Boch, Fortessa Tableware Solutions, Steelite International, Christofle, Robert Welch Designs, Rayware Group, Amefa, Hepp, Arc Holdings, Mepra, Cutipol, Degrenne, Tramontina, Narumi, Bergner, Wilmax
Quantitative Methodology
Primary survey, n=3,800 respondents, Q4 2025, six countries; demand-side model with trade association cross-validation
Qualitative Methodology
47 expert interviews, Q4 2025; applied to validate demand model assumptions, identify emerging dynamics, and assess competitive positioning
Report Format
PDF and XLSX data workbook (Word format preview document)
Publisher
Market Minds Advisory
Report Code
MMA-2026-CON-792
Published
September 2026
Contact
sales@marketmindsadvisory.com | www.marketmindsadvisory.com

Purchase the full Flatware Market Report (2026 to 2036).

The full report sizes the flatware market across six construction materials, six end-use settings and six distribution channels for all seven global regions. It includes alloy composition analysis of returned and retail product rather than reliance on supplier declaration, with corrosion complaints traced to grade. Weight per place setting is benchmarked participant by participant against stated specifications. Hospitality availability requirements are collected through direct account interviews, and retail sell-through is compared between boxed set and open stock presentations. Competitive assessment covers 20 participants on a consistent shipment value basis.
Alloy composition analysed rather than taken on declaration
Weight per place setting benchmarked participant by participant
Hospitality availability requirements collected from accounts
Sell-through compared between boxed and open stock
Six construction materials sized through 2036
Twenty participants assessed on wholesale shipment value

Built For The People Who Decide

From boardroom strategy to bench-side execution, this report is read cover-to-cover by leaders shaping the next decade of their industry, turning demand scenarios, market dynamics and valuation benchmarks into decisions.
CXOs/ Presidents/ VPs/ Managers
M&A and Corporate Development
Strategy Teams and R&D Heads
Procurement and Product Directors
Regulatory and Compliance Leaders
Investor Relations and Equity Analysts