Market Minds Advisory
Railway System Market

Railway System Market: The Train Is the Entry Ticket, Not the Business

A mainline trainset is designed for 35 years and costs roughly a third of what its owner spends keeping it running, so the vehicle sale buys into three decades of something else.

Lead Analyst

David Horsley

Published

September 2026

Make Smarter Decisions with Customized Research Insights

Request a free sample report and evaluate market opportunities, growth trends, and competitive dynamics relevant to your business needs.

2025 MARKET VALUE$236.0BMarket Size 2025
2036 FORECAST VALUE$387.0BBase Case , 2026 to 2036
CAGR 2026 TO 20364.6 %Bull 5.8% / Bear 3.4%
INCREMENTAL OPPORTUNITY$140.2BNet 10- year value creation
EXPANSION MULTIPLE1.57x2036 value over 2026 base
Strategic Levers
M&A Pipeline
Regional Outlook
Country Rankings
Competitive Intelligence
Segmental Deep-dive
Call-Us : 91 93563 13602

Executive Snapshot and Market Trajectory

A trainset is designed for 35 years and whole life spending runs near 3.2 times the purchase price, which makes the vehicle contract an entry ticket rather than the business itself. Manufacturers who understood that priced vehicles accordingly and won three decades of something else.
Signalling is where the money and the trouble both concentrate. Train control programmes slip an average of 38% on schedule, because the vehicle, the trackside and the operating rules all have to change at once and nobody can stage that neatly. Signalling grows at 6.9%, half again the market rate of 4.6%, and it carries a share of programme risk far above its share of spend. Delivery record beats price on this work.
East Asia holds 34% of value on Chinese network investment that exceeds any other market by a very wide margin, and India grows fastest anywhere at 8.2%. Discontinuous electrification, where battery vehicles cover the unwired sections, cuts infrastructure capital by around 44% and is quietly rewriting how much overhead wire a network actually needs to hang at all. Marginal routes now qualify for schemes for the first time.
Market Definition
Supply of railway systems across rolling stock, track and civil infrastructure, signalling and train control, electrification and traction power, station and depot systems, and rail telecommunications and passenger information, measured at supplier selling value including associated engineering. Excludes railway operating revenue, land acquisition, freight forwarding, urban bus and trolleybus systems, and infrastructure not dedicated to rail.
Base Year Value
$236.0B in 2025 (MMA Primary Research Dataset, August 2026)
Forecast Period
2026 to 2036, eleven discrete annual values
CAGR
4.6% base case. Bull 5.8%. Bear 3.4%.
Fastest Growth Segment
Signalling and Train Control Systems: 6.9% CAGR
Fastest Growth Country
India: 8.2% CAGR
Fastest Growth Region
South Asia and Pacific: 6.8% CAGR
Largest Region
East Asia: 34% of 2025 global value
Market Leaders
CRRC, Alstom, Siemens Mobility, Hitachi Rail, Wabtec. Source: MMA Primary Research Dataset, July 2026.
Primary Survey
n=3,800 procurement and R&D decision-makers, Q4 2025, six countries
Methodology
Demand-side build-up, cross-validated against public data, 47 expert interviews

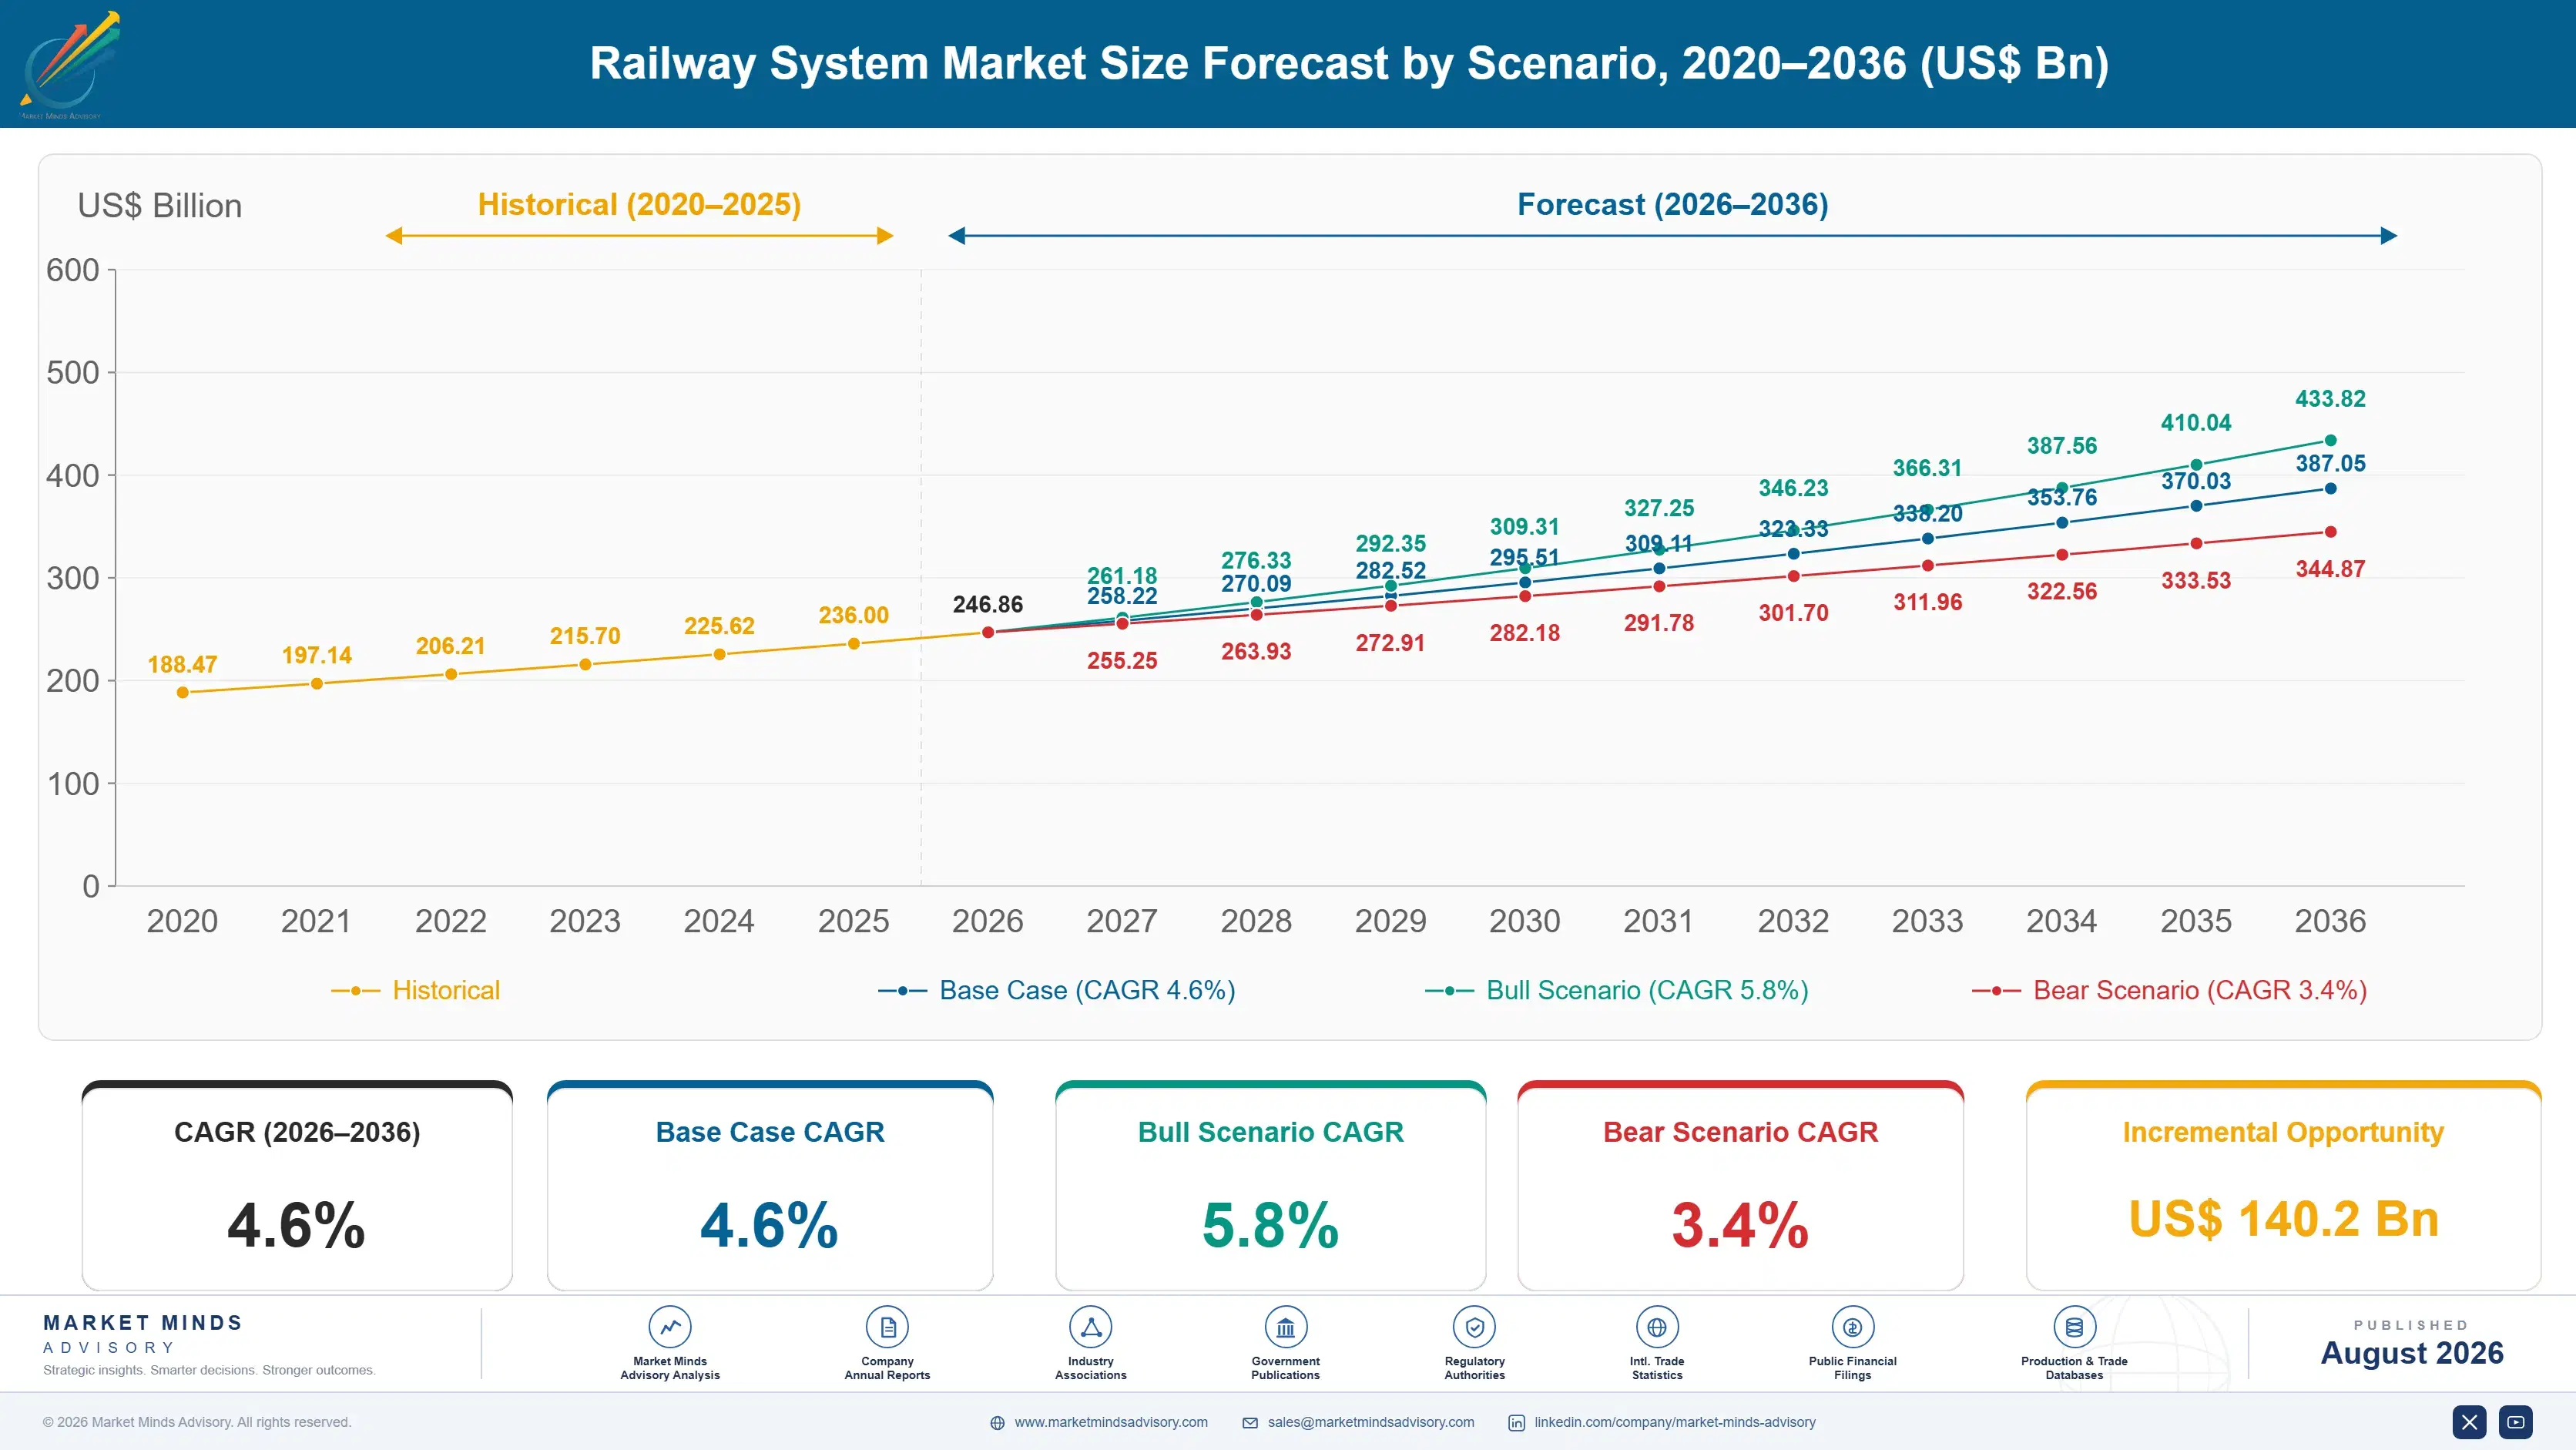
Railway System Market Forecast Scenarios

railway-system-market-trends-growth-size-forecast-scenario-1787594745333
Growth ran near 3.8% between 2020 and 2025, with passenger volumes collapsing in 2020 and recovering unevenly while infrastructure spending held far steadier than operating revenue did. Governments treated rail investment as stimulus rather than cutting it, which insulated the supply market from the demand shock hitting operators. Signalling and electrification proceeded throughout, and rolling stock orders were what slipped as operators deferred fleet decisions.
Base case 4.6% rests on three mechanisms. Signalling renewal runs on obsolescence rather than on ambition, since interlockings and train control systems reach end of supportable life whether or not a network wants to spend. Urban rail construction across Asia continues at volumes that main line programmes never approach, with India growing fastest at 8.2%. And whole life service attachment keeps growing faster than vehicle sales, at roughly 3.2 times purchase value across a 35 year life.
The bull case at 5.8% assumes European and North American network renewal programmes proceed at announced funding levels rather than being deferred, which has not been the historical pattern. The bear case at 3.4% is signalling programme overruns, already averaging 38% on schedule, hardening political resistance to large rail commitments and pushing networks toward patching what they run.

Where the Thirty-Five Years Actually Goes

The vehicle is the visible part and the smallest durable part of this business. A mainline trainset is designed for 35 years and its owner spends roughly 3.2 times the purchase price keeping it running across that life, through overhaul, spares, modification and eventual life extension. Manufacturers who grasped that priced vehicles to win the position and then earned across three decades of everything that followed.
TOP FIVE CONCENTRATION41%Scale players against a long regional supplier tail
VEHICLE DESIGN LIFE35 yearsService life expected of a mainline trainset today
LIFECYCLE TO PURCHASE RATIO3.2xWhole life spending against the original vehicle price
SIGNALLING PROGRAMME OVERRUN38%Average schedule slip across major train control rollouts
DISCONTINUOUS ELECTRIFICATION SAVING44%Capital reduction where battery covers unwired route sections
RAIL LAND TRANSPORT SHARE9%Passenger kilometres carried by rail across surveyed markets
Signalling behaves differently from every other domain. It is a modest share of total spend and a very large share of programme risk, because a train control rollout requires the vehicle, the trackside and the operating rulebook to change together on the same date. Major programmes slip an average of 38% on schedule, and the delay usually sits in integration and safety approval rather than in anything a supplier manufactured badly.
Electrification economics have shifted quietly and considerably. Full route electrification has always been expensive per kilometre, particularly through tunnels and under bridges where clearance work dominates cost. Discontinuous schemes wire the cheap sections and run battery vehicles across the rest, cutting infrastructure capital by around 44% on suitable routes. That changes which lines are worth electrifying at all.
"Every railway procurement in the world is scored on vehicle price and then lived with for 35 years on everything else. The suppliers who win consistently are the ones who worked out which number the customer was actually going to pay, and then made sure they were still there to collect it."
Director, Rail Systems and Transport Infrastructure Practice · MMA Construction and Industrial Equipment Practice · August 2026

Market Trends

Signalling obsolescence driving renewal independent of network ambition

Interlockings and train control systems reach end of supportable life on their own schedule, and a network running unsupportable signalling has no choice about replacement whatever its funding position. That makes signalling renewal considerably less discretionary than rolling stock or new line construction, which is why it grows at 6.9% against a market rate of 4.6%. Migration to modern train control also releases capacity on existing track, which is far cheaper than building more of it. Programmes slip an average of 38% on schedule, and they proceed anyway because the alternative is worse.
Market Impact: Worth 3.2 times purchase price

Discontinuous electrification changing which routes justify overhead wire

Full electrification costs most where clearance work dominates, under bridges and through tunnels, which is exactly where the wire is hardest to justify. Discontinuous schemes electrify the straightforward sections and run battery vehicles across the gaps, cutting infrastructure capital by around 44% on suitable routes. That brings lines into scope that could never carry a full scheme, and it changes the vehicle specification at the same time. Electrification and traction power grows at 5.8% partly because networks are now electrifying more routes for less money each. Traction power and vehicle specification now develop together rather than apart.
Market Impact: Indian systems growing at 8.2%

Market Opportunities and Growth Drivers

Whole life service attachment growing faster than vehicle sales

Owners spend roughly 3.2 times the purchase price across a 35 year vehicle life, through overhaul, spares, modification and life extension work. Manufacturers holding those contracts earn across three decades from a position won once, and the revenue is far steadier than order intake that swings with government funding cycles. Operators increasingly prefer availability-based contracts that transfer maintenance risk to the supplier, which deepens the relationship further. That structure rewards manufacturers with fleet data and depot presence over those competing on build price. Order intake swings with government funding while service revenue barely moves at all.
Market Impact: Average slip reaches 38%

Asian urban rail construction outpacing every main line programme

Metro and suburban rail construction across China, India and Southeast Asia proceeds at volumes that main line programmes in mature networks never approach, and India grows fastest anywhere at 8.2% on a national metro building programme running in more than a dozen cities simultaneously. Urban schemes buy complete systems rather than components, covering vehicles, signalling, power, depot and station equipment in a single procurement. That structure suits integrated suppliers and disadvantages specialists in every domain. Vehicles, signalling and power are frequently bought together in one package. Domain specialists bid beneath a consortium leader taking margin above them.
Market Impact: Ignores 3.2 times lifetime spend

Market Restraints and Challenges

Train control integration overruns hardening political resistance to programmes

Major signalling rollouts slip an average of 38% on schedule because the vehicle, the trackside and the operating rulebook must change together on a single date, and staging that neatly is genuinely difficult. The root cause is safety approval, which cannot be parallelised or accelerated by adding resources. Commercially the overruns feed political scepticism about large rail commitments and push networks toward patching existing systems. Suppliers are responding with staged migration architectures that allow partial operation, which reduces the risk without eliminating it. Networks burned once weigh delivery record heavily at the next procurement.
Market Impact: Programmes slipping 38% on schedule

Vehicle tenders scored on price rather than lifetime cost

Public procurement rules in most markets weight vehicle price heavily even though owners spend roughly 3.2 times that figure across a 35 year life. The root cause is that purchase price is auditable and lifecycle cost is a forecast that a procurement authority cannot defend against challenge. Commercially it drives bidders toward specification compliance at minimum cost and away from designs that would reduce lifetime spending. Availability-based contracting is the mitigation being adopted, and it remains a minority of procurements globally. Availability contracting forces both sides to price 35 years rather than a single delivery.
Market Impact: Cuts capital cost by 44%
4 additional market trends, 3 additional growth drivers, and 2 additional restraints and challenges are covered in the full report. Contact sales@marketmindsadvisory.com to access the complete intelligence.

Segment CAGR and Growth Architecture

Six segments are split by railway system domain, because each one carries its own engineering discipline, approval regime and procurement route even when a single programme buys all of them together. Commercial services attach across every domain rather than forming one, so they sit in the framework. End-use network type is handled there as well.
railway-system-market-trends-growth-market-share-analysis-1787594745905

Signalling and Train Control Systems

Growing at 6.9%, half again the market rate of 4.6%, signalling renewal runs on obsolescence rather than ambition, since a network operating unsupportable interlockings has no real choice about replacement whatever its funding position looks like. Modern train control also releases capacity on existing track, which is dramatically cheaper than building more of it, and that argument wins funding where a straightforward renewal case would not. The domain carries programme risk out of all proportion to its share of spend, with major rollouts slipping an average of 38% on schedule. Approval and integration rather than manufacturing decide who succeeds here. Staged migration architectures are the emerging answer to that risk.
CAGR 6.9%

Electrification and Traction Power Systems

At 5.8% electrification is being reshaped by discontinuous schemes that wire the straightforward sections and run battery vehicles across the gaps, cutting infrastructure capital by around 44% on suitable routes. Clearance work under bridges and through tunnels dominates the cost of full electrification, and avoiding it changes which lines can be justified at all. The domain covers overhead line equipment, substations, feeder arrangements and increasingly the charging infrastructure that discontinuous operation requires. Traction power design is now coupled to vehicle specification more tightly than it has ever been, which favours suppliers working across both. Charging infrastructure for battery operation is becoming part of the traction power scope rather than a separate vehicle matter.
CAGR 5.8%
Full segment breakdown across 6 segments available in the complete report.

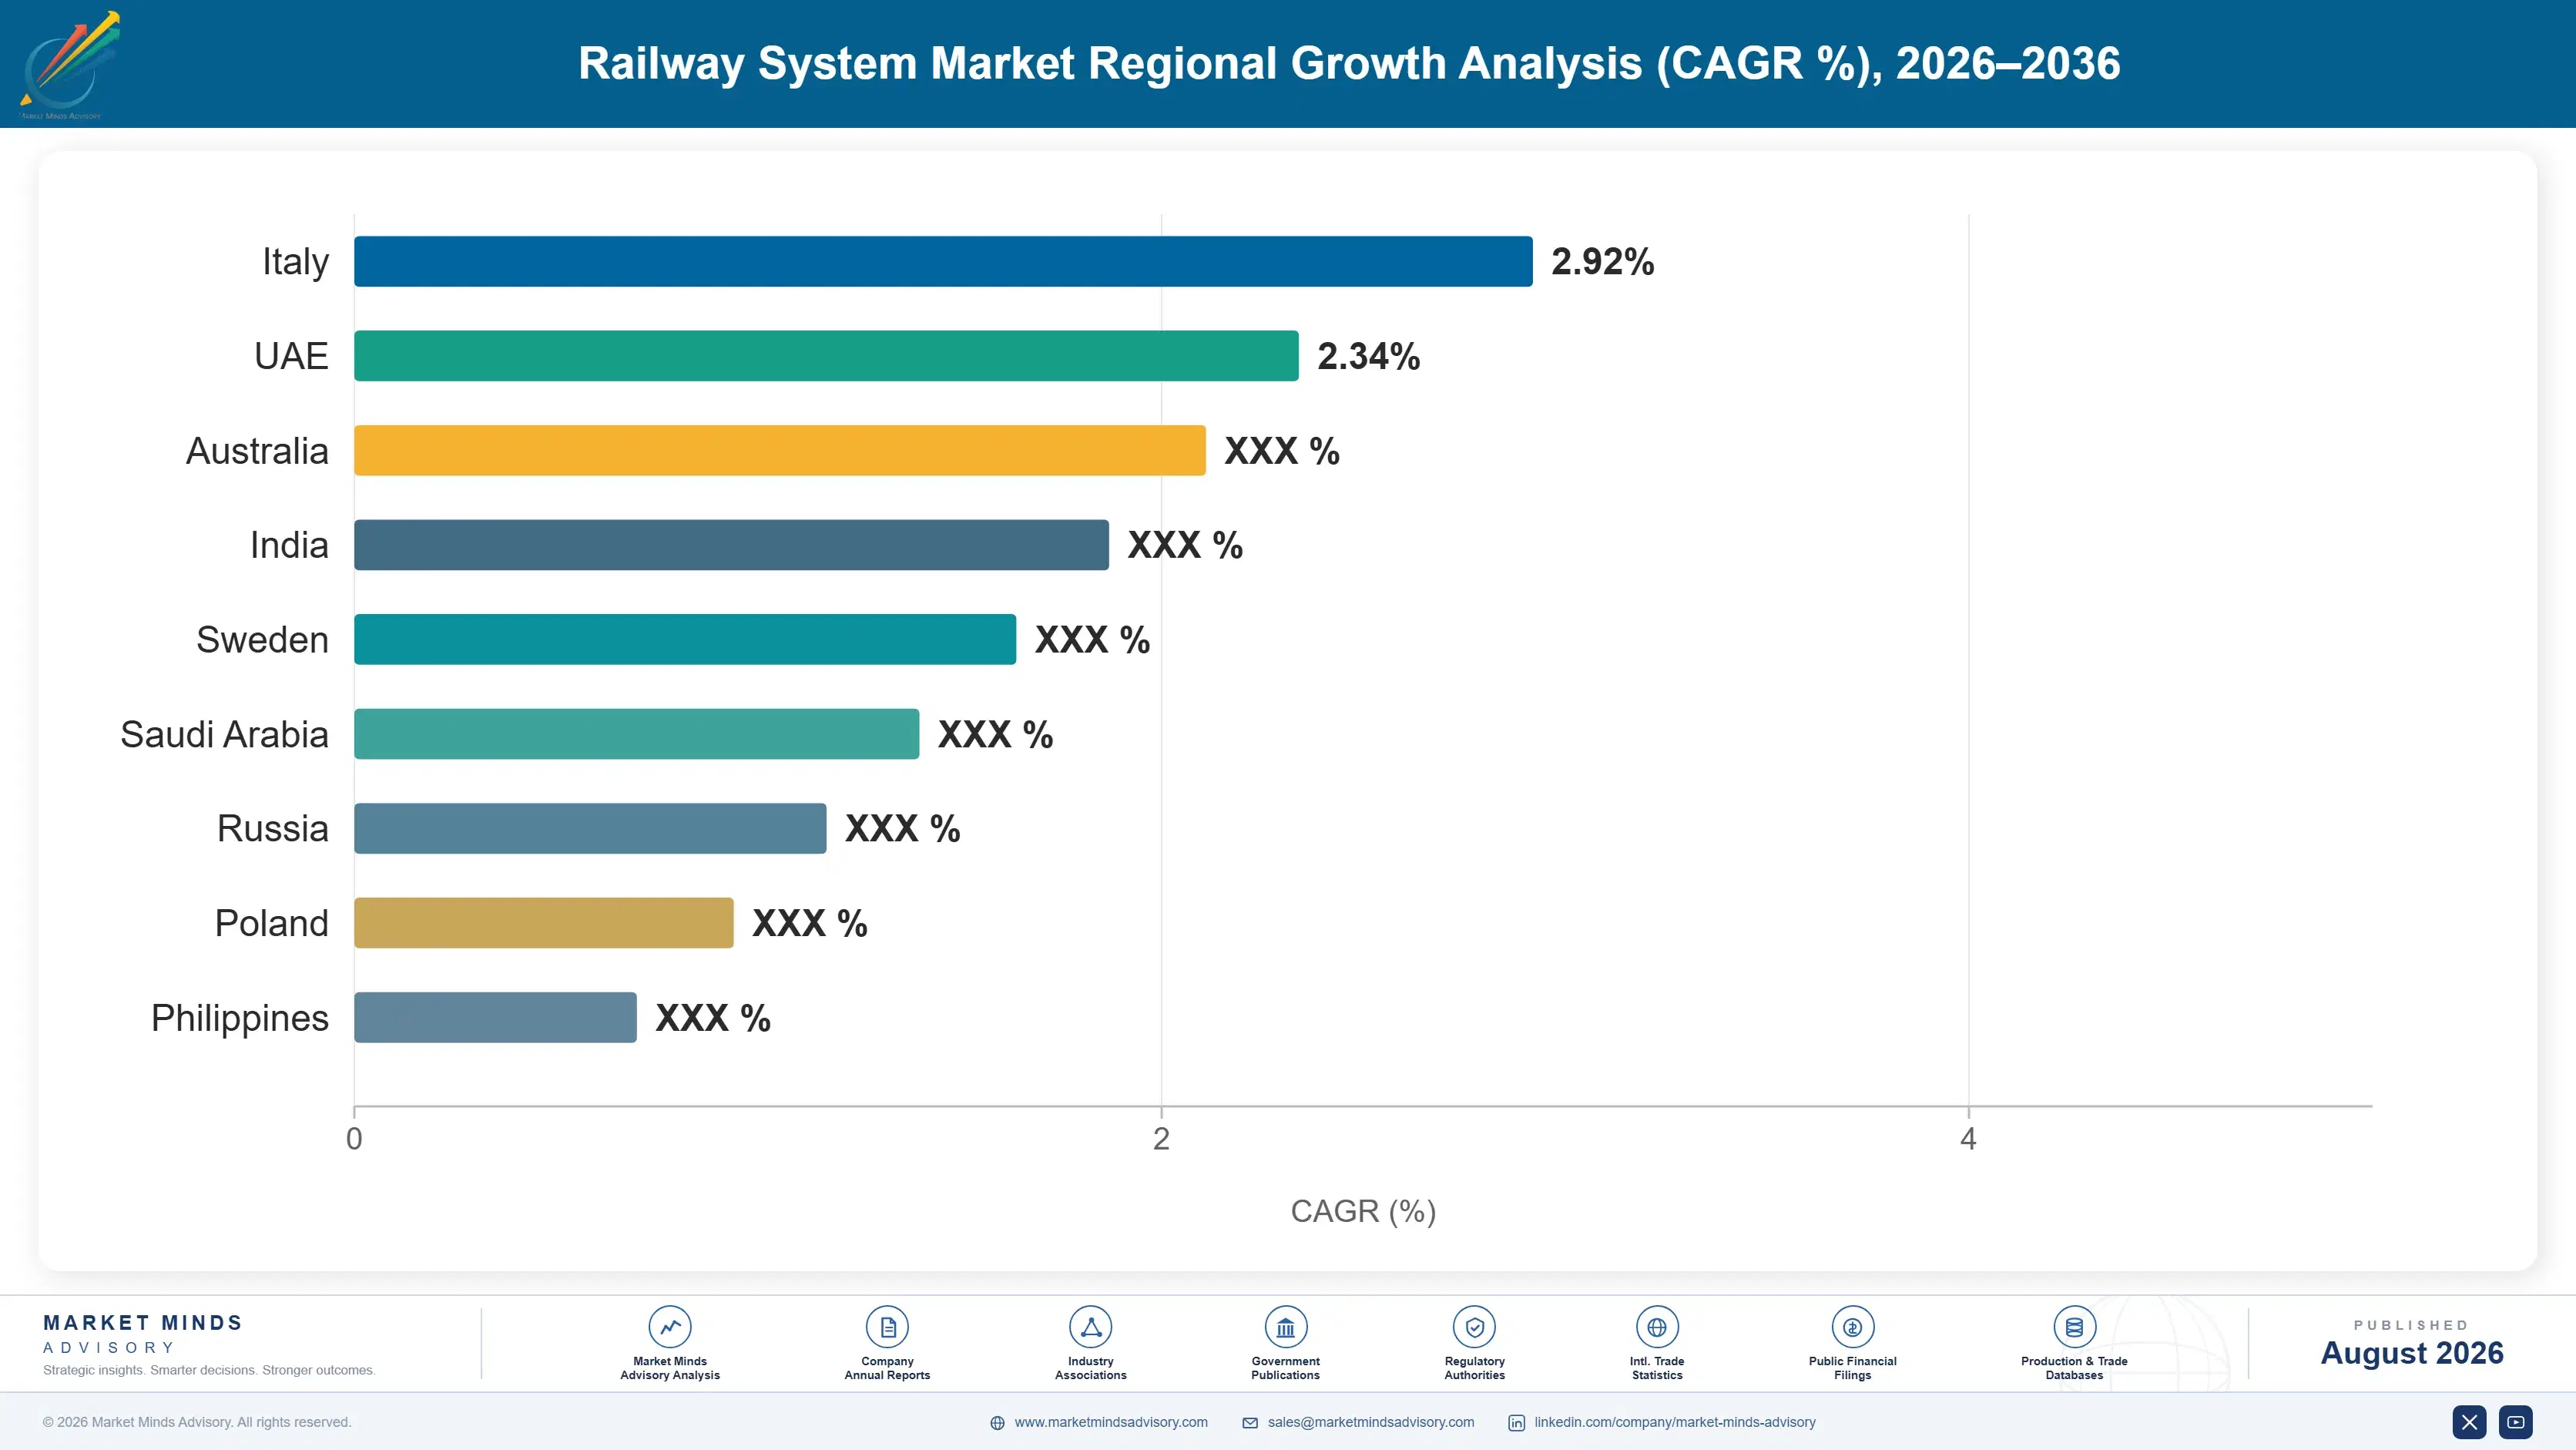
Regional Architecture and Country Demand Map

East Asia holds 34% of value on Chinese network investment and on urban construction volumes that no other region anywhere approaches. Western Europe follows at 22% on renewal rather than expansion, with North America at 15%, where freight rather than passenger investment dominates the spending.

North America

Share sits at 15% against a band of 22 to 32% because North American rail spending is dominated by privately funded freight investment rather than by the public passenger programmes that drive value elsewhere, and freight railroads renew conservatively against their own returns. Class I capital budgets favour track, locomotives and terminal capacity over signalling modernisation, with positive train control now installed and consuming little further spend. Urban transit programmes in a handful of cities provide the systems work, funded federally and delivered slowly. Growth at 3.8% reflects renewal spending rather than any network expansion. Availability contracting has barely reached the region at all. Freight railroads renew conservatively against their own returns rather than against any published network plan.
Share: 15% | CAGR: 3.8% (2026 to 2036)

Western Europe

European spending is renewal rather than expansion, with dense mature networks requiring continuous replacement of assets installed across the previous century. Train control migration to a common European standard is the largest single programme, running across national networks at different speeds and slipping consistently against published timetables. German and British renewal backlogs are substantial and politically visible. French and Italian high speed extension continues at a modest pace. Discontinuous electrification is being adopted quickly here, since clearance costs on old infrastructure are exactly what makes full schemes unaffordable. Growth of 3.2% runs below the base case. Service attachment is where group profitability now separates the suppliers here. Renewal backlogs are politically visible and chronically underfunded.
Share: 22% | CAGR: 3.2% (2026 to 2036)
Regional intelligence for 5 additional markets available in the complete report: East Asia, South Asia and Pacific, Latin America, Middle East and Africa, Eastern Europe. Contact sales@marketmindsadvisory.com.
railway-system-market-trends-growth-country-cagr-analysis-1787594746427

Four Moves Across a Thirty-Five Year Asset

Winning a vehicle contract on price and losing the thirty-five years behind it is the most expensive mistake available in this industry, and it is made regularly. Whole life spending runs near 3.2 times purchase value, and almost every commercial advantage worth holding sits somewhere in that multiple rather than in the original sale.

Price the vehicle to win the thirty-five years

Owners spend roughly 3.2 times purchase price across a 35 year life, and the manufacturer holding overhaul, spares and modification work earns across three decades from a position won once. Availability-based contracting deepens that further by transferring maintenance risk in exchange for a long revenue stream. Bidders optimising purchase price alone are competing for the smallest part of the opportunity, and they usually lose the rest of it to somebody who was thinking about the depot from the beginning. Depot presence and fleet data are what make the position defensible once it is won.
Market Impact: Captures 3.2 times the original vehicle purchase value

Build staged migration into train control architecture

Signalling rollouts slip an average of 38% on schedule because vehicle, trackside and rulebook must all change together, and safety approval cannot be accelerated by adding people to it. Architectures allowing partial operation during migration reduce that exposure materially and are worth a great deal to a network that has been burned before. Suppliers who can demonstrate staged delivery on a completed programme carry an argument competitors cannot answer with a promise, and signalling grows at 6.9% regardless. Networks that have lived through an overrun weigh evidence far above price.
Market Impact: Attacks a 38% average programme schedule overrun rate

Lead with discontinuous electrification on marginal routes

Wiring the straightforward sections and running battery vehicles across the gaps cuts infrastructure capital by around 44% on suitable routes, which brings lines into scope that could never justify a full scheme. That proposal requires traction power design and vehicle specification to be developed together rather than tendered apart. A supplier able to present the combined case reaches a decision that has not yet been framed as a procurement, which is a considerably better position than bidding into one. Framing the decision before it becomes a tender is the entire advantage here.
Market Impact: Removes 44% of the total scheme capital cost

Package complete systems for urban construction programmes

Asian and Gulf urban schemes procure vehicles, signalling, power, depot and station systems in single packages, and India grows fastest at 8.2% on more than a dozen simultaneous metro programmes. That structure rewards integrated suppliers and disadvantages domain specialists who must bid through a consortium leader taking margin above them. Building genuine integration capability, or a durable consortium position, decides access to the fastest growing pool of work available anywhere in this industry. Interface risk is what the customer is paying somebody to transfer. India runs more than a dozen simultaneous metro programmes on that basis.
Market Impact: Reaches 8.2% growth across the Indian systems pool

Who Controls the Margin Pool

Participation is measured on annual rail systems supply revenue, and the top five hold 41%. Concentration is moderate because scale players compete against a long tail of regional specialists in track, power and station systems who face no barrier at that level. CRRC leads on volume by a wide margin, building more rolling stock than every European manufacturer combined. The gap to Alstom and Siemens Mobility is domestic market scale rather than engineering capability.
Competition runs on three fronts. Integration capability decides access to turnkey urban programmes, which is where the fastest growth sits. Signalling approval and delivery record decide the highest risk work, since a network burned by an overrun weighs delivery evidence heavily. Whole life service position decides the durable revenue, since it accrues across 35 years rather than a single order.

Pressure ahead comes from Chinese export competition on price and financing terms, and from network funding cycles that defer European and North American renewal repeatedly. The European Commission blocked the Siemens and Alstom merger in 2019 on competition grounds, after which Alstom acquired Bombardier Transportation. Rankings shift as Indian manufacture matures and as availability contracting spreads.
railway-system-market-trends-growth-company-positioning-matrix-1787594746946

Competitive Moat and Risk Dimensions

CRRC

Moat: Domestic scale beyond comparison

The company supplies a home market whose railway investment exceeds any other in the world, which gives it production volumes, unit costs and engineering iteration rates no competitor can approach from a smaller base. That scale converts directly into export competitiveness on price, and increasingly into financing terms that accompany the equipment offer.
CRRC

Risk: Restricted market access abroad

Security and procurement restrictions in North America, and increasing scrutiny in Europe and India, close markets that scale alone cannot open. Domestic investment growth is also maturing after two decades of expansion, which means the base supporting that cost advantage is no longer growing at the rate that built it.
ALSTOM

Moat: Signalling and integration breadth

Alstom carries capability across rolling stock, signalling, infrastructure and services, which lets it lead turnkey urban programmes rather than bidding beneath a consortium leader taking margin above it. The Bombardier Transportation acquisition in 2021 deepened that position considerably, particularly in installed fleet and the service revenue attached to it.
ALSTOM

Risk: Programme delivery risk concentration

Leading turnkey programmes means owning integration risk on rollouts that slip an average of 38% on schedule, where safety approval cannot be accelerated by adding resources. A single large signalling overrun consumes margin across an otherwise healthy portfolio, and the exposure grows with every integrated programme won.

Players Tracked

Prominent Players

CRRC
Alstom
Siemens Mobility
Hitachi Rail
Wabtec

Other Key Players

Stadler Rail
Knorr-Bremse
Talgo
CAF
Hyundai Rotem
Kawasaki Heavy Industries
Nippon Sharyo
Progress Rail
Vossloh
Pandrol
voestalpine Railway Systems
Mitsubishi Electric
Toshiba Infrastructure Systems
Titagarh Rail Systems
BEML

Recent Developments

MARCH 2026

European network defers train control migration milestone by three years

A Western European infrastructure manager deferred a major train control migration milestone by three years, citing vehicle fitment progress and safety approval throughput rather than any trackside delivery problem. Contracted supply volumes were rescheduled rather than reduced across the affected programme. Vehicle fitment progress remains the binding constraint.
Signal: Approval throughput rather than manufacturing capacity actually sets the pace of any train control migration programme
SEPTEMBER 2025

Indian metro programme awards complete systems package to single consortium

An Indian metro authority awarded vehicles, signalling, traction power and depot systems as a single package to one consortium, rather than tendering the domains separately as earlier phases had done. The structure was chosen to reduce interface risk across the delivery programme. Earlier phases had tendered each domain separately.
Signal: Turnkey packaging is now spreading across urban programmes, which advantages integrators over specialists in every domain
JANUARY 2026

Operator adopts discontinuous electrification with battery units on regional route

A European operator adopted a discontinuous electrification scheme on a regional route, wiring straightforward sections and running battery units across tunnels and bridge clearances that would have dominated a full scheme cost. Infrastructure capital fell substantially against the fully wired alternative. Battery range across the gaps set the design.
Signal: Avoiding clearance work rather than saving overhead wire is what makes any discontinuous scheme viable financially

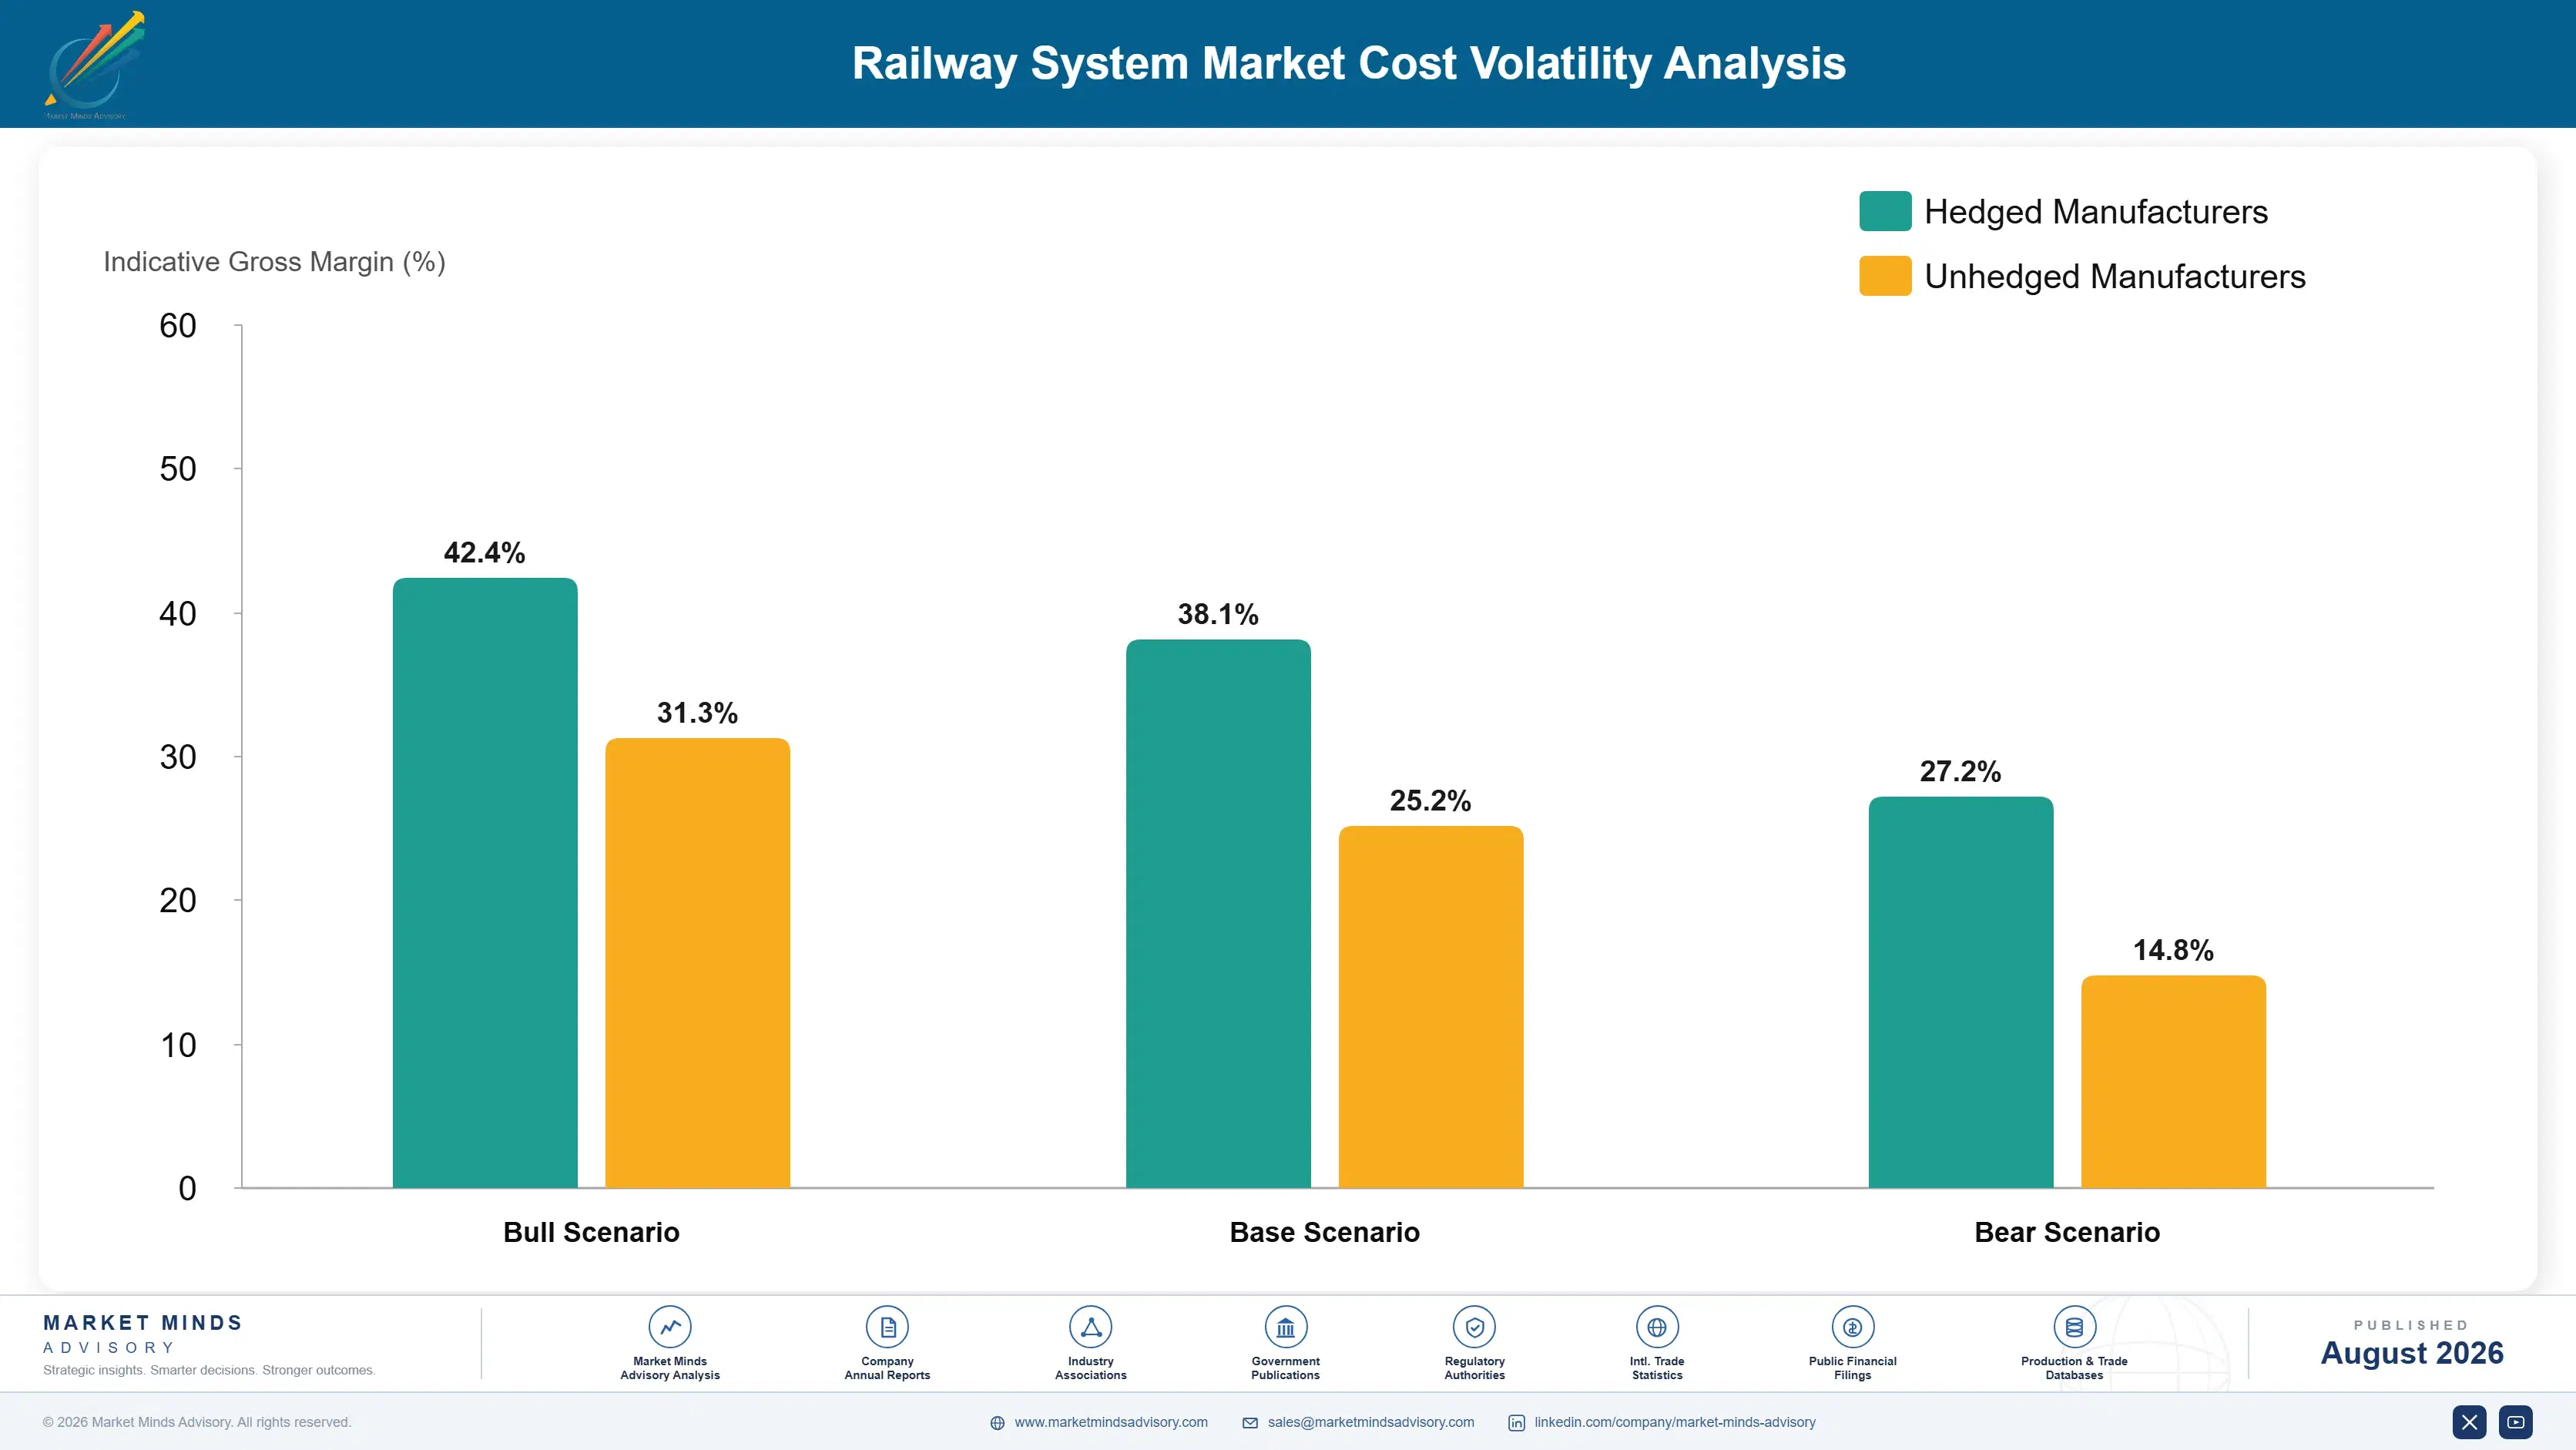
Steel, Copper and Skilled Hours

Bought-in components and subsystems account for roughly 46% of rolling stock cost, covering traction equipment, bogies, braking and interiors from a specialised supplier base. Steel and aluminium carry about 14%, copper in traction and electrification work around 9%, and skilled labour hours take approximately 22% across manufacturing, commissioning and safety engineering. Site establishment and logistics absorb the balance on infrastructure programmes.
European steel and energy prices rose sharply through 2022, per European Commission market monitoring for the period, while copper moved separately on demand across electrification and power sectors generally. Suppliers holding fixed-price programme contracts running several years absorbed most of it, since rail contracts index less readily than construction contracts do. Skilled signalling engineering capacity has been the binding constraint throughout, and it cannot be bought at any price quickly.

Exposure divides on contract structure and on domain. Rolling stock programmes running five to seven years at fixed price carry the heaviest material exposure, while service contracts reprice more readily and infrastructure work is usually indexed. Signalling suppliers face labour rather than material exposure, since safety engineering hours dominate their cost base and the available pool of approved engineers grows slowly regardless of demand.
railway-system-market-trends-growth-cost-volatility-analysis-1787594747141

Index long programme contracts to published material references

Rolling stock programmes run five to seven years at prices agreed at bid, which guarantees exposure whenever steel, aluminium or copper moves against the supplier. Indexing to published references passes movement through with a defined lag. Public authorities resist indexation more than commercial operators do, which makes it a negotiating priority rather than a formality on public work.

Grow approved signalling engineering capacity years ahead of demand

Safety engineering hours dominate signalling cost and the pool of approved engineers grows slowly whatever the demand looks like. Training and approval take years, so capacity has to be built well before the programmes needing it are won. Suppliers treating this as a recruitment problem rather than a multi-year capability programme consistently find themselves bidding work they cannot resource.

Weight the portfolio toward service revenue across the asset life

Whole life spending runs near 3.2 times vehicle purchase price and service contracts reprice far more readily than fixed-price manufacturing programmes do. Shifting portfolio weight toward that revenue reduces material exposure and smooths the order intake cycle at once. Depot presence and fleet data are what make the position defensible against a maintenance specialist bidding on labour rates.

Portfolio Architecture for Margin Defence

Margin here separates by risk ownership rather than by technical content, which is not what most people expect. Vehicle manufacturing and civil infrastructure work earn margins in the mid to high single digits, because both are tendered competitively at fixed price across long programmes where a single specification change can consume the entire expected return.
Signalling, traction power and station systems do considerably better in the low to high teens, because approval barriers limit the bidder field and the engineering content is difficult to price down. The range reflects delivery record above all, since a network that has been burned by an overrun weighs demonstrated performance heavily against a lower number from somebody unproven. A lower number from an unproven bidder is worth considerably less than it looks.

Whole life services and availability contracting hold the strongest position, reaching into the mid twenties, because they run across 35 years from a position won once and reprice as costs move. Those margins reflect depot presence, fleet data and switching costs an operator will not incur for a marginal saving on labour rates. An operator will not incur those switching costs for a marginal saving on labour rates.

Vehicle Manufacture and Civil Infrastructure

Rolling stock build and track and civil works tendered at fixed price on long programmes. The six point range reflects programme risk management rather than product difference, since specification is set by the customer throughout.
Gross Margin: 5-11%

Signalling, Power and Station Systems

Train control, traction power and station systems where approval barriers limit the bidder field. The seven point range reflects delivery record, which networks weigh heavily after any experience of a programme overrun.
Gross Margin: 12-19%

Whole Life Services and Availability Contracts

Overhaul, spares, modification and availability-based fleet agreements across the asset life. The nine point range reflects depot presence and fleet data depth rather than any difference in the work performed.
Gross Margin: 17-26%
railway-system-market-trends-growth-portfolio-architecture-1787594747642

High-value Sub-segments and Strategic Watch-out

Availability-Based Fleet Contracts

High value and growing, since whole life spending runs near 3.2 times purchase price and these agreements capture it from a position won once. Depot presence and fleet data make the position defensible against maintenance specialists bidding labour rates. Two of the largest markets are adopting the structure now.
Gross Margin: 19-26%

Train Control Migration Programmes

High value and the fastest growth at 6.9%, driven by obsolescence rather than ambition. Delivery record matters more than price here, since programmes slip an average of 38% and networks weigh demonstrated performance accordingly. Obsolescence rather than ambition funds it, which makes the spending far less discretionary.
Gross Margin: 13-19%

Rolling Stock Manufacture

The volume core, tendered at fixed price across programmes running five to seven years where a single specification change can consume the return. Purchase price scoring rewards minimum compliant cost over lifetime performance. A single specification change can consume the whole expected return. Lifetime performance goes unrewarded.
Gross Margin: 5-11%

Turnkey Urban Programme Delivery

The strategic watch-out. Integration carries the fastest growing work and the heaviest risk together, and the fourteen point range reflects the gap between suppliers who manage interface risk well and those who discover it late. Interface risk is what the customer pays to transfer. Pricing it correctly is the discipline.
Gross Margin: 8-22%

Won Once, Earned for Decades

Almost everything durable in this industry is an annuity dressed as a project. A vehicle contract awarded once produces overhaul, spares and modification revenue for 35 years, and an infrastructure asset installed once generates renewal work on cycles nobody can defer indefinitely. Order intake swings violently with government funding while the revenue attached to installed assets barely moves, which is why supplier valuations track service backlog rather than new orders.
Stickiness varies sharply with how deeply the supplier sits inside the asset. A manufacturer holding depot presence and fleet condition data is extremely difficult to displace, since an alternative maintainer starts without either. Signalling positions are stickier still, because requalifying a train control interface against safety approval is work no network undertakes for a commercial saving. Component supply switches far more readily at every renewal.

The buying authority has been shifting toward whole life thinking, slowly and unevenly. Public procurement still weights purchase price heavily because it is auditable in a way a lifecycle forecast is not. Availability contracting is the mechanism moving that, transferring risk to the supplier and forcing both sides to price 35 years rather than one delivery, and it remains a minority of procurements worldwide.
railway-system-market-trends-growth-end-use-penetration-index-1787594748131

Where We Would Focus Effort

These are among the four positions where our research anticipates prominent divergence between winners and laggards over the coming forecast period. Each is grounded in the demand model, the regulatory perimeter, and the announced capacity pipeline.
01 / WHOLE LIFE POSITIONING

The vehicle contract is a ticket, not the prize

Owners spend roughly 3.2 times purchase price across a 35 year vehicle life through overhaul, spares, modification and eventual life extension work. A manufacturer holding those contracts earns for three decades from a position won once, on revenue considerably steadier than order intake that swings with government funding cycles. Bidders optimising purchase price alone compete for the smallest part of the opportunity and usually surrender the rest to somebody who was thinking about the depot from the very start of the bid.
02 / MIGRATION RISK DESIGN

Staged delivery answers the fear networks actually have

Train control rollouts slip an average of 38% on schedule because vehicle, trackside and operating rulebook must change together, and safety approval cannot be accelerated by adding more people to the problem. Architectures allowing partial operation during migration reduce that exposure materially and matter enormously to a network that has already been burned once before. A supplier demonstrating staged delivery on a completed programme carries an argument that competitors simply cannot answer with a promise, however confidently it is made.
03 / ELECTRIFICATION CASE FRAMING

Sell the route that could not be wired

Clearance work under bridges and through tunnels dominates the cost of full electrification, which is precisely why marginal routes never qualify for a scheme. Wiring the straightforward sections and running battery vehicles across the gaps cuts infrastructure capital by around 44% and brings those routes into scope for the first time. Presenting that combined traction power and vehicle case reaches a decision before it has been framed as a procurement, which beats bidding into one that somebody else has already shaped.
04 / SYSTEMS INTEGRATION CAPABILITY

Turnkey packaging decides who reaches Asian growth

Asian and Gulf urban programmes increasingly procure vehicles, signalling, power, depot and station systems as single packages, and India grows fastest anywhere at 8.2% across more than a dozen simultaneous metro programmes running at once. That structure rewards integrators and pushes domain specialists beneath a consortium leader taking margin above them for managing interfaces. Building genuine integration capability, or securing a durable consortium position, decides access to the fastest growing pool of work available anywhere in the entire industry today.

Engagement Snapshot From the Field

A live engagement with an industry participant carrying material or product regulatory and market exposure ahead of a defining policy shift, showing how our research translates into a defensible multi-year portfolio strategy.
MARKET MINDS ADVISORY · CLIENT ENGAGEMENT SUMMARY
Railway System Producer Strategic Portfolio Review and Transition Roadmap 2026·Investment Scenario on Railway System Exposure Evaluation 2025-26
CLIENT PROFILE
A European rolling stock manufacturer supplying regional and suburban vehicles across four national markets, with annual revenue near 1.6 billion euros (client-reported, unverified by MMA). Roughly ninety percent of revenue came from vehicle manufacture won on competitive tender, with maintenance work subcontracted away at handover and no depot presence retained anywhere in the four markets it served.
STRATEGIC CHALLENGE
Manufacturing margins had compressed across three consecutive programmes while a competitor with similar build volumes reported considerably higher group profitability on comparable revenue. Management suspected the difference sat in service attachment but had no basis to quantify it, and the board wanted to know whether entering maintenance was realistic this late.
MMA APPROACH
MMA modelled whole life spending across the client's installed fleet against purchase values, benchmarked competitor service attachment rates and margins, assessed availability contracting adoption across the client's four markets, and costed depot capability entry against the fleets already in service. Interviews with 47 experts covered rail procurement, fleet maintenance and availability contracting.
KEY FINDINGS
  1. Whole life spending across the client's installed fleet exceeded original purchase value by more than three times, and none of that revenue was reaching the client at all.
  2. The competitor's higher group profitability was almost entirely attributable to service attachment rather than to any advantage in manufacturing cost or programme execution.
  3. Two of the client's four markets were adopting availability contracting on new procurements, which would foreclose subcontracted maintenance entry within roughly five years.
  4. Depot capability entry was viable on the client's own installed fleet, where vehicle knowledge gave a genuine advantage, but not as a general maintenance contractor competing on labour rates.
CLIENT PROFILE
A European rolling stock manufacturer supplying regional and suburban vehicles across four national markets, with annual revenue near 1.6 billion euros (client-reported, unverified by MMA). Roughly ninety percent of revenue came from vehicle manufacture won on competitive tender, with maintenance work subcontracted away at handover and no depot presence retained anywhere in the four markets it served.
STRATEGIC CHALLENGE
Manufacturing margins had compressed across three consecutive programmes while a competitor with similar build volumes reported considerably higher group profitability on comparable revenue. Management suspected the difference sat in service attachment but had no basis to quantify it, and the board wanted to know whether entering maintenance was realistic this late.
MMA APPROACH
MMA modelled whole life spending across the client's installed fleet against purchase values, benchmarked competitor service attachment rates and margins, assessed availability contracting adoption across the client's four markets, and costed depot capability entry against the fleets already in service. Interviews with 47 experts covered rail procurement, fleet maintenance and availability contracting.
KEY FINDINGS
  1. Whole life spending across the client's installed fleet exceeded original purchase value by more than three times, and none of that revenue was reaching the client at all.
  2. The competitor's higher group profitability was almost entirely attributable to service attachment rather than to any advantage in manufacturing cost or programme execution.
  3. Two of the client's four markets were adopting availability contracting on new procurements, which would foreclose subcontracted maintenance entry within roughly five years.
  4. Depot capability entry was viable on the client's own installed fleet, where vehicle knowledge gave a genuine advantage, but not as a general maintenance contractor competing on labour rates.
RECOMMENDED STRATEGY
Phase 1: Phase one: establish depot capability on the client's own installed fleet, where product knowledge provides advantage a general maintenance contractor cannot match. Phase 2: Phase two: bid availability-based contracts in the two markets adopting them, before the structure forecloses entry to manufacturers without depot presence. Phase 3: Phase three: reprice future vehicle tenders on the assumption that service revenue follows, rather than treating each build as a standalone return.
OUTCOME
The manufacturer opened depot operations serving two of its own fleets during 2026 and won a first availability-based contract on a regional network (client-reported, unverified by MMA). Vehicle tender pricing was restructured around expected service attachment, and one further programme was won on that basis.

Frequently Asked Questions

Foundational context covering the market sizes, CAGR, scope, country, region and competition that inform every finding below. This section is provided to cover basics and most often pre-purchase conversations, answered from the MMA Primary Research Dataset.

What is the current size of the Railway System Market?

MMA sizes it at USD 236.0 billion in 2025, rising to USD 246.86 billion in 2026. The figure covers rail systems supply across vehicles, infrastructure, signalling, power and station systems at supplier selling value.

How large will the Railway System Market be by 2036?

USD 387.03 billion by 2036, an incremental USD 140.17 billion over the 2026 base and an expansion multiple of 1.57 times. Signalling accounts for a disproportionate share of that growth.

What is the CAGR for the Railway System Market 2026 to 2036?

4.6% in the base case, with a bull case at 5.8% and a bear case at 3.4%. The spread turns on European renewal funding and on train control programme delivery.

Which segment is growing fastest?

Signalling and train control systems at 6.9%, half again the market rate of 4.6%. Renewal runs on obsolescence rather than ambition, which makes the spending far less discretionary.

Who are the major companies in the Railway System Market?

CRRC, Alstom, Siemens Mobility, Hitachi Rail and Wabtec lead on annual rail systems supply revenue. Fifteen further participants are profiled in the full report on that same basis.

Which country is growing fastest?

India at 8.2%, combining dedicated freight corridor construction, national train control rollout, station redevelopment and metro building across more than a dozen cities at once.

Report Segmentation Architecture

The full report scope spans multiple orthogonal segmentation dimensions, with cross-tabulated demand data provided for each dimension pair. Coverage extends further to regional breakdowns, trend trajectories, and the competitive detail needed to support segment-level decision-making.

By Railway System Domain

  • Rolling Stock Systems
  • Track and Civil Infrastructure
  • Signalling and Train Control Systems
  • Electrification and Traction Power
  • Station and Depot Systems
  • Rail Telecommunications and Passenger Information

By End-Use Industry

  • Main Line Passenger Networks
  • Freight and Heavy Haul Railways
  • High Speed Rail Networks
  • Metro and Urban Transit
  • Light Rail and Tram Systems
  • Industrial and Mining Railways

By Commercial Dimension

  • Turnkey Systems Packages
  • Domain-Specific Supply Contracts
  • Availability-Based Service Agreements
  • Overhaul and Modification Programmes
  • Spares and Component Supply
  • Export and Financed Project Supply

By Region

  • North America
  • Western Europe
  • East Asia
  • South Asia and Pacific
  • Latin America
  • Middle East and Africa
  • Eastern Europe

Scope, Methodology, and Coverage

Every figure in this report is reproducible from documented input assumptions. The scope below maps the historical period, the forecast horizon, the segmentation dimensions, and the countries covered, alongside the underlying primary and qualitative methodology.
Historical Period
2020 to 2025
Forecast Period
2026 to 2036
Base Year
2025 (USD billions; MMA Primary Research Dataset, August 2026)
Market Definition
Supply of railway systems across rolling stock, track and civil infrastructure, signalling and train control, electrification and traction power, station and depot systems, and rail telecommunications and passenger information, measured at supplier selling value including associated engineering, commissioning and lifecycle service work. Railway operating revenue, land acquisition, freight forwarding, urban bus and trolleybus systems, and infrastructure not dedicated to rail are excluded from scope.
Quantitative Units
USD billions (current prices); thousand vehicles delivered; USD per route kilometre by system domain
Segmentation Dimensions
Railway system domain; end-use network type; commercial dimension; region
Regions Covered
North America, Western Europe, East Asia, South Asia and Pacific, Latin America, Middle East and Africa, Eastern Europe
Countries Covered
China, Japan, South Korea, India, Indonesia, Vietnam, Australia, United States, Canada, Mexico, Germany, France, United Kingdom, Italy, Spain, Poland, Romania, Saudi Arabia, United Arab Emirates, Brazil
Key Companies Profiled
CRRC, Alstom, Siemens Mobility, Hitachi Rail, Wabtec, Stadler Rail, Knorr-Bremse, Talgo, CAF, Hyundai Rotem, Kawasaki Heavy Industries, Nippon Sharyo, Progress Rail, Vossloh, Pandrol, voestalpine Railway Systems, Mitsubishi Electric, Toshiba Infrastructure Systems, Titagarh Rail Systems, BEML
Quantitative Methodology
Primary survey, n=3,800 respondents, Q4 2025, six countries; demand-side model with trade association cross-validation
Qualitative Methodology
47 expert interviews, Q4 2025; applied to validate demand model assumptions, identify emerging dynamics, and assess competitive positioning
Report Format
PDF and XLSX data workbook (Word format preview document)
Publisher
Market Minds Advisory
Report Code
MMA-2026-CON-112
Published
August 2026
Contact
sales@marketmindsadvisory.com | www.marketmindsadvisory.com

Purchase the full Railway System Market Report (2026 to 2036).

The full report sizes the industry across its whole life rather than at the point of sale, quantifying service attachment against purchase value and showing where group profitability actually originates. It sizes all six system domains independently through 2036, models train control migration schedules against observed overrun rates, and assesses discontinuous electrification economics against full scheme alternatives at route level. Regional chapters cover all seven regions with funding cycle and programme pipeline detail wherever authorities publish it. Competitive profiling covers 20 participants on a single supply revenue basis.
Six system domains sized independently through 2036
Service attachment quantified against original purchase value
Train control schedules modelled against observed overrun rates
Discontinuous electrification economics compared with full schemes
Twenty participants profiled on one consistent revenue basis
Funding cycles mapped across every major network programme

Built For The People Who Decide

From boardroom strategy to bench-side execution, this report is read cover-to-cover by leaders shaping the next decade of their industry, turning demand scenarios, market dynamics and valuation benchmarks into decisions.
CXOs/ Presidents/ VPs/ Managers
M&A and Corporate Development
Strategy Teams and R&D Heads
Procurement and Product Directors
Regulatory and Compliance Leaders
Investor Relations and Equity Analysts