Market Minds Advisory
Railway Rolling Stock Market

Railway Rolling Stock Market: Electrification and High-Speed Trainsets Redraw Fleet Investment

Electrification mandates and high-speed rail expansion across China and Europe are converting fleet-replacement specification toward higher-value trainsets, as freight operators weigh digitalization investment against aging locomotive fleets nearing multi-decade retirement across major established networks worldwide.

Lead Analyst

David Horsley

Published

September 2026

Make Smarter Decisions with Customized Research Insights

Request a free sample report and evaluate market opportunities, growth trends, and competitive dynamics relevant to your business needs.

2025 MARKET VALUE$62.0BMarket Size 2025
2036 FORECAST VALUE$141.6BBase Case , 2026 to 2036
CAGR 2026 TO 20367.8 %Bull 9.1% / Bear 6.5%
INCREMENTAL OPPORTUNITY$74.8BNet 10- year value creation
EXPANSION MULTIPLE2.12x2036 value over 2026 base
Strategic Levers
M&A Pipeline
Regional Outlook
Country Rankings
Competitive Intelligence
Segmental Deep-dive
Call-Us : 91 93563 13602

Executive Snapshot and Market Trajectory

Railway rolling stock demand is converting from diesel-default fleet replacement toward electrified and high-speed trainsets as national rail operators pursue decarbonization targets and faster corridor speeds. Manufacturers with validated high-speed platform experience are capturing disproportionate share of major tender awards. Diesel-only suppliers face mounting pressure to electrify their product lines.
China's high-speed rail expansion and India's network electrification program anchor the fastest-growing demand pools, while European national operators sustain the largest steady electrified-fleet renewal base of any established market tracked. High-speed trainsets and metro transit vehicles lead growth as operators seek faster corridor speeds and urban capacity than legacy diesel fleets can deliver. Freight wagon demand grows steadily but trails passenger segments as digitalization investment concentrates elsewhere across most networks.
Competitive character remains highly concentrated among a handful of global rolling stock manufacturers, evaluated on annual delivered unit capacity and installed fleet share combined. CRRC and Alstom lead on manufacturing breadth, separated from smaller challengers, including Siemens Mobility and Stadler, each strong in specific vehicle categories rather than universally. Regulatory certification requirements under national rail-safety and interoperability standards favor suppliers with proven cross-border platform validation history over newer entrants lacking extended field data nationwide overall.
Market Definition
The railway rolling stock market covers locomotives, passenger railcars and coaches, high-speed trainsets, freight wagons, metro and urban transit vehicles, and specialized maintenance-of-way vehicles sold to national rail operators, transit agencies, and freight railroads for new fleet construction and replacement. It excludes fixed infrastructure such as track, signaling systems, and station facilities, and standalone component sales not delivered as part of a complete vehicle order.
Base Year Value
$62.0B in 2025 (MMA Primary Research Dataset, August 2026)
Forecast Period
2026 to 2036, eleven discrete annual values
CAGR
7.8% base case. Bull 9.1%. Bear 6.5%.
Fastest Growth Segment
High-Speed Trainsets: 13.6% CAGR
Fastest Growth Country
India: 11.2% CAGR
Fastest Growth Region
South Asia and Pacific: 9.8% CAGR
Largest Region
East Asia: 34% of 2025 global value
Market Leaders
CRRC Corporation Limited, Alstom SA, Siemens Mobility, Stadler Rail AG, Hitachi Rail. Source: MMA Analysis based on company annual reports.
Primary Survey
n=3,800 procurement and R&D decision-makers, Q4 2025, six countries
Methodology
Demand-side build-up, cross-validated against public data, 47 expert interviews

Railway Rolling Stock Market Forecast Scenarios

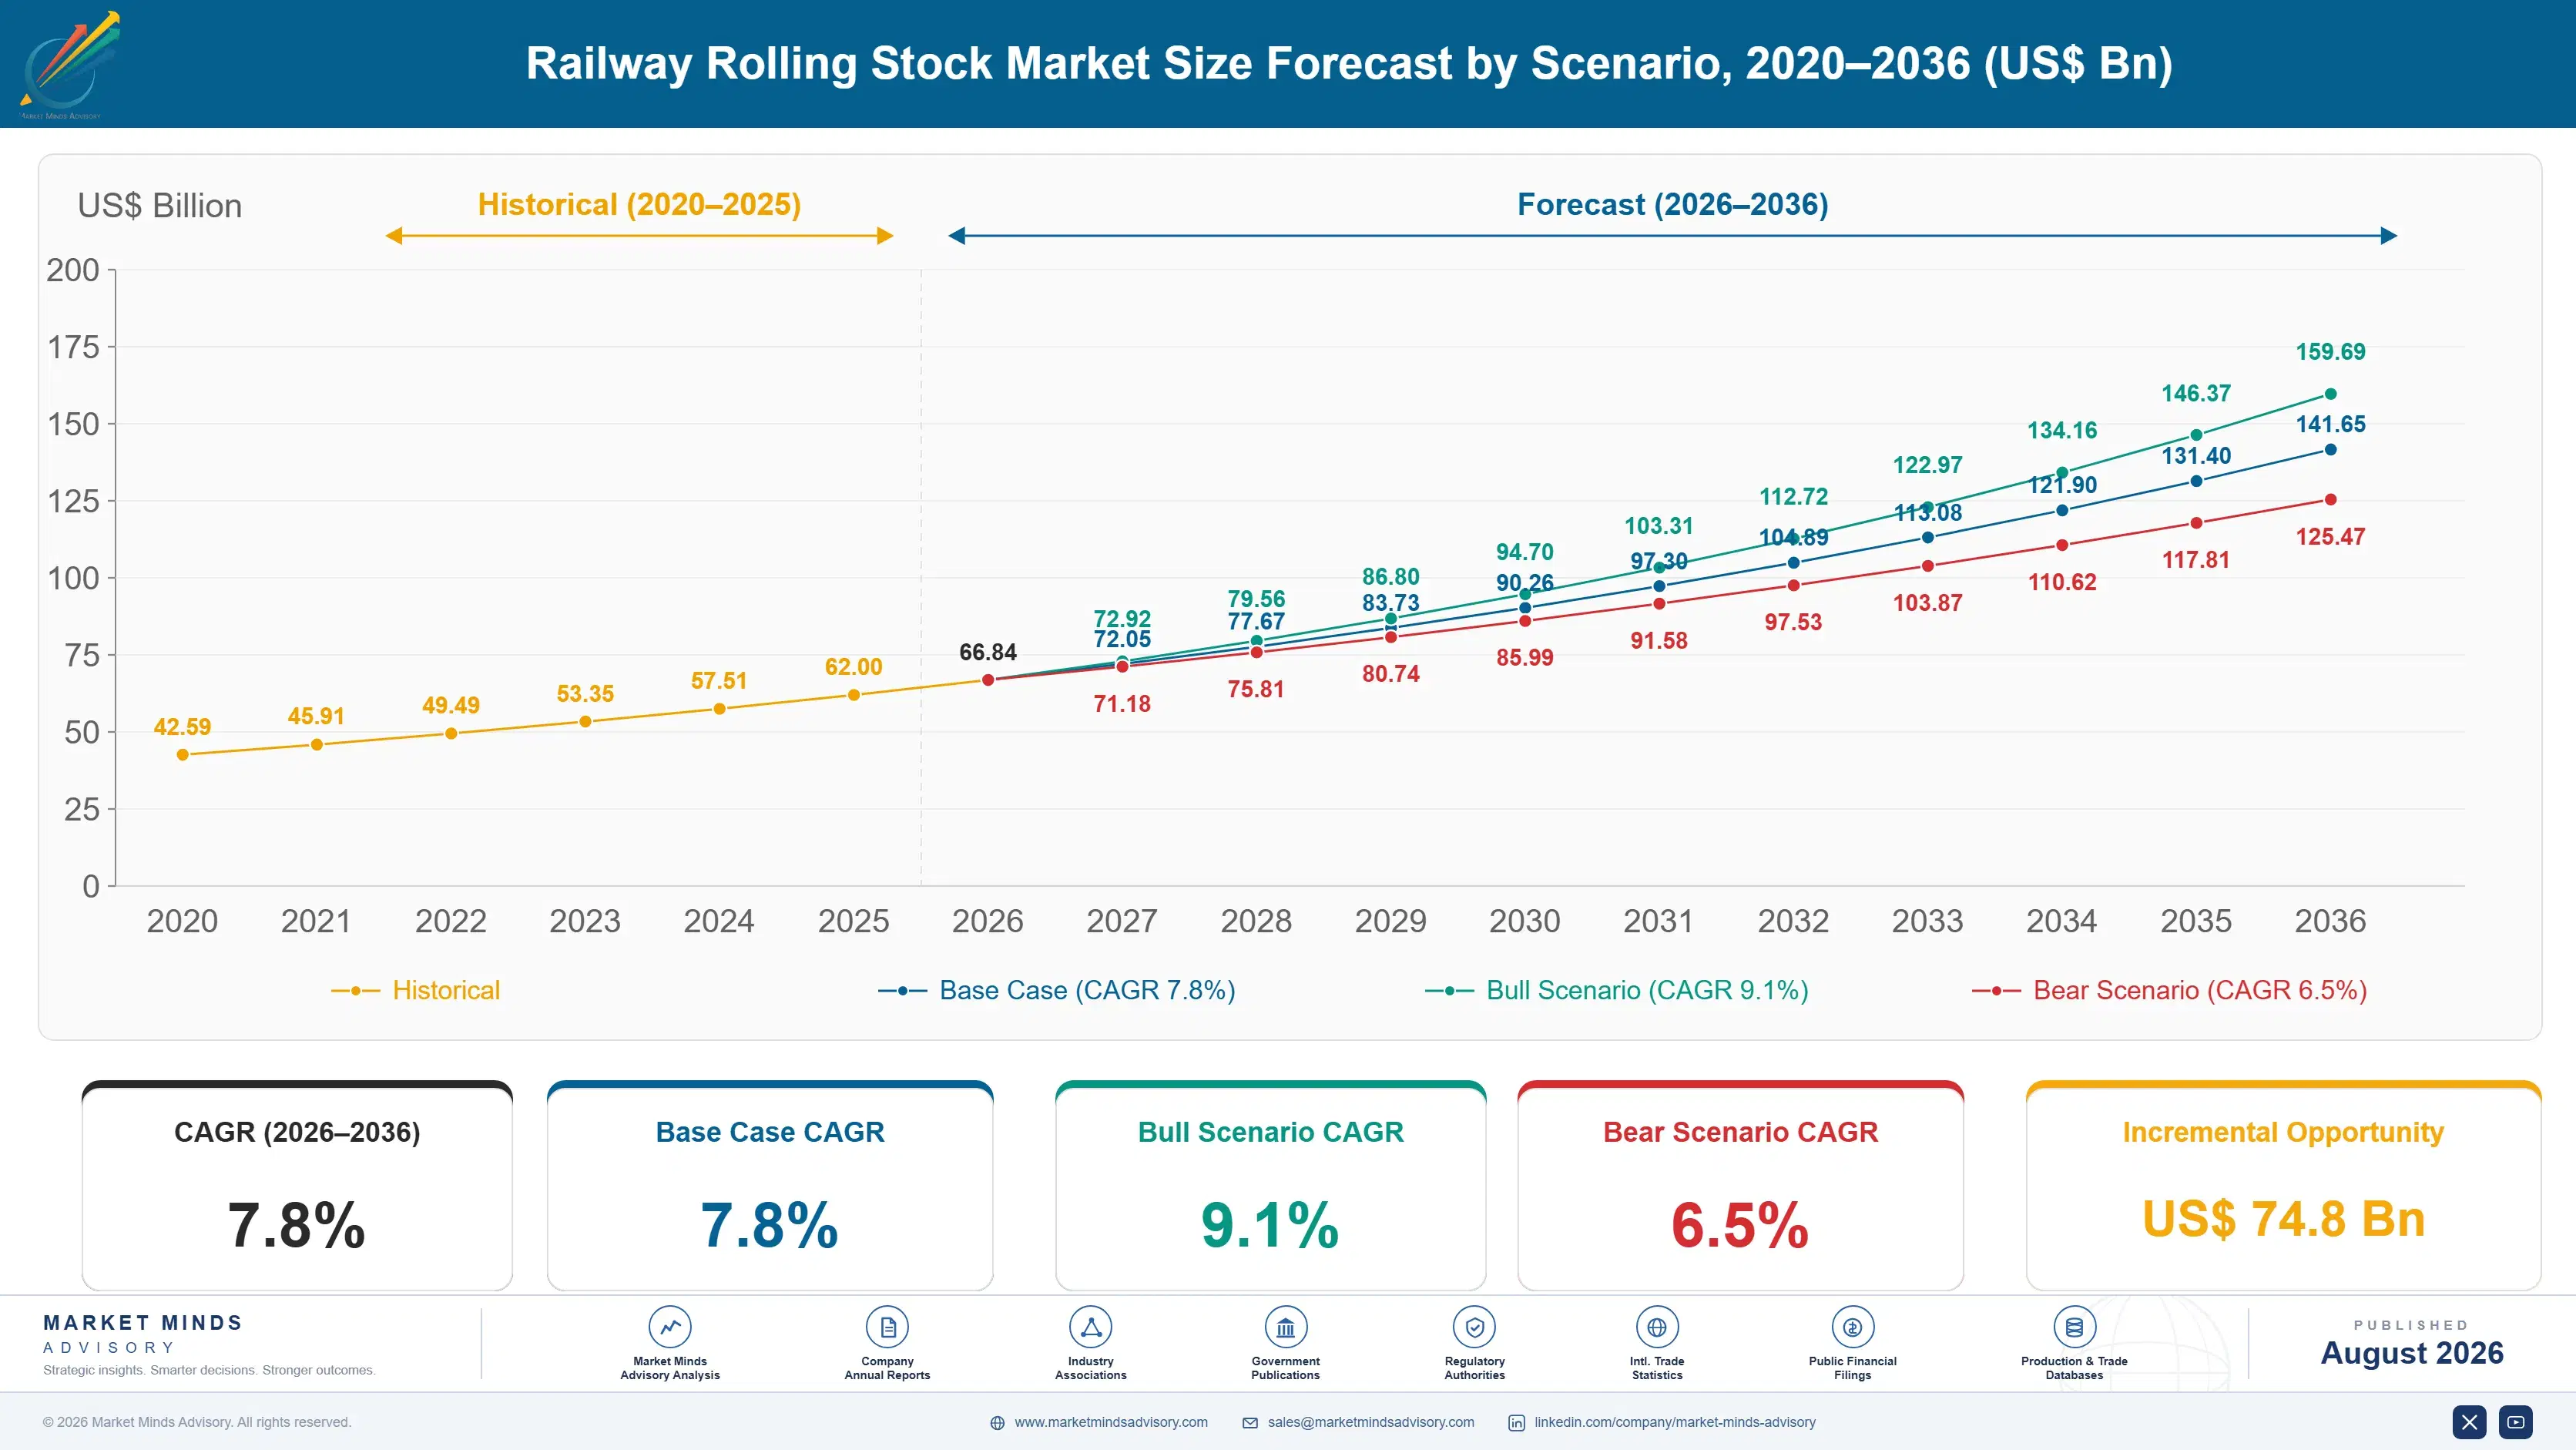
railway-rolling-stock-market-size-forecast-scenario-1787316813428
Rolling stock demand grew unevenly between 2020 and 2025. Pandemic-era fleet-order delays briefly slowed manufacturing volume through 2021, then expanding high-speed rail investment across China and accelerating electrification mandates across Europe rebuilt momentum through 2023 and 2024. That rebound lifted the historical growth rate to an estimated 6.9% compound annual rate. Growth remained resilient across most established passenger-fleet programs.
The base case assumes 7.8% annual growth through 2036, anchored on three mechanisms. First, national decarbonization mandates across Europe and Asia keep pulling fleet-replacement specification toward electrified and hydrogen-capable platforms rather than legacy diesel architecture. Second, China's continued high-speed rail network expansion keeps pulling trainset production toward newer, longer-span corridor construction each year. Third, India's rail electrification program keeps broadening the addressable fleet-replacement base, assuming steel and electrical-component input costs stay roughly stable across major producing markets through the decade.
A bull case builds if high-speed and metro-transit adoption accelerates faster than expected across urbanizing Asian markets, pushing growth toward 9.1% as national infrastructure programs broaden. The bear risk is public capital budget tightening: if government rail-investment programs decelerate more than anticipated, fleet-replacement timing could stretch out longer than planned, capping growth near 6.5% across the forecast period.

From Diesel Default to Electrified High-Speed Fleet Architecture

Railway rolling stock remains fundamentally a fleet-renewal category, but the market is undergoing a genuine shift as electrified and high-speed architecture converts specification from a purely capacity-driven decision into a decarbonization and speed optimization exercise. Expanding high-speed corridor construction is broadening the addressable manufacturer pool well beyond what legacy diesel-replacement demand alone would predict. Operators increasingly treat vehicle architecture as a multi-d
MARKET CONCENTRATION62% CR5Five manufacturers hold well over half of category revenue
AVERAGE UNIT VALUE$3.4 million per delivered passenger railcarReflects a fully finished, commissioned complete vehicle unit
LEADING APPLICATION SHAREPassenger rail, 54% of installed fleet valueOne end-use category dominates total delivered vehicle demand
ELECTRIFIED FLEET PENETRATION46%Nearly half of new fleet orders specify electrified propulsion
LEADING PRODUCING COUNTRY SHAREChina, 38% of global outputOne country supplies a disproportionate share of delivered units
STEEL AND ELECTRONICS SHARE44% of unit manufacturing COGSStructural steel and propulsion electronics dominate manufacturing cost heavily
Manufacturers compete less on unit price than on demonstrated reliability and energy-efficiency data that electrified architecture makes achievable over legacy diesel fleets. Production volume remains concentrated in China and Germany, while India's domestic rolling stock sector is expanding rapidly to serve its own growing electrification program. This reflects each country's established manufacturing infrastructure and government capital access.
The next decade will be shaped by two forces pulling in the same direction: high-speed trainset architecture finally scaling from flagship corridor use into standard national fleet architecture, and metro transit vehicles sustaining demand for urban-capacity expansion regardless of which specific operator originally commissioned the aging diesel inventory. Both push investment toward next-generation electrified fleet materials even as cost-constrained agencies weigh conversion expense against still-uneven capital-budget visibility across major replacement programs.
"A locomotive order used to be a straightforward capacity decision. Electrification and high-speed architecture just turned it into a decades-long decarbonization bet."
Director, Rail Infrastructure and Trackwork Materials Practice · MMA Rail Infras

Market Trends

High Speed Trainset Expansion Converts Fleet Specification

High-speed trainsets, engineered for sustained corridor speeds above 250 kilometers per hour, are converting national fleet specification away from conventional diesel-default purchasing toward systems offering meaningfully improved journey-time and passenger-capacity performance. This is pushing manufacturers to expand trainset-production capacity ahead of typical multi-decade fleet-refresh cycles, since high-speed architecture achieves journey-time outcomes that conventional rolling stock struggled to match consistently across major intercity corridors. Suppliers with validated high-speed production data are capturing disproportionate share of this conversion wave as additional national operators adopt corridor-speed specification each budget cycle, and early adopters report meaningfully stronger ridership growth.
Market Impact: Adds 8,900 electrified units delive
Urban Metro Expansion Lifts Transit Vehicle Demand

Rapid urbanization across Asian and Middle Eastern cities, requiring transit systems capable of moving substantially more passengers than existing bus networks can support, is converting municipal transport specification from a purely bus-based decision into a required metro-vehicle step for cities pursuing congestion-reduction and emissions targets. This is opening genuinely new metro-vehicle revenue among rolling stock suppliers whose product lines previously covered only mainline hardware. Suppliers with validated metro-vehicle capability are capturing disproportionate share of this expanding municipal population as more cities adopt metro architecture. Early evidence suggests this trend will only accelerate further across major urbanizing metro programs.
Market Impact: Cuts cross-border service disruptio

Market Opportunities and Growth Drivers

Decarbonization Mandates Sustain Baseline Electrification Demand

National decarbonization mandates across Europe and Asia continue tightening, driving predictable baseline electrification-replacement volume that persists regardless of which specific manufacturer an operator ultimately specifies for the replacement fleet. This mandate-driven base gives the category resilience that pure high-speed-corridor trends alone would not provide, since underlying electrification demand keeps expanding even as vehicle mix shifts toward more advanced trainset and metro options across the field. Suppliers investing in both diesel and electrified production capacity are capturing disproportionate share of this expanding base nationwide across every affected fleet, and momentum keeps building steadily each cycle.
Market Impact: Adds $180 million per conversion

Rail Safety Standards Raise Interoperability Requirements

Continued regulatory pressure to reduce cross-border service disruption on major European and Asian corridors is raising the interoperability and signaling-compatibility standards that rolling stock must meet, converting what used to be a loose national-fleet expectation into a narrowing specification gap that increasingly favors electrified and digitally integrated architecture over legacy diesel platforms. This is forcing manufacturers still relying on conventional diesel production to requalify designs faster than typical fleet-refresh cycles would otherwise allow across affected corridors. Suppliers with the most complete interoperability-validation data are converting this standards shift into meaningfully faster tender-win rates across major national rail programs.
Market Impact: Adds 44 percent of unit COGS

Market Restraints and Challenges

Electrification Conversion Costs Slow Smaller Operator Transition

Electrified rolling stock requires substantially different propulsion and overhead-catenary investment than legacy diesel fleets, creating genuine budget friction for smaller regional operators competing against larger national railways with established electrification-capable infrastructure. The root cause is that reliable electrified performance requires specialized traction-motor and power-electronics integration that diesel-servicing depots cannot easily repurpose. Suppliers are mitigating this by pursuing shared depot-conversion partnerships with regional rail agencies and by phasing electrification across multi-year capital cycles, helping smaller operators spread capital cost against demonstrated ridership demand over time nationwide, and adoption continues expanding steadily across every affected corridor.
Market Impact: Adds 46% electrified fleet penetrat

Steel and Electronics Price Volatility Pressures Margins

Structural steel and propulsion electronics together account for a meaningfully large share of rolling stock manufacturing cost, creating genuine budget friction for smaller regional manufacturers competing against larger integrated suppliers with established component-supply agreements. The underlying cause is that traction-grade semiconductors require specialized fabrication capacity that remains limited relative to growing rail and broader transportation-electrification demand. Suppliers are mitigating this by qualifying alternative semiconductor formulations and by signing long-term component-supply agreements, helping smaller manufacturers stabilize input cost exposure against continued production growth nationwide across the industry, and suppliers monitor exposure closely each cycle.
Market Impact: Adds 3,200 metro vehicles delivered
3 additional market trends, 4 additional growth drivers, and 2 additional restraints and challenges are covered in the full report. Contact sales@marketmindsadvisory.com to access the complete intelligence.

Segment CAGR and Growth Architecture

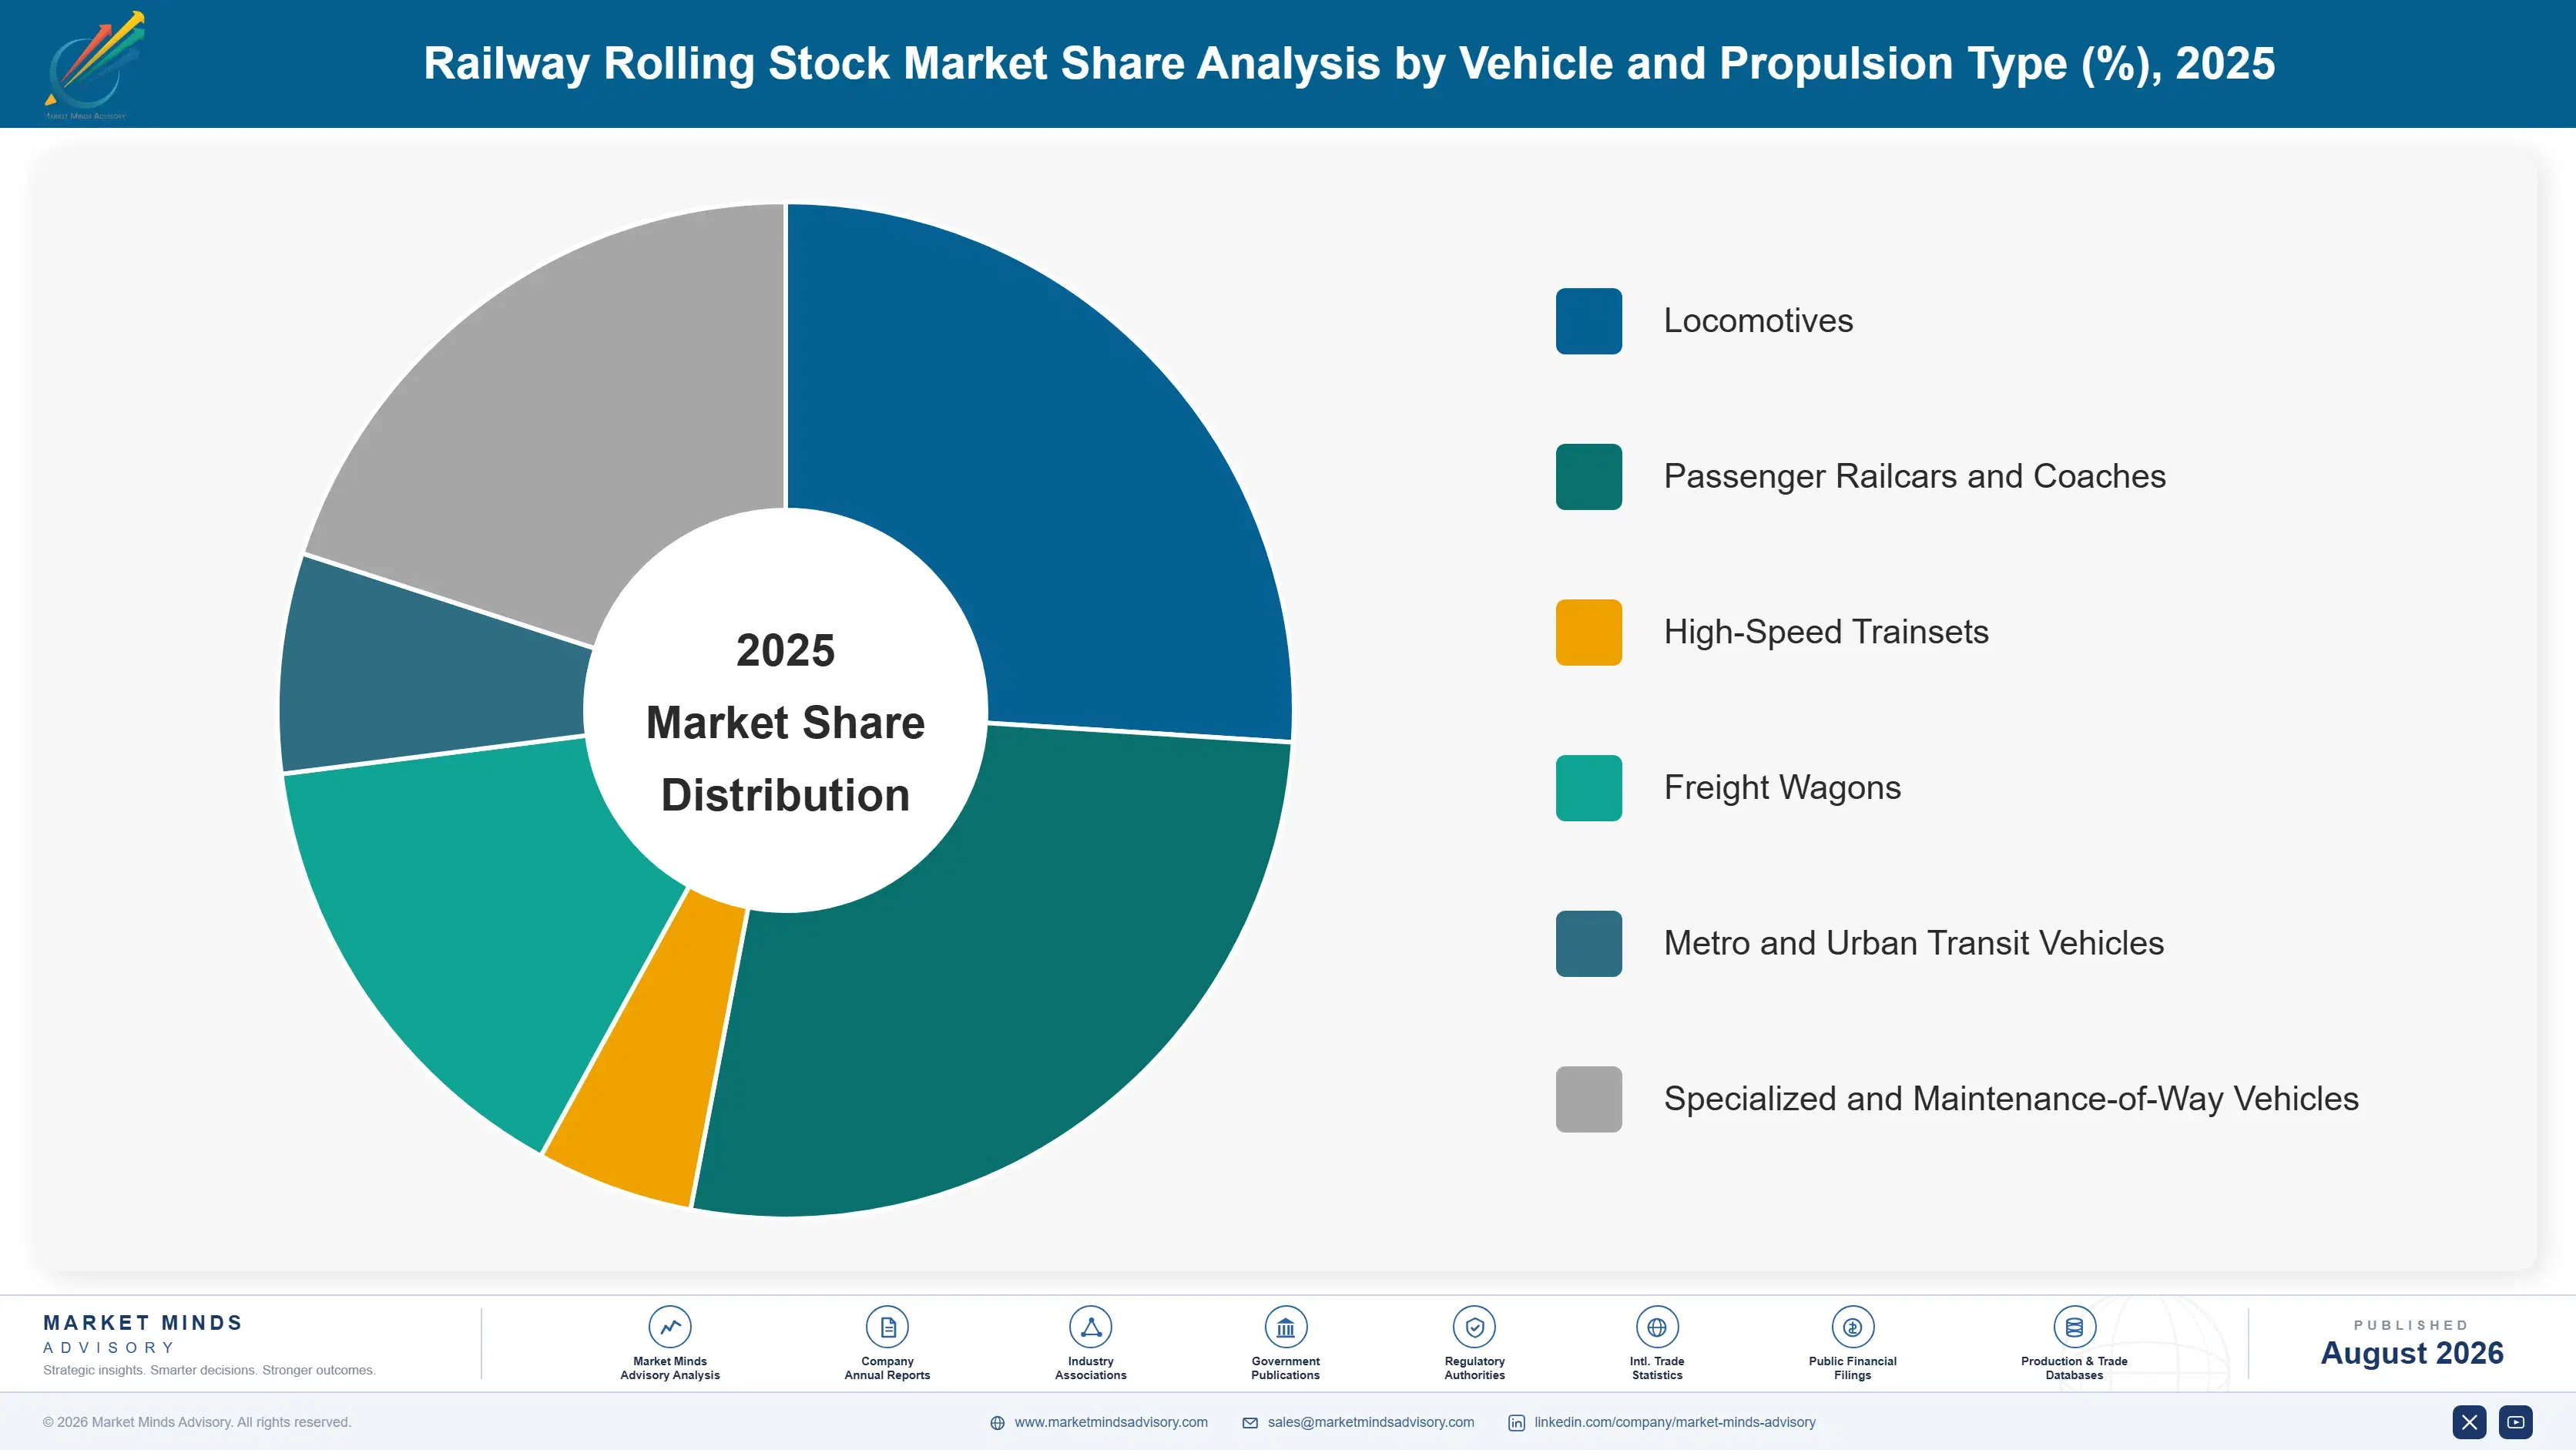
MMA segments the market by vehicle type and propulsion architecture, the classification rail operators and transit agencies use when specifying fleet content and comparing supplier capability across competing capacity decisions. This avoids blending upstream vehicle-manufacturing technology with downstream network-application categories that define where these vehicles are actually deployed across national systems nationwide overall today.
railway-rolling-stock-market-market-share-analysis-1787316813965

High-Speed Trainsets

High-speed trainsets, engineered as fully integrated multiple-unit consists to sustain corridor speeds well above conventional intercity service, remain the fastest-growing category as national operators convert from conventional-locomotive specification toward platforms enabling documented journey-time and ridership validation. Growth concentrates wherever high-speed corridor investment is climbing fastest alongside well-developed manufacturing infrastructure, particularly across China and increasingly Spain's expanding corridor-construction programs. CRRC and Alstom have each expanded trainset manufacturing capacity substantially, recognizing that journey-time validation data, not unit price alone, decides which supplier captures a corridor's multi-decade construction relationship. At a 13.6% forecast CAGR, roughly 1.74 times the market average, this segment is pulling capital investment toward next-generation fleet architecture faster than any other category tracked nationwide.
CAGR 13.6%

Metro and Urban Transit Vehicles

Metro and urban transit vehicles, engineered for high-frequency short-distance service with rapid acceleration and deceleration performance, track expanding municipal-transport demand more directly than any other segment, making urban-capacity depth a disproportionate growth driver for this category specifically. Siemens Mobility and Hitachi Rail lead on installed metro-vehicle fleet scale, while newer entrants increasingly compete on automation and energy-efficiency claims rather than unit cost alone. Demand here is tied more closely to municipal infrastructure-investment cycles than to overall national fleet volume, since metro-vehicle attach rates rise fastest wherever cities pursue congestion-reduction positioning. This segment's growth trajectory now depends heavily on how quickly emerging cities formalize metro-network construction programs across their transit systems.
CAGR 10.4%
Full segment breakdown across 6 segments available in the complete report.

Regional Architecture and Country Demand Map

East Asia commands a disproportionately large share of global demand given China's dominant rolling stock manufacturing base and ongoing high-speed rail network expansion, while South Asia and Pacific anchors the fastest-growing regional pipeline on India's electrification program. Western Europe contributes the largest steady electrified-fleet renewal base of any established market.

North America

The United States anchors regional demand through its extensive freight-rail network and established rolling stock manufacturers, spanning Wabtec, Progress Rail, and Amtrak's ongoing electrified-corridor fleet renewal across multiple states. Canada contributes a smaller, steadily growing demand base benefiting from its own extensive freight corridors and shared safety-certification standards serving the broader North American rail community. This region's demand share sits below the standard North America band because national high-speed and electrified-fleet investment lags China and Europe, with most spending directed at freight-locomotive replacement rather than new passenger-corridor construction. Growth stays strong but trails East Asia and South Asia and Pacific because the region's largest operators still rely predominantly on diesel-electric freight fleets. Mexico's growing freight-corridor investment adds regional momentum.
Share: 19% | CAGR: 8.1% (2026 to 2036)

Western Europe

Germany anchors both regional supplier depth and demand, home to Siemens Mobility's manufacturing facilities and an established high-speed rail network whose renewal schedule supplies the broader European replacement market. France and Spain follow with steady demand tied to national electrification programs increasingly recognizing high-speed trainsets as the corridor default. Regulatory harmonization plays a meaningful role here, but European interoperability requirements are pushing suppliers toward next-generation cross-border platform adoption well ahead of many other global markets tracked in this report. Growth trails East Asia and South Asia and Pacific because the region's mature network is expanding replacement spending more slowly than newer market entrants. Italy and the United Kingdom contribute smaller but steadily growing high-speed corridor demand of their own.
Share: 20% | CAGR: 6.3% (2026 to 2036)
Regional intelligence for 5 additional markets available in the complete report: East Asia, South Asia and Pacific, Latin America, Middle East and Africa, Eastern Europe. Contact sales@marketmindsadvisory.com.
railway-rolling-stock-market-country-cagr-analysis-1787316814479

Where Rolling Stock Manufacturers Actually Capture Margin

Legacy diesel sales increasingly compete on price alone as more suppliers enter commodity locomotive segments, so the companies protecting margin monetize the propulsion and lifecycle layer: electrification conversion, digital-signaling integration, and long-term operator supply agreements. The four levers below reflect where MMA's interviews with rail-agency procurement buyers show real, sustained willingness to pay a premium.

Electrification Conversion and Reliability Validation Support

Manufacturers increasingly fund dedicated electrified-propulsion testing and reliability-validation programs, since national operators increasingly require documented energy-efficiency and uptime evidence before approving next-generation fleet specifications. Suppliers investing in rigorous electrification-validation capability capture meaningfully higher tender-win rates than suppliers relying on legacy diesel production alone, worth roughly 28% higher fleet-tender win rates versus conventional diesel packages, since validation investment builds operator trust that marketing claims cannot replicate on their own. Adoption of dedicated reliability-validation teams continues accelerating industry-wide as electrification competition expands steadily across every major affected corridor each cycle, and agencies now expect this evidence upfront.
Market Impact: Adds roughly 28 percent higher tend

Digital Signaling Integration and Automation Support

Manufacturers increasingly bundle digital-signaling and automation-readiness validation alongside metro and high-speed hardware sales rather than selling vehicles as a standalone transaction, since transit agencies increasingly require documented automation evidence before committing to corridor-construction contracts. Suppliers offering integrated automation-validation services capture meaningfully higher program retention rates than hardware-only competitors, worth roughly 22% higher contract-renewal rates within the first three corridor cycles, since validation investment builds agency confidence that hardware sales alone cannot replicate. This service revenue stream continues expanding as more agencies adopt automated architecture. Smaller suppliers without similar validation scale struggle to offer comparable automation depth today.
Market Impact: Adds roughly 22 percent higher over

Long-Term Fleet Maintenance and Supply Agreements

Large integrated manufacturers increasingly sign multi-year fleet-maintenance and supply agreements guaranteeing consistent access to the latest electrified and digital technology, converting what used to be a series of individual vehicle purchases into predictable recurring revenue worth roughly 34% of a supplier's forward account revenue across the agreement term. Suppliers offering these agreements gain visibility into future production-volume demand that supports continued capacity investment, while operators gain protection against inconsistent fleet quality and pricing volatility on units secured under long-term relationships each construction cycle. Smaller manufacturers without comparable balance sheet strength increasingly struggle to offer similar long-term terms.
Market Impact: Locks in supply revenue for 10 to 1

Predictive Fleet Maintenance and Diagnostics Services

Suppliers offering integrated predictive-maintenance and fleet-diagnostic data services alongside physical vehicle sales capture recurring service and subscription revenue while simultaneously deepening customer relationships that make competitive displacement more difficult for rivals without comparable diagnostic infrastructure available today. For rail agencies pursuing uptime-retention strategies, the value proposition is faster fault isolation without separate diagnostic and maintenance-procurement processes across multiple service channels. Early adopters report diagnostic-subscription attach rates approaching 31% among first-time electrified customers, growing steadily each year as predictive-maintenance demand expands. Smaller suppliers without comparable data-platform budgets increasingly struggle to match this attach rate today.
Market Impact: Reaches nearly 31 percent overall d

Who Controls the Margin Pool

CR5 sits at 62%, reflecting a category highly concentrated among a handful of global manufacturers evaluated here on annual delivered unit capacity and installed fleet share combined. CRRC and Alstom lead on category scale, with a meaningful gap separating them from smaller challengers, including Siemens Mobility and Stadler, each strong in specific vehicle categories or geographies rather than universally. Smaller regional manufacturers increasingly struggle to match the electrification investm
Current activity centers on three dimensions: electrification and reliability-validation capability, digital-signaling integration bundling, and long-term operator supply capability for large national fleet accounts. Manufacturers lacking digital-integration capability are increasingly partnering with specialty signaling providers rather than losing corridor-selection decisions on missing-technology grounds alone across the wider industry this cycle.

Emerging pressure comes from Chinese domestic suppliers, particularly CRRC's export-focused subsidiaries, expanding aggressively on production scale into mid-tier segments historically dominated by Western manufacturers. If Chinese suppliers continue converting domestic scale into export competitiveness, expect rankings among the next several challengers to shift by 2031, as scale-led entrants displace slower-moving incumbents across mid-tier segments worldwide. Established leaders have limited time to respond before meaningful share shifts occur nationwide.
railway-rolling-stock-market-company-positioning-matrix-1787316815001

Competitive Moat and Risk Dimensions

CRRC CORPORATION LIMITED

Moat: Established Global Manufacturing Scale

CRRC's decades of domestic manufacturing footprint and high-speed trainset production experience give it cross-corridor standardization and volume-scale depth that newer entrants cannot quickly replicate regardless of technical investment committed. That accumulated manufacturing depth increasingly functions as a competitive moat for large national fleet-tender negotiations specifically. Competitors are unlikely to close this gap quickly.
CRRC CORPORATION LIMITED

Risk: Export Market Trust Exposure

CRRC's state-linked ownership structure leaves it more exposed than Western manufacturers to national security reviews and procurement restrictions in markets evaluating vendor diversification against geopolitical risk considerations. Managing this requires sustained investment in local partnership structures and transparent supply-chain disclosure across every affected market. This tension will intensify as scrutiny expands.
ALSTOM SA

Moat: Established Cross-Border Interoperability Relationships

Alstom's decades of installed relationships spanning nearly every major European national rail operator give it certification-relationship depth and manufacturing scale that narrower regional suppliers cannot easily replicate across an operator's full multi-decade fleet-renewal schedule. That breadth makes Alstom a default supplier for operators seeking a single trusted fleet relationship. Competitors are unlikely to close this gap quickly.
ALSTOM SA

Risk: Integration and Debt Burden Exposure

Alstom's large debt load from recent acquisition integration leaves it more exposed than better-capitalized rivals to margin pressure during periods of tender-pricing competition against Chinese and Japanese suppliers. Closing this gap requires sustained deleveraging and operational-integration progress over several years. Momentum currently favors better-capitalized competitors in the most price-sensitive tenders.

Players Tracked

Prominent Players

CRRC Corporation Limited
Alstom SA
Siemens Mobility
Stadler Rail AG
Hitachi Rail

Other Key Players

Talgo S.A.
CAF (Construcciones y Auxiliar de Ferrocarriles)
Wabtec Corporation
Progress Rail
Kawasaki Heavy Industries
Hyundai Rotem
Å koda Transportation
Titagarh Rail Systems
Medha Servo Drives
Trinity Industries
Greenbrier Companies
Amsted Rail
Transmashholding
Nippon Sharyo
Bharat Earth Movers Limited

Recent Developments

MARCH 2025

CRRC Expands High-Speed Trainset Manufacturing Capacity

CRRC announced an organic expansion of its high-speed trainset manufacturing capacity, targeting broader corridor production volume ahead of tightening national delivery schedules. The expansion follows growing operator demand for validated high-speed supply nationwide, with additional capacity planned across several subsequent construction phases scheduled through 2028 and beyond.
Signal: Signals CRRC prioritizing high-speed capac
OCTOBER 2024

Alstom Signs Long-Term Supply Agreement With European National Rail Operator

Alstom signed a long-term regional trainset supply agreement with a major European national rail operator, securing preferred-vendor status ahead of the operator's expanding electrification-cycle targets. The agreement covers qualification support and capacity planning across the operator's growing delivery schedule this year and well beyond it.
Signal: Signals established suppliers actively pur
JUNE 2025

Siemens Mobility Acquires Signaling Software Firm to Expand Digital Portfolio

Siemens Mobility completed the acquisition of a specialty rail-signaling software firm, combining Siemens' manufacturing scale with the acquired firm's proprietary automation technology to expand its digital rail portfolio ahead of tightening transit-agency automation mandates. The deal closed following standard regulatory review procedures completed earlier this year.
Signal: Signals larger suppliers actively pursuing

Structural Steel and Propulsion Electronics Costs

Structural steel and propulsion electronics together account for roughly 44% of rolling stock manufacturing cost of goods sold, making these inputs the dominant cost driver in the category ahead of general assembly and interior-fitting content. Costs vary by electrification-grade requirement, with traction-motor and power-electronics formulations driving most of the remaining cost variability manufacturers face across most producing regions today.
Traction-grade semiconductor costs spiked sharply through 2021 and 2022 as broader automotive and industrial electrification demand absorbed available fabrication capacity faster than new capacity could be added, according to company disclosures citing constrained component supply and trade-tariff policy shifts across multiple regional suppliers. Manufacturers without long-term semiconductor-supply agreements or in-house sourcing capability saw costs rise faster than they could pass through to fixed-price operator contracts signed before the spike occurred across the industry.

Smaller regional manufacturers without established semiconductor-supply relationships absorb input cost volatility directly into thin margins, while larger players like CRRC and Alstom use existing material-supply-chain relationships to insulate margins from commodity cost swings across their networks. Suppliers newly entering the category without comparable supply relationships carry meaningfully greater cost exposure than incumbents who capture more of the value chain across the category.
railway-rolling-stock-market-cost-volatility-analysis-1787316815199

Long-Term Semiconductor Supply Agreements

The largest manufacturers are locking multi-year traction-grade semiconductor supply agreements directly with chip fabricators rather than competing for spot market capacity, securing priority access and more predictable pricing across major fleet programs and forecast cycles ahead, reinforcing the scale advantages already present across the category. Smaller manufacturers increasingly struggle to secure comparable terms each cycle.

Vertical Integration Into Propulsion Systems

Larger suppliers are investing directly in in-house propulsion and power-electronics manufacturing capability rather than relying entirely on third-party component providers, capturing more of the value chain and reducing exposure to specialty electronics price swings across the category's highest-volume electrified product lines. This trend continues strengthening as demand for validated formats keeps expanding across every major regional market tracked today.

Component Sourcing Diversification Strategies

Manufacturers are diversifying steel and semiconductor sourcing across multiple regional producers rather than depending on a single source, reducing exposure to specific production disruptions that have affected particular component categories during recent volatility episodes across markets. This diversification has become standard practice among the category's larger manufacturers over the past several procurement cycles industry-wide.

Portfolio Architecture for Margin Defence

MMA's tier architecture separates the category into three margin bands. Volume and commodity-adjacent conventional locomotives and freight wagons compete on price against widely available generic configurations and carry thin margin, premium and certified electrified and high-speed platforms carry higher margin on documented reliability and journey-time validation, and sustainability-linked next-generation formats, including hydrogen-capable and predictive-diagnostic-enabled systems, command the
The tension between volume and premium plays out most visibly among mid-sized regional operators, who want electrified depth at closer to diesel pricing. That up-tier migration remains slow given how many mid-sized operators still evaluate conversion budget cost cautiously before committing further capital resources. Suppliers that fail to bundle electrification capability and reliability-validation support risk losing share to more capable rivals. Momentum continues building steadily across the industry.

High-value margin pools concentrate in large national-operator and network-partner account agreements bundled with reliability-validation, digital-signaling-integration, and diagnostic-monitoring services, where recurring maintenance and support-attach revenue increasingly outweighs the margin earned on any individual vehicle sale alone. That concentration is pulling investment steadily toward electrified and digital capability rather than incremental diesel-production expansion alone across the category.

Volume / Commodity-Adjacent Tier

Conventional locomotives and freight wagons sold primarily on price against widely available generic configurations, serving cost-sensitive regional operators where gross margin stays thin and competition is driven almost entirely by landed unit cost.
Gross Margin: 8%-13%

Premium / Certified Tier

Electrified and high-speed platforms specified by national operators requiring documented reliability validation, journey-time support, and warranty agreements, commanding meaningfully higher margin on demonstrated performance achieved across every major transaction market worldwide today.
Gross Margin: 16%-23%

Sustainability / Regulatory / Next-Generation Tier

Hydrogen-capable and predictive-diagnostic-enabled systems positioned for agencies chasing decarbonization commitments and automation-diagnostic compliance, where technology innovation and validation depth support the category's highest margin overall across most major markets today.
Gross Margin: 23%-30%
railway-rolling-stock-market-portfolio-architecture-1787316815689

High-value Sub-segments and Strategic Watch-out

High-Speed Trainsets

The fastest-growing and highest-certification-intensity segment, where operator demand is pulling capital toward validated next-generation content away from legacy conventional hardware alone, representing the clearest near-term path to share gain and margin expansion together across a supplier's entire corridor relationship base worldwide. Investment here compounds fastest of any category.

Metro and Urban Transit Vehicles

Steady, urbanization-driven growth from automated formats that bundle into large municipal account agreements, less explosive than trainset demand but increasingly sticky, giving suppliers reliable recurring revenue tied to network-expansion renewal cycles rather than open transaction competition alone across most accounts. Capital cycles drive most of this growth.

Passenger Railcars and Coaches

The volume core of the category across established manufacturers, sold in steady but modest unit numbers as overall replacement demand continues growing, competing on price and least affected by the high-speed-driven dynamics seen elsewhere in the broader portfolio described above, served across most regions today.

Specialized and Maintenance-of-Way Vehicles

A strategic watch-out segment where growth trails the category average as adoption remains concentrated among legacy niche infrastructure-maintenance platforms, and suppliers risk ceding the niche entirely if larger competitors keep deprioritizing standalone investment ahead of clearer electrified and high-speed demand arriving soon across every affected market.

Fleet Renewal and Lifecycle Maintenance Economics

A vehicle sale is rarely a single transaction for the largest national-operator and network-partner accounts. Reliability-validation, digital-signaling-integration, and diagnostic-monitoring services convert what used to be a one-time purchase into a relationship of recurring maintenance volume and qualification-renewal cycles. Suppliers that capture the validation and monitoring attachment at first sale retain greater lifetime value per account than those competing on unit price alone.
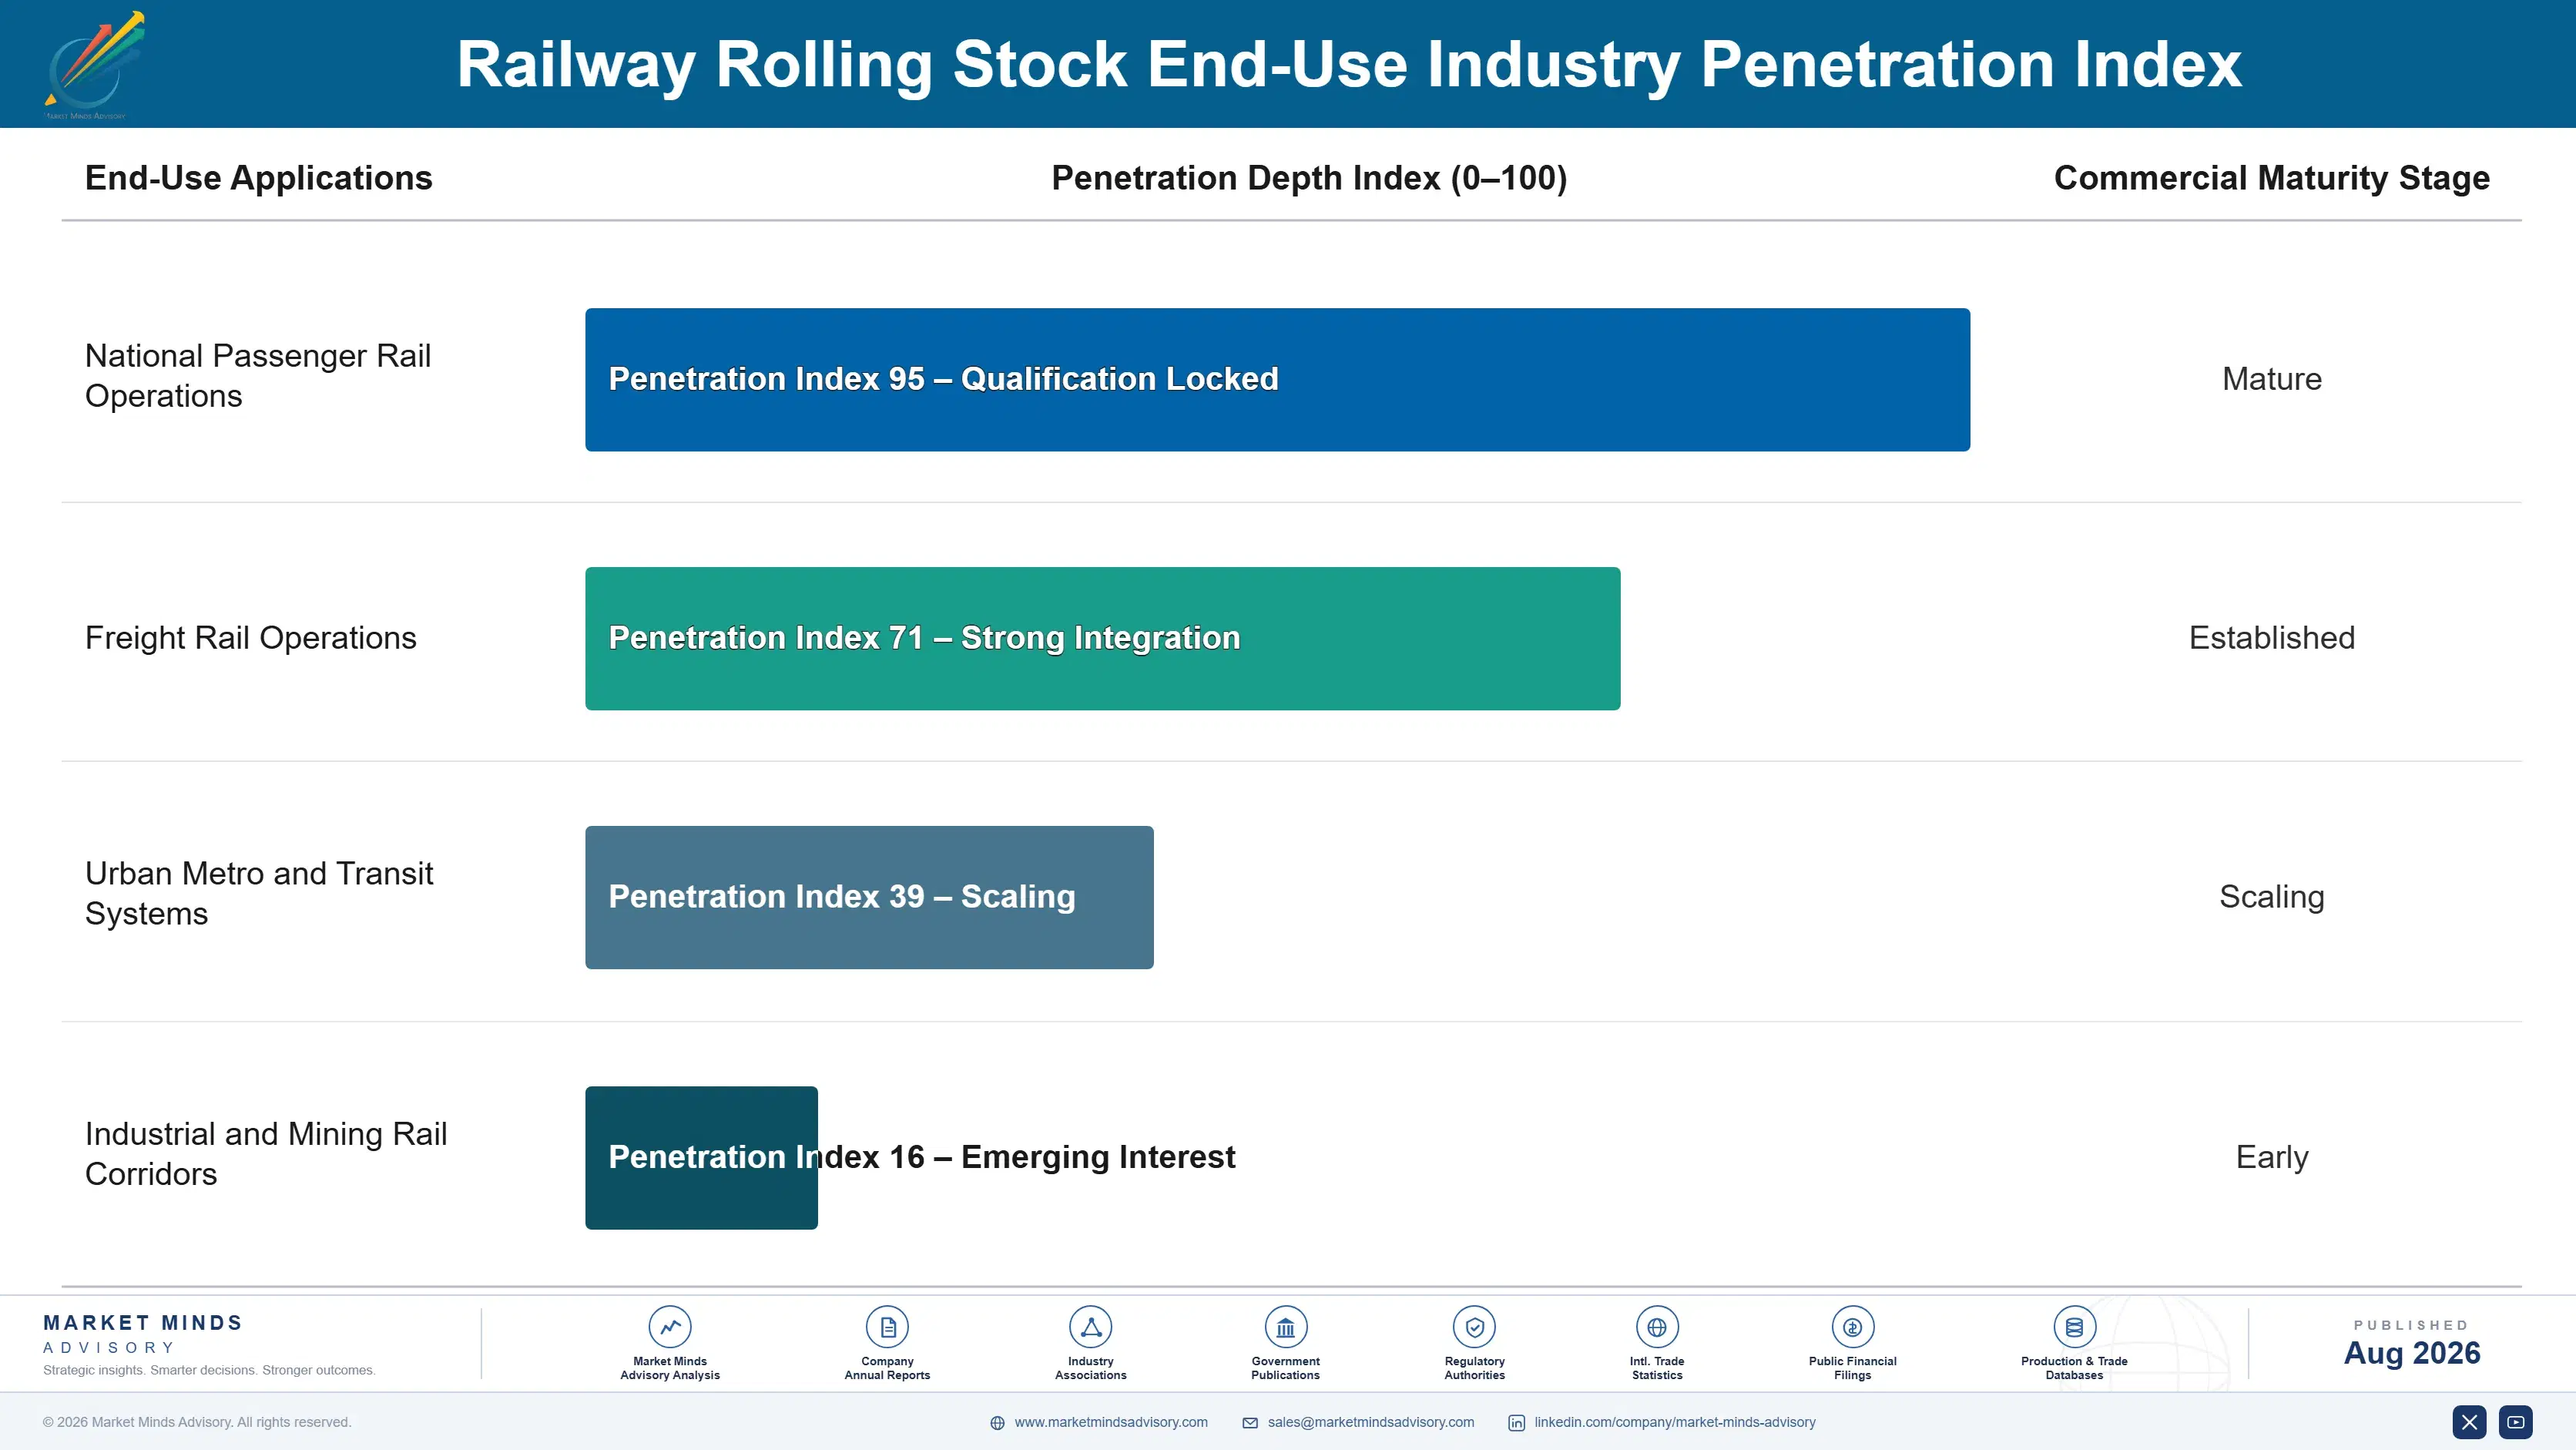
Adoption depth varies sharply by operator type. Large national rail operators and metro-network operators convert fastest and most completely, standardizing entire fleets onto electrified or high-speed architecture once qualification and validation standards align, making them the highest-value account type despite competitive pricing negotiated across the relationship. Smaller regional and freight-shortline operators convert more slowly, often relying on legacy diesel content for years before adopting electrified or hydrogen formats directly.

A generational shift in rail-agency engineering buyers is compounding the electrification-driven shift. Younger engineers entering procurement roles increasingly expect validated, data-backed lifecycle-cost platforms as standard specification protocol, a preference an older generation of buyers, trained primarily on lowest-upfront-cost sourcing, rarely weighted as heavily. That shift is accelerating premium-tier adoption even among operators that have not yet faced direct pressure to convert away from legacy diesel architecture.
railway-rolling-stock-market-end-use-penetration-index-1787316816179

What Matters Most Through 2036

These are among the four positions where our research anticipates prominent divergence between winners and laggards over the coming forecast period. Each is grounded in the demand model, the regulatory perimeter, and the announced capacity pipeline.
01 / ELECTRIFICATION CAPACITY INVESTMENT

Build validated electrified capacity before competitors do

Electrified fleet demand is converting replacement specification from a niche capability into a mainstream operator expectation, and suppliers with established validated reliability data are already capturing disproportionate share of tender-selection decisions ahead of broader market adoption. Suppliers that invest in electrification-production capacity now will secure preferred-vendor status with major national-operator accounts before competitors catch up on the manufacturing investment required. Continuing to treat capacity as a future concern risks ceding the fastest-growing, most differentiated segment to suppliers already building validated reliability depth.
02 / HIGH SPEED PLATFORM DEPTH

Deepen trainset capability ahead of corridor construction refresh

China's continued high-speed rail expansion increasingly decides corridor-vehicle selection as much as unit cost itself, and suppliers that deepen validated trainset pathways will capture disproportionate share of installed corridor retention as operators seek journey-time confidence without full fleet replacement. Suppliers that invest in open, validated trainset technology now will build switching costs that protect installed base better than competitors relying on price alone. This technology investment requires sustained development spending across multiple years before any single corridor-refresh cycle fully rewards that account positioning choice.
03 / RECURRING DIAGNOSTIC REVENUE

Bundle validation and diagnostics into every large tender quote

Extended reliability-validation bundling and diagnostic-monitoring services already generate meaningfully higher recurring revenue than standard vehicle sales, yet many suppliers still sell these as separate negotiations rather than a default part of every quote presented to large national-operator accounts. Suppliers that make validation and monitoring attachment the default, requiring buyers to actively opt out rather than opt in, will capture materially more lifetime value per account than competitors treating these services as an afterthought. This remains underexploited by every supplier outside the two largest players active in the category.
04 / CHINESE SUPPLIER COMPETITION

Diversify toward certified segments ahead of continued scale pressure

Chinese domestic rolling stock suppliers continue expanding aggressively into mid-tier segments, and suppliers overly dependent on undifferentiated legacy sales into scale-sensitive markets face real margin compression risk across the forecast period covered in this report. Suppliers that diversify toward certified, differentiated evidence and service sales in segments less exposed to Chinese scale competition will protect margin better than competitors continuing to compete primarily on undifferentiated commodity-grade transaction price. This repositioning requires sustained investment in evidence well before competitive pressure fully materializes in each affected market.

Engagement Snapshot From the Field

A live engagement with an industry participant carrying material or product regulatory and market exposure ahead of a defining policy shift, showing how our research translates into a defensible multi-year portfolio strategy.
MARKET MINDS ADVISORY · CLIENT ENGAGEMENT SUMMARY
Railway Rolling Stock Producer Strategic Portfolio Review and Transition Roadmap 2026·Investment Scenario on Railway Rolling Stock Exposure Evaluation 2025-26
CLIENT PROFILE
The client is a national passenger rail operator managing service across 9 regional divisions, with an accelerating fleet-electrification pipeline and a stated goal of standardizing electrified trainsets across its highest-ridership corridors. Annual capital and maintenance spend exceeds $960 million (client-reported, unverified by MMA), concentrated primarily across legacy diesel, mid-tier electrified, and emerging high-speed replacement programs across its network.
STRATEGIC CHALLENGE
The client faced a fleet-architecture transition decision balancing electrified-trainset supplier investment against existing diesel-servicing infrastructure and uncertain multi-year capital-budget timing across its varied corridor portfolio. Leadership needed a structured evaluation framework weighing journey-time benefits against conversion-schedule complexity across its network footprint and budget. National leadership also worried that a rushed rollout could compromise ongoing passenger-service reliability.
MMA APPROACH
MMA conducted a structured evaluation of the client's current fleet specification patterns against supplier-readiness and validation data across its network, benchmarked electrification claims against MMA's proprietary rail-infrastructure performance database, and facilitated reference site visits with comparable operators that had already completed fleet electrification. The engagement combined primary interviews with engineering leadership alongside independent performance verification.
KEY FINDINGS
  1. Three of the client's nine regional divisions lacked reliable overhead-catenary infrastructure capable of supporting full-fleet electrification without substantial capital investment first and foremost.
  2. The client's electrified corridors showed meaningfully improved reliability outcomes compared with legacy diesel architecture tested across multiple deployment segments spanning three separate operating divisions overall.
  3. Standardizing on validated electrified platforms reduced projected service-disruption incident rates by an estimated 19%, per MMA's proprietary internal forecasting model, improving overall network reliability.
  4. Division-specific catenary-infrastructure variation across the client's network emerged as a meaningfully underestimated factor in conversion planning requiring further review ahead of the network-wide rollout scheduled for subsequent phases.
CLIENT PROFILE
The client is a national passenger rail operator managing service across 9 regional divisions, with an accelerating fleet-electrification pipeline and a stated goal of standardizing electrified trainsets across its highest-ridership corridors. Annual capital and maintenance spend exceeds $960 million (client-reported, unverified by MMA), concentrated primarily across legacy diesel, mid-tier electrified, and emerging high-speed replacement programs across its network.
STRATEGIC CHALLENGE
The client faced a fleet-architecture transition decision balancing electrified-trainset supplier investment against existing diesel-servicing infrastructure and uncertain multi-year capital-budget timing across its varied corridor portfolio. Leadership needed a structured evaluation framework weighing journey-time benefits against conversion-schedule complexity across its network footprint and budget. National leadership also worried that a rushed rollout could compromise ongoing passenger-service reliability.
MMA APPROACH
MMA conducted a structured evaluation of the client's current fleet specification patterns against supplier-readiness and validation data across its network, benchmarked electrification claims against MMA's proprietary rail-infrastructure performance database, and facilitated reference site visits with comparable operators that had already completed fleet electrification. The engagement combined primary interviews with engineering leadership alongside independent performance verification.
KEY FINDINGS
  1. Three of the client's nine regional divisions lacked reliable overhead-catenary infrastructure capable of supporting full-fleet electrification without substantial capital investment first and foremost.
  2. The client's electrified corridors showed meaningfully improved reliability outcomes compared with legacy diesel architecture tested across multiple deployment segments spanning three separate operating divisions overall.
  3. Standardizing on validated electrified platforms reduced projected service-disruption incident rates by an estimated 19%, per MMA's proprietary internal forecasting model, improving overall network reliability.
  4. Division-specific catenary-infrastructure variation across the client's network emerged as a meaningfully underestimated factor in conversion planning requiring further review ahead of the network-wide rollout scheduled for subsequent phases.
RECOMMENDED STRATEGY
Phase 1: Phase 1 (Months 1 to 9): Complete division-level catenary-infrastructure assessment and convert the six best-positioned divisions to electrified service first. Phase 2: Phase 2 (Months 10 to 20): Secure alternative catenary-infrastructure solutions for remaining divisions while closely tracking reliability outcomes against baseline metrics. Phase 3: Phase 3 (Months 21 to 30): Complete network-wide fleet standardization pending validated results from the initial deployment phase across all divisions.
OUTCOME
The client's first six divisions achieved measurable improvements in reliability outcomes and network service quality within fourteen months of fleet electrification (client-reported, unverified by MMA), supporting the phased network-wide rollout that had originally motivated the supplier-readiness assessment engagement. The remaining three divisions are scheduled for phased conversion over the following eighteen months.

Frequently Asked Questions

Foundational context covering the market sizes, CAGR, scope, country, region and competition that inform every finding below. This section is provided to cover basics and most often pre-purchase conversations, answered from the MMA Primary Research Dataset.

What is the current size of the Railway Rolling Stock Market?

MMA estimates the global railway rolling stock market at $62.0 billion in 2025. Growth concentrates in high-speed trainsets and metro vehicles, driven by expanding electrification and urban-transit investment steadily.

How large will the Railway Rolling Stock Market be by 2036?

MMA forecasts the market reaching $141.6 billion by 2036, up from $66.8 billion in 2026. That represents roughly a 2.12 times expansion over the full ten-year forecast period covered here.

What is the CAGR for the Railway Rolling Stock Market 2026 to 2036?

MMA's base case forecasts a 7.8% compound annual growth rate, with a bull case of 9.1% and a bear case of 6.5% depending on national infrastructure-budget timing.

Which segment is growing fastest?

High-speed trainsets lead at a 13.6% CAGR, roughly 1.74 times the overall market rate, as national operators convert legacy conventional content toward next-generation architecture nationwide.

Who are the major companies in the Railway Rolling Stock Market?

CRRC, Alstom, Siemens Mobility, Stadler, and Hitachi Rail lead the category, together holding an estimated 62% combined share on a delivered-unit-capacity basis worldwide. Each maintains distinct regional and vehicle-type strengths.

Which country is growing fastest?

India leads at an estimated 11.2% CAGR, outpacing the global average as its rapidly expanding rail-network electrification program and rising domestic rolling stock manufacturing investment continue growing faster than any comparable economy.

Report Segmentation Architecture

The full report scope spans multiple orthogonal segmentation dimensions, with cross-tabulated demand data provided for each dimension pair. Coverage extends further to regional breakdowns, trend trajectories, and the competitive detail needed to support segment-level decision-making.

By Vehicle and Propulsion Type

  • Locomotives
  • Passenger Railcars and Coaches
  • High-Speed Trainsets
  • Freight Wagons
  • Metro and Urban Transit Vehicles
  • Specialized and Maintenance-of-Way Vehicles

By End-Use Industry

  • National Passenger Rail Operations
  • Freight Rail Operations
  • Urban Metro and Transit Systems
  • Industrial and Mining Rail Corridors

By Commercial Dimension

  • New Fleet Procurement
  • Fleet Replacement and Renewal
  • Long-Term Operator Maintenance Contracts
  • Digital and Diagnostic Service Sales

By Region

  • North America
  • Western Europe
  • East Asia
  • South Asia and Pacific
  • Latin America
  • Middle East and Africa
  • Eastern Europe

Scope, Methodology, and Coverage

Every figure in this report is reproducible from documented input assumptions. The scope below maps the historical period, the forecast horizon, the segmentation dimensions, and the countries covered, alongside the underlying primary and qualitative methodology.
Historical Period
2020 to 2025
Forecast Period
2026 to 2036
Base Year
2025 (USD billions; MMA Primary Research Dataset, August 2026)
Market Definition
The railway rolling stock market covers locomotives, passenger railcars and coaches, high-speed trainsets, freight wagons, metro and urban transit vehicles, and specialized maintenance-of-way vehicles sold to national rail operators, transit agencies, and freight railroads for new fleet construction and replacement. It excludes fixed infrastructure such as track, signaling systems, and station facilities, and standalone component sales not delivered as part of a complete vehicle order.
Quantitative Units
USD billions (current prices); delivered unit volume in thousands where applicable
Segmentation Dimensions
By Vehicle and Propulsion Type; By End-Use Industry; By Commercial Dimension; By Region
Regions Covered
North America, Western Europe, East Asia, South Asia and Pacific, Latin America, Middle East and Africa, Eastern Europe
Countries Covered
USA, China, Germany, France, UK, Japan, South Korea, India, Australia, Canada, Brazil, Mexico, Indonesia, Vietnam, Thailand, Philippines, UAE, Saudi Arabia, South Africa, Nigeria, Turkey, Poland, Netherlands, Italy, Spain, Sweden, Switzerland, Argentina, Colombia, Singapore, and additional markets relevant to this sector
Key Companies Profiled
CRRC Corporation Limited, Alstom SA, Siemens Mobility, Stadler Rail AG, Hitachi Rail, Talgo S.A., CAF, Wabtec Corporation, Progress Rail, Kawasaki Heavy Industries, Hyundai Rotem, Å koda Transportation, Titagarh Rail Systems, Medha Servo Drives, Trinity Industries, Greenbrier Companies, Amsted Rail, Transmashholding, Nippon Sharyo, Bharat Earth Movers Limited
Quantitative Methodology
Primary survey, n=3,800 respondents, Q4 2025, six countries; demand-side model with trade association cross-validation
Qualitative Methodology
47 expert interviews, Q4 2025; applied to validate demand model assumptions, identify emerging dynamics, and assess competitive positioning
Report Format
PDF and XLSX data workbook (Word format preview document)
Publisher
Market Minds Advisory
Report Code
MMA-2026-CON-108
Published
August 2026
Contact
sales@marketmindsadvisory.com | www.marketmindsadvisory.com

Purchase the full Railway Rolling Stock Market Report (2026 to 2036).

The full Railway Rolling Stock Market report delivers granular five-year and ten-year forecasts across all six vehicle and propulsion segments, adoption tracking by region, and supplier benchmarking drawn from MMA's proprietary rail-infrastructure database. It includes detailed profiles of all twenty companies covered here, extended regional analysis across every major producing market worldwide, and a technology tracker spanning electrification, high-speed, and digital-signaling platform development. Subscribers receive quarterly data refreshes through the full forecast period. Buyers also gain direct analyst access for engagement-specific questions throughout the subscription term, including scheduled quarterly briefing calls with the practice lead.
Electrification and high-speed adoption qualification tracker
Ten-year segment-level forecasts across all vehicle types
Supplier benchmarking data across pricing and certification
Technology platform development tracking module here
Twenty-company competitive profiles with moat analysis
Quarterly data refresh access throughout subscription period

Built For The People Who Decide

From boardroom strategy to bench-side execution, this report is read cover-to-cover by leaders shaping the next decade of their industry, turning demand scenarios, market dynamics and valuation benchmarks into decisions.
CXOs/ Presidents/ VPs/ Managers
M&A and Corporate Development
Strategy Teams and R&D Heads
Procurement and Product Directors
Regulatory and Compliance Leaders
Investor Relations and Equity Analysts