Market Minds Advisory
Radiopharmaceuticals Market

Radiopharmaceuticals Market: Radioligand Therapy, Isotope Supply Fragility and the Logistics of a Decaying Product

This is the only pharmaceutical category where the product is losing potency while it travels, which means production sites, flight schedules and licensed centre counts constrain revenue far more tightly than clinical demand does.

Lead Analyst

Alice Ballenger

Published

September 2026

Make Smarter Decisions with Customized Research Insights

Request a free sample report and evaluate market opportunities, growth trends, and competitive dynamics relevant to your business needs.

2025 MARKET VALUE$8.9BMarket Size 2025
2036 FORECAST VALUE$26.4BBase Case , 2026 to 2036
CAGR 2026 TO 203610.4 %Bull 11.6% / Bear 9.2%
INCREMENTAL OPPORTUNITY$16.6BNet 10- year value creation
EXPANSION MULTIPLE2.69x2036 value over 2026 base
Strategic Levers
M&A Pipeline
Regional Outlook
Country Rankings
Competitive Intelligence
Segmental Deep-dive
Call-Us : 91 93563 13602

Executive Snapshot and Market Trajectory

Nuclear medicine spent thirty years as a diagnostic discipline with a modest therapeutic sideline. Radioligand therapy inverted that, and the constraint is now industrial: production capacity, decay logistics and the number of licensed administration centres. Clinical demand stopped being the binding limit years ago. Clinical demand stopped binding years ago.
Lutetium-177 therapeutic radioligands compound at 15.6%, exactly 1.50 times the market, as prostate and neuroendocrine indications move earlier in treatment sequences. North America holds 31% of global spend, driven by therapy pricing near USD 47,000 per course and reimbursed PET volume rather than by isotope production, most of which sits in Europe. Around 23% of produced activity decays before it reaches a patient. Europe manufactures what North America bills for, which is the central asymmetry.
Five manufacturers supply 66% of patient doses, and position depends on production network geography more than on portfolio. Roughly 1,850 centres worldwide hold licences to administer therapeutic radioligands, which is the real ceiling on how fast therapy revenue can grow. Isotope supply rests on a handful of ageing research reactors, and every outage since 2022 has shown how little redundancy the category actually has.
Market Definition
Covers radioactive pharmaceutical agents administered for diagnosis or therapy, spanning technetium-99m diagnostic kits, fluorine-18 positron emission agents, gallium-68 and copper-64 agents, lutetium-177 therapeutic radioligands, alpha-emitting therapeutics, and iodine-131 and legacy therapeutic agents. Sizing is at manufacturer or radiopharmacy realised price per patient dose. Excludes imaging equipment, cyclotrons and generators sold as capital, non-radioactive contrast media, dosimetry software, radiation therapy delivered by external beam, and nuclear medicine professional fees.
Base Year Value
$8.9B in 2025 (MMA Primary Research Dataset, August 2026)
Forecast Period
2026 to 2036, eleven discrete annual values
CAGR
10.4% base case. Bull 11.6%. Bear 9.2%.
Fastest Growth Segment
Lutetium-177 Therapeutic Radioligands: 15.6% CAGR
Fastest Growth Country
India: 13.3% CAGR
Fastest Growth Region
South Asia and Pacific: 12.7% CAGR
Largest Region
North America: 31% of 2025 global value
Market Leaders
Novartis, Curium, Lantheus, Telix Pharmaceuticals, Bayer. Source: MMA Analysis based on company annual reports.
Primary Survey
n=3,800 procurement and R&D decision-makers, Q4 2025, six countries
Methodology
Demand-side build-up, cross-validated against public data, 47 expert interviews

Radiopharmaceuticals Market Forecast Scenarios

radiopharmaceuticals-market-size-forecast-scenario-1787309255545
Radiopharmaceutical investment grew steadily across 2020 to 2025 as targeted radioligand therapy approvals expanded and diagnostic PET tracer adoption broadened across oncology imaging programs, then increased once alpha-emitter clinical evidence matured enough to support broader treatment adoption decisions. The market grew at an estimated 9.2% historical CAGR across the period, reflecting steady baseline growth that stepped up once tumor-targeting data strengthened across leading oncology networks.
The base case assumes alpha-emitter radioligand adoption keeps broadening across oncology centers through 2030, beta-emitter therapeutic demand keeps expanding as approved indications broaden into earlier-stage disease at treatment centers, and isotope production capacity investment keeps growing as global supply constraints ease across recurring manufacturing cycles. Together these three mechanisms support a 10.4% forecast CAGR, with diagnostic tracers remaining a steady anchor even as alpha and beta radioligand formats capture growing value share overall.
The bull case centers on faster-than-expected alpha-emitter regulatory approval expansion that pushes validated radioligand demand well ahead of current manufacturer production timelines. The bear case centers on renewed isotope supply chain disruption following reactor and cyclotron capacity constraints, which would slow treatment access and compress smaller manufacturer margins across cost-constrained regions. Both scenarios hinge on how quickly global isotope production capacity scales.

Why Production Geography Decides Revenue Here

No other pharmaceutical category loses its product to physics in transit. A lutetium-177 dose is decaying from the moment it is made, and roughly 23% of produced activity never reaches a patient because it decayed in a vial, on a runway or in a customs queue. That fact determines the industrial structure: production sits within flight range of administration, batches match appointment schedules, and a missed connection is a lost dose. Manufacturing geography is the strategy.
TOP FIVE CONCENTRATION66%Patient doses supplied by the leading radiopharmaceutical manufacturers
RADIOLIGAND THERAPY PRICEUSD 47,000United States list price per complete treatment course
ISOTOPE DECAY LOSS23%Produced activity lost between manufacture and patient administration
REACTOR SUPPLY CONCENTRATION5 facilitiesResearch reactors producing most global medical isotope supply
THERANOSTIC PAIRING RATE78%Therapy patients selected using a matched imaging agent
LICENSED CENTRE COUNT1,850Facilities authorised to administer therapeutic radioligand doses globally
The second defining feature is licensed capacity. Administering a therapeutic radioligand requires a facility with radiation handling authorisation, trained staff, waste management and in many jurisdictions patient isolation capability, and roughly 1,850 centres worldwide currently qualify. Demand from oncologists exceeds what those centres can deliver in several markets. That makes centre accreditation a commercial activity for manufacturers, which is a strange position for a pharmaceutical company to occupy and an unavoidable one here.
Two forces shape the next decade. Radioligand therapy keeps moving earlier in treatment sequences, which multiplies eligible patients faster than production can scale. And isotope supply rests on a small number of ageing research reactors whose outages have repeatedly interrupted diagnostic supply since 2022, with replacement capacity arriving slowly.
"Everybody models this category on clinical demand and everybody is wrong. The binding constraint is a flight schedule and a licence register. I have seen an oncology team with twenty eligible patients and a six-week wait, not because the drug was unapproved or unfunded, but because the nearest authorised centre could handle four doses a week and the batch arrived on Tuesdays."
Director, Nuclear Medicine and Oncology Practice · MMA Healthcare / Nuclear Medi

Market Trends

Radioligand therapy moves earlier in treatment sequences

Lutetium-177 prostate-specific membrane antigen therapy entered practice for patients who had exhausted chemotherapy, and trial data has since supported use before taxane exposure. Each step earlier in the sequence multiplies eligible patients, because attrition through prior lines is severe in advanced prostate cancer. Neuroendocrine indications have followed a similar path. The commercial consequence is that demand growth outruns production scaling, which is why several manufacturers ration allocation across centres rather than compete for prescriptions. That is an unusual position for an oncology product to be in. Allocation, not promotion, is the commercial task.
Market Impact: Adds around 1,850 licensed centres
Theranostic pairing links diagnostic and therapeutic revenue

Patient selection for radioligand therapy uses a matched imaging agent, most commonly a gallium-68 or fluorine-18 tracer targeting the same receptor, and roughly 78% of therapy patients are selected that way. That pairing pulls diagnostic volume upward in step with therapy growth, which reverses a decade of flat diagnostic demand. It also gives manufacturers holding both agents an advantage that a therapy-only competitor cannot match, since the imaging agent reaches the patient first and shapes the treatment discussion before any therapy decision is made. Holding the tracer is therefore worth more than its own revenue suggests.
Market Impact: Supports under 10% of trial demand

Market Opportunities and Growth Drivers

Licensed administration capacity expands through accreditation programmes

Therapy delivery requires radiation handling authorisation, trained staff, waste management and often patient isolation, and roughly 1,850 centres worldwide currently hold the necessary licences. Manufacturers have taken on centre development directly, funding training, dosimetry support and licensing assistance because approved therapy that cannot be administered generates nothing. Centre numbers have grown substantially since 2022 and remain the binding constraint in several markets. Each new authorised centre represents recurring dose demand rather than a one-off sale, which makes accreditation support an unusually efficient commercial investment. Few pharmaceutical companies have ever had to build their own delivery capacity.
Market Impact: Concentrates supply in 5 reactors

Alpha emitter development attracts substantial pipeline investment

Actinium-225 and lead-212 deliver higher linear energy transfer across a shorter path than beta emitters, which offers better tumour cell killing with less damage to surrounding tissue. Pipeline activity has expanded sharply, with dozens of candidates in clinical development and several large acquisitions of alpha-focused developers completed since 2023. Supply is the whole problem: global actinium-225 availability supports only a fraction of trial demand, let alone commercial use. Production programmes at accelerator and reactor facilities are under construction to address exactly that shortage. Whether they finish on schedule decides this segment entirely.
Market Impact: Loses about 23% of produced activit

Market Restraints and Challenges

Research reactor concentration leaves diagnostic supply without redundancy

Most molybdenum-99, the parent of technetium-99m used in the majority of diagnostic procedures, comes from five ageing research reactors. The root cause is economic: isotope production was a byproduct of research programmes nobody funded commercially, and replacement capacity attracts investment only when shortage prices it properly. Outages since 2022 have each interrupted diagnostic supply within days, since nothing can be stockpiled. Mitigation is under way through accelerator-based and low-enriched uranium production entering service, and through generator designs that tolerate lower specific activity. None of that replacement capacity arrives quickly, and diagnostic volume stays exposed meanwhile.
Market Impact: Multiplies eligible patients by 3 t

Decay losses and flight dependence cap achievable geography

Roughly 23% of produced activity decays before administration, and the root cause is a half-life measured in hours to days against transit times measured the same way. A production site can serve only the centres reachable within the isotope's useful window, which means expanding into a new region requires building or contracting local manufacture rather than shipping further. Participants are addressing it by distributing production across regional sites, by contracting radiopharmacy networks and by scheduling batches around confirmed patient appointments rather than forecast demand. Geography is therefore a fixed constraint here.
Market Impact: Pairs 78% of therapy patients diagn
4 additional market trends, 3 additional growth drivers, and 2 additional restraints and challenges are covered in the full report. Contact sales@marketmindsadvisory.com to access the complete intelligence.

Segment CAGR and Growth Architecture

Segmentation follows the radioisotope and its emission class, because that determines production route, decay logistics, regulatory handling and whether the agent diagnoses or treats. Indication, care setting and distribution model all matter commercially but cut across isotopes, so they belong in later discussion. Six isotope classes cover the category without overlap between them. Production route decides everything.
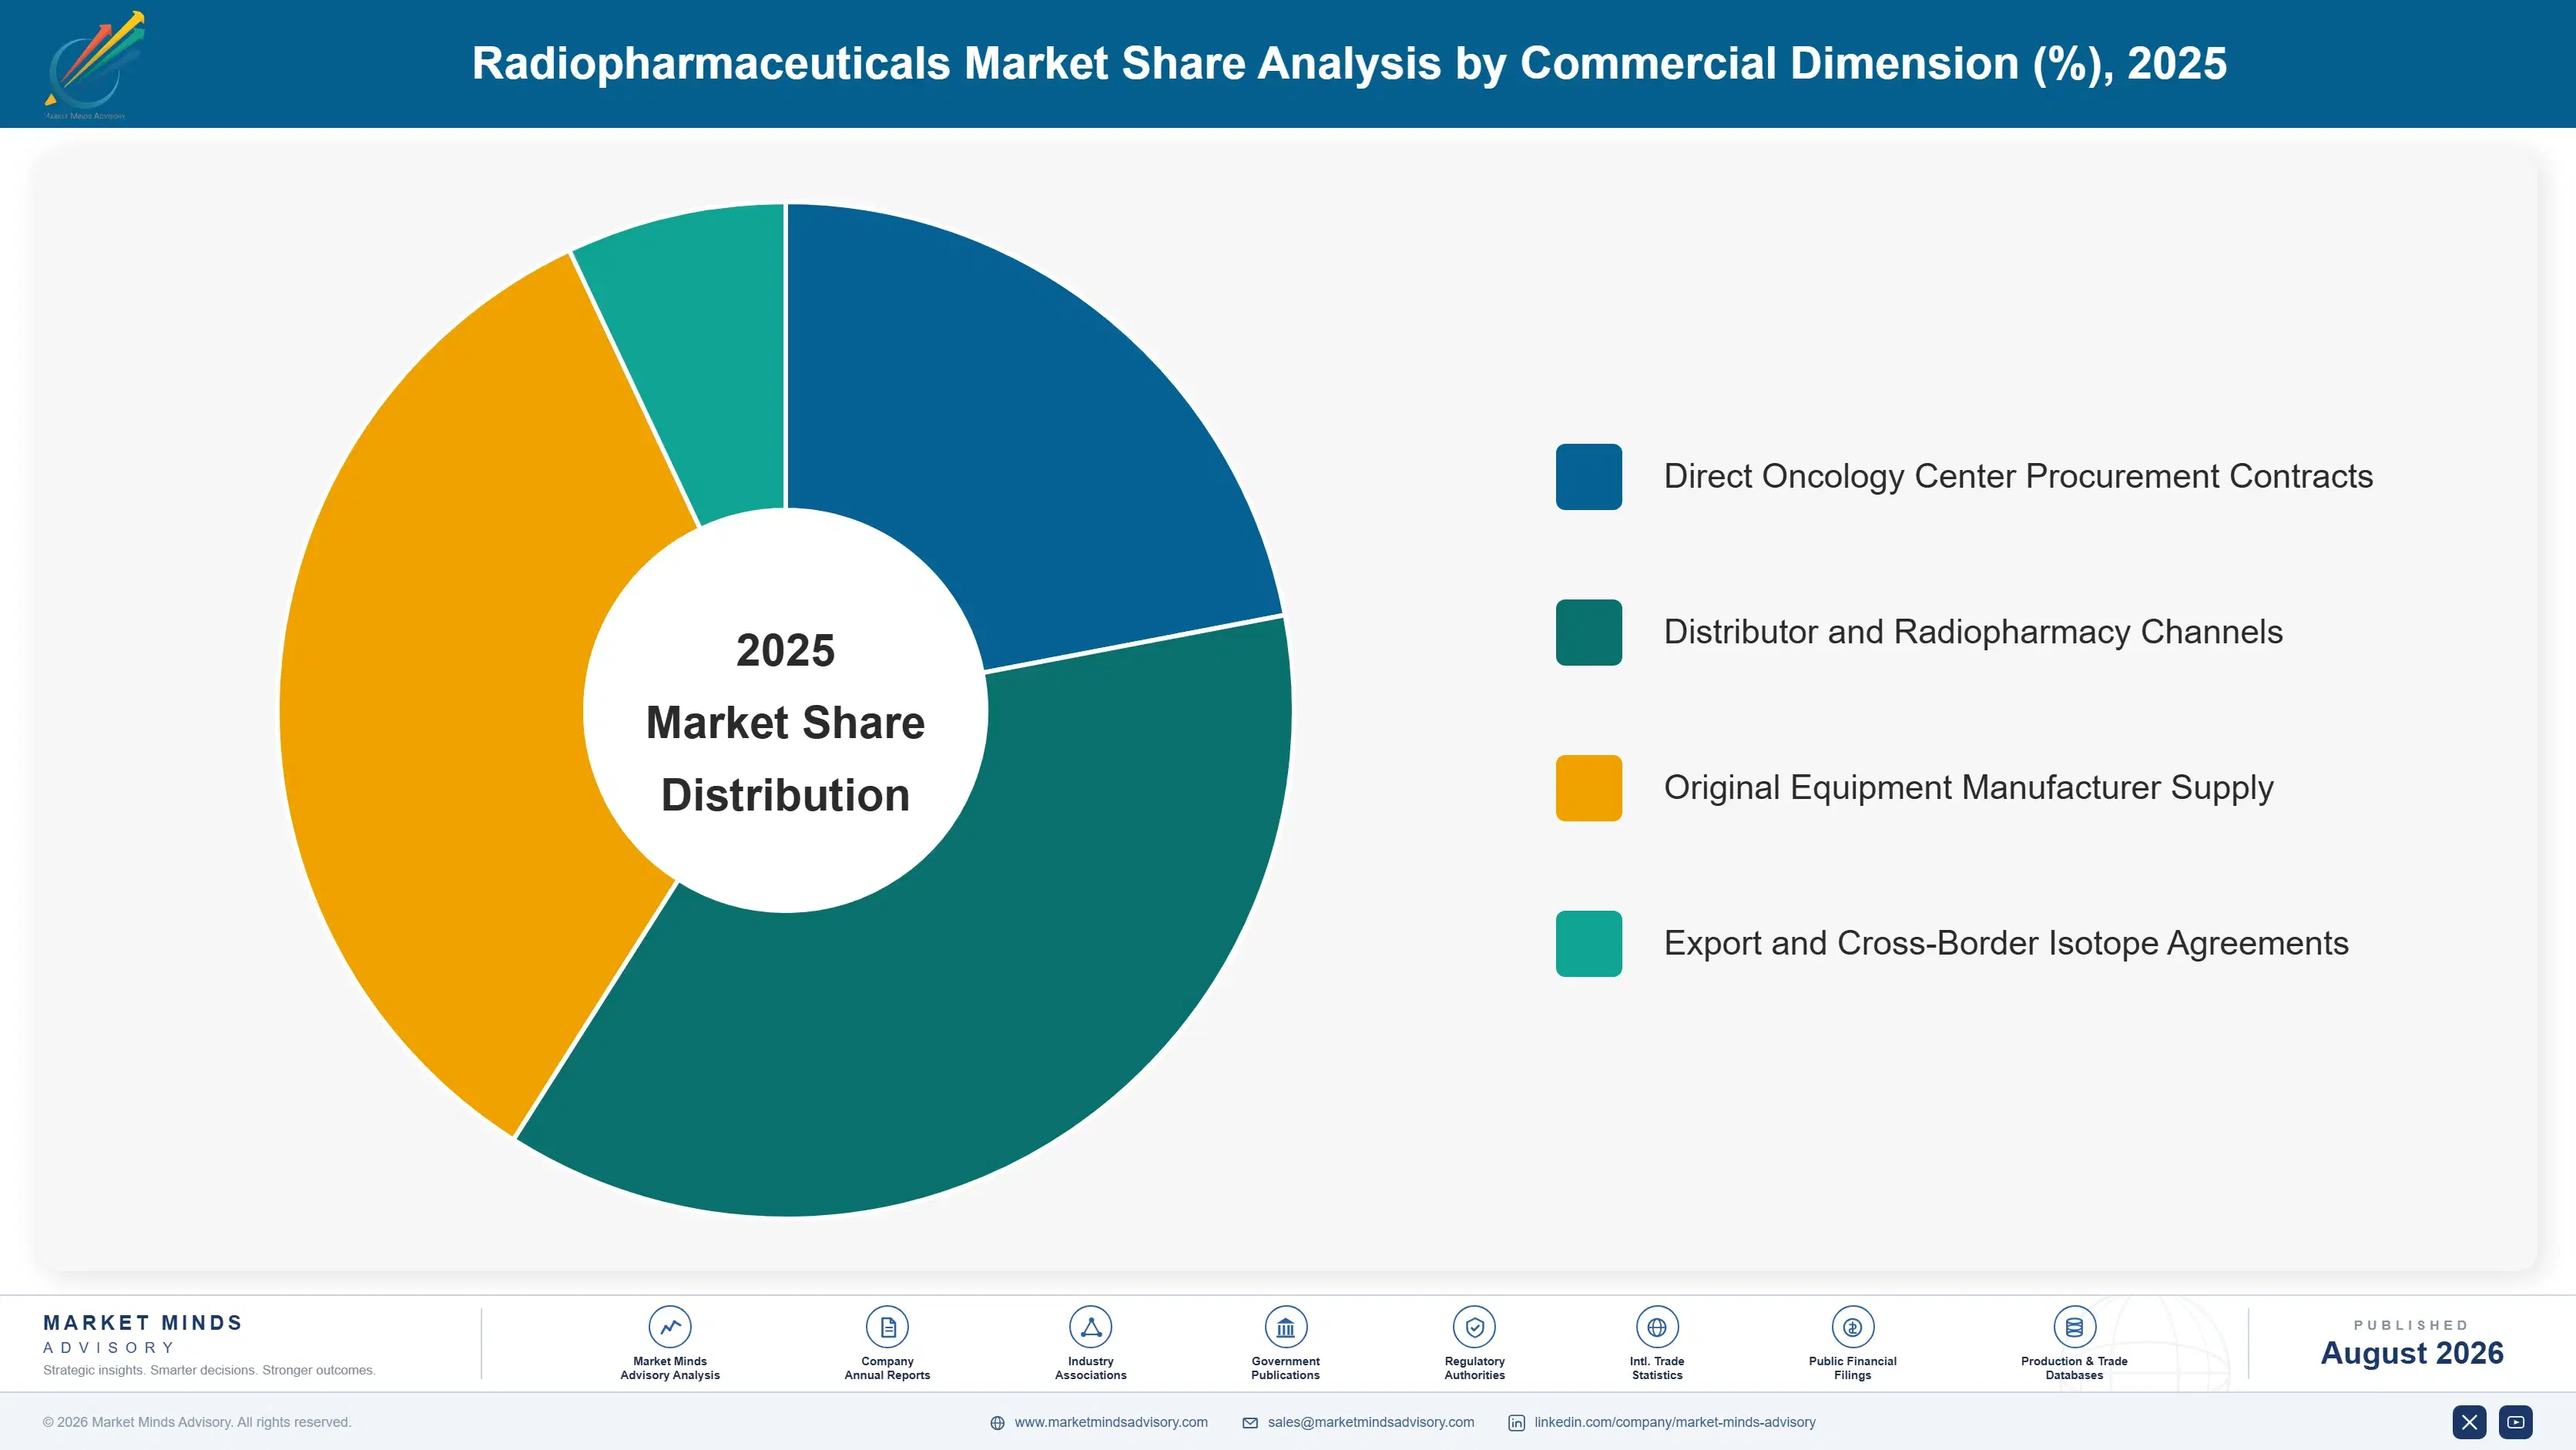
radiopharmaceuticals-market-market-share-analysis-1787309256078

Lutetium-177 Therapeutic Radioligands

Beta-emitting lutetium-177 conjugates targeting prostate-specific membrane antigen and somatostatin receptors grow at 15.6%, exactly 1.50 times the market rate, and they are already the largest revenue line in nuclear medicine. Three forces drive it. Sequence movement earlier in advanced prostate cancer multiplies eligible patients at each step. Neuroendocrine use continues expanding as centre capacity allows. And pricing near USD 47,000 per course reflects therapeutic rather than diagnostic value. The constraints are entirely industrial: enriched ytterbium target supply, reactor irradiation slots, labelling capacity within decay range of patients, and roughly 1,850 licensed centres against demand that already exceeds them in several markets. Allocation across centres is a routine commercial activity, which almost no oncology product requires.
CAGR 15.6%

Alpha-Emitting Therapeutics

Radium-223, actinium-225 and lead-212 agents grow at 14.2%, second fastest in the category, from a base that radium-223 alone has carried commercially for a decade. The clinical argument is genuinely strong: higher linear energy transfer across a few cell diameters kills tumour cells more efficiently while sparing surrounding tissue, and it works in disease that beta emitters treat poorly. Pipeline investment has followed, along with several acquisitions of alpha-focused developers. Supply is the entire commercial question. Global actinium-225 availability currently supports well under a tenth of trial demand, and production programmes at accelerator and reactor facilities will determine whether this segment scales or stalls. Pipeline investment has run well ahead of the supply behind it.
CAGR 14.2%
Full segment breakdown across 6 segments available in the complete report.

Regional Architecture and Country Demand Map

North America leads at 31% of spend on therapy pricing and imaging volume rather than isotope production, which sits in Europe. Western Europe holds 26% and the production base. East Asia holds 24%. South Asia and Pacific grows fastest at 12.7%. Eastern Europe produces more than it bills for.

North America

Thirty-one percent of global spend sits in North America, growing at 9.7%, and the position comes from therapy pricing and reimbursed imaging volume rather than from production. Note: almost all medical isotope supply reaching American patients originates in European or Canadian reactors, so the region leads on price and procedure count while depending on manufacturing it does not own. Radioligand therapy at roughly USD 47,000 per course is reimbursed under outpatient prospective payment, and centre licensing has expanded quickly through manufacturer-funded accreditation support. Nuclear pharmacy networks operating hundreds of compounding sites give the region distribution reach no other market matches. Canadian isotope production remains globally significant despite modest domestic consumption.
Share: 31% | CAGR: 9.7% (2026 to 2036)

Western Europe

Growth of 8.7% is the slowest of any region, and 26% of spend understates the region's importance because this is where the category is manufactured. Research reactors in the Netherlands, Belgium and Poland supply much of the world's molybdenum-99, and lutetium-177 labelling capacity is concentrated across Italian, Spanish and German sites. German nuclear medicine pioneered prostate-specific membrane antigen therapy years before regulatory approval existed, under named patient provisions. Health technology assessment has been slower to fund radioligand therapy than American reimbursement was, which caps value growth. Centre licensing is dense and well established, and radiation protection regulation is the most demanding anywhere. The region therefore carries industrial importance that its share of recorded spend understates considerably.
Share: 26% | CAGR: 8.7% (2026 to 2036)
Regional intelligence for 5 additional markets available in the complete report: East Asia, South Asia and Pacific, Latin America, Middle East and Africa, Eastern Europe. Contact sales@marketmindsadvisory.com.
radiopharmaceuticals-market-country-cagr-analysis-1787309256590

Four Ways Around the Industrial Constraint

Clinical demand for radioligand therapy already exceeds what production and licensed centres can deliver, which means the growth levers here are industrial and logistical rather than commercial. Each lever below addresses a physical constraint, and each carries a quantified return MMA has tested against disclosed nuclear medicine segment economics rather than assumed. None of them is a marketing lever.

Fund centre licensing and dosimetry training directly

Approved therapy that no nearby centre can administer generates nothing, and roughly 1,850 licensed centres worldwide fall short of current demand in several markets. Manufacturers funding licensing support, staff training and dosimetry capability convert unserved demand into recurring dose volume, and each newly authorised centre delivers ordered doses indefinitely rather than once. Centres receiving structured accreditation support reach steady-state dose volume roughly 40% faster than those left to navigate licensing alone. The cost per centre is modest against several years of dose revenue. Nobody else will do this work for you.
Market Impact: Reaches steady dose volume roughly

Distribute production to cut decay losses regionally

Roughly 23% of produced activity decays before administration, which is pure lost revenue on product already manufactured. Regional labelling sites within flight range of clustered centres recover much of that, and they also open geography that central production simply cannot reach within the useful window. Manufacturers operating multi-site networks report delivered activity yield roughly 12 points above single-site models. The capital and regulatory cost of each site is substantial, so this works where regional dose volume genuinely justifies it and nowhere else. Regional dose density is the only test worth applying.
Market Impact: Improves delivered activity yield b

Pair the diagnostic agent with the therapy deliberately

Around 78% of therapy patients are selected using a matched imaging agent, which means whoever supplies the diagnostic reaches the patient first and frames the treatment discussion. Manufacturers holding both agents convert selection scans to therapy at rates roughly 25% above therapy-only competitors relying on somebody else's imaging. Building or licensing the paired tracer is therefore a commercial decision rather than a portfolio one. Companies developing therapy alone are handing patient identification to a competitor and then hoping to receive the referral. Licensing a tracer is faster than developing one.
Market Impact: Lifts the scan-to-therapy conversio

Contract isotope supply and enrichment years forward

Enriched target material, reactor irradiation slots and accelerator time are all scarce, and actinium-225 availability currently supports well under a tenth of trial demand alone. Contracting supply and enrichment capacity three to five years forward is what separates programmes that launch on schedule from those that announce delays. Manufacturers holding forward capacity agreements have maintained supply through every reactor outage since 2022. The premium over spot arrangements runs perhaps 20%, which is negligible against an interrupted launch. Every manufacturer that maintained supply through the outages since 2022 already held forward agreements, which is not a coincidence.
Market Impact: Costs roughly 20% over spot supply

Who Controls the Margin Pool

Five manufacturers supply 66% of patient doses, the basis on which MMA assesses every participant here, and the ranking reflects production network geography as much as portfolio. Novartis leads on therapeutic radioligand volume and revenue by a wide margin. Curium and Lantheus hold the diagnostic base and the nuclear pharmacy distribution reach behind it.
Competitive activity runs along three lines. Production capacity is being built and acquired rather than contracted, since decay logistics make owned regional sites a competitive asset instead of a cost centre. Alpha emitter developers have been acquired aggressively by larger companies seeking the next mechanism. And centre licensing support has become a commercial function, with manufacturers funding accreditation because approved therapy needs somewhere to be administered.

Pressure is arriving from two directions. Chinese and Indian manufacturers are supplying domestic therapeutic demand at fractions of Western pricing, and their production capability is improving faster than most Western participants assume. Meanwhile isotope supply fragility affects everyone equally, and the manufacturers with contracted forward capacity have visibly outperformed through each outage. Rankings shift toward participants holding production, paired diagnostics and licensed centre relationships together, since any one alone leaves revenue on the table.
radiopharmaceuticals-market-company-positioning-matrix-1787309257114

Competitive Moat and Risk Dimensions

NOVARTIS

Moat: Radioligand production network scale

The company built manufacturing and labelling capacity across multiple continents ahead of demand, which is the only way to serve a product that decays in transit. That network reaches centres competitors cannot supply within the useful activity window. Combined with paired diagnostic agents and the largest licensed centre relationship base in therapy, it holds a position capital alone cannot replicate.
NOVARTIS

Risk: Concentration in two indications

Revenue depends heavily on prostate and neuroendocrine indications delivered by a single isotope class, which leaves the company exposed if alpha emitters prove superior in the same tumours. Several competitors are pursuing exactly that. Production assets optimised for lutetium-177 labelling transfer imperfectly to actinium-225 handling, so the network advantage does not carry across mechanisms automatically.
LANTHEUS

Moat: Diagnostic agent and pharmacy reach

The company holds leading positions in prostate-specific membrane antigen imaging and supplies through nuclear pharmacy networks operating hundreds of compounding sites, which reaches patients before any therapy decision is made. Around 78% of therapy patients are selected on a matched scan, so controlling the diagnostic controls patient identification. That position generates referral influence disproportionate to its revenue.
LANTHEUS

Risk: Therapeutic portfolio still developing

Diagnostic agents carry a fraction of the revenue per patient that therapy commands, and the company's therapeutic pipeline is less advanced than its imaging franchise. It identifies patients whose therapy revenue mostly accrues to somebody else. Closing that gap requires either acquisition at prices the alpha emitter competition has already inflated, or development timelines measured in years.

Players Tracked

Prominent Players

Novartis
Curium
Lantheus
Telix Pharmaceuticals
Bayer

Other Key Players

GE HealthCare
Bracco Imaging
Cardinal Health
Jubilant Radiopharma
Eczacibasi-Monrol
Nihon Medi-Physics
POLATOM
Isotopia Molecular Imaging
Eckert & Ziegler
RadioMedix
Perspective Therapeutics
Clarity Pharmaceuticals
ITM Isotope Technologies Munich
NorthStar Medical Radioisotopes
Sinotau Pharmaceutical

Recent Developments

MARCH 2025

Novartis commissioned additional radioligand production capacity in the United States

The company brought new labelling and quality release capacity into service, shortening transit distance to American treatment centres and reducing decay losses on doses previously supplied from Europe. It was an organic capacity expansion rather than an acquisition, and it addresses the geographic constraint directly rather than commercially.
Signal: Production geography is now being treated
AUGUST 2025

Telix acquired an isotope production and enrichment business

The acquisition brings target enrichment and isotope processing capability in house, addressing a supply dependency that had constrained the company's therapeutic programmes. Terms were partially disclosed. It was an outright acquisition rather than a supply agreement or joint venture, which indicates how scarce the capability is.
Signal: Isotope supply capability is now being bou
DECEMBER 2025

Lantheus signed manufacturing and distribution agreement with nuclear pharmacy network

The agreement covers compounding and same-day distribution of positron emission agents across several hundred sites, extending reach to centres the company could not supply within decay windows directly. It is a supply and distribution agreement rather than an acquisition or joint venture, with volume commitments across the term.
Signal: Distribution contracts can still substitut

Targets, Irradiation and Air Freight

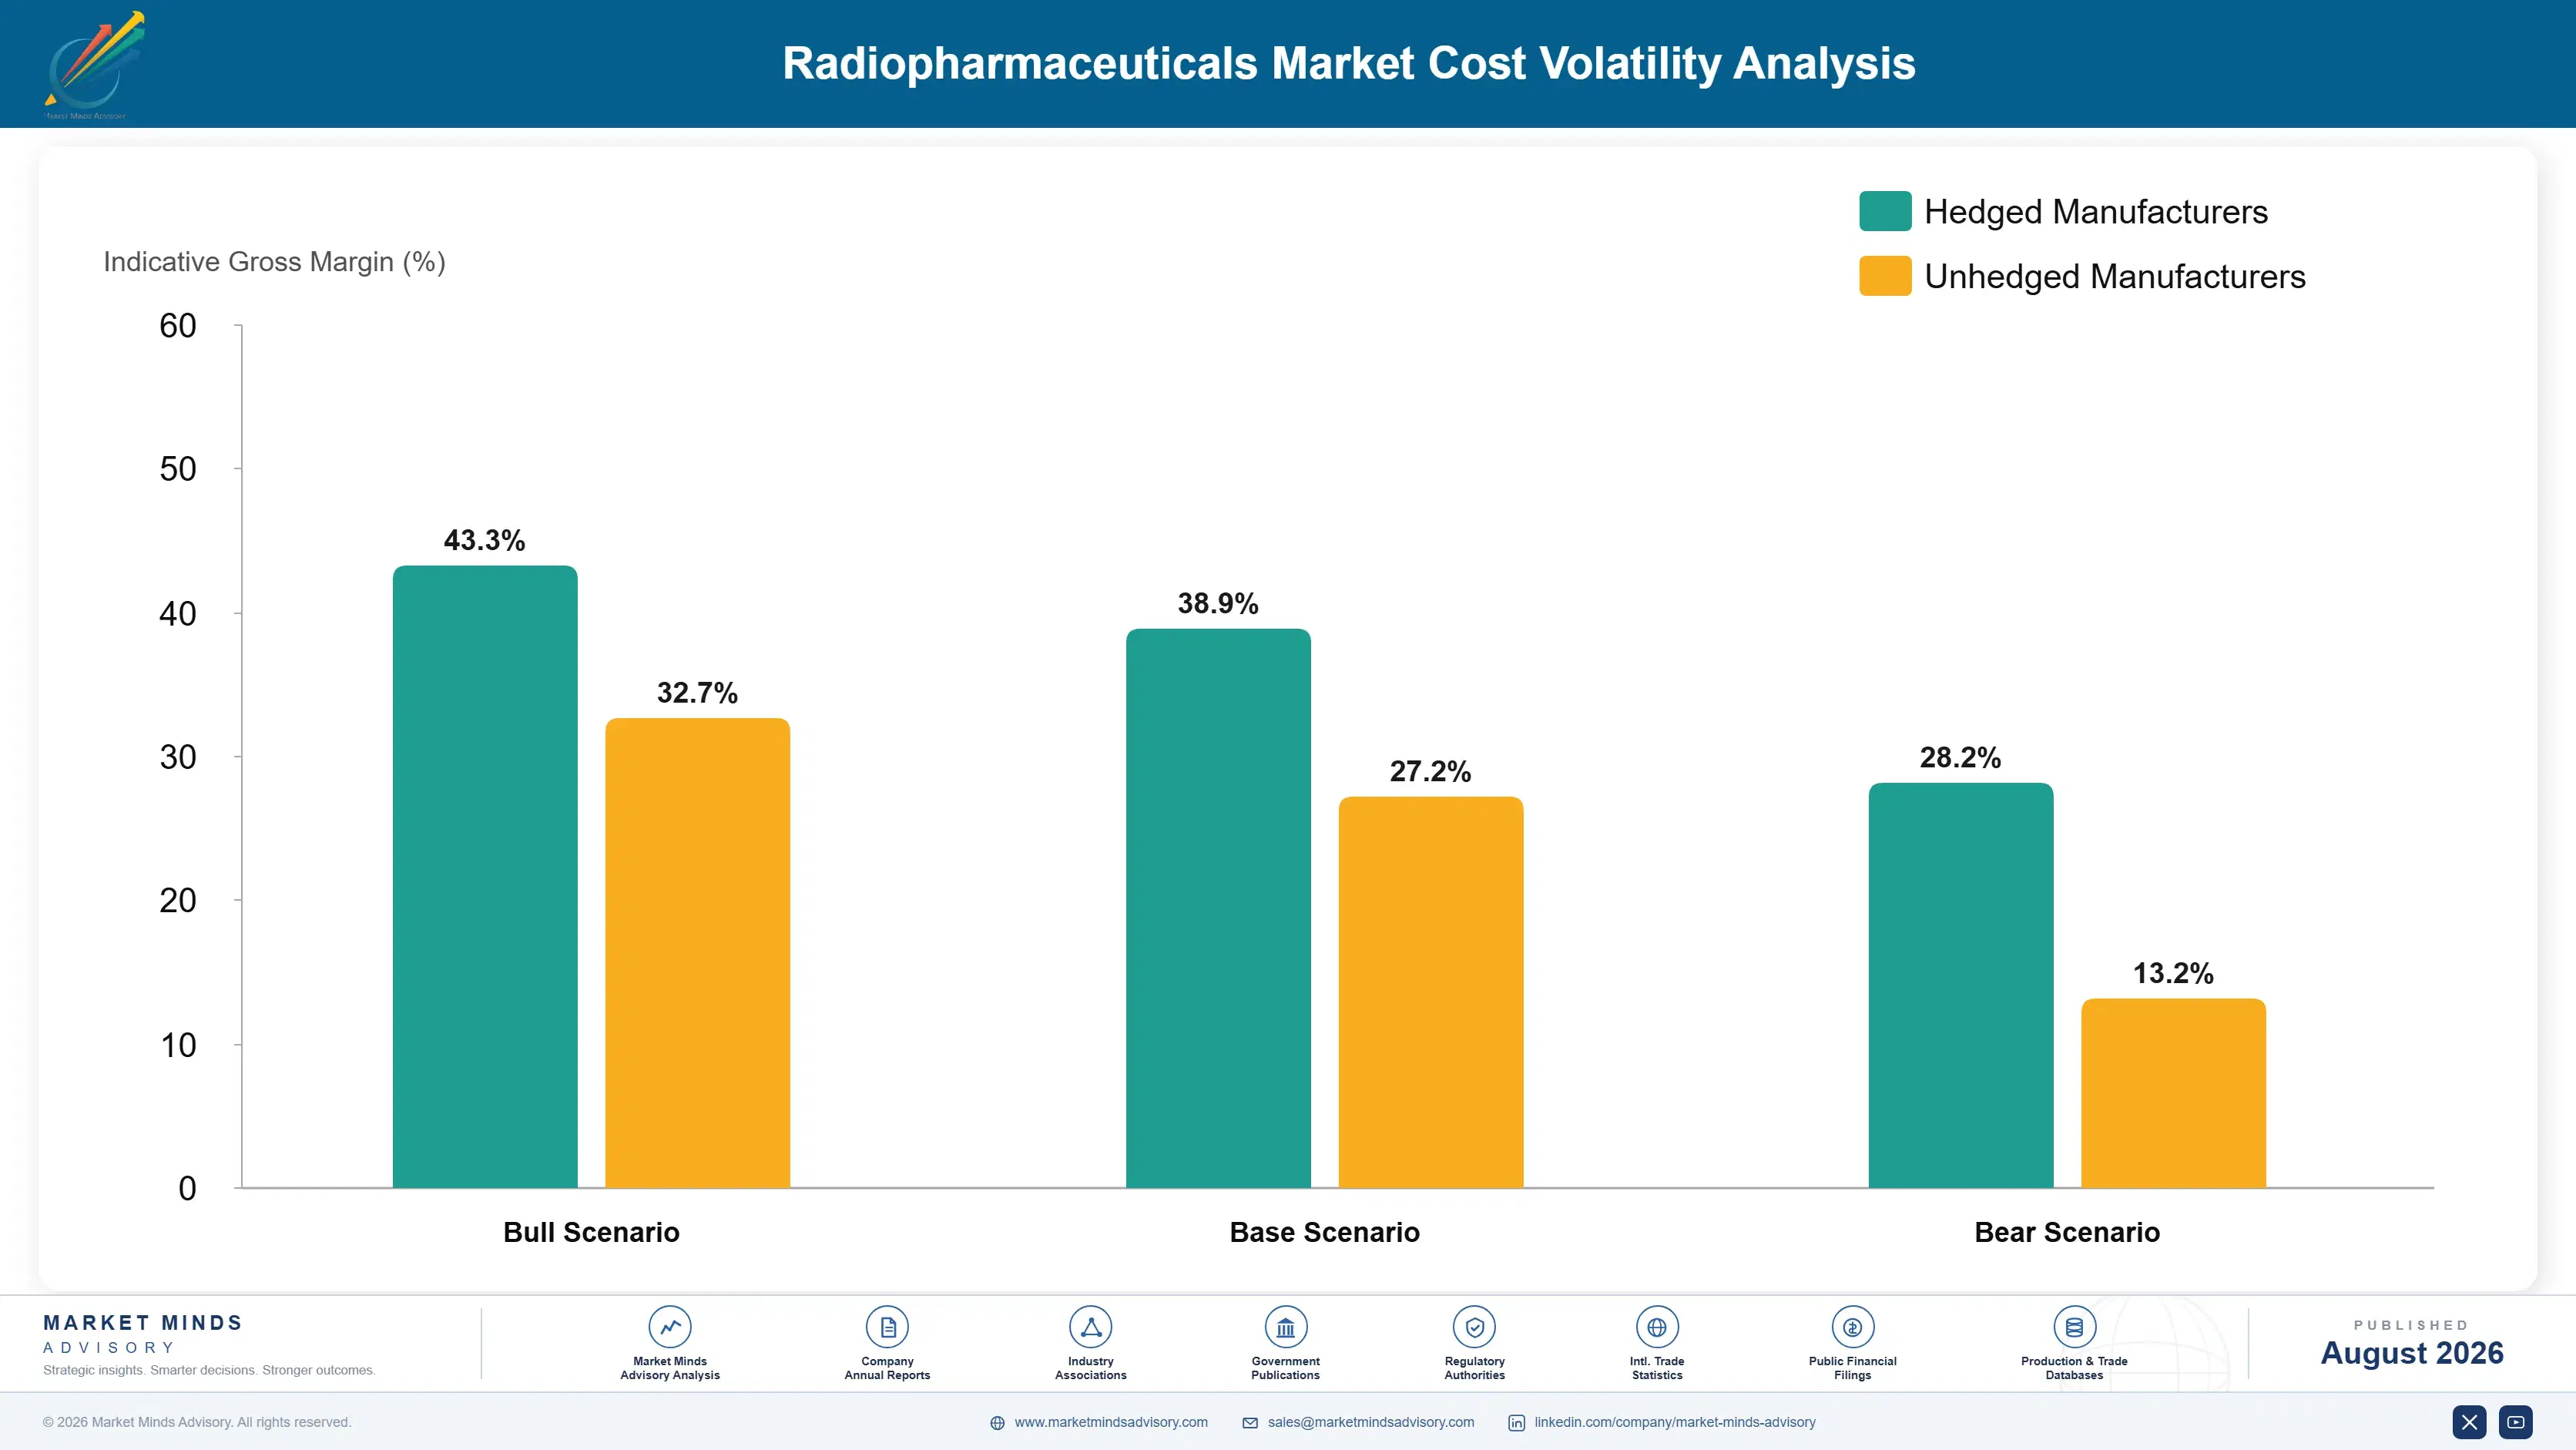
Cost of goods here is dominated by inputs no other pharmaceutical category worries about. Enriched target material, principally ytterbium-176 for lutetium production, accounts for roughly 19% of therapeutic dose cost and comes from a handful of enrichment facilities worldwide. Reactor irradiation or accelerator time adds 14%. Time-critical air freight contributes 11%, and decay losses near 23% act as a cost nobody invoices for.
Reactor outages since 2022 demonstrated how completely this cost base can stop being a cost and become an availability problem instead. European Commission supply reporting documented repeated interruptions at facilities carrying most molybdenum-99 output, and departments rescheduled procedures within days because nothing here can be stockpiled. Lantheus and Curium both disclosed supply disruption effects in annual reports covering that period. The impact was lost procedure volume rather than higher cost, unrecoverable once the appointment passed.

Exposure varies by supply contracting and production footprint, and the mechanism is allocation during scarcity. Manufacturers holding forward irradiation and enrichment agreements continued supplying through each outage while spot buyers were rationed. Multi-site labelling networks lost less activity to decay when routing changed. Single-site producers dependent on one reactor faced both problems at once, which is where most smaller developers still sit.
radiopharmaceuticals-market-cost-volatility-analysis-1787309257308

Contract irradiation and enrichment three to five years forward

Spot purchasing of irradiation slots and enriched targets leaves a manufacturer rationed behind whoever holds contracted capacity, which is exactly what happened during each reactor outage since 2022. Forward agreements cost a premium of perhaps 20% and convert an availability risk into a known cost. Every manufacturer that maintained supply through those outages held them already.

Schedule batches against confirmed patient appointments

Producing to forecast in a category where product decays guarantees waste, and roughly 23% of activity is already lost in transit before any scheduling error compounds it. Batch release timed against confirmed appointment slots rather than projected demand cuts waste measurably, and it requires ordering systems integrated with treatment centre scheduling that most manufacturers still lack.

Qualify accelerator-based production alongside reactor supply

Accelerator routes to molybdenum-99 and several therapeutic isotopes avoid research reactor dependence entirely, and capacity is entering service now. Qualifying a second production route costs validation work and regulatory notification measured in quarters. It also removes the exposure that has interrupted diagnostic supply repeatedly, which no commercial arrangement resolves. Commercial arrangements cannot fix a reactor that is offline.

Portfolio Architecture for Margin Defence

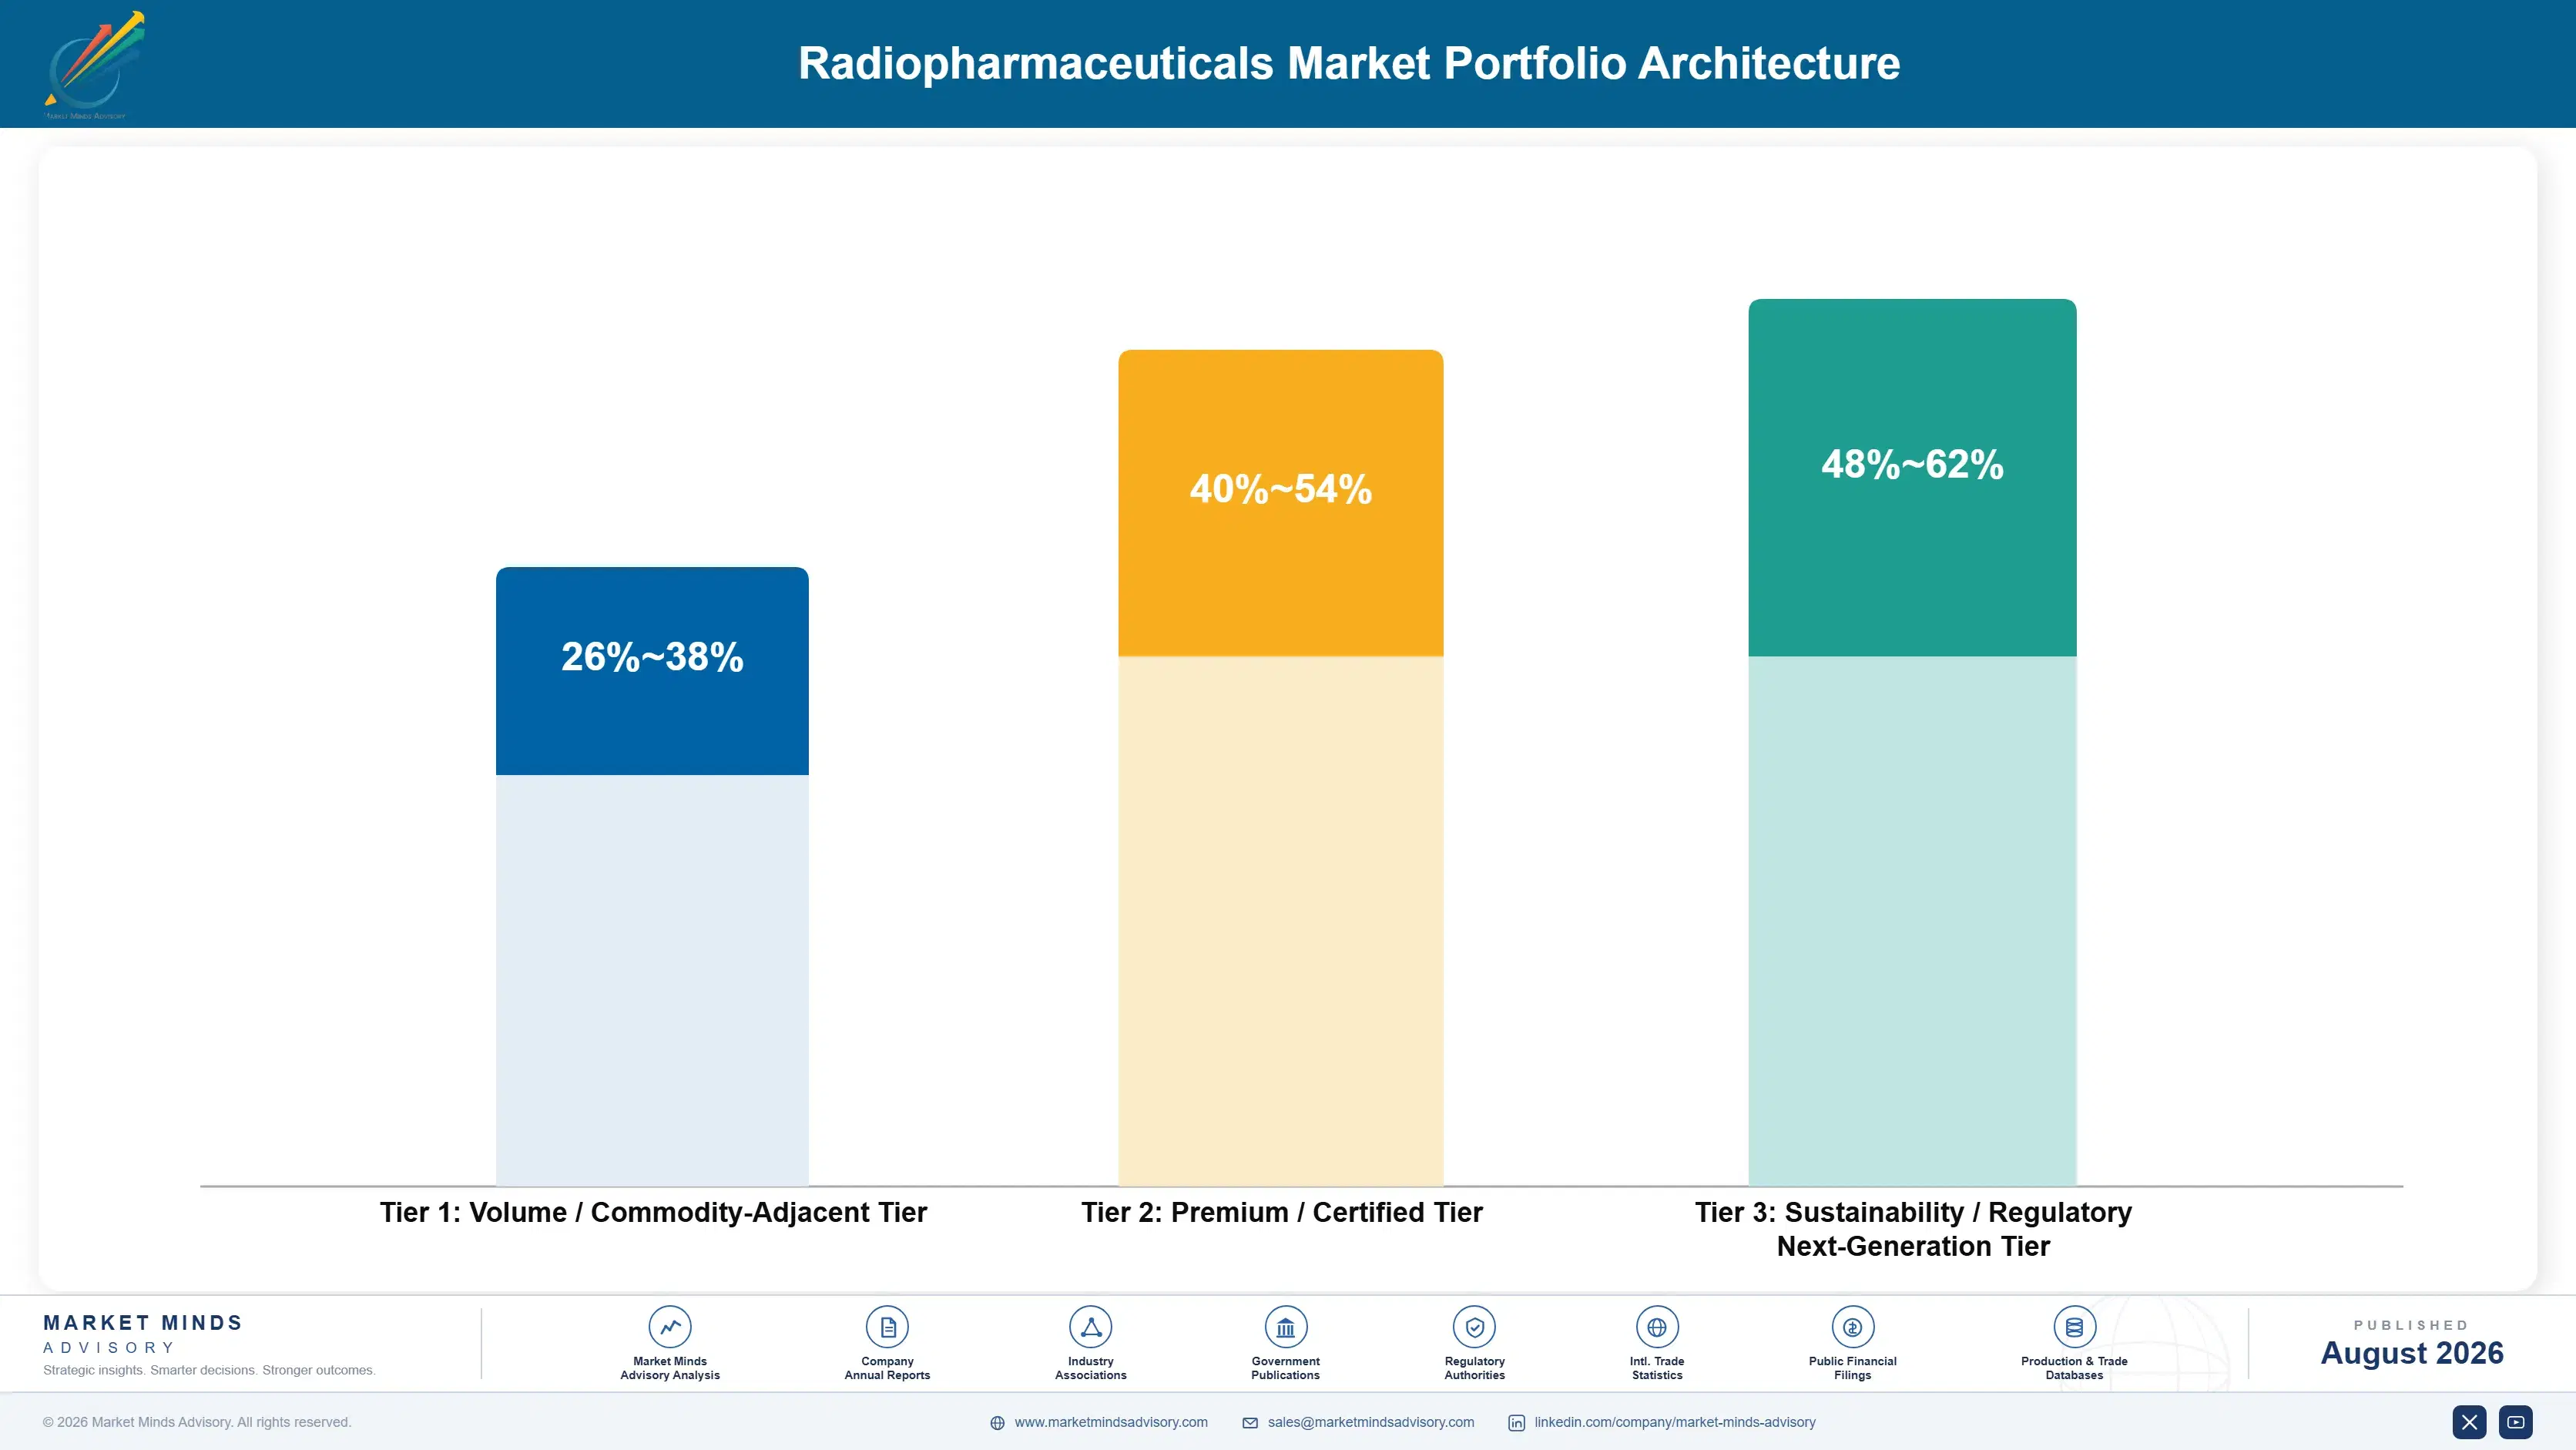
Portfolio economics separate on emission class and production difficulty rather than on indication. Technetium-based diagnostic kits earn gross margin in the high thirties, squeezed between reimbursement that has not moved in years and isotope supply that keeps repricing upward. Positron emission agents earn considerably more, helped by same-day pharmacy distribution that limits competition geographically. Therapeutic radioligands earn most of all, though decay losses and cold chain freight cons
The tension is that diagnostic volume funds the distribution network while therapy generates the return, and the two travel through the same infrastructure. A manufacturer abandoning diagnostic agents loses the nuclear pharmacy reach and the referral position that theranostic pairing depends on. Several have discovered that the diagnostic business nobody wanted was the thing that made the therapeutic business reachable, which is an expensive lesson to learn late.

High-value pools concentrate in three places: therapeutic radioligands where licensed centre relationships already exist, paired diagnostic agents that select therapy patients, and alpha emitters once supply scales. None is large in dose volume. Each is defended by production capability or centre access rather than by clinical data alone.

Volume / Commodity-Adjacent Tier

Technetium-99m diagnostic kits and iodine-131 therapeutic agents, carrying most procedure volume in nuclear medicine at reimbursement rates largely unchanged for years. Margin depends on generator cost and pharmacy utilisation, and isotope supply interruptions hit this tier hardest of all.
Gross Margin: 34-42%

Premium / Certified Tier

Fluorine-18, gallium-68 and copper-64 positron emission agents distributed through same-day radiopharmacy networks. Margin comes from geographic exclusivity within decay range rather than from formulation, and the ten-point range reflects wide variation between dense urban networks and marginal outlying sites.
Gross Margin: 54-64%

Sustainability / Regulatory / Next-Generation Tier

Lutetium-177 radioligands and alpha-emitting therapeutics, together with lower-enriched-uranium and accelerator-produced isotope routes that regulators increasingly prefer. The thirteen-point range reflects the gap between established beta therapy and alpha agents still recovering production investment.
Gross Margin: 68-81%
radiopharmaceuticals-market-portfolio-architecture-1787309257800

High-value Sub-segments and Strategic Watch-out

Lutetium-177 therapeutic radioligands

The largest and fastest-growing revenue pool at 15.6%, constrained by target supply, irradiation slots and roughly 1,850 licensed centres rather than by clinical demand anywhere. Sequence movement earlier keeps multiplying eligible patients. Production capacity decides who captures that. Capacity, not clinical argument, decides who captures that growth.
Gross Margin: 72-81%

Paired diagnostic selection agents

Around 78% of therapy patients are identified on a matched scan, which gives the diagnostic supplier first contact and referral influence well beyond its own revenue. Same-day distribution limits competition geographically. Holding both agents converts scans to therapy far more reliably. First contact is worth more than the tracer revenue.
Gross Margin: 56-64%

Technetium diagnostic base volume

Still the largest procedure volume in nuclear medicine, earning little against static reimbursement and rising isotope cost. It funds the pharmacy network that everything profitable travels through. Abandoning it costs the distribution reach therapy revenue quietly depends upon. Static reimbursement against rising isotope cost is a slow squeeze.
Gross Margin: 34-42%

Alpha emitter supply shortfall

Actinium-225 availability currently supports well under a tenth of trial demand, let alone commercial use, which makes this a production problem wearing a clinical opportunity's clothing. Pipeline investment has run far ahead of supply. Capacity under construction determines the timeline entirely. Timelines here belong to engineers, not clinicians.
Gross Margin: 68-78%

How Dose Demand Actually Recurs

The annuity here attaches to the licensed centre rather than to the patient. A therapy course is four to six doses over several months and then it ends, so patient-level recurrence is limited. What recurs is centre ordering: an authorised centre with a functioning referral pathway orders doses continuously, and roughly 1,850 such centres worldwide represent the demand base. What varies is whether a manufacturer helped that centre obtain its licence, because the accreditation relationship shapes
Adoption depth varies sharply by centre type. Academic nuclear medicine departments with dosimetry capability adopt therapeutic radioligands deepest and take on the most complex cases. Large private oncology networks adopt quickly where reimbursement supports it and licensing is achievable. General hospital nuclear medicine departments adopt diagnostics fully and therapy rarely, because radiation handling and isolation requirements exceed what their facilities allow. Centres in cost-constrained markets adopt domestic agents almost exclusively, at prices imports cannot approach.

Buyer profiles are shifting as nuclear medicine changes character. Physicians trained in the last decade expect to treat rather than only to image, and they push their institutions toward therapeutic licensing. Their predecessors built careers on diagnostic interpretation and rarely sought administration authorisation at all.
radiopharmaceuticals-market-end-use-penetration-index-1787309258287

What We Would Do Here

These are among the four positions where our research anticipates prominent divergence between winners and laggards over the coming forecast period. Each is grounded in the demand model, the regulatory perimeter, and the announced capacity pipeline.
01 / CENTRE LICENSING INVESTMENT

Fund accreditation because approved therapy needs somewhere to go

Roughly 1,850 licensed centres worldwide already fall well short of demand across several markets, and an approved therapy with no nearby authorised centre generates precisely nothing at all, however good its data. Centres receiving structured licensing and dosimetry support reach steady-state ordering roughly 40% faster than those left to work the process out alone. The cost per centre is small against several years of recurring dose revenue, and the relationship formed during accreditation shapes ordering for years after the licence itself is issued.
02 / PRODUCTION GEOGRAPHY STRATEGY

Build regional labelling sites, not larger central ones

Roughly 23% of all produced activity decays before it is ever administered, which is revenue lost on product already manufactured, released and paid for. Multi-site networks deliver activity yield roughly 12 points above single-site models, and they reach geography that central production physically cannot serve at all. The capital and regulatory cost per site is substantial, so the discipline required is building only where regional dose volume genuinely justifies a site, rather than wherever a market map happens to suggest one.
03 / THERANOSTIC PAIRING OWNERSHIP

Own the diagnostic that selects your therapy patients

Around 78% of therapy patients are identified on a matched imaging agent, so whoever supplies the scan reaches that patient first and frames the treatment discussion before any therapy decision is taken. Manufacturers holding both agents convert selection scans into therapy roughly 25% more often than therapy-only competitors manage. Developing a therapy alone means handing patient identification straight to a competitor and then hoping the referral arrives, which is a strategy in name only, and an expensive one to persist with.
04 / FORWARD SUPPLY CONTRACTING

Contract isotope capacity years before the programme needs it

Enriched targets, irradiation slots and accelerator time are all genuinely scarce, and actinium-225 availability currently supports well under a tenth of trial demand on its own. Forward agreements cost perhaps 20% over spot arrangements, and they are the whole difference between launching a programme on schedule and announcing a delay. Every manufacturer that kept supplying through the reactor outages since 2022 already held such agreements, which is not a coincidence that anybody should need to have explained to them twice.

Engagement Snapshot From the Field

A live engagement with an industry participant carrying material or product regulatory and market exposure ahead of a defining policy shift, showing how our research translates into a defensible multi-year portfolio strategy.
MARKET MINDS ADVISORY · CLIENT ENGAGEMENT SUMMARY
Radiopharmaceuticals Producer Strategic Portfolio Review and Transition Roadmap 2026·Investment Scenario on Radiopharmaceuticals Exposure Evaluation 2025-26
CLIENT PROFILE
A clinical-stage radiopharmaceutical developer with a lutetium-177 therapeutic candidate approaching regulatory submission, funding of roughly USD 340 million raised to date (client-reported, unverified by MMA), a single contracted European labelling site, and no paired diagnostic agent. The company held strong clinical data in a solid tumour indication, a commercial plan modelled on conventional oncology launch assumptions, and no isotope supply agreement beyond the following two years.
STRATEGIC CHALLENGE
The board had approved a commercial build modelled on a conventional specialty oncology launch, with field force sizing based on treating oncologist numbers. Management had not established how many centres could physically administer the product, nor whether contracted labelling capacity could reach them within decay windows. Isotope supply beyond 2027 remained uncontracted while competitors were signing multi-year agreements.
MMA APPROACH
MMA mapped every licensed therapeutic administration centre across the target launch markets against the contracted labelling site's achievable delivery radius, then modelled deliverable doses per week rather than eligible patients. Forty-seven expert interviews with nuclear medicine physicians, radiopharmacy directors and isotope suppliers established what licensing and training each centre would require. Available enrichment and irradiation capacity was traced against competitor forward commitments already in place.
KEY FINDINGS
  1. Only 34 licensed centres sat within achievable delivery range of the contracted labelling site, against a commercial plan built on treating oncologist numbers that implied several hundred addressable accounts.
  2. Deliverable dose capacity was roughly a fifth of forecast demand in year two, meaning the planned field force would generate demand the company could not physically supply for at least three years.
  3. Competitors had contracted enrichment and irradiation capacity through 2030, leaving the client bidding for residual availability at prices well above the forward agreements it had declined earlier.
  4. No paired diagnostic agent meant patient selection would run on a competitor's imaging product, handing first contact and referral influence to a company with its own therapy in development.
CLIENT PROFILE
A clinical-stage radiopharmaceutical developer with a lutetium-177 therapeutic candidate approaching regulatory submission, funding of roughly USD 340 million raised to date (client-reported, unverified by MMA), a single contracted European labelling site, and no paired diagnostic agent. The company held strong clinical data in a solid tumour indication, a commercial plan modelled on conventional oncology launch assumptions, and no isotope supply agreement beyond the following two years.
STRATEGIC CHALLENGE
The board had approved a commercial build modelled on a conventional specialty oncology launch, with field force sizing based on treating oncologist numbers. Management had not established how many centres could physically administer the product, nor whether contracted labelling capacity could reach them within decay windows. Isotope supply beyond 2027 remained uncontracted while competitors were signing multi-year agreements.
MMA APPROACH
MMA mapped every licensed therapeutic administration centre across the target launch markets against the contracted labelling site's achievable delivery radius, then modelled deliverable doses per week rather than eligible patients. Forty-seven expert interviews with nuclear medicine physicians, radiopharmacy directors and isotope suppliers established what licensing and training each centre would require. Available enrichment and irradiation capacity was traced against competitor forward commitments already in place.
KEY FINDINGS
  1. Only 34 licensed centres sat within achievable delivery range of the contracted labelling site, against a commercial plan built on treating oncologist numbers that implied several hundred addressable accounts.
  2. Deliverable dose capacity was roughly a fifth of forecast demand in year two, meaning the planned field force would generate demand the company could not physically supply for at least three years.
  3. Competitors had contracted enrichment and irradiation capacity through 2030, leaving the client bidding for residual availability at prices well above the forward agreements it had declined earlier.
  4. No paired diagnostic agent meant patient selection would run on a competitor's imaging product, handing first contact and referral influence to a company with its own therapy in development.
RECOMMENDED STRATEGY
Phase 1: Phase 1 (0 to 6 months): Halve the planned field force, contract enrichment and irradiation capacity immediately at whatever premium is available, and begin centre licensing support. Phase 2: Phase 2 (6 to 18 months): Contract a second regional labelling site within range of clustered licensed centres, and license a paired diagnostic tracer rather than developing one. Phase 3: Phase 3 (18 to 36 months): Fund accreditation for 40 additional centres in target markets, sequencing launch geography to labelling capacity rather than to patient numbers.
OUTCOME
The commercial build was resized and the saving redirected into supply contracting and centre development. Enrichment capacity was secured through 2031, at roughly 24% above the terms available a year earlier (client-reported, unverified by MMA). A paired diagnostic licence was signed. Addressable licensed centres rose from 34 to 61 before submission was filed.

Frequently Asked Questions

Foundational context covering the market sizes, CAGR, scope, country, region and competition that inform every finding below. This section is provided to cover basics and most often pre-purchase conversations, answered from the MMA Primary Research Dataset.

What is the current size of the Radiopharmaceuticals Market?

MMA sizes the global radiopharmaceuticals market at USD 8.9 billion in 2025, rising to USD 9.83 billion in 2026. That covers diagnostic and therapeutic radioactive agents at realised price per patient dose.

How large will the Radiopharmaceuticals Market be by 2036?

MMA forecasts USD 26.44 billion by 2036, an expansion multiple of 2.69 times the 2026 base. That represents roughly USD 16.61 billion of incremental value over the forecast period.

What is the CAGR for the Radiopharmaceuticals Market 2026 to 2036?

The base case compounds at 10.4% annually, with a bull case of 11.6% and a bear case of 9.2%. Production capacity and licensed centre expansion decide which case materialises.

Which segment is growing fastest?

Lutetium-177 therapeutic radioligands compound at 15.6%, exactly 1.50 times the market rate. Movement earlier in treatment sequences multiplies eligible patients faster than production capacity can scale.

Who are the major companies in the Radiopharmaceuticals Market?

Novartis, Curium, Lantheus, Telix Pharmaceuticals and Bayer together supply 66% of patient doses. Fifteen further participants including GE HealthCare, Eckert & Ziegler, ITM and Sinotau Pharmaceutical are profiled.

Which country is growing fastest?

India compounds at 13.3%, ahead of every other national market MMA tracks. Domestic isotope production and therapy delivered at a fraction of Western course cost drive that growth.

Report Segmentation Architecture

The full report scope spans multiple orthogonal segmentation dimensions, with cross-tabulated demand data provided for each dimension pair. Coverage extends further to regional breakdowns, trend trajectories, and the competitive detail needed to support segment-level decision-making.

By Radioisotope and Emission Class

  • Technetium-99m Diagnostic Agents
  • Fluorine-18 Positron Emission Agents
  • Gallium-68 and Copper-64 Agents
  • Lutetium-177 Therapeutic Radioligands
  • Alpha-Emitting Therapeutics
  • Iodine-131 and Legacy Therapeutic Agents

By End-Use Setting

  • Academic Nuclear Medicine Departments
  • Private Oncology Networks
  • General Hospital Nuclear Medicine
  • Dedicated Theranostic Centres
  • Public Cancer Institutes

By Supply and Distribution Model

  • Owned Regional Labelling and Distribution
  • Nuclear Pharmacy Network Compounding
  • Direct Reactor and Generator Supply
  • On-Site Cyclotron Production

By Region

  • North America
  • Western Europe
  • East Asia
  • South Asia and Pacific
  • Latin America
  • Middle East and Africa
  • Eastern Europe

Scope, Methodology, and Coverage

Every figure in this report is reproducible from documented input assumptions. The scope below maps the historical period, the forecast horizon, the segmentation dimensions, and the countries covered, alongside the underlying primary and qualitative methodology.
Historical Period
2020 to 2025
Forecast Period
2026 to 2036
Base Year
2025 (USD billions; MMA Primary Research Dataset, August 2026)
Market Definition
The market comprises radioactive pharmaceutical agents administered to patients for diagnosis or therapy, spanning technetium-99m diagnostic kits, fluorine-18 positron emission agents, gallium-68 and copper-64 agents, lutetium-177 therapeutic radioligands, alpha-emitting therapeutics including radium-223, actinium-225 and lead-212, and iodine-131 and legacy therapeutic agents. Sizing is at manufacturer or radiopharmacy realised price per patient dose, including nuclear pharmacy compounding revenue. Imaging equipment, cyclotrons and generators sold as capital, non-radioactive contrast media, dosimetry software, external beam radiotherapy and professional fees are outside scope.
Quantitative Units
USD billions (current prices); patient doses supplied annually; USD per dose or per treatment course
Segmentation Dimensions
By Radioisotope and Emission Class; By End-Use Setting; By Supply and Distribution Model; By Region
Regions Covered
North America, Western Europe, East Asia, South Asia and Pacific, Latin America, Middle East and Africa, Eastern Europe
Countries Covered
USA, China, Germany, France, UK, Japan, South Korea, India, Australia, Canada, Brazil, Mexico, Indonesia, Vietnam, Thailand, Malaysia, UAE, Saudi Arabia, South Africa, Nigeria, Turkey, Poland, Netherlands, Italy, Spain, Sweden, Switzerland, Argentina, Colombia, Singapore, and additional markets relevant to this sector
Key Companies Profiled
Novartis, Curium, Lantheus, Telix Pharmaceuticals, Bayer, GE HealthCare, Bracco Imaging, Cardinal Health, Jubilant Radiopharma, Eczacibasi-Monrol, Nihon Medi-Physics, POLATOM, Isotopia Molecular Imaging, Eckert & Ziegler, RadioMedix, Perspective Therapeutics, Clarity Pharmaceuticals, ITM Isotope Technologies Munich, NorthStar Medical Radioisotopes, Sinotau Pharmaceutical.
Quantitative Methodology
Primary survey, n=3,800 respondents, Q4 2025, six countries; demand-side model with trade association cross-validation
Qualitative Methodology
47 expert interviews, Q4 2025; applied to validate demand model assumptions, identify emerging dynamics, and assess competitive positioning
Report Format
PDF and XLSX data workbook (Word format preview document)
Publisher
Market Minds Advisory
Report Code
MMA-2026-HLT-067
Published
August 2026
Contact
sales@marketmindsadvisory.com | www.marketmindsadvisory.com

Purchase the full Radiopharmaceuticals Market Report (2026 to 2036).

The full report sizes the radiopharmaceuticals market across six isotope and emission classes, five care settings, four supply models and seven regions, with annual forecasts to 2036 in revenue and patient doses. It models deliverable dose capacity against licensed centre geography rather than eligible patient counts, which is the calculation that actually bounds revenue in this category. Twenty participants are assessed on a consistent patient dose basis, with production network footprint and forward isotope contracting mapped separately from portfolio. Decay losses are quantified by route and region, and alpha emitter supply capacity is traced against pipeline demand through 2036.
Six isotope classes sized and forecast annually
Deliverable capacity modelled against licensed centre geography
Twenty participants on consistent patient dose basis
Production networks and forward contracting mapped separately
Decay losses quantified by route and region
Alpha emitter supply traced against pipeline demand

Built For The People Who Decide

From boardroom strategy to bench-side execution, this report is read cover-to-cover by leaders shaping the next decade of their industry, turning demand scenarios, market dynamics and valuation benchmarks into decisions.
CXOs/ Presidents/ VPs/ Managers
M&A and Corporate Development
Strategy Teams and R&D Heads
Procurement and Product Directors
Regulatory and Compliance Leaders
Investor Relations and Equity Analysts