Market Minds Advisory
Radiology Information System (RIS) Market

Radiology Information System (RIS) Market: Worklist Orchestration, Standalone Displacement and the Radiologist Capacity Gap

Nearly half of radiology departments have already retired their standalone system, and the software growing fastest is the layer deciding which unreported study a radiologist should open next, and why that one.

Lead Analyst

Alice Ballenger

Published

September 2026

Make Smarter Decisions with Customized Research Insights

Request a free sample report and evaluate market opportunities, growth trends, and competitive dynamics relevant to your business needs.

2025 MARKET VALUE$1.2BMarket Size 2025
2036 FORECAST VALUE$2.9BBase Case , 2026 to 2036
CAGR 2026 TO 20368.2 %Bull 9.5% / Bear 6.8%
INCREMENTAL OPPORTUNITY$1.6BNet 10- year value creation
EXPANSION MULTIPLE2.20x2036 value over 2026 base
Strategic Levers
M&A Pipeline
Regional Outlook
Country Rankings
Competitive Intelligence
Segmental Deep-dive
Call-Us : 91 93563 13602

Executive Snapshot and Market Trajectory

The standalone radiology information system is disappearing and the functions it performed are not. Roughly 47% of departments have migrated onto enterprise imaging platforms or electronic record radiology modules, which means the category is consolidating upward while demand for the underlying workflow keeps rising sharply.
AI worklist orchestration and triage compounds at 12.3%, exactly 1.50 times the market rate, because an 18% gap between reporting capacity and study volume growth makes deciding what a radiologist reads next the most valuable software decision in the department. North America holds 32% of value, the largest position, on imaging informatics spend and seat pricing rather than study volume. Annual licence value sits near USD 9,600 per seat.
Five vendors licence 61% of reporting radiologist seats, and position depends on enterprise imaging platform incumbency and record system integration rather than on radiology workflow features. Implementation runs 14 months from signature to departmental operation. Worklist orchestration cuts unreported study backlogs by roughly 34%, which is what departments actually buy. Electronic record vendors supply the rest adequately, inside contracts health systems have already signed and paid for, which removes the spend rather than losing it.
Market Definition
Covers software managing radiology department workflow, reporting and information handling, spanning AI worklist orchestration and triage, structured reporting and voice capture, enterprise imaging workflow platforms, scheduling and patient access modules, standalone departmental radiology information systems, and radiology billing and coding modules. Sizing captures licence, subscription, maintenance and implementation service revenue at realised price. Excludes imaging modality hardware, picture archiving and communication storage infrastructure, general electronic health record platforms, diagnostic AI algorithms interpreting images, teleradiology service provision, and radiation dose management systems sold separately.
Base Year Value
$1.2B in 2025 (MMA Primary Research Dataset, August 2026)
Forecast Period
2026 to 2036, eleven discrete annual values
CAGR
8.2% base case. Bull 9.5%. Bear 6.8%.
Fastest Growth Segment
AI Worklist Orchestration and Triage: 12.3% CAGR
Fastest Growth Country
India: 10.9% CAGR
Fastest Growth Region
South Asia and Pacific: 10.3% CAGR
Largest Region
North America: 32% of 2025 global value
Market Leaders
GE HealthCare, Siemens Healthineers, Philips, Sectra, Agfa HealthCare. Source: MMA Analysis based on company annual reports.
Primary Survey
n=3,800 procurement and R&D decision-makers, Q4 2025, six countries
Methodology
Demand-side build-up, cross-validated against public data, 47 expert interviews

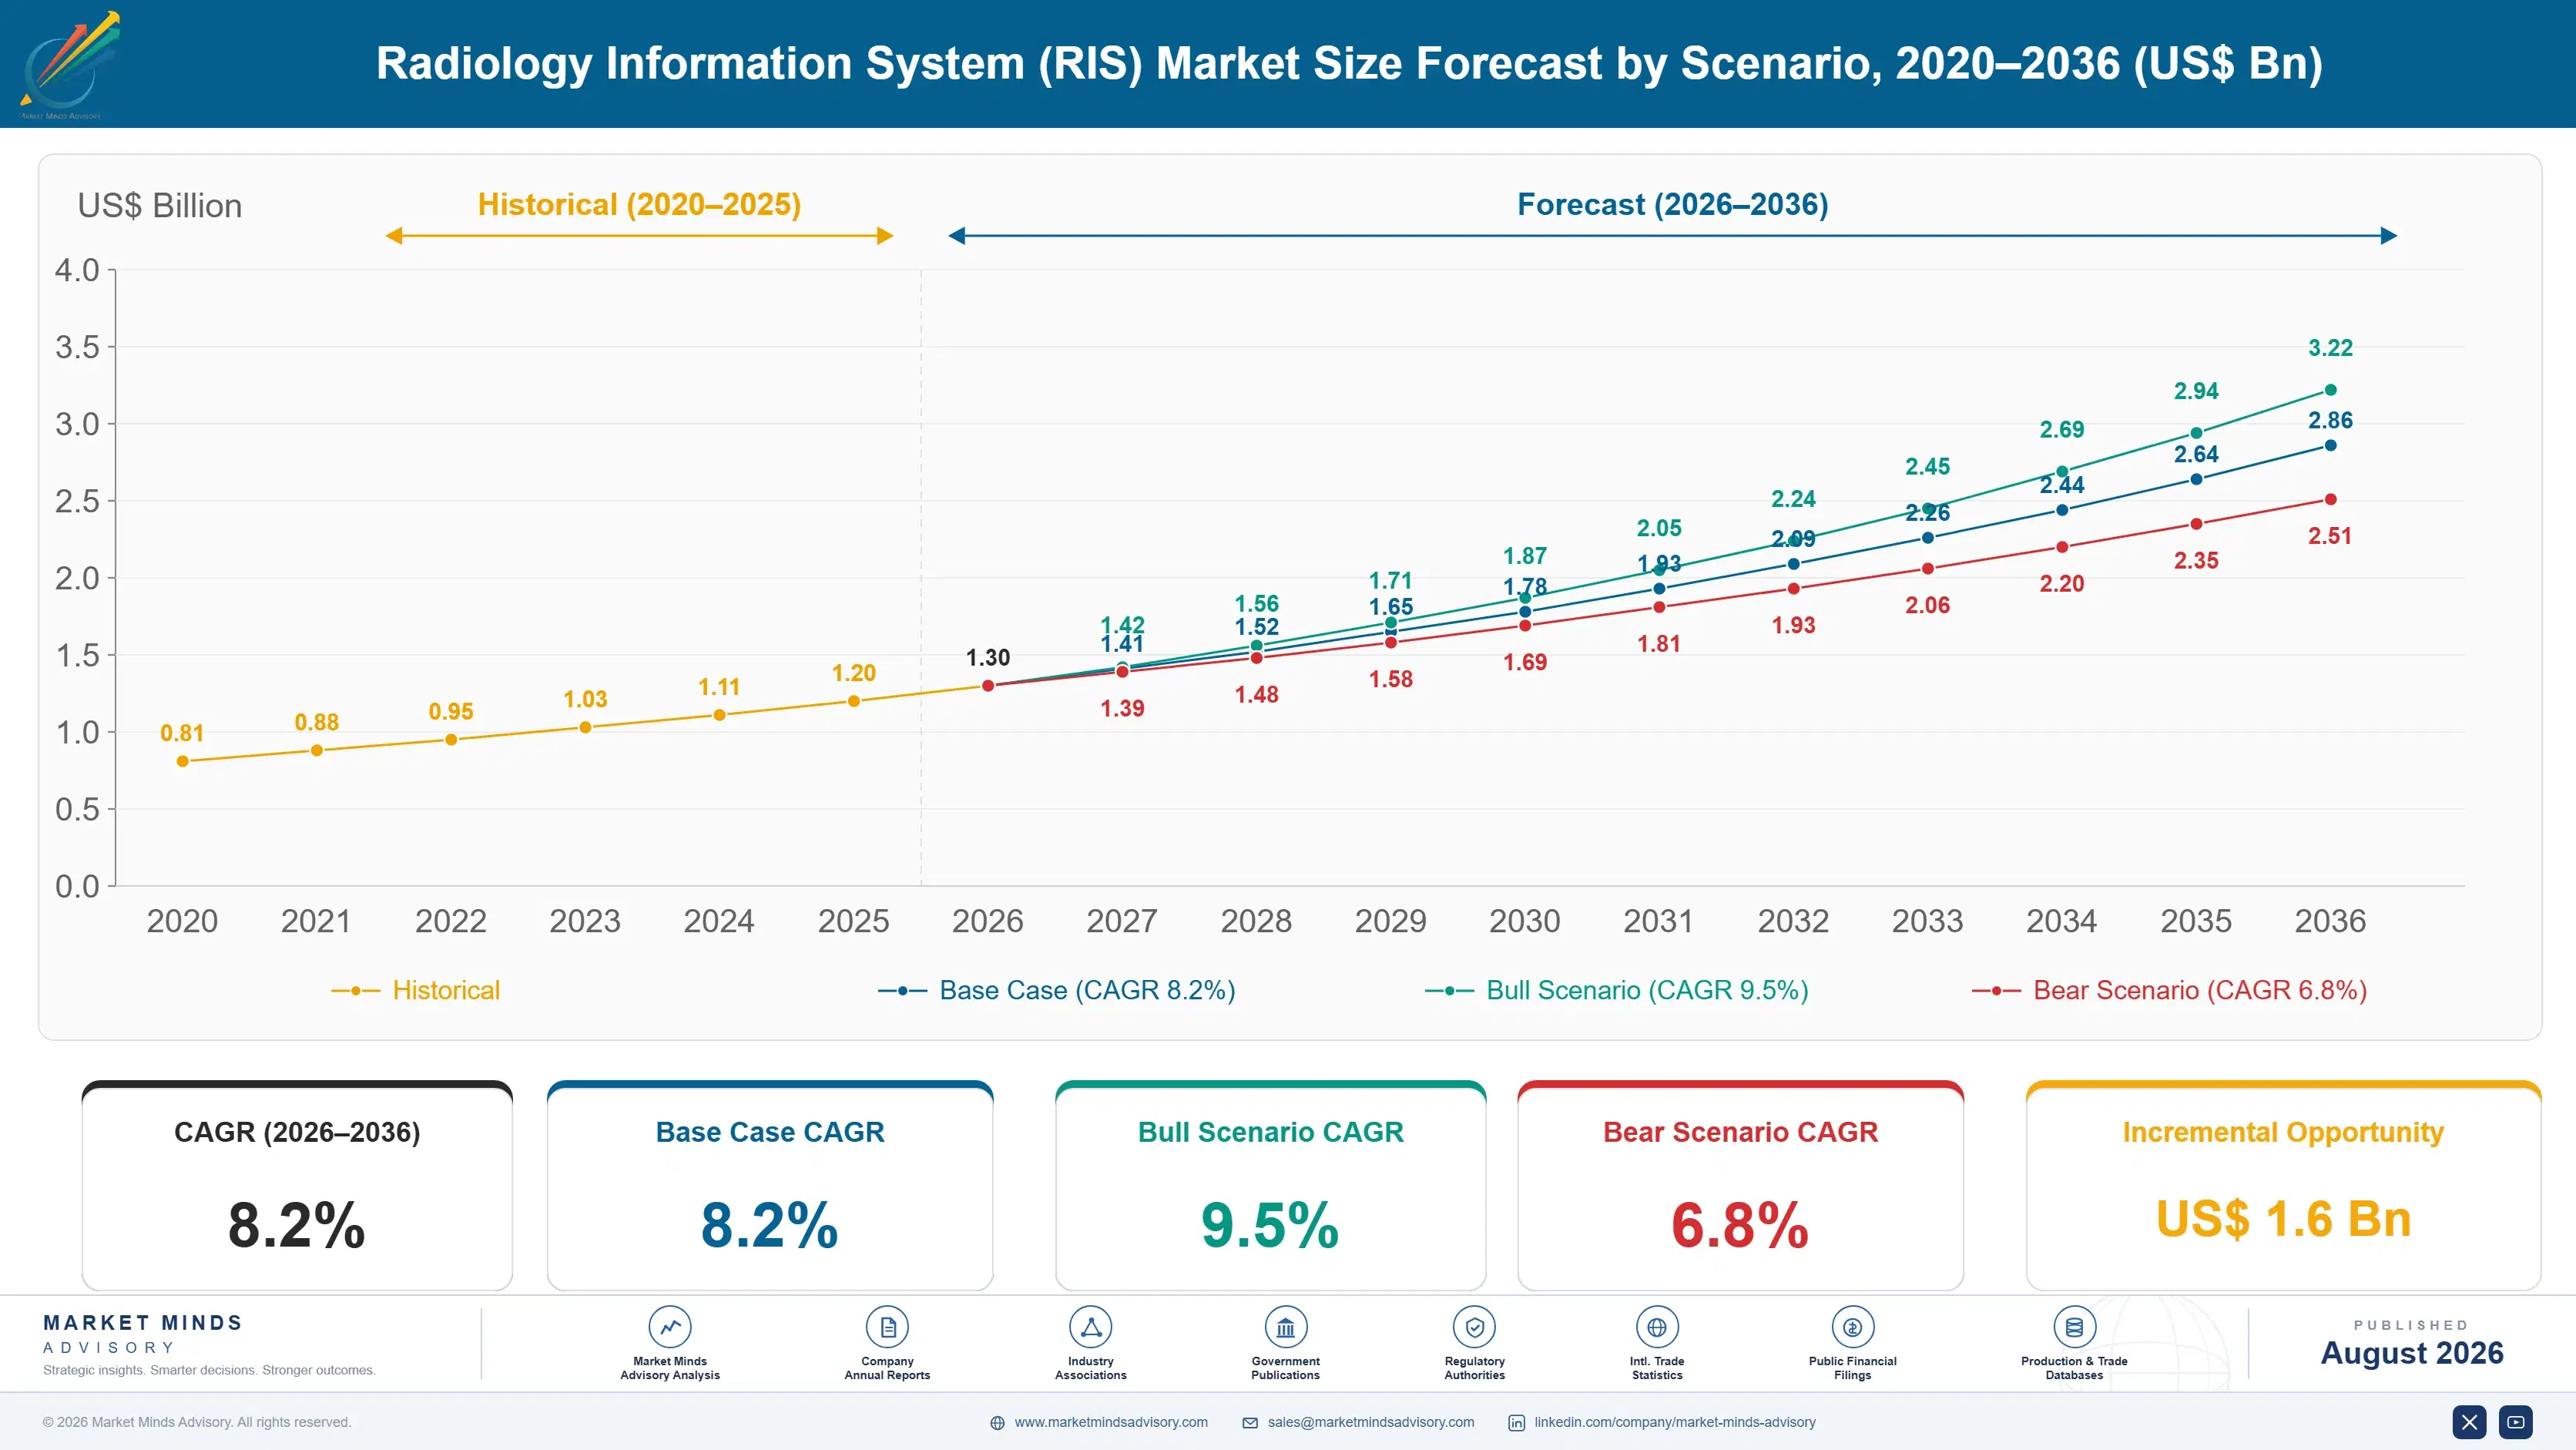
Radiology Information System (RIS) Market Forecast Scenarios

radiology-information-system-ris-market-size-forecast-scenario-1787309802062
Growth of 6.9% across 2020 to 2025 came from platform consolidation rather than from new departmental purchases. Health systems replaced standalone departmental systems with enterprise imaging platforms spanning radiology, cardiology and pathology together, and electronic record vendors absorbed scheduling and ordering functions that departments once bought separately. Imaging volumes recovered strongly after 2020 while radiologist recruitment did not, which set up the capacity problem driving the fastest segment.
The base case of 8.2% rests on three mechanisms. Worklist orchestration is being bought because reporting capacity trails study volume by roughly 18% and no amount of recruitment closes that gap. Structured reporting spreads as referrers and payers both demand consistent content rather than free narrative. And Asian imaging informatics spending is rising quickly as hospital construction brings enterprise platforms into departments that previously ran on paper requisitions and spreadsheets.
The bull case of 9.5% assumes AI triage moves from prioritising worklists to genuinely reducing what radiologists must read, which would change the value proposition from efficiency to capacity creation entirely. The bear case of 6.8% reflects two pressures: electronic record vendors absorbing more radiology workflow into platforms health systems already own, and capital constraints extending replacement cycles beyond current intervals.

Who Decides What Gets Read Next

Two things are happening to this category at once, in opposite directions. The standalone departmental system is being retired, with 47% of departments already migrated onto enterprise imaging platforms or electronic record radiology modules, which removes a whole product line. Meanwhile the workflow problem it existed to solve has become considerably worse, because imaging volumes keep growing and radiologist numbers do not. The functions survive and the product category that housed them does n
TOP FIVE CONCENTRATION61%Reporting radiologist seats licensed by leading platform vendors
ANNUAL COST PER SEATUSD 9,600Realised subscription value for one reporting radiologist seat
REPORTING BACKLOG REDUCTION34%Fall in unreported study queues after worklist orchestration deployment
RADIOLOGIST CAPACITY GAP18%Unfilled reporting capacity against current study volume growth
STANDALONE SYSTEM DISPLACEMENT47%Departments migrated onto enterprise or record-integrated platforms instead
IMPLEMENTATION DURATION14 monthsTime from contract signature to full departmental operation
Worklist orchestration is where that pressure lands commercially. A department with more unreported studies than reporting capacity must decide what each radiologist opens next, and doing that well by urgency, subspecialty and turnaround commitment reduces unreported backlogs by roughly 34%. That is a capacity argument rather than an efficiency one, which is why the segment compounds at 12.3% while the category grows at 8.2%. Nothing else in radiology informatics makes a comparable claim.
Two forces determine the next decade. Electronic record vendors keep absorbing radiology workflow into platforms health systems already own and already pay for, which compresses the addressable software spend. And whether AI triage progresses from prioritising work to genuinely removing studies from the reporting queue decides how large the fastest segment eventually becomes.
"The radiology information system as a product is finished and its job has never mattered more. Departments cannot hire their way out of the volume problem, so the software that decides what gets read next is the most consequential purchase they make. Vendors still selling scheduling modules have not noticed the conversation moved."
Director, Healthcare Imaging Informatics Practice · MMA Technology / Healthcare

Market Trends

Worklist orchestration becomes the capacity answer departments buy

Reporting capacity trails study volume growth by roughly 18% and radiologist recruitment cannot close that gap in any developed market, which turns work allocation into the department's most consequential software decision. Orchestration that assigns studies by urgency, subspecialty match, complexity and turnaround commitment reduces unreported backlogs by roughly 34%. The segment compounds at 12.3% against 8.2% for the category. Departments buy it as capacity creation rather than efficiency improvement, which is a considerably easier argument to make to a chief executive. Electronic record modules hold nothing comparable, which makes it the specialist vendor's strongest remaining position.
Market Impact: Grows structured reporting at 10.1%

Enterprise platforms and record vendors displace standalone systems

Roughly 47% of departments have retired standalone radiology information systems in favour of enterprise imaging platforms spanning several specialties or electronic record radiology modules they already own. That removes a product line while the underlying workflow demand persists and grows. Commercially it means the buying decision has moved from the radiology department to health system informatics leadership, and the competitive field now includes record vendors whose radiology capability is adequate rather than excellent but arrives already paid for. Adequate and free beats excellent and separately priced in most procurement processes anywhere.
Market Impact: Grows regional spend at 10.3% yearl

Market Opportunities and Growth Drivers

Structured reporting demand comes from referrers and payers together

Free narrative radiology reports are difficult for referring clinicians to act on consistently and impossible for payers or registries to analyse at scale, and both constituencies now push for structured content with defined fields and standardised terminology. That converts reporting software from a dictation tool into a data capture system, which changes both its value and its integration requirements. The segment grows at 10.1%. Radiologist resistance is real, since structured templates feel slower than dictating freely does. Departments imposing templates without consultation see reporting throughput fall before it eventually recovers.
Market Impact: Removes spend from 47% of departmen

Asian hospital construction brings platforms into paper departments

Radiology departments across China, India and Southeast Asia are being built or modernised at pace, and many are moving directly from paper requisitions and spreadsheet scheduling onto enterprise imaging platforms without ever owning a standalone system. That skips a product generation entirely. East Asia grows at 9.2% and South Asia and Pacific at 10.3%, faster than any Western region. Domestic vendors including Neusoft supply much of that demand at licence pricing global vendors cannot approach anywhere. Departments skipping a whole product generation adopt orchestration alongside the platform rather than years later.
Market Impact: Takes 14 months to reach operation

Market Restraints and Challenges

Record vendors absorb workflow health systems already paid for

Electronic record platforms increasingly include radiology ordering, scheduling and reporting capability, and the root cause of the displacement is commercial rather than technical: that capability arrives inside a contract the health system has already signed. Adequate and free beats excellent and separately priced in most procurement processes. Specialist vendors respond by competing on capability record modules cannot match, particularly orchestration and subspecialty reporting, by integrating rather than replacing, and by targeting imaging-intensive organisations where radiology performance genuinely matters commercially. Nothing about the product quality argument changes any of that, which several vendors took years to accept.
Market Impact: Cuts unreported backlogs by 34%

Implementation duration deters replacement decisions considerably

Implementation runs roughly 14 months from contract signature to full departmental operation, and the root cause is integration breadth: a radiology platform must connect to modality hardware, archives, record systems, billing and referring clinician channels simultaneously. Departments therefore defer replacement well past the point of dissatisfaction. Vendors mitigate through phased deployment that delivers orchestration before full migration, through pre-built integration libraries for common record platforms, and by offering parallel running periods that reduce the perceived risk considerably. Orchestration overlays deploy in weeks rather than months, which is precisely why they sell.
Market Impact: Displaces 47% of standalone systems
3 additional market trends, 4 additional growth drivers, and 2 additional restraints and challenges are covered in the full report. Contact sales@marketmindsadvisory.com to access the complete intelligence.

Segment CAGR and Growth Architecture

Segmentation follows the software module class, because each class carries a distinct buyer, competitive field and pricing basis. Care setting, imaging modality and geography all matter commercially but cut across every module class, so they belong in later discussion. Six module classes cover current radiology informatics practice worldwide, and their commercial trajectories differ sharply.
radiology-information-system-ris-market-market-share-analysis-1787309802592

AI Worklist Orchestration and Triage

Worklist orchestration compounds at 12.3%, exactly 1.50 times the market rate, and it sells as capacity creation rather than as workflow improvement. With reporting capacity trailing study volume by roughly 18%, deciding which unreported study each radiologist opens next by urgency, subspecialty and turnaround commitment reduces backlogs by roughly 34%. Three commercial features follow. The buyer is health system leadership rather than the radiology department, because the argument is about throughput rather than about software. Electronic record modules cannot match this capability, which makes it the specialist vendor's strongest position. And pricing holds better here than anywhere else. AI specialists with no platform legacy to defend are moving into this position considerably faster than incumbents.
CAGR 12.3%

Structured Reporting and Voice Capture

Structured reporting grows at 10.1%, second fastest, and the demand comes from outside radiology entirely. Referring clinicians cannot act consistently on free narrative and payers and registries cannot analyse it, so both push toward defined fields and standardised terminology that turn a report into structured data. That changes the software from a dictation tool into a capture system with different integration requirements. The commercial obstacle is radiologist resistance, since templates genuinely feel slower than free dictation, and departments that impose them without consultation see reporting throughput fall before it recovers. National registry and audit requirements are what force adoption in the systems where penetration is highest, rather than any radiologist preference.
CAGR 10.1%
Full segment breakdown across 6 segments available in the complete report.

Regional Architecture and Country Demand Map

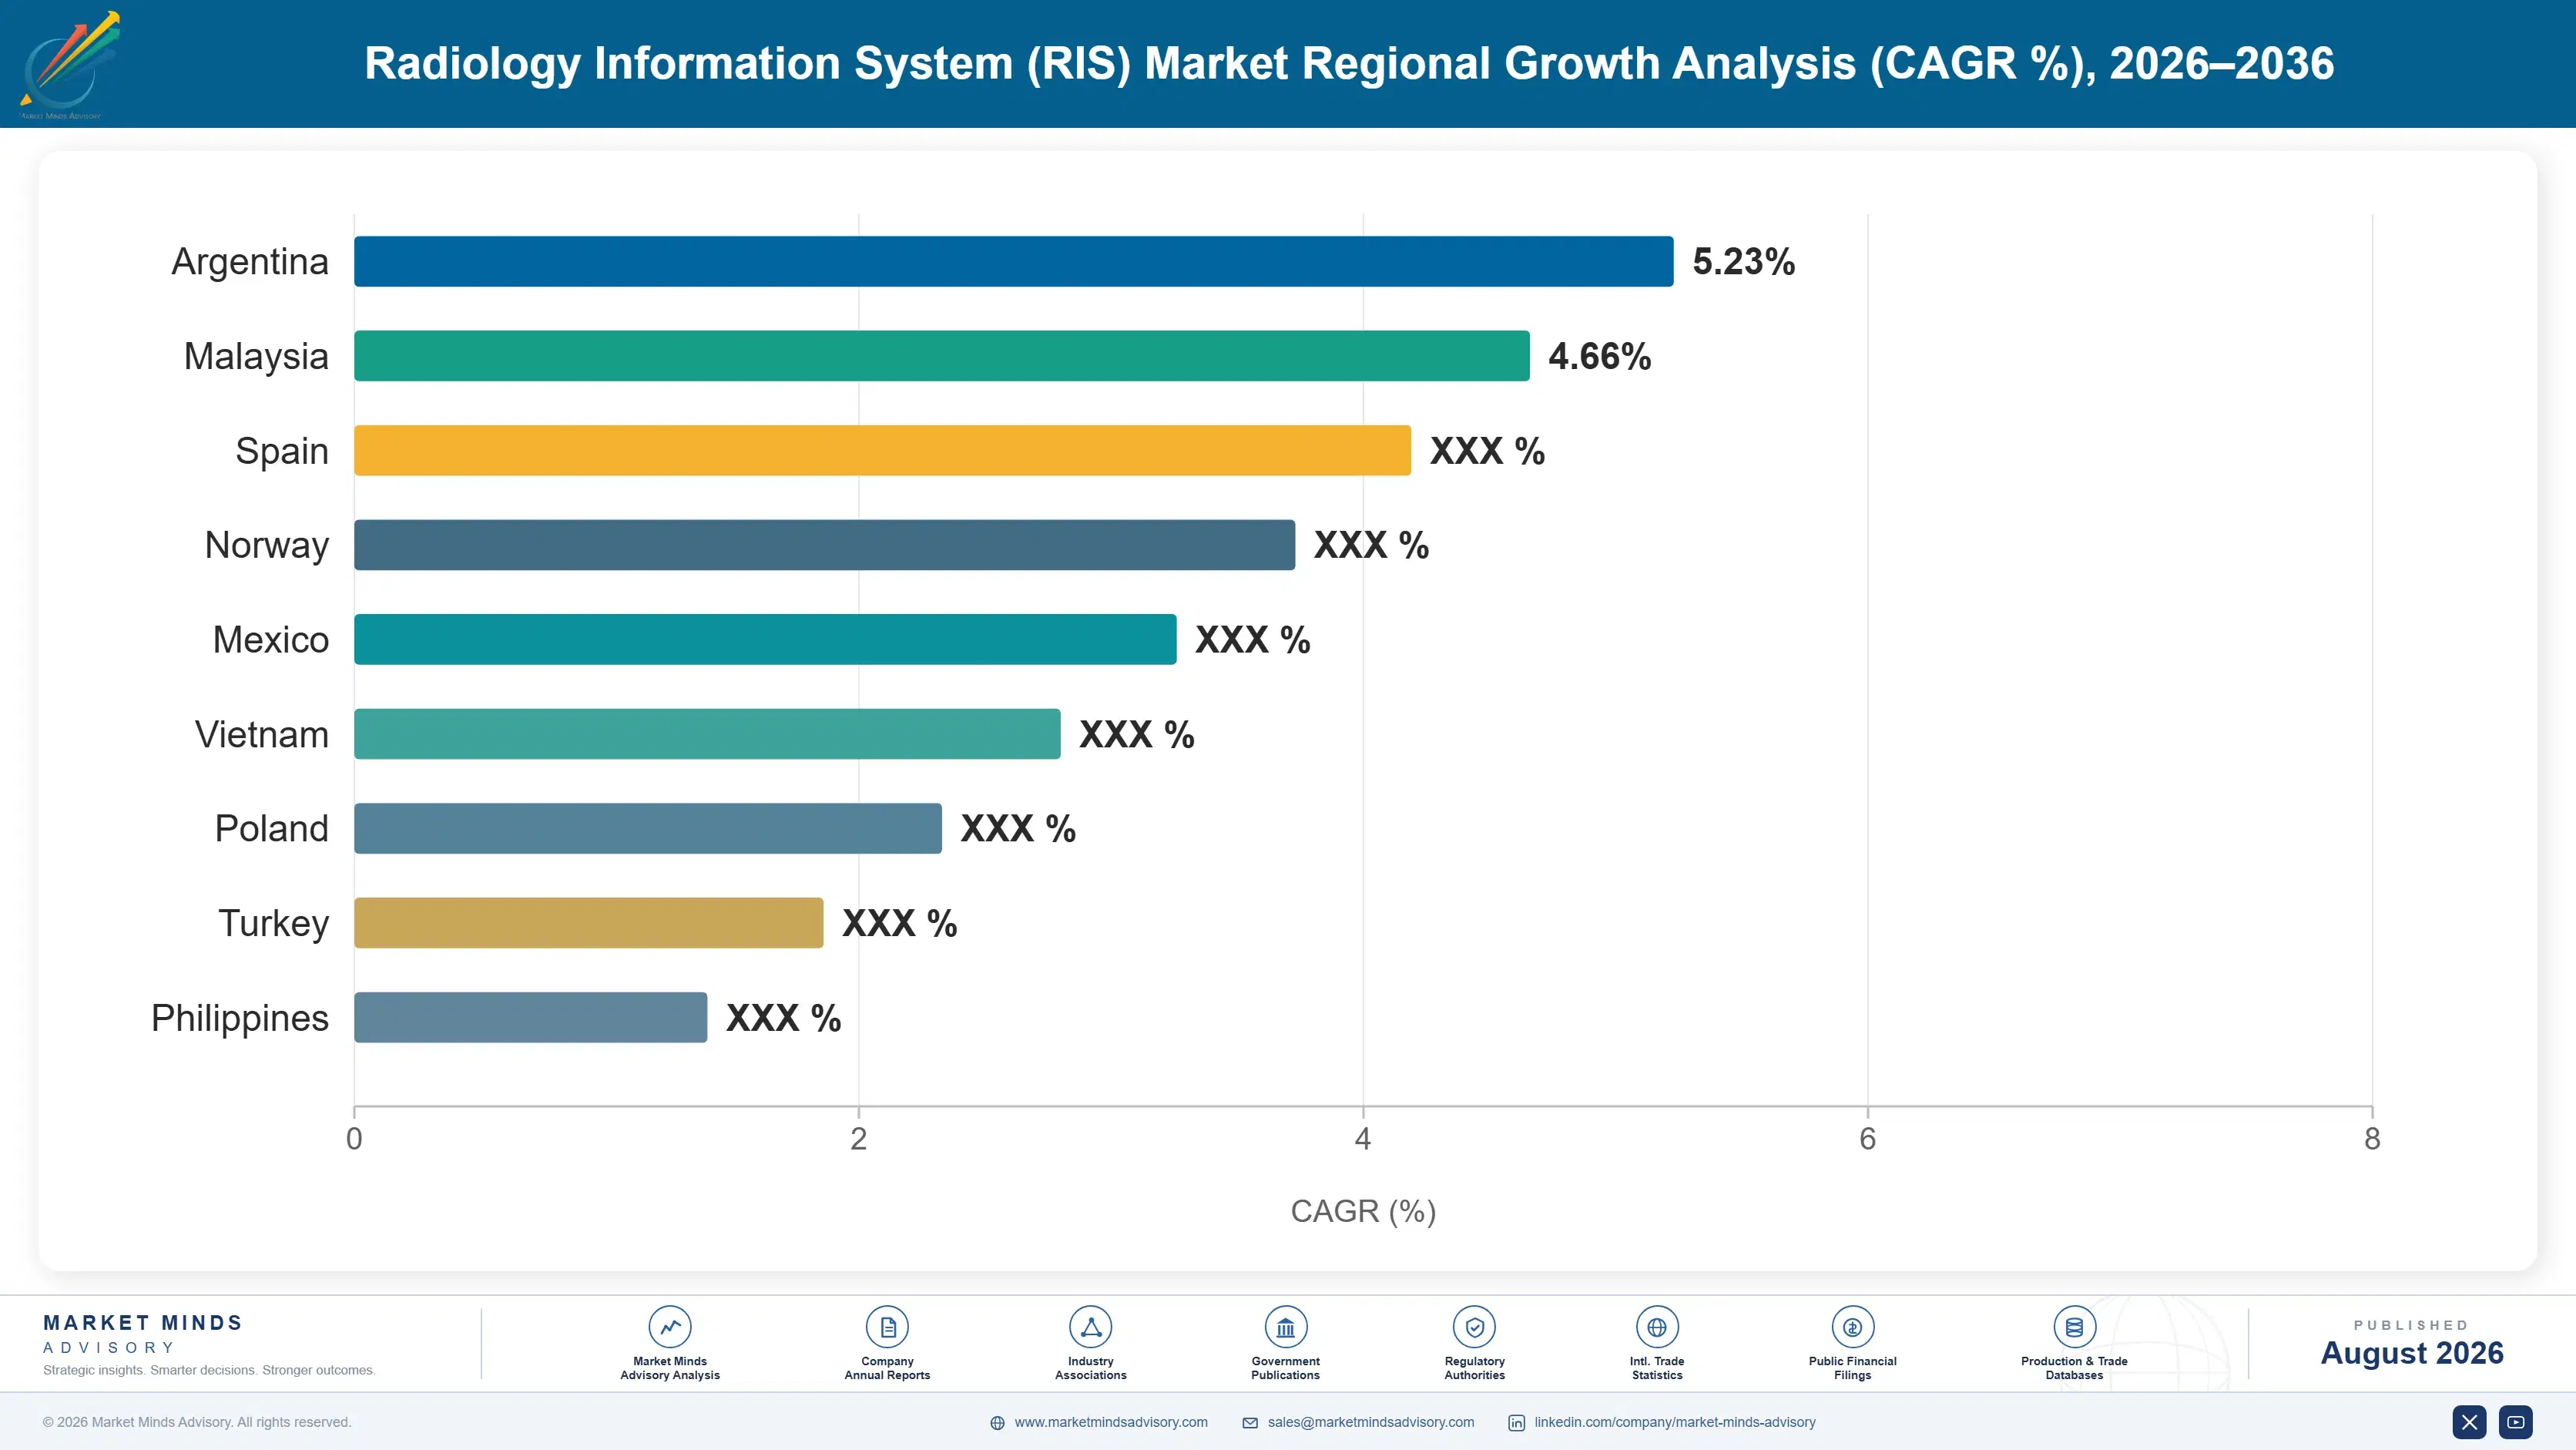
North America holds 32% of value on imaging informatics spend and seat pricing rather than study volume. Western Europe follows at 23% on enterprise platform maturity. South Asia and Pacific grows fastest, led by India at 10.9%, on rapid distributed reporting network growth across private chains.

North America

Thirty-two percent of global value sits in North America, growing at 7.5%, and licence pricing rather than study volume explains the position. Electronic record consolidation has gone further here than anywhere, which means record vendors absorb radiology workflow more aggressively and specialist vendors must justify separate spend against something already paid for. Radiologist shortage is acute enough that worklist orchestration arguments reach chief executives directly. Teleradiology and distributed reporting models are more developed here, which raises orchestration value considerably because work must be routed across sites and time zones. Electronic record absorption is furthest advanced here, which means specialist vendors survive almost entirely on orchestration and multi-specialty consolidation arguments rather than departmental functionality.
Share: 32% | CAGR: 7.5% (2026 to 2036)

Western Europe

Twenty-three percent of value and 6.6% growth reflect mature enterprise imaging adoption under public procurement that compresses licence pricing. Nordic health systems adopted enterprise imaging earliest, and Sectra's regional base gives it depth across Scandinavia and the Netherlands. German and French hospital groups run substantial enterprise platform estates. British procurement runs through national framework agreements with long implementation timelines. Structured reporting adoption is furthest advanced here, driven by national registry and audit requirements that free narrative simply cannot satisfy at any scale. Enterprise imaging consolidation across radiology, cardiology and pathology is more advanced here than in North America, which retired standalone departmental systems earlier and more thoroughly across most national systems.
Share: 23% | CAGR: 6.6% (2026 to 2036)
Regional intelligence for 5 additional markets available in the complete report: East Asia, South Asia and Pacific, Latin America, Middle East and Africa, Eastern Europe. Contact sales@marketmindsadvisory.com.
radiology-information-system-ris-market-country-cagr-analysis-1787309803109

Four Ways To Beat The Record Vendor

Electronic record platforms now include radiology workflow that arrives already paid for, and adequate beats excellent in most procurement processes. The levers that matter compete where record modules genuinely cannot, shorten the implementation that deters replacement, and reach the buyer who cares about throughput. Each carries returns tested against disclosed vendor economics and primary interview evidence.

Compete on orchestration, never on scheduling modules

Electronic record radiology modules handle ordering, scheduling and basic reporting adequately and arrive inside a contract the health system already signed, which makes those functions unwinnable for a specialist vendor. Worklist orchestration is different, since record vendors have no comparable capability and the 18% capacity gap makes it valuable. Vendors concentrating there report win rates roughly 60% above those competing on general departmental functionality. It concedes most of the historical product footprint, which product organisations find genuinely difficult. Nothing about product quality changes the outcome where a record module arrives already paid for.
Market Impact: Lifts win rates roughly 60% above g

Sell throughput to executives, not features to radiologists

A radiology department cannot authorise spending that competes with an electronic record module already paid for, but a chief executive facing unreported study backlogs and recruitment failure can. Vendors presenting backlog reduction near 34% and capacity arithmetic to executive leadership report deal sizes roughly 45% above those selling departmental features to radiologists. It requires health economic capability and executive access that imaging informatics sales organisations rarely hold, and it changes the whole commercial motion rather than just the material. Chief executives facing failed recruitment understand capacity arithmetic immediately, which radiologist feature comparisons never achieve.
Market Impact: Raises average deal sizes roughly 4

Deploy orchestration before full platform migration

Implementation running 14 months from signature to operation deters replacement well past the point of departmental dissatisfaction, and asking for that commitment upfront loses deals that a phased approach would win. Deploying orchestration as an overlay on the existing platform delivers value in weeks and builds the case for migration later. Vendors offering this route report initial contract conversion roughly 50% higher than those requiring full replacement. It complicates integration engineering and delays full licence revenue considerably. Departments that see orchestration value in weeks argue for the migration themselves, which is a considerably better sequence.
Market Impact: Improves initial contract conversio

Build integration libraries for the record platforms that matter

Most of the 14 month implementation is integration work against modality hardware, archives, record systems and billing channels, and a large share of it is repeated at every site with the same handful of record platforms. Vendors maintaining pre-built certified integration libraries report implementation duration roughly 35% shorter than those building connections per project. It requires sustained engineering investment against platforms that change independently, and it is the least glamorous investment with the clearest commercial return available. Nobody markets integration libraries and they decide replacement deals with genuinely surprising regularity.
Market Impact: Shortens implementation duration by

Who Controls the Margin Pool

Five vendors licence 61% of reporting radiologist seats, the basis on which MMA assesses every participant here, and concentration follows enterprise imaging platform incumbency rather than radiology workflow capability. GE HealthCare leads on installed platform breadth across imaging modalities and informatics together. Sectra holds the strongest enterprise imaging position relative to its size, particularly across Northern Europe.
Competitive activity runs along three lines. Worklist orchestration capability is the primary contest, because it is the one area where record vendors have nothing comparable and specialist vendors can still command separate spend. Integration library breadth determines implementation duration, which determines how many replacement decisions a vendor can realistically win. And executive-level selling is being built by vendors who recognise the buyer has moved out of the department entirely.

Pressure arrives from two directions. Electronic record vendors including Epic Systems and Oracle Health absorb radiology workflow into platforms health systems already own, which removes addressable spend rather than losing it competitively. Meanwhile AI triage specialists including Aidoc and Annalise.ai build orchestration capability without any platform to defend. Rankings shift toward participants holding orchestration capability plus integration breadth, because those two together decide who wins the replacement decisions that remain.
radiology-information-system-ris-market-company-positioning-matrix-1787309803627

Competitive Moat and Risk Dimensions

GE HEALTHCARE

Moat: Modality installed base and informatics

The company sells imaging modality hardware and informatics into the same departments, which gives it integration advantages no software-only vendor can match cheaply. Its installed modality base creates natural informatics attachment at equipment replacement. Enterprise platform breadth across radiology, cardiology and other imaging specialties lets it consolidate departmental systems the way informatics leadership now prefers.
GE HEALTHCARE

Risk: Record vendor workflow absorption

Electronic record platforms increasingly include radiology ordering, scheduling and reporting capability that arrives already paid for, which removes addressable spend regardless of product quality. That pressure is commercial rather than technical. Defending it requires orchestration capability the company must build or buy against specialists who have nothing else to defend and move considerably faster.
SECTRA

Moat: Enterprise imaging depth per scale

The company holds enterprise imaging positions far larger than its size would suggest, built through Nordic and Dutch relationships and sustained customer satisfaction rather than hardware attachment. Multi-specialty enterprise imaging is its core proposition rather than an extension of a hardware business. Long implementation partnerships create switching friction that survives procurement cycles in a way product features never do.
SECTRA

Risk: Limited orchestration and AI position

The company's strength lies in enterprise imaging platform and archive capability rather than in worklist orchestration, which is where category growth and pricing power both sit. Building AI orchestration capability competes for engineering resource against platform commitments to existing customers. AI specialists with no platform legacy are moving faster into exactly that position.

Players Tracked

Prominent Players

GE HealthCare
Siemens Healthineers
Philips
Sectra
Agfa HealthCare

Other Key Players

Epic Systems
Oracle Health
Fujifilm
Canon Medical Systems
Merative
Intelerad Medical Systems
Visage Imaging
RamSoft
Nuance Communications
Aidoc
Annalise.ai
Carestream Health
Konica Minolta
Dedalus
Neusoft Medical Systems

Recent Developments

FEBRUARY 2025

Sectra expanded its worklist orchestration and triage capability

The company added subspecialty routing and turnaround commitment logic to its enterprise imaging platform, targeting health systems where distributed reporting across sites makes work allocation genuinely complex. It was an organic product development programme rather than an acquisition, joint venture or partnership arrangement of any kind whatsoever.
Signal: Adding orchestration to an archive platfor
SEPTEMBER 2025

GE HealthCare acquired an artificial intelligence triage developer

The acquisition brings algorithmic study prioritisation and urgency detection capability, addressing an orchestration gap the company had not closed internally while specialist developers advanced considerably faster than it did. Terms were not disclosed. It was an outright acquisition rather than a licensing or joint venture arrangement.
Signal: Buying triage capability rather than build
JANUARY 2026

Philips agreed a multi-year enterprise imaging deal with a health system

The agreement consolidates radiology, cardiology and pathology imaging workflow across a large multi-site health system onto a single platform, replacing several separate departmental systems including standalone radiology information software of its own. Terms were not disclosed. It was a supply and service agreement rather than any acquisition.
Signal: Consolidating three imaging specialties on

Engineering, Cloud And Integration

Cost structure here is almost entirely people and computing. Software engineering staff account for roughly 44% of operating cost, concentrated in North America, Northern Europe and increasingly India. Implementation and integration services contribute 22%, delivered by field engineers whose time is billed but rarely at full recovery. Cloud hosting adds 13%, and graphics processing for orchestration model training makes up 8%.
Two input movements hit this industry in quick succession. US Bureau of Labor Statistics data recorded sharp software engineering wage growth through 2021 and 2022, which raised the largest cost line directly. SEMI then reported advanced foundry capacity fully allocated across 2023 and 2024, which pushed graphics processing costs up and lengthened lead times for the hardware model training depends upon. Several vendors disclosed elevated personnel and infrastructure costs in reports for those years.

Exposure varies by engineering location and contract structure, and the mechanism is multi-year subscriptions against rising personnel cost. Vendors with engineering concentrated in high-wage markets carried the whole wage movement against fixed pricing already signed. Those with Indian or Eastern European development capacity were considerably better placed. Vendors building orchestration models carried compute exposure platform and archive vendors largely avoided, a distinction that keeps widening.
radiology-information-system-ris-market-cost-volatility-analysis-1787309803822

Build engineering capacity outside high-wage software markets

Engineering staff are 44% of operating cost and wage movement cannot be recovered under subscription agreements already signed. Indian and Central European development centres deliver comparable capability at meaningfully lower cost, and healthcare software quality requirements are entirely satisfiable there. The constraint is clinical domain knowledge, which is scarce everywhere and hardest to recruit far from working radiology departments.

Index multi-year subscriptions to published labour benchmarks

Multi-year subscription agreements with health systems transferred the whole 2021 and 2022 wage movement onto vendors with no recovery mechanism available at all. Indexation to published labour cost benchmarks shares that exposure, and health system procurement accepts it more readily at renewal than vendors expect. Those who never raised it absorbed the movement and reported it as margin compression instead.

Reserve training compute ahead of orchestration model development

Graphics processing capacity was fully allocated across 2023 and 2024, and vendors training orchestration and triage models could not secure capacity at any price for extended periods. Reserved cloud commitments cost a premium and remove that exposure entirely. Platform and archive vendors carry almost none of this risk, which is part of why AI-weighted vendors face considerably harder capital planning.

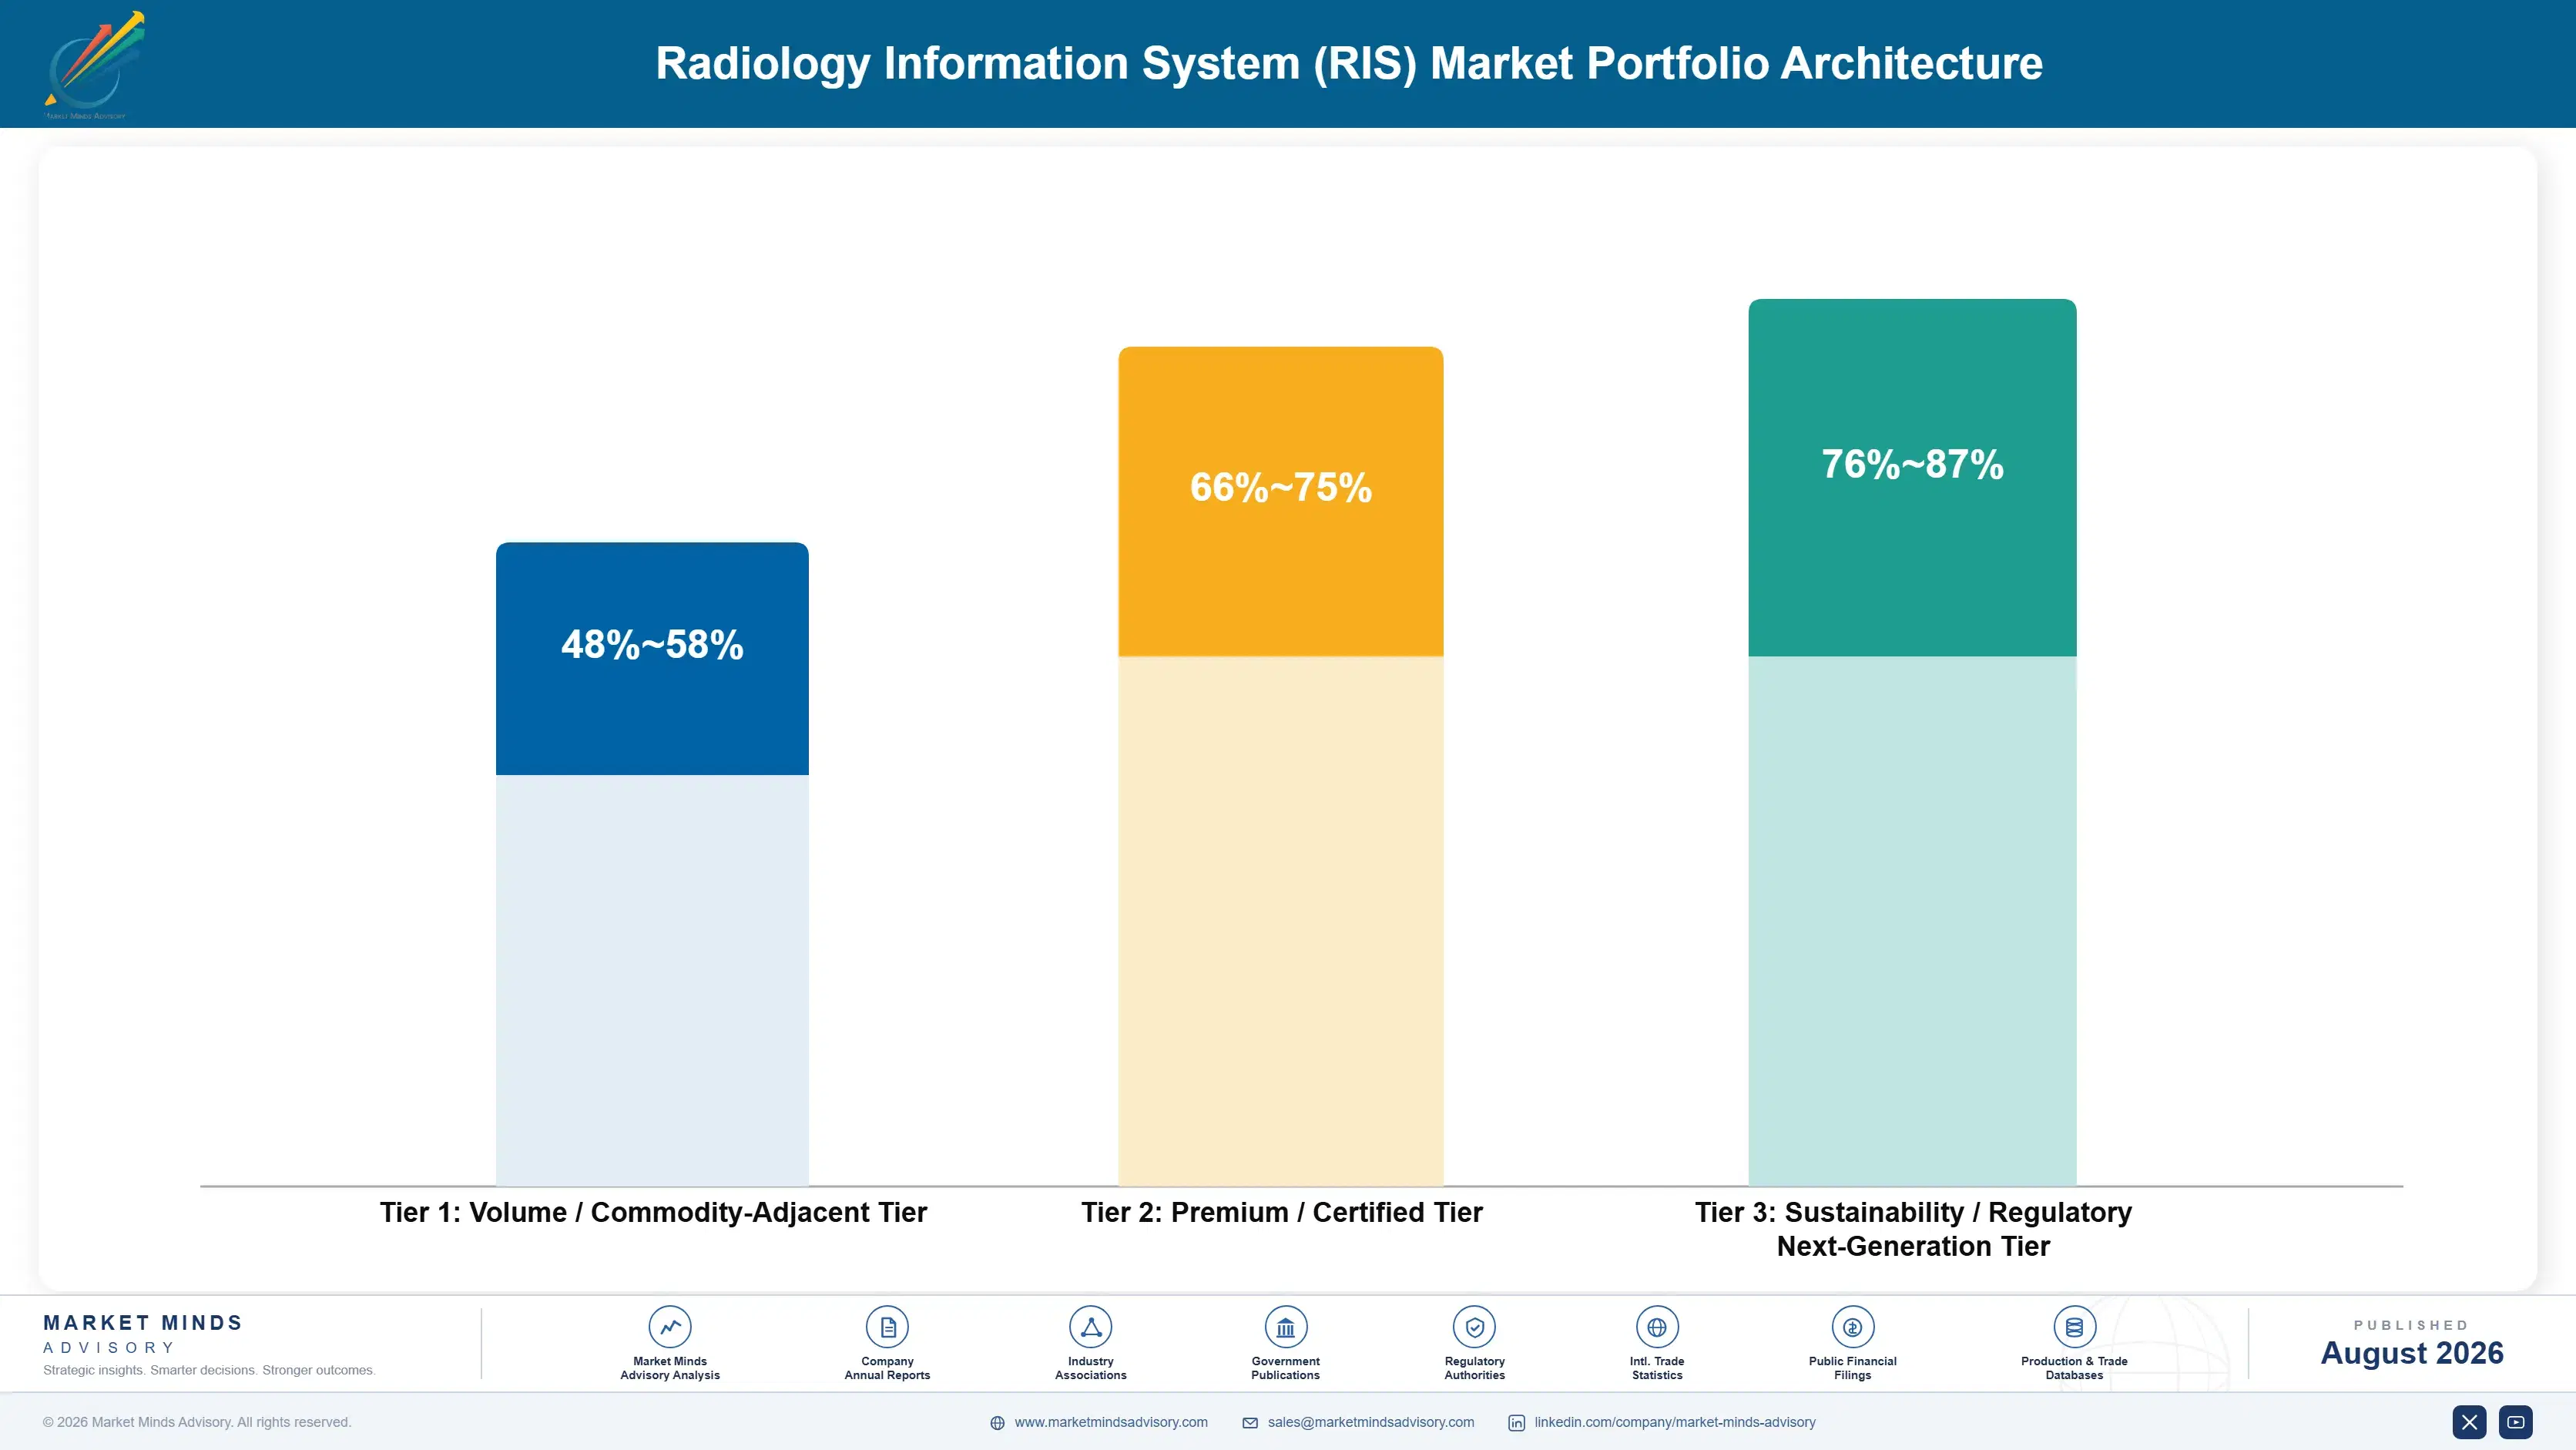
Portfolio Architecture for Margin Defence

Portfolio economics separate on whether a record vendor can supply the same function adequately. Scheduling, ordering and billing modules earn gross margin in the low fifties and are being competed away, because an adequate version arrives inside a contract already signed. Enterprise imaging platform and archive licences earn considerably more, defended by integration depth and migration cost. Worklist orchestration earns most of all, because record vendors have nothing comparable and the capaci
The tension is that the shrinking segments carry the customer relationship and the growing one does not. Departmental modules are what a vendor was originally bought for, and abandoning them concedes the footprint that made orchestration selling possible. Defending them against a free adequate alternative destroys margin instead. Vendors handling this well sell orchestration as an overlay and let the departmental footprint erode on schedule.

High-value pools concentrate in three places: orchestration where no record module competes, enterprise platforms consolidating multiple specialties, and integration libraries that shorten implementation and win replacements. None is large against total healthcare IT spending. Each is defended by capability record vendors lack, migration cost or sustained engineering rather than radiology features, which are broadly replicable.

Volume / Commodity-Adjacent Tier

Scheduling, patient access, billing and coding modules, plus standalone departmental radiology information systems. Electronic record platforms supply adequate equivalents already paid for, which removes the addressable spend rather than merely pricing it down.
Gross Margin: 48-58%

Premium / Certified Tier

Enterprise imaging workflow platforms consolidating radiology with other imaging specialties, plus structured reporting and voice capture. Integration depth and migration cost defend pricing. The nine-point range reflects tendered against negotiated health system economics.
Gross Margin: 66-75%

Sustainability / Regulatory / Next-Generation Tier

AI worklist orchestration and triage capability, plus certified integration libraries for major record platforms. Capacity arguments and absent record vendor equivalents defend pricing entirely. The eleven-point range reflects proven against emerging orchestration positions.
Gross Margin: 76-87%
radiology-information-system-ris-market-portfolio-architecture-1787309804314

High-value Sub-segments and Strategic Watch-out

Worklist orchestration capability

The one area where electronic record modules have nothing comparable, and where an 18% capacity gap makes the argument straightforward to executives. Pricing holds better here than anywhere. AI specialists with no platform legacy move fastest. Whether triage removes studies entirely eventually decides the ceiling here.
Gross Margin: 78-87%

Multi-specialty enterprise consolidation

Where several departmental systems retire onto one platform, which is exactly how standalone radiology systems disappear from health systems. Migration cost defends the position afterwards. Implementation duration is what deters the decision beforehand. Multi-specialty scope is what informatics leadership leadership now buys on across health systems.
Gross Margin: 68-75%

Departmental module footprint

The historical product category, now supplied adequately inside record contracts health systems already signed and paid for. Defending it destroys margin without holding volume. Letting it erode on schedule is the better answer. Product quality arguments change nothing about that outcome anywhere in this tier.
Gross Margin: 48-58%

Certified integration libraries

Unglamorous sustained engineering that shortens implementation by roughly a third and therefore wins replacement decisions competitors cannot reach. Record platforms change independently and constantly. Nobody markets this and it decides deals regularly. Sustained engineering investment is the only realistic route available to holding this position.
Gross Margin: 72-84%

How Imaging Informatics Revenue Persists

Revenue here behaves as a subscription annuity protected by migration cost rather than by contract. A health system implementing an enterprise imaging platform commits 14 months of integration work, retrains radiologists and reporting staff, and rebuilds connections to modalities, archives and record systems. Replacing that means doing all of it again while continuing to report studies, which is why platforms persist well past the point of dissatisfaction. Orchestration overlays behave different
Adoption depth varies sharply by organisation type. Large multi-site health systems and distributed imaging chains adopt orchestration deeply, because routing work across sites and subspecialties is genuinely complex and the capacity gain is measurable. Single-site departments adopt whatever their record platform supplies and change only at platform replacement. Academic centres adopt structured reporting deeply on research and registry grounds. Public systems in cost-constrained markets run older departmental systems for many years past intended replacement.

Buyer profiles have moved out of the radiology department decisively. A departmental administrator once chose the system on workflow features. Now health system informatics leadership decides on consolidation grounds, and chief executives decide on reporting capacity arguments.
radiology-information-system-ris-market-end-use-penetration-index-1787309804805

What We Would Do Here

These are among the four positions where our research anticipates prominent divergence between winners and laggards over the coming forecast period. Each is grounded in the demand model, the regulatory perimeter, and the announced capacity pipeline.
01 / SEGMENT SELECTION DISCIPLINE

Concede scheduling entirely and compete on orchestration

Electronic record radiology modules handle ordering, scheduling and basic reporting adequately and arrive inside a contract the health system has already signed and paid for, which makes those functions unwinnable for a specialist vendor at any price at all. Worklist orchestration is genuinely different, since record vendors hold no comparable capability, and vendors concentrating there report win rates roughly 60% above those competing on general departmental functionality. It concedes most of the historical product footprint, which product organisations find genuinely difficult to accept even when the evidence is plain.
02 / EXECUTIVE BUYER ACCESS

Sell reporting capacity upward, not features sideways

A radiology department cannot authorise spending that competes against an electronic record module the organisation already pays for, while a chief executive facing unreported backlogs and failed recruitment absolutely can. Vendors presenting backlog reduction near 34% and capacity arithmetic to executive leadership report deal sizes roughly 45% above those selling departmental features to radiologists instead. It requires health economic capability and executive access that imaging informatics sales organisations rarely hold, and it changes the entire commercial motion rather than merely the material used.
03 / PHASED DEPLOYMENT SEQUENCING

Land orchestration first, migrate the platform later

Implementation running 14 months from signature to full operation deters replacement well past the point of departmental dissatisfaction, and asking for that commitment upfront loses deals a phased approach would comfortably win. Deploying orchestration as an overlay delivers measurable value within weeks and builds the migration case afterwards, and vendors offering that route report initial contract conversion roughly 50% higher than full replacement demands. It complicates integration engineering and defers full licence revenue considerably, which finance functions tend to dislike quite intensely.
04 / INTEGRATION LIBRARY INVESTMENT

Prebuild the connectors nobody wants to fund

Most of a 14 month implementation is integration work against modality hardware, archives, record systems and billing channels, and a large share is repeated at every site against the same handful of record platforms. Vendors maintaining certified pre-built integration libraries report implementation duration roughly 35% shorter than those building connections project by project. It requires sustained engineering investment against platforms that change independently, and it is the least glamorous spend with the clearest commercial return available anywhere in this whole category.

Engagement Snapshot From the Field

A live engagement with an industry participant carrying material or product regulatory and market exposure ahead of a defining policy shift, showing how our research translates into a defensible multi-year portfolio strategy.
MARKET MINDS ADVISORY · CLIENT ENGAGEMENT SUMMARY
Radiology Information System (RIS) Producer Strategic Portfolio Review and Transition Roadmap 2026·Investment Scenario on Radiology Information System (RIS) Exposure Evaluation 2025-26
CLIENT PROFILE
A European imaging informatics vendor with revenue near EUR 88 million annually (client-reported, unverified by MMA), a product portfolio weighted toward departmental radiology information system modules including scheduling and billing, limited worklist orchestration capability, and a sales organisation calling on radiology department administrators. Roughly 68% of revenue came from module classes electronic record platforms now supply adequately.
STRATEGIC CHALLENGE
Win rates had fallen for three consecutive years and management attributed it to product feature gaps, proposing a substantial departmental module development programme. The board suspected the losses reflected record vendor absorption rather than any feature deficiency, but nobody had analysed what the client was actually losing to in each individual decision.
MMA APPROACH
MMA reconstructed 58 competitive decisions across seven European markets, coding each by winning vendor, decision criterion and whether an electronic record alternative was available. Forty-seven expert interviews with health system informatics directors, radiology department heads, chief executives and implementation managers established how decisions were actually made. The client's portfolio was then scored against record module capability by function.
KEY FINDINGS
  1. Forty-one of 58 losses went to electronic record platforms already contracted rather than to competing specialist vendors, and no feature improvement would have changed those outcomes at all.
  2. Every decision the client won involved either worklist orchestration or multi-specialty consolidation, which were the two areas where record modules offered nothing comparable to buyers.
  3. Health system informatics directors rather than department administrators controlled the decision in 49 of 58 cases, and the client's sales organisation had almost no access to that level.
  4. Implementation duration was cited as the primary reason for deferring replacement in eleven cases, and the client built integrations per project rather than maintaining any certified library.
CLIENT PROFILE
A European imaging informatics vendor with revenue near EUR 88 million annually (client-reported, unverified by MMA), a product portfolio weighted toward departmental radiology information system modules including scheduling and billing, limited worklist orchestration capability, and a sales organisation calling on radiology department administrators. Roughly 68% of revenue came from module classes electronic record platforms now supply adequately.
STRATEGIC CHALLENGE
Win rates had fallen for three consecutive years and management attributed it to product feature gaps, proposing a substantial departmental module development programme. The board suspected the losses reflected record vendor absorption rather than any feature deficiency, but nobody had analysed what the client was actually losing to in each individual decision.
MMA APPROACH
MMA reconstructed 58 competitive decisions across seven European markets, coding each by winning vendor, decision criterion and whether an electronic record alternative was available. Forty-seven expert interviews with health system informatics directors, radiology department heads, chief executives and implementation managers established how decisions were actually made. The client's portfolio was then scored against record module capability by function.
KEY FINDINGS
  1. Forty-one of 58 losses went to electronic record platforms already contracted rather than to competing specialist vendors, and no feature improvement would have changed those outcomes at all.
  2. Every decision the client won involved either worklist orchestration or multi-specialty consolidation, which were the two areas where record modules offered nothing comparable to buyers.
  3. Health system informatics directors rather than department administrators controlled the decision in 49 of 58 cases, and the client's sales organisation had almost no access to that level.
  4. Implementation duration was cited as the primary reason for deferring replacement in eleven cases, and the client built integrations per project rather than maintaining any certified library.
RECOMMENDED STRATEGY
Phase 1: Phase 1 (0 to 9 months): Cancel the departmental module programme, and redirect engineering entirely toward worklist orchestration capability instead. Phase 2: Phase 2 (9 to 24 months): Rebuild the commercial organisation to reach informatics directors and executives, and build certified integration libraries for the three dominant record platforms. Phase 3: Phase 3 (24 to 42 months): Offer orchestration as a standalone overlay on competitor platforms, and let the departmental module footprint erode on its own schedule.
OUTCOME
The departmental module programme was cancelled before significant spend, releasing engineering capacity the client redirected rather than lost. Orchestration capability reached first customers within five quarters and win rates recovered in that segment (client-reported, unverified by MMA). Integration libraries were built for two record platforms rather than three. Executive-level commercial capability is in build and remains the binding constraint.

Frequently Asked Questions

Foundational context covering the market sizes, CAGR, scope, country, region and competition that inform every finding below. This section is provided to cover basics and most often pre-purchase conversations, answered from the MMA Primary Research Dataset.

What is the current size of the Radiology Information System (RIS) Market?

MMA sizes the global radiology information system market at USD 1.2 billion in 2025, rising to USD 1.3 billion in 2026. That covers licence, subscription, maintenance and implementation service revenue at realised price.

How large will the Radiology Information System (RIS) Market be by 2036?

MMA forecasts USD 2.86 billion by 2036, an expansion multiple of 2.20 times the 2026 base. That represents roughly USD 1.56 billion of incremental revenue across the forecast period.

What is the CAGR for the Radiology Information System (RIS) Market 2026 to 2036?

The base case compounds at 8.2% annually, with a bull case of 9.5% and a bear case of 6.8%. Whether AI triage genuinely reduces what radiologists must read decides which case materialises.

Which segment is growing fastest?

AI worklist orchestration and triage compounds at 12.3%, exactly 1.50 times the market rate. It cuts unreported study backlogs by roughly 34% in departments that cannot recruit enough radiologists.

Who are the major companies in the Radiology Information System (RIS) Market?

GE HealthCare, Siemens Healthineers, Philips, Sectra and Agfa HealthCare together licence 61% of reporting seats. Fifteen further participants including Epic Systems, Intelerad and Aidoc are profiled.

Which country is growing fastest?

India compounds at 10.9%, ahead of every other national market MMA tracks here. Private hospital networks and imaging chains building distributed reporting capability drive that growth.

Report Segmentation Architecture

The full report scope spans multiple orthogonal segmentation dimensions, with cross-tabulated demand data provided for each dimension pair. Coverage extends further to regional breakdowns, trend trajectories, and the competitive detail needed to support segment-level decision-making.

By Software Module Class

  • AI Worklist Orchestration and Triage
  • Structured Reporting and Voice Capture
  • Enterprise Imaging Workflow Platforms
  • Scheduling and Patient Access Modules
  • Standalone Departmental Radiology Information Systems
  • Radiology Billing and Coding Modules

By Care Setting

  • Multi-Site Health Systems
  • Single-Site Hospital Radiology Departments
  • Independent Diagnostic Imaging Chains
  • Academic and Teaching Centres
  • Teleradiology and Distributed Reporting Services

By Acquisition Model

  • Enterprise Platform Subscription
  • Electronic Record Module Inclusion
  • Standalone Overlay Deployment
  • Public Tender and Framework Procurement

By Region

  • North America
  • Western Europe
  • East Asia
  • South Asia and Pacific
  • Latin America
  • Middle East and Africa
  • Eastern Europe

Scope, Methodology, and Coverage

Every figure in this report is reproducible from documented input assumptions. The scope below maps the historical period, the forecast horizon, the segmentation dimensions, and the countries covered, alongside the underlying primary and qualitative methodology.
Historical Period
2020 to 2025
Forecast Period
2026 to 2036
Base Year
2025 (USD billions; MMA Primary Research Dataset, August 2026)
Market Definition
The market comprises software managing radiology department workflow, reporting and information handling, spanning AI worklist orchestration and triage, structured reporting and voice capture, enterprise imaging workflow platforms, scheduling and patient access modules, standalone departmental radiology information systems, and radiology billing and coding modules. Sizing captures licence, subscription, maintenance and implementation service revenue at realised price. Imaging modality hardware, picture archiving and communication storage infrastructure, general electronic health record platforms, diagnostic AI algorithms interpreting images, teleradiology service provision, and separately sold radiation dose management systems are outside scope.
Quantitative Units
USD billions (current prices); thousand reporting radiologist seats under licence; USD per seat annually at realised subscription value
Segmentation Dimensions
By Software Module Class; By Care Setting; By Acquisition Model; By Region
Regions Covered
North America, Western Europe, East Asia, South Asia and Pacific, Latin America, Middle East and Africa, Eastern Europe
Countries Covered
USA, Canada, Germany, Netherlands, Sweden, Denmark, Norway, UK, France, Italy, Spain, Switzerland, Austria, China, Japan, South Korea, Taiwan, India, Australia, Singapore, Thailand, Brazil, Mexico, Chile, Colombia, UAE, Saudi Arabia, Turkey, South Africa, Poland, Czech Republic, and additional markets relevant to this sector
Key Companies Profiled
GE HealthCare, Siemens Healthineers, Philips, Sectra, Agfa HealthCare, Epic Systems, Oracle Health, Fujifilm, Canon Medical Systems, Merative, Intelerad Medical Systems, Visage Imaging, RamSoft, Nuance Communications, Aidoc, Annalise.ai, Carestream Health, Konica Minolta, Dedalus, Neusoft Medical Systems.
Quantitative Methodology
Primary survey, n=3,800 respondents, Q4 2025, six countries; demand-side model with trade association cross-validation
Qualitative Methodology
47 expert interviews, Q4 2025; applied to validate demand model assumptions, identify emerging dynamics, and assess competitive positioning
Report Format
PDF and XLSX data workbook (Word format preview document)
Publisher
Market Minds Advisory
Report Code
MMA-2026-TEC-291
Published
August 2026
Contact
sales@marketmindsadvisory.com | www.marketmindsadvisory.com

Purchase the full Radiology Information System (RIS) Market Report (2026 to 2036).

The full report sizes the radiology information system market across six software module classes, five care settings, four acquisition models and seven regions, with annual forecasts to 2036 in revenue and licensed reporting seats. It reconstructs competitive decisions across a large sample of health systems, coding each by winning vendor and whether an electronic record alternative was available. That analysis is what separates spend genuinely lost to competitors from spend removed by record vendor absorption. Twenty participants are assessed on a consistent reporting seats basis, with worklist orchestration capability and certified integration library breadth mapped separately. Implementation duration is benchmarked vendor by vendor.
Six software module classes sized and forecast annually
Competitive decisions coded by winner and record availability
Twenty participants on consistent reporting seats basis
Worklist orchestration capability mapped vendor by vendor
Certified integration library breadth compared across participants
Implementation duration benchmarked vendor by vendor

Built For The People Who Decide

From boardroom strategy to bench-side execution, this report is read cover-to-cover by leaders shaping the next decade of their industry, turning demand scenarios, market dynamics and valuation benchmarks into decisions.
CXOs/ Presidents/ VPs/ Managers
M&A and Corporate Development
Strategy Teams and R&D Heads
Procurement and Product Directors
Regulatory and Compliance Leaders
Investor Relations and Equity Analysts